Willamette Riparian Cost Estimate - Benton County Oregon · DEQ produced this report as part of the...
52
Cost Estimate to Restore Riparian Forest Buffers and Improve Stream Habitat in the Willamette Basin, Oregon March 2010 Report Water Quality Division, Watershed Management Section Last Updated: 05/05/2010 By: Ryan Michie DEQ 10-WQ-007
Transcript of Willamette Riparian Cost Estimate - Benton County Oregon · DEQ produced this report as part of the...
Cost Estimate to Restore Riparian Forest Buffers and Improve Stream Habitat in the Willamette Basin, Oregon March 2010
Report
Water Quality Division, Watershed Management Section
Last Updated: 05/05/2010 By: Ryan Michie DEQ 10-WQ-007

2

3
This report prepared by:
Ryan Michie
Oregon Department of Environmental Quality Watershed Management Section
811 SW 6th Avenue Portland, OR 97204
1-800-452-4011
Contact: Ryan Michie (503) 229-6162
Acknowledgements: Without the participation, advice, comments, and encouragement from the following individuals this report would not be possible: James Allison, Doug Drake, Karen Fligger, Gene Foster, Peter
Guillozet, Lois Loop, Larry McAllister, Angela Parker, Toby Query, Michael Plastino, Matt Weber, and Gary Whitney.

4
Table of Contents 1 Executive Summary and Key Findings 6
2 Introduction 8
3 Scope and Conceptual Framework 8
3.1 Study Area .................................................................................................................................... 9
3.2 Designated Management Agencies ............................................................................................. 11
3.3 Riparian Areas and Stream Courses ............................................................................................ 13
4 Best Management Practices and Cost Data 16
4.1 Rural Riparian Forest Restoration Costs ..................................................................................... 16
4.2 Urban Riparian Forest Restoration Costs .................................................................................... 17
4.3 Instream Habitat Improvement and Fencing Costs ..................................................................... 19
4.4 BMP Application and Cost Summary ......................................................................................... 19
4.5 Other Studies and Cost Data ....................................................................................................... 21
5 TMDL Load Allocations and Solar Radiation Load 21
6 Uncertainty 24
7 Results 26
8 References 49 List of Figures Figure 1. Willamette Basin, Oregon with subbasins (right). ...................................................................................................... 9
Figure 2. Willamette Basin streams, cities, and major roads. .................................................................................................. 10
Figure 3. DMA boundaries in the Willamette Basin. ................................................................................................................. 12
Figure 4. Aerial photograph with buffer zones depicted in black. ........................................................................................... 13
Figure 5. NLCD canopy cover. Darker shade of green indicates increased percent canopy density. .................................. 14
Figure 6. NLCD impervious surface. Darker shade of red indicates increased percent impervious surface. ...................... 15
Figure 7. Effective shade defined. ............................................................................................................................................... 22
Figure 8. Example of an effective shade curve for upland forest (ODEQ 2006b). .................................................................. 22
Figure 9. Increase in effective shade after restoration of system potential vegetation. .......................................................... 30
Figure 10. Increase in effective shade after restoration of system potential vegetation (N. Willamette Basin). ................... 31
Figure 11. Increase in effective shade after restoration of system potential vegetation (S. Willamette Basin). ................... 32
5
List of Tables Table 1. Assumptions used to spatially define each DMA. ....................................................................................................... 11
Table 2. Willamette Basin CREP statistics for non-urban counties (Loop 2008) ................................................................... 17
Table 3. Clean Water Services Enhanced CREP program costs (modified from Clean Water Services 2005). ................... 18
Table 4. Average BMP type, cost, and percent acres applied within each DMA. ................................................................... 20
Table 5. Cattle and farm statistics in Willamette Basin counties (NASS 2002). ..................................................................... 20
Table 6. Site potential vegetation attributes used in the Heat Source model. ......................................................................... 23
Table 7. Upper and lower bound BMP costs. ............................................................................................................................ 25
Table 8. Upper and lower bound BMP application percentages. ............................................................................................. 25
Table 9. Upper and lower bound GIS derived data. ................................................................................................................. 25
Table 10. Variation in total restoration cost using lower bound GIS metrics. ........................................................................ 26
Table 11. Variation in total restoration cost using average GIS metrics. ................................................................................ 26
Table 12. Variation in total restoration cost using upper bound GIS metrics. ....................................................................... 26
Table 13. Acres of restoration for each DMA type. ................................................................................................................... 27
Table 14. Restoration cost estimates for each DMA type. ........................................................................................................ 27
Table 15. Restoration cost estimates for each DMA type using all lower bound values. ....................................................... 28
Table 16. Restoration cost estimates for each DMA type using all average values. ............................................................... 28
Table 17. Restoration cost estimates for each DMA type using all upper bound values. ....................................................... 28
Table 18. Solar radiation load metrics from full restoration. ................................................................................................... 29
Table 19. Total restoration cost estimates for each DMA. ........................................................................................................ 33
Table 20. Restoration cost estimates for each DMA using all lower bound values. ................................................................ 37
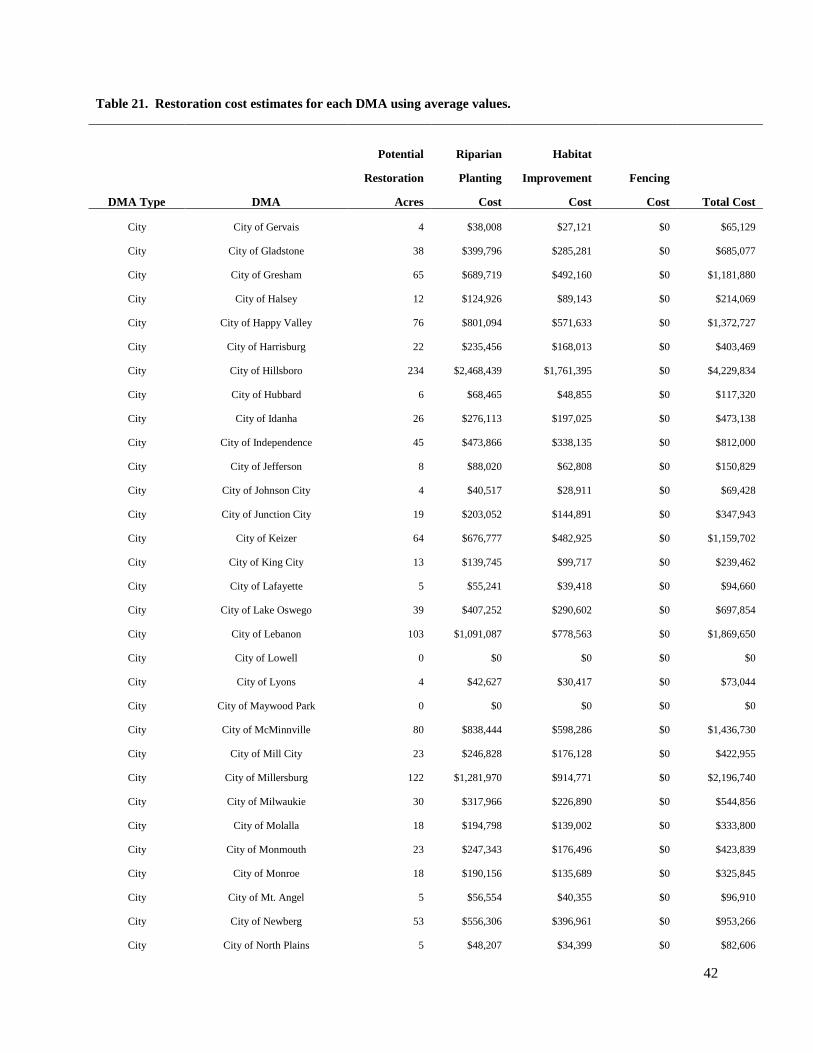
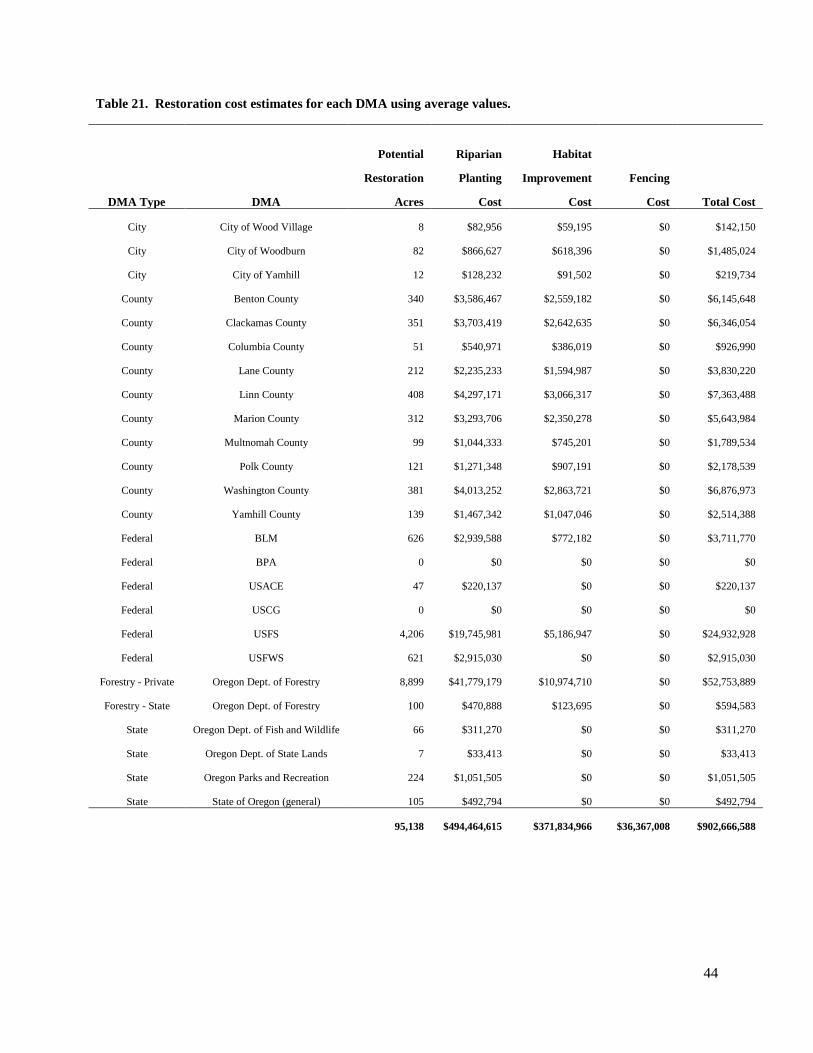
Table 21. Restoration cost estimates for each DMA using average values. ............................................................................. 41
Table 22. Restoration cost estimates for each DMA using all upper bound values. ............................................................... 45

6
1 Executive Summary and Key Findings
DEQ produced this report as part of the U.S. Environmental Protection Agency’s 2008 Clean
Watersheds Needs Survey. Every four years EPA conducts this survey – mandated by the federal Clean
Water Act through sections 205(a) and 516 – to collect data about capital needs and costs to meet the
act’s water quality goals. DEQ’s report concludes that it could cost from $593 million to $1.2 billion to
restore streamside vegetation and improve streamside habitat throughout the Willamette basin.
For the first time, this report includes estimated costs of restoring streamside vegetation and
habitat from pollution caused by “nonpoint” sources such as farming, forestry and urban activities.
Nonpoint activities that result in the loss of streamside vegetation contribute to sediment runoff into
streams, increased stream temperatures and a diminished aquatic habitat.
This report also estimates how much heat pollution is reduced by restoring streamside vegetation.
DEQ measured reduction in heat pollution in terms of reduction in kilocalories per day received by the
stream. (A kilocalorie is the amount of energy it takes to heat one kilogram of water by one degree
Celsius.)
Results from this report will help stream habitat restoration planning efforts by DEQ, cities,
counties, watershed groups and others interested in improving water quality in the Willamette Basin. The
report’s cost estimates also can add to current discussions about how – and how much – of this restoration
work could be funded.
In addition, this report helps supplement information from DEQ’s recently released Willamette
Basin Rivers and Streams Assessment Report, produced by DEQ’s Laboratory and Environmental
Assessment Division. That assessment showed that warm water temperature was the most extensive water
quality impairment in the Willamette Basin, with impaired stream bank conditions being another major
cause of water quality impairments in the basin’s streams and rivers.

7
Key findings of this report:
• The total cost of restoration work in the basin averages to about $900 million and ranges between
$593 million and $1.2 billion. These amounts include 15 years of annual rental payments to
landowners for use of lands for restoration purposes.
• About 96,000 acres may need to be restored in the Willamette basin. About 70 percent of those
acres are on agricultural lands.
• Annual land rents would average about $13 million (in 2008 dollars).
• About 75 percent of the initial total cost is related to restoration on agricultural lands.
• About 15 percent of the initial total cost is related to restoration inside urban growth boundaries.
• About 12.9 billion kilocalories per day of heat energy would be reduced on agricultural lands
once all the restored vegetation reached maturity.

8
2 Introduction
The Oregon Department of Environmental Quality has listed multiple streams in the Willamette Basin
as not meeting water quality standards for temperature, bacteria, and other pollutants (ODEQ 2006a).
ODEQ has completed three Total Maximum Daily Load (TMDL) analyses to address most of these water
quality impairments (The Tualatin Subbasin TMDL, The Willamette Basin TMDL, and the Molalla-
Pudding Subbasin TMDL). All three TMDLs cover the entire basin except in the Yamhill Subbasin. The
Yamhill Subbasin TMDL is currently under development. All approved TMDLs called for the restoration
of riparian vegetation as one of the management objectives to restore and protect streams from increases
in temperature, bacteria loading, and sediment movement. (ODEQ 2001, ODEQ 2006b, and ODEQ
2008). While, the Yamhill TMDL is not approved, this study will include riparian restoration needs for
that subbasin as well.
The responsibility to implement the TMDL management objective is delegated to Designated
Management Agencies (DMAs). A DMA is a federal, state, or local government agency that has legal
authority of a sector or source contributing pollutants. For ODEQ and each DMA, the cost to implement
restoration is of great importance when preparing implementation plans and establishing funding
priorities. It is also important to understand the pollution reductions that could be achieved from
restoration. This report summarizes the cost estimate for riparian restoration and instream improvement,
and estimates the reduction in solar energy associated with temperature conditions.
3 Scope and Conceptual Framework
The conceptual framework used here to estimate the cost of restoration relies on three central
components: the geographic scope of DMAs, the condition of riparian forests, and the cost of riparian
forest and instream habitat restoration. A restoration cost estimate can be generated for each DMA using
information on the geographic scope for each DMA, acres of riparian forest or instream habitat that
require improvement, and the average cost of restoration. There are many sources of error with this type
of analysis so a lower and upper bound have also been calculated to demonstrate the range in potential
costs due to uncertainty with the data and methodology. Uncertainty is discussed further in Section 6.
This section describes the assumptions and methodology used to determine the geographic scope for each
DMA and how many acres of riparian forest could be restored. The assumptions and methodology for
deriving an average cost for restoration (including habitat and fencing needs) is described in Section 4.
The assumptions and methodology used to calculate the solar energy reduction is described in Section 5.

9
3.1 Study Area
The Willamette Basin (shown in Figure 1 and Figure 2) is a third field hydrological unit
located in Oregon with an area of approximately 30,000 square kilometers. The basin is drained
by the Willamette River, the 13th largest river in the lower 48 states in terms of stream flow.
About two thirds of Oregon’s population lives in the Basin. All the subbasins in the Willamette
Basin were included in this study. The subbasins include: the Lower Willamette Subbasin
(Hydrologic Unit Code [HUC] 17090012), Tualatin Subbasin (HUC 17090010), Yamhill
Subbasin (HUC 17090008), Middle Willamette Subbasin (HUC 17090007), Molalla-Pudding
Subbasin (HUC 17090009), Clackamas Subbasin (HUC 17090011), North Santiam Subbasin
(HUC 17090005), South Santiam (HUC 17090006), Upper Willamette Subbasin (HUC
17090003), McKenzie Subbasin (HUC 17090004), Middle Fork Willamette Subbasin (HUC
17090001), and the Coast Fork Willamette Subbasin (HUC 17090002).
Figure 1. Willamette Basin, Oregon with subbasins (right).

10
Figure 2. Willamette Basin streams, cities, and major roads.

11
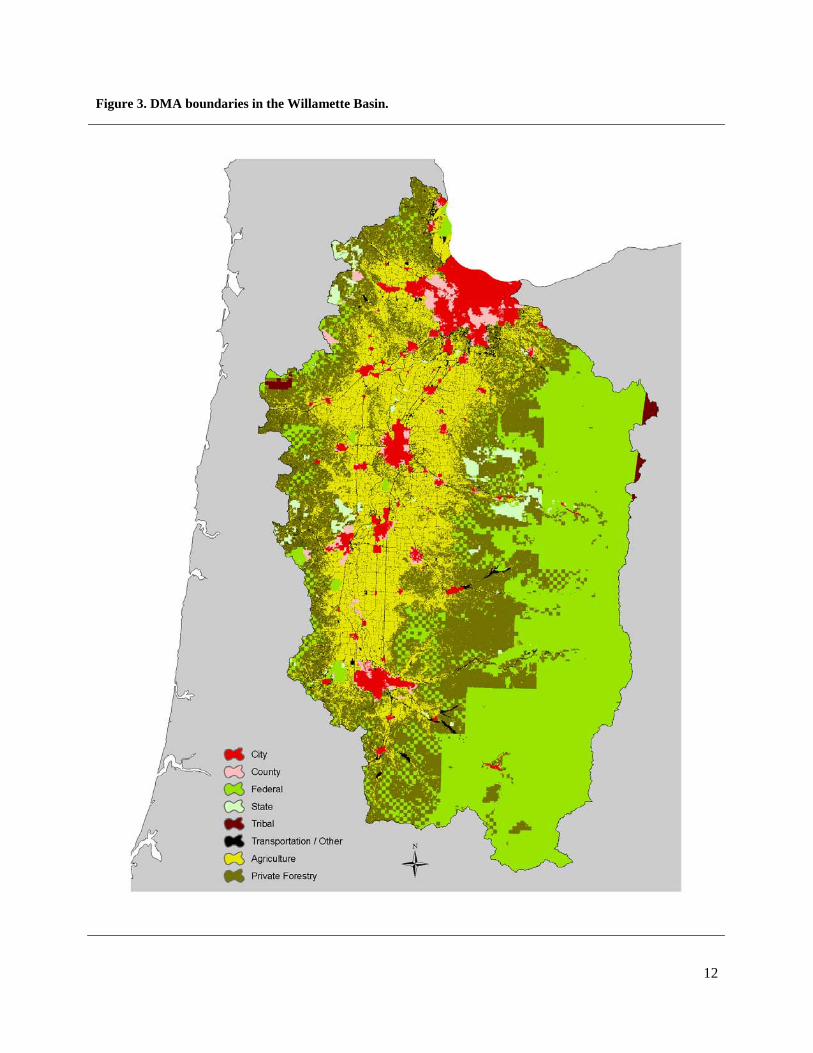
3.2 Designated Management Agencies
Each TMDL includes a water quality management plan that assigns responsibility for implementation
of the TMDL load allocations to DMAs. DMA boundaries were established using GIS data available for
each jurisdiction. Jurisdictional boundaries were obtained from the State of Oregon Geospatial Data
Clearinghouse.
The Oregon Department of Forestry (ODF) and the Oregon Department of Agriculture (ODA) are the
DMAs responsible for private forestry and agriculture activities respectively. Because these activities are
based on land use, the geographic scope was defined using typical forestry and agriculture land use
classifications contained in the 2001 National Land Cover Dataset (NLCD) (Homer et al 2004). The
assumptions used to define all of the DMA boundaries are described in Table 1. A map of DMA
boundaries is shown in Figure 3.
Table 1. Assumptions used to spatially define each DMA.
DMA Spatial Definition Assumptions
Cities All ownership classes within city boundaries as defined in 2007.
Counties All county government owned land and other unincorporated ownership classes inside an urban
growth boundary, but outside of city boundaries.
Federal Agencies All federal agency ownership outside of an urban growth boundary
State Agencies All state agency owned land outside an urban growth boundary. State parks inside an urban
growth boundary were also assigned to their respective state management agency.
Agriculture (ODA)
Private land outside an urban growth boundary that is in agricultural land uses or likely regulated
under agricultural water quality management plans. Agricultural land uses were defined as NLCD
version 2001 landcover codes #71 (Grassland/Herbaceous), #81 (Pasture/Hay), #82 (Cultivated
Crops), #90 (Woody Wetlands), and #95 (Emergent Herbaceous Wetland). Note: Woody Wetland
and Emergent Herbaceous Wetlands were included because they are the dominant riparian
vegetation types in agricultural land uses in the Willamette Valley.
Private Forestry (ODF)
Private land outside an urban growth boundary in forestry land uses. Forestry land uses were
defined as NLCD version 2001 landcover codes #31 (Barren Land), #41 (Deciduous Forest), #42
(Evergreen Forest), #43 (Mixed Forest), and #52 (Scrub/Shrub). Note: Barren Land and
Scrub/Shrub were included because these vegetation types typically represent areas of recent
harvest activity or new forest growth.
Transportation
Transportation infrastructure (highways, streets, forest roads) was not addressed in this study nor
assigned to a specific DMA because of the difficulty in evaluating the acreage within the right of
way available for restoration. There is more discussion about restoration around impervious
surfaces and buildings in section 2.3.
12
Figure 3. DMA boundaries in the Willamette Basin.

13
3.3 Riparian Areas and Stream Courses
Thirty meter buffers were delineated around stream polylines using USGS’s 1:100,000 resolution
medium National Hydrography Dataset (NHD). Sixty meter buffers were delineated around polygonal
NHD stream areas (see Figure 4). NHD stream areas represent streams wider than 50 feet. A wider
buffer was used on larger streams to ensure a NLCD vegetation cell, rather than a water cell, would be
captured inside the stream buffer zone. Areas inside the buffer zone classified by NHD as wetlands,
ponds, lakes, water, or other non vegetated features were removed from consideration.
Figure 4. Aerial photograph with buffer zones depicted in black.

14
This study assumes most restoration projects will occur at sites with little or no vegetation cover.
Using the 30 meter NLCD canopy cover data set shown in Figure 5 (Huang et al 2001, Homer et al
2004), the number of acres having twelve percent or less canopy cover inside the stream buffer was
quantified for each DMA. A canopy cover of twelve percent or less was used to set an upper and lower
bound on the range of acres available for restoration projects. See Section 6 for more information on
upper and lower bounds.
Figure 5. NLCD canopy cover. Darker shade of green indicates increased percent canopy density.
15
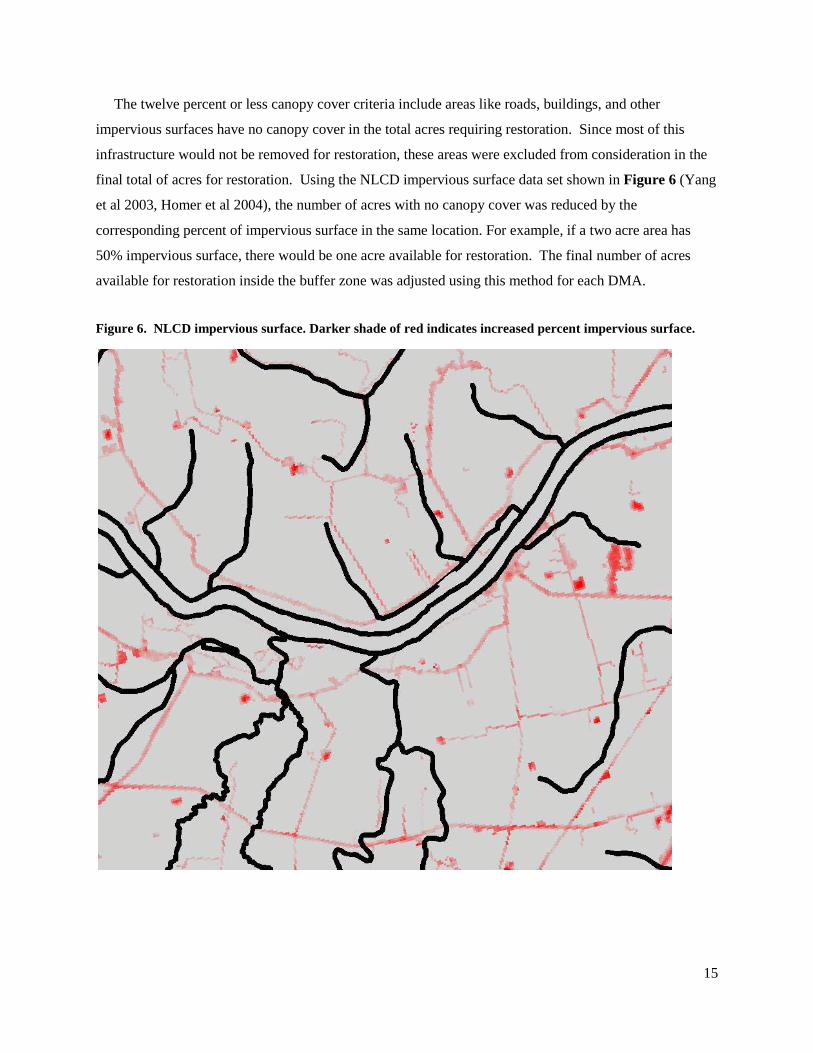
The twelve percent or less canopy cover criteria include areas like roads, buildings, and other
impervious surfaces have no canopy cover in the total acres requiring restoration. Since most of this
infrastructure would not be removed for restoration, these areas were excluded from consideration in the
final total of acres for restoration. Using the NLCD impervious surface data set shown in Figure 6 (Yang
et al 2003, Homer et al 2004), the number of acres with no canopy cover was reduced by the
corresponding percent of impervious surface in the same location. For example, if a two acre area has
50% impervious surface, there would be one acre available for restoration. The final number of acres
available for restoration inside the buffer zone was adjusted using this method for each DMA.
Figure 6. NLCD impervious surface. Darker shade of red indicates increased percent impervious surface.

16
4 Best Management Practices and Cost Data
Many studies have examined the relationship between vegetated riparian conditions and multiple types
of pollutant loading. Maintaining overstory riparian vegetation plays an important role in regulating
water temperatures. Increased solar radiation is the largest source of stream temperature warming
(Beschta 1997; Johnson and Jones 2000, Johnson 2004, ODEQ 2001, ODEQ 2006b, ODEQ 2008, and
Poole and Berman 2001). For temperature, the approved TMDLs in the Willamette Basin require the
restoration of riparian vegetation to meet the load allocations. Vegetated riparian buffers can also reduce
bacteria concentrations (Coyne 1998; Dosskey 2002; Entry et al 2000; Sullivan et al 2007). Similarly,
vegetated riparian buffers are effective at reducing nutrient and sediment loads in streams (Butler et al
2006; McKergo et al 2003; Muenz et al 2006; Parkyn et al 2005; Schoonover et al 2005).
The cost to install riparian buffers varies widely and can depend on a number of site specific
conditions (number of plants, cost of materials, etc). Cost estimates for this study were derived using the
average cost per acre compiled from multiple restoration projects in the Willamette Basin. The cost for
each of these projects includes the cost of site preparation, plantings, materials, labor, project
maintenance, and land rent over the contracted period (typically 15 years). This study assumes a rental
agreement model (vs. fee simple purchase) because of availability of cost data and it appears to be the
primary method utilized by agencies attempting to install BMPS on private land. This study primarily
examines costs in the first contract period, although it is expected there will be ongoing rental fees beyond
the initial contract.
Costs for riparian forest restoration are presented separately for urban and rural projects because
municipalities managing their own programs reported higher restoration costs than federal programs
implementing restoration primarily in rural areas. In addition, fencing and instream habitat improvement
are additional best management practices (BMPs) often needed to successfully establish and protect
riparian forest buffers. The costs to add fencing and improve instream habitat are described in Section
4.3. Uncertainty and an explanation of upper and lower bounds for cost estimates and BMP application
can be found in Section 6.
4.1 Rural Riparian Forest Restoration Costs
Rural riparian forest restoration refers to restoration projects outside of urban growth boundaries. Cost
estimates for these areas were based on restoration data from The Conservation Reserve Enhancement
Program (CREP) and data from the National Resource Conservation Service (NRCS)
17
CREP is a voluntary land retirement program that helps agricultural producers protect environmentally
sensitive land. CREP is administered by the USDA Farm Service Agency and combines resources from
federal, state, tribal, and private sources to pay for protection measures. The Farm Service provided
preliminary aggregated data (Loop 2008) from riparian restoration projects in rural Willamette Basin
counties. An average cost for rural riparian forest establishment came to $4,695 per acre during the first
contract period (with an average contract period of 15 years). Incentives and annual rental fees for
subsequent contracts would average about $128 per acre plus inflation. This aggregate data compiles
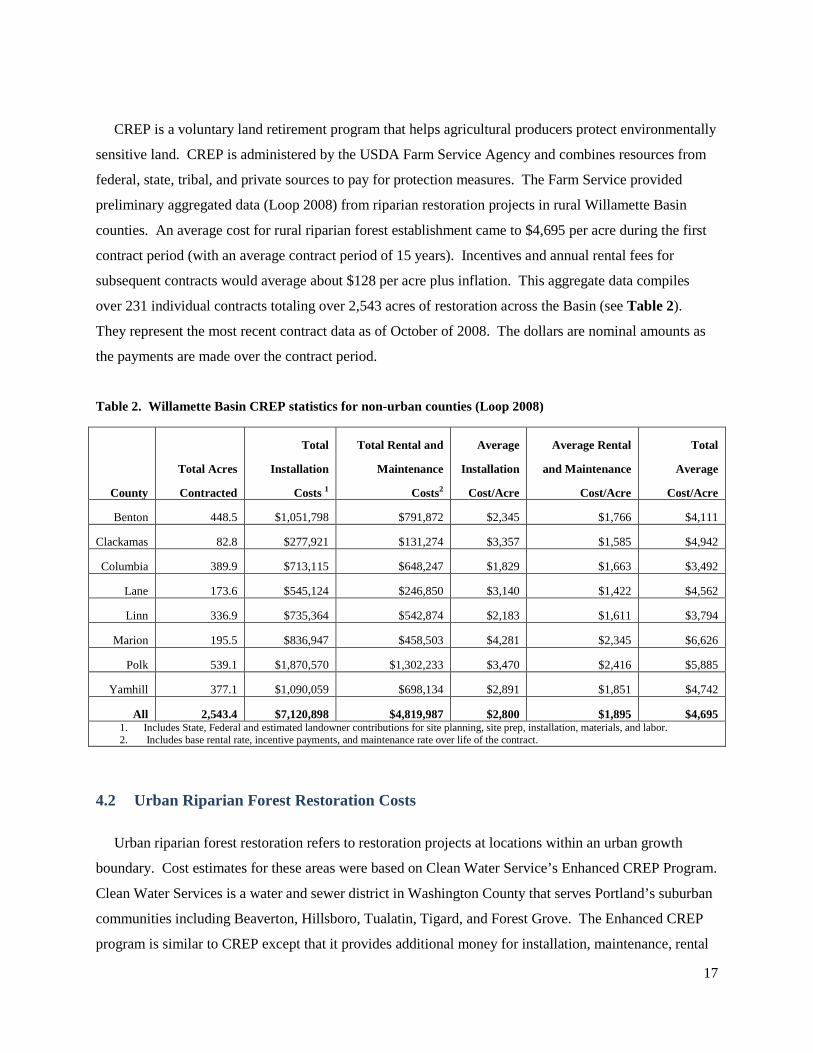
over 231 individual contracts totaling over 2,543 acres of restoration across the Basin (see Table 2).
They represent the most recent contract data as of October of 2008. The dollars are nominal amounts as
the payments are made over the contract period.
Table 2. Willamette Basin CREP statistics for non-urban counties (Loop 2008)
County
Total Acres
Contracted
Total
Installation
Costs 1
Total Rental and
Maintenance
Costs2
Average
Installation
Cost/Acre
Average Rental
and Maintenance
Cost/Acre
Total
Average
Cost/Acre
Benton 448.5 $1,051,798 $791,872 $2,345 $1,766 $4,111
Clackamas 82.8 $277,921 $131,274 $3,357 $1,585 $4,942
Columbia 389.9 $713,115 $648,247 $1,829 $1,663 $3,492
Lane 173.6 $545,124 $246,850 $3,140 $1,422 $4,562
Linn 336.9 $735,364 $542,874 $2,183 $1,611 $3,794
Marion 195.5 $836,947 $458,503 $4,281 $2,345 $6,626
Polk 539.1 $1,870,570 $1,302,233 $3,470 $2,416 $5,885
Yamhill 377.1 $1,090,059 $698,134 $2,891 $1,851 $4,742
All 2,543.4 $7,120,898 $4,819,987 $2,800 $1,895 $4,695 1. Includes State, Federal and estimated landowner contributions for site planning, site prep, installation, materials, and labor. 2. Includes base rental rate, incentive payments, and maintenance rate over life of the contract.
4.2 Urban Riparian Forest Restoration Costs
Urban riparian forest restoration refers to restoration projects at locations within an urban growth
boundary. Cost estimates for these areas were based on Clean Water Service’s Enhanced CREP Program.
Clean Water Services is a water and sewer district in Washington County that serves Portland’s suburban
communities including Beaverton, Hillsboro, Tualatin, Tigard, and Forest Grove. The Enhanced CREP
program is similar to CREP except that it provides additional money for installation, maintenance, rental

18
payments and incentive options to landowners. The enhancements were devised to increase participation
in the program and were guided by input from local stakeholders (Clean Water Services 2005). Prior to
implementing Enhanced CREP Clean Water Services performed a cost analysis and estimated the
program would require $10,543 per acre during the first contract period (15 years) with incentive an
annual rental fees of about $240 plus inflation for subsequent contracts (see Table 3) (Clean Water
Services 2005). EPA advised ODEQ to use this estimate since it has received agency review, however,
informal analysis and input from the program manager reveal average costs are actually greater (discussed
below).
As of 2007 Clean Water Services has completed 55 riparian restoration projects totaling about 460
acres on both public and private land (Clean Water Services 2007). An informal analysis of this project
data by Clean Water Services suggests the total average cost is $14,247 per acre (Clean Water Services
2007). The City of Portland also administers a watershed revegetation program. Since 1996, this
program has revegetated more than 600 acres along 106 miles of stream (personal communication, Query,
2008). A specific cost analysis of Portland’s program was not available but, the project manager
indicated that average site preparation, plantings, maintenance and program costs run about $10,000-
$15,000 per acre (personal communication, Allison, 2008). This is in line with values reported by Clean
Water Services.
Table 3. Clean Water Services Enhanced CREP program costs (modified from Clean Water Services 2005).
Cost (Over 15 year Contract) Average Installation
Cost/Acre
Recurring Payments
Cost/Acre
Total Cost/Acre
Labor $2,436 $2,436
Payments (CREP, Rental, etc) $2,139 $2,139
Sign up Incentive Payment $137 $137
Installation Cost $2,780 $2,780
Installation Maintenance Cost $964 $964
Conservation Easements $692 $692
Easement Stewardship $72 $72
Cumulative Impact Bonus $92 $92
Practice Incentive Payment $912 $912
Water Rights Incentive $319 $319
Total (15 year contract) $6,944 $3,599 $10,543
19
4.3 Instream Habitat Improvement and Fencing Costs
When stream channels are heavily incised, lack large woody debris, or have unstable banks, additional
instream improvement is often important for restoration success. Instream habitat work may include the
placement of large woody debris and bed or bank material. Fencing is often required in agricultural land
uses to protect the riparian plantings from forage or trampling by livestock.
The National Resource Conservation Service (NRCS) has developed cost estimates for instream
habitat improvement and the installation of fencing. To improve instream habitat (NRCS practice 395), it
will cost on average about $12,333 per acre in the Willamette Basin. To install about 635 feet of fencing
(NRCS practice 382), it will cost about $6,307 per acre. 635 feet of fencing is enough to surround one
acre of 100 foot riparian buffer. NRCS estimates are based on cost data from 2008.
4.4 BMP Application and Cost Summary
Table 4 describes how each BMP type was applied within each DMA class. Percent acres restoration
refers to the percentage of the total acres being restored within each DMA class that would receive a
particular BMP type. Since area with with no vegetation were considered in this analyses, 100% of the
restoration acres require planting of riparian vegetation. Eight percent of restoration acres within county
DMAs and private agricultural require fence installations. This fencing estimate is based on the percent
of farms in the Willamette valley (see Table 5) that reported having cattle in the 2002 Census of
Agriculture (NASS 2002).
Using the census data to estimate fencing needs assumes that farms needing riparian restoration would
also be equally distributed among the general population of cattle farms in the valley. Because cattle are
a known source of riparian degradation (Agouridis et al 2005, Kaufman et al 1983), and they sometimes
use streams as a drinking water source, cattle may occur at a larger share of disturbed riparian sites than
expected based on the normal distribution of cattle farms. It is very possible using the census figure
might underestimate the actual need for fencing at restoration sites.
The Willamette Basin Rivers & Streams Assessment (ODEQ 2009) provided the basis for the percent
of instream improvement needs by landuse. The assessment rated 246 sites in the Willamette Basin for
streambed stability utilizing a probabilistic survey method. Streambed stability, also termed relative bed
stability, is a good surrogate for instream improvement needs because wood volume, substrate type, and
channel shape are factored into the final metric (Kaufman et al 1999). The assessment found that 61% of

20
stream miles in urban areas, 33% in agricultural areas, and 10% in forestry areas have “poor” streambed
stability (as compared to “fair” or “good” streambed stability). We used these percentages to estimate the
number of restoration acres that need habitat improvements. These ratings concur with a number of other
studies that show stream habitat for urban and agriculture lands are highly degraded compared to forestry
lands (Ebert et al 2000, Waite and Carpenter 2000, Wentz et al 1998). ODF, BLM, and USFS were the
only State and Federal agencies assigned the 10% forestry stream improvement value because these
agencies are primarily managing forests in the Willamette Basin.
Table 4. Average BMP type, cost, and percent acres applied within each DMA.
DMA Type BMP Types Applied
Average
Cost/Acre
Average Percent
Restoration Acres
Agriculture
Rural Riparian Planting
Instream Improvement
Fencing
$4,695
$12,333
$6,308
100%
33%
8%
City Urban Riparian Planting
Instream Improvement
$10,543
$12,333
100%
61%
County Urban Riparian Planting
Instream Improvement
$10,543
$12,333
100%
61%
State Rural Riparian Planting
Instream Improvement (ODF only)
$4,695
$12,333
100%
10%
Federal Rural Riparian Planting
Instream Improvement (BLM and USFS only)
$4,695
$12,333
100%
10%
Private Forestry Rural Riparian Planting
Instream Improvement
$4,695
$12,333
100%
10%
Table 5. Cattle and farm statistics in Willamette Basin counties (NASS 2002).
All
Cou
ntie
s
Ben
ton
Cla
ckam
as
Col
umbi
a
Lan
e
Lin
n
Mar
ion
Mul
tnom
ah
Was
hing
ton
Yam
hill
Cattle Farm Acres 155,015 6,200 25,040 9,505 22,150 26,875 24,600 2,520 11,090 16,265
Total Farm Acres 1,899,449 130,203 215,210 62,398 234,807 385,589 341,051 34,329 130,683 196,298
Percent Farm Acres with Cattle 8% 5% 12% 15% 9% 7% 7% 7% 8% 8%

21
4.5 Other Studies and Cost Data A literature review of other efforts to estimate restoration costs for Oregon streams are as follows. A
study by Seedang et al (2008) determined the cost effectiveness of reducing stream temperatures in the
upper mainstem Willamette River by restoring riparian vegetation and hyporheic flow. The total cost for
restoring riparian shading came to 2.68 million dollars with an average cost of $3,000 per acre. The total
cost for restoring hyporheic flow came to 4.28 million dollars with an average cost of $2,547 per acre. A
study in the Tualatin Basin by Knoder (1995) estimated it would cost $118,400 to restore riparian and
instream habitat on Gales Creek ($6,000 per mile) and $542,750 to restore Dairy Creek ($21,000 per
mile). A restoration project along 300 meters of Beaver Creek in the Coast Range was documented by
Bishaw et al (2002) to cost $4346.29.
5 TMDL Load Allocations and Solar Radiation Load Solar radiation modeling was completed to estimate the pollution load reduction resulting from
restoration. Solar radiation is the largest flux in a stream’s heat budget and therefore is the largest source
of temperature increases (Brown 1969, DEQ 2001, DEQ 2006b, DEQ 2008, Johnson 2004). The amount
of solar radiation received at the stream surface is measured in kilocalories per day. One kilocalorie is the
amount of energy required to heat up one gram of water by one degree Celsius. The temperature load
allocations in the Willamette Basin TMDLs are generally expressed as the amount of solar radiation that a
stream receives when system potential vegetation is present. System potential vegetation refers to the
vegetation which can grow and reproduce on a site given the natural plant biology, site elevation, soil
characteristics, climate, and nature disturbance regime. Because the amount of solar radiation blocked by
vegetation was not modeled at every location in the TMDLs, effective shade curves were used as the basis
for the load allocations. Effective shade curves are defined as the amount of total daily solar radiation
load divided by the amount of solar radiation load blocked by vegetation with a certain height and
density, and the stream is of a certain width and aspect. The effective shade concept is illustrated in
Figure 7 and Figure 8.

22
Figure 7. Effective shade defined.
Figure 8. Example of an effective shade curve for upland forest (ODEQ 2006b).
The modeling for this study uses the system potential vegetation described in the Willamette Basin
TMDL (DEQ 2006b). Effective shade and solar radiation load were modeled with the mathematical
model Heat Source version 8.0.4. Heat Source simulates open channel hydraulics, flow routing, heat
transfer, effective shade, and stream temperatures (Boyd and Kasper, 2003). The model predicted
effective shade and the total solar radiation load blocked by riparian restoration at locations where there is
opportunity for restoration. Effective shade and solar load results are reported in Section 7. Modeling
Solar2
( )1
21
SolarSolarSolar
ShadeEffective−
=
Where,Solar1: Potential Daily Direct Beam Solar Radiation LoadSolar2: Daily Direct Beam Solar Radiation Load Received at
the Stream Surface
Solar1 – Potential daily direct beam solar radiation load adjusted forjulian day, solar altitude, solar azimuth and site elevation.

23
nearly all of streams in the basin took significant computing resources and time. To make the task
manageable with the resources available, a few assumptions were made in the absence of collecting basin
wide data. Those assumptions are listed below.
Stream Width Stream width was not known at every location so it was estimated using the stream’s Strahler
order (SO). Stream width was estimated for each Strahler order from randomly selecting different streams and measuring the width from an aerial photo in GIS. There was limited field data available for validation. (SO = 1, width = 1m), (SO = 2, width = 3 m), (SO = 3, width = 10 m), (SO = 4, width = 25 m), (SO = 5, width = 60 m), (SO = 6, width = 120 m), (SO = 7, width = 180 m), (SO = Unknown, width = 25 m)
Vegetation Site potential vegetation types, shown in Table 5, was extracted from page C-33 in the Willamette Basin TMDL Appendix C. The system potential vegetation codes were cross walked to the appropriate NLCD landcover code and applied basinwide. Not all TMDL system potential vegetation types were used. The designation of areas with no vegetation corresponds to the lower bound GIS data set. The system potential vegetation density was adjusted for developed areas based on the intensity of the development.
Model Period The solar radiation loads represent the solar radiation load received on August 1st.
Topography Topographic shade was not factored into the load reductions.
Table 6. Site potential vegetation attributes used in the Heat Source model.
2001 NLCD Land Cover Type NLCD Code TMDL Site Potential Vegetation
Height (m)
Density (0 - 1)
Overhang (m)
Unknown N/A No Change 0.0 0.00 0.0
Open water 11 No Change 0.0 0.00 0.0
Perennial Ice/Snow 12 No Change 0.0 0.00 0.0
Developed, Open Space (<20%) 21 Forest –Mature Hardwood 20.4 0.75 3.1
Developed, Low Intensity (20%-49%) 22 Forest –Mature Hardwood (Adjusted) 20.4 0.55 3.1 Developed, Medium Intensity (50%-79%) 23 Forest –Mature Hardwood (Adjusted) 20.4 0.40 3.1 Developed, High Intensity (80%-100%) 24 Forest –Mature Hardwood (Adjusted) 20.4 0.10 3.1
Barren Land 31 Forest –Mature Hardwood 20.4 0.75 3.1
Deciduous Forest 41 Forest –Mature Hardwood 20.4 0.75 3.1
Evergreen Forest 42 Forest –Mature Coniferous 48.8 0.75 4.9
Mixed Forest 43 Forest –Mature Mixed Conifer-
Hardwood 27.4 0.75 3.3
Scrub/Shrub 52 Prairie- Grassland 1.0 0.75 0.0
Grassland/Herbaceous 71 Prairie- Grassland 1.0 0.75 0.0
Pasture/Hay 81 Forest –Mature Hardwood 20.4 0.75 3.1
Cultivated Crops 82 Forest –Mature Hardwood 20.4 0.75 3.1
Woody Wetlands 90 Forest –Mature Hardwood 20.4 0.75 3.1
Emergent Herbaceous Wetland 95 Prairie- Grassland 1.0 0.75 0.0

24
6 Uncertainty
A ground survey of specific site needs as well as riparian and instream conditions throughout the
basin would provide the most precise cost estimate. However, such a comprehensive survey would
require a sizeable on-the-ground data collection effort over an extended period of time. Such an effort was
infeasible given this project’s schedule and resources. Thus, to participate in the EPA’s Clean
Watersheds Needs Survey, ODEQ implemented a GIS and statistical -based analysis that provides
information for the entire basin and meets the EPA’s data needs. Since any GIS and statistical-based
approach contains a level of uncertainty, we report a lower and upper bound for the final cost estimate to
account for the potential variability and uncertainly. These bounds should be viewed as the range in
which the final costs should fall between.
Table 7 and Table 8 show the values used for the lower and upper bounds and the methods for
deriving those bounds. Most of the bounds were calculated as the upper and lower 95% confidence
interval. This metric calculates the bounds that contain 95% of the distribution of observed values.
Because the federal government prohibits the release of raw data used for CREP or NASS, data are only
available as an average value aggregated by county only. So while the average values were derived with
a large set of raw data, the standard deviation and 95% confidence interval are derived from the
aggregated data. This tends to generate large standard deviations because of the small number of
observations (n). When it was not possible to calculate the 95% confidence interval, a 15% margin of
safety was used instead. This value is based on best professional judgment and field experience of
restoration experts.
In addition, we believe it is unlikely that every landowner would be willing to accept rental and
incentive payments at prices described in this study (if at all). Anecdotal evidence suggests that CREP
payments may already be too low to encourage restoration efforts on agricultural lands. Payments likely
need to be higher to encourage participation. Also, reliance on land rental agreements is not going to
garner participation from every landowner. Other methods and programs will need to be considered to
facilitate restoration efforts.

25
Table 7. Upper and lower bound BMP costs.
BMP Type Average Cost/Acre Lower Bound Upper Bound Notes
Urban Riparian Planting $10,543 $8,962 $12,124 +/- 15% Margin of Safety
Rural Riparian Planting $4,695 $3,964 $5,426 95% Confidence Interval, n = 8,
Table 2
Instream Improvement $12,333 $10,483 $14,183 +/- 15% Margin of Safety
Fencing $6,308 $5,362 $7,254 +/- 15% Margin of Safety
Table 8. Upper and lower bound BMP application percentages.
BMP Type Average
Lower
Bound
Upper
Bound Notes
Riparian Planting 100% 85% 100% - 15%
Instream Improvement - Agricultural 33% 23% 43% 95% Confidence Interval, n = 16
(ODEQ 2009)
Instream Improvement – Forestry
(ODF, Private Forest, BLM, USFS) 10% 5% 15%
95% Confidence Interval, n = 9
(ODEQ 2009)
Instream Improvement Urban
(Cities, Counties inside UGB) 61% 47% 75%
95% Confidence Interval, n = 43
(ODEQ 2009)
Fencing -Agricultural 8% 6% 10% 95% Confidence Interval, n =9
Table 4
Table 9 shows the average, upper and lower bounds for GIS derived values. The average value
represents the total number of acres inside the stream buffer with zero percent canopy cover. The upper
bound represents the area with twelve percent or less canopy cover. The mean absolute difference (MAE)
found when correlating field measured Oregon tree canopy densities to the NLCD canopy cover dataset
was about twelve percent (Huang et al 2001). In simpler terms, this means areas measured in the field
with no vegetation (zero percent canopy cover) would on average have a potential error of plus or minus
12% canopy cover in the NLCD data. It is not possible to assume a NLCD canopy cover of -12% so the
lower bound was calculated as the difference in the number of acres from zero to + 12% canopy cover.
The difference was then subtracted from the average for each DMA to find the lower bound.
Table 9. Upper and lower bound GIS derived data.
GIS Data Type Average
Lower
Bound
Upper
Bound Notes
No Vegetation (excluding impervious) 95,138 acres 93,985 acres 96,291 acres +/- acres based on 12% Oregon
MAE (Huang et al 2001) Impervious Area Removed 3,159 acres 3,154 acres 3,164 acres

26
7 Results
According to this analysis, approximately 96,000 acres could be restored in the Willamette Basin. The
total restoration cost estimate during the first 15-year contract period is on average around 900 million
dollars with a range between 600 million to about 1.2 billion dollars. Subsequent contracts would have
average annual rental fees of about 13 million dollars in 2008 dollars. Table 10 through Table 12 shows
the range in restoration cost based on the average, upper, and lower bound values. BMPs percentage
(Table 7) and BMP cost (Table 8) account for the most variation in the results while the GIS metrics
(Table 9) contribute the least variation. Approximately 18.6 billion kilocalories per day of solar radiation
would be blocked in late July through early August once the vegetation reached maturity. Figure 9
through Figure 11 shows the increase in effective shade that would result from the restoration. The
majority of the large effective shade increases from restoration occur in agricultural land uses. Additional
metrics are broken-down by DMA in Table 13 through Table 22.
Table 10. Variation in total restoration cost using lower bound GIS metrics.
Costs at Lower Bound Costs at Average Costs at Upper Bound
BMPs at Lower Bound $593,948,408 $701,055,855 $808,163,302
BMPs at Average $757,534,352 $893,914,709 $1,030,295,066
BMPs at Upper Bound $859,137,175 $1,013,447,631 $1,167,758,088
Table 11. Variation in total restoration cost using average GIS metrics.
Costs at Lower Bound Costs at Average Costs at Upper Bound
BMPs at Lower Bound $599,730,493 $707,888,178 $816,045,862
BMPs at Average $764,943,567 $902,666,575 $1,040,389,583
BMPs at Upper Bound $867,460,804 $1,023,275,282 $1,179,089,759
Table 12. Variation in total restoration cost using upper bound GIS metrics.
Costs at Lower Bound Costs at Average Costs at Upper Bound
BMPs at Lower Bound $605,512,578 $714,720,500 $823,928,422
BMPs at Average $772,352,782 $911,418,441 $1,050,484,100
BMPs at Upper Bound $875,784,433 $1,033,102,932 $1,190,421,431

27
Table 13. Acres of restoration for each DMA type.
DMA Type
Total
Riparian
Acres
Average
Upper/Lower Bound
(Deviation from Average)
Potential
Restoration
Acres
Percent of
Riparian
Available for
Restoration
Potential
Restoration
Acres
Percent of
Riparian
Available for
Restoration
Agricultural 105,439 72,065 68% +/- 446 +/-0.4%
City 15,795 5,758 36% +/- 24 +/-0.2%
County 6,507 2,414 37% +/- 12 +/-0.2%
Federal 103,906 5,500 5% +/- 361 +/-0.3%
Private Forestry 87,316 8,899 10% +/- 301 +/-0.3%
State 5,328 503 9% +/- 8 +/-0.2%
All 324,290 95,138 29% +/- 1,153 +/-0.4% Table 14. Restoration cost estimates for each DMA type.
DMA Type
Lower Bound
Total Costs
Average Total
Costs
Upper Bound
Total Costs
Agriculture $437,032,814 $668,010,994 $888,275,131
City $71,928,727 $104,022,436 $131,604,438
County $30,135,568 $43,615,827 $55,223,590
Federal $19,658,874 $31,779,865 $42,838,166
Private Forest $33,475,402 $52,753,889 $69,489,110
State $1,717,023 $2,483,564 $2,990,995
All $593,948,408 $902,666,575 $1,190,421,431

28
Table 15. Restoration cost estimates for each DMA type using all lower bound values.
DMA Type
Riparian
Planting Cost
Habitat
Improvement
Cost
Fencing
Cost Total Cost
Percent of
Total Cost
Agriculture $241,312,305 $172,679,316 $23,041,193 $437,032,814 73.6%
City $43,678,289 $28,250,439 $0 $71,928,727 12.1%
County $18,299,643 $11,835,925 $0 $30,135,568 5.1%
Federal $17,312,664 $2,346,210 $0 $19,658,874 3.3%
Private Forest $28,968,941 $4,506,461 $0 $33,475,402 5.6%
State $1,665,852 $51,171 $0 $1,717,023 0.3%
All $351,237,693 $219,669,522 $23,041,193 $593,948,408 100%
Table 16. Restoration cost estimates for each DMA type using all average values.
DMA Type
Riparian
Planting Cost
Habitat
Improvement
Cost
Fencing
Cost Total Cost
Percent of
Total Cost
Agriculture $338,346,347 $293,297,639 $36,367,008 $668,010,994 74.0%
City $60,705,228 $43,317,208 $0 $104,022,436 11.5%
County $25,453,247 $18,162,580 $0 $43,615,827 4.8%
Federal $25,820,736 $5,959,129 $0 $31,779,865 3.5%
Private Forest $41,779,179 $10,974,710 $0 $52,753,889 5.8%
State $2,359,869 $123,695 $0 $2,483,564 0.3%
All $494,464,607 $371,834,961 $36,367,008 $902,666,575 100%
Table 17. Restoration cost estimates for each DMA type using all upper bound values.
DMA Type
Riparian
Planting Cost
Habitat
Improvement
Cost
Fencing
Cost Total Cost
Percent of
Total Cost
Agriculture $393,448,608 $442,226,519 $52,600,004 $888,275,131 74.6%
City $70,100,377 $61,504,061 $0 $131,604,438 11.1%
County $29,415,379 $25,808,211 $0 $55,223,590 4.6%
Federal $31,802,029 $11,036,137 $0 $42,838,166 3.6%
Private Forest $49,917,311 $19,571,799 $0 $69,489,110 5.8%
State $2,771,944 $219,052 $0 $2,990,995 0.3%
All $577,455,648 $560,365,779 $52,600,004 $1,190,421,431 100%

29
Table 18. Solar radiation load metrics from full restoration.
DMA Type
Current Solar
Radiation Load
(Gigacalories/day)
Solar Radiation Load
after Restoration
(Gigacalories/day)
Decrease in Solar Radiation
Load after Restoration
(Gigacalories/day)
Portion of Total
Solar Load
Reduction
Agriculture 20.18 7.23 12.94 70%
City 9.44 7.19 2.25 12%
County 3.41 2.48 0.93 5%
Federal 2.09 1.79 0.30 2%
Private Forest 4.05 1.95 2.09 11%
State 0.74 0.63 0.11 1%
All 39.90 21.28 18.62 100% Percents may not calculate as presented due to rounding.
Restoration along Johnson Creek in Portland. Photo by Ryan Michie.

30
Figure 9. Increase in effective shade after restoration of system potential vegetation.

31
Figure 10. Increase in effective shade after restoration of system potential vegetation (N. Willamette Basin).

32
Figure 11. Increase in effective shade after restoration of system potential vegetation (S. Willamette Basin).

33
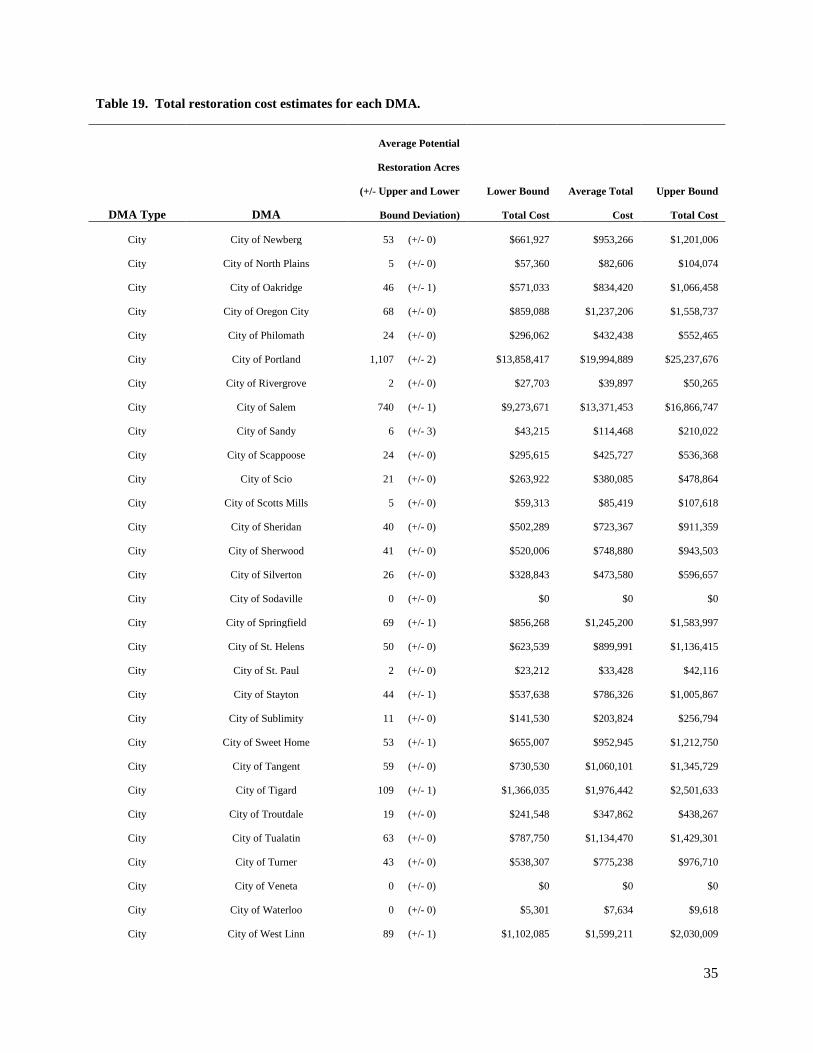
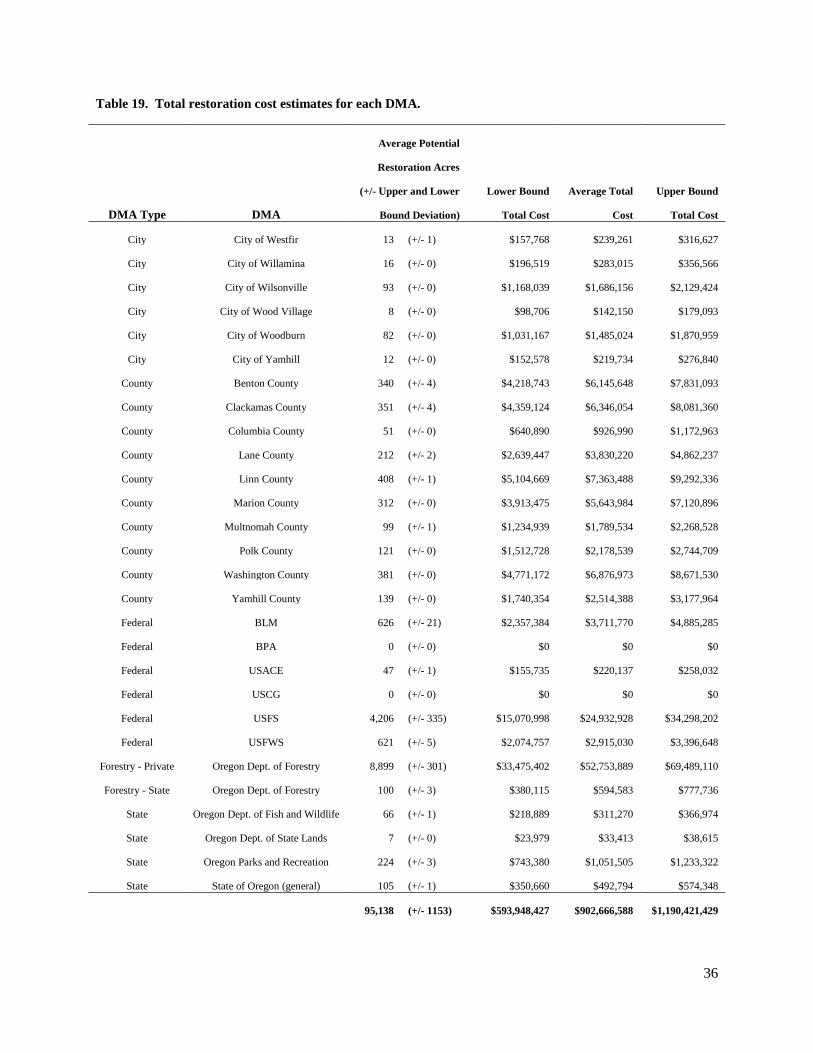
Table 19. Total restoration cost estimates for each DMA.
DMA Type DMA
Average Potential
Restoration Acres
(+/- Upper and Lower
Bound Deviation)
Lower Bound
Total Cost
Average Total
Cost
Upper Bound
Total Cost
Agriculture Oregon Dept. of Agriculture 72,065 (+/- 446) $437,032,814 $668,010,994 $888,275,131
City City of Adair Village 0 (+/- 0) $0 $0 $0
City City of Albany 219 (+/- 3) $2,703,587 $3,953,809 $5,057,274
City City of Amity 4 (+/- 0) $45,196 $65,089 $82,004
City City of Aumsville 31 (+/- 0) $382,799 $551,284 $694,555
City City of Aurora 5 (+/- 0) $65,255 $93,977 $118,400
City City of Banks 10 (+/- 0) $127,330 $183,373 $231,029
City City of Barlow 0 (+/- 0) $0 $0 $0
City City of Beaverton 130 (+/- 0) $1,625,159 $2,340,455 $2,948,705
City City of Brownsville 47 (+/- 0) $584,842 $842,254 $1,061,144
City City of Canby 22 (+/- 0) $275,445 $396,679 $499,770
City City of Carlton 24 (+/- 0) $298,601 $430,027 $541,784
City City of Coburg 6 (+/- 0) $79,205 $114,066 $143,710
City City of Cornelius 5 (+/- 0) $64,251 $92,530 $116,577
City City of Corvallis 165 (+/- 2) $2,036,894 $2,976,841 $3,805,194
City City of Cottage Grove 44 (+/- 1) $540,232 $791,228 $1,013,510
City City of Creswell 25 (+/- 0) $316,010 $455,098 $573,371
City City of Dallas 81 (+/- 0) $1,011,218 $1,463,970 $1,854,105
City City of Damascus 198 (+/- 1) $2,472,195 $3,571,435 $4,513,620
City City of Dayton 4 (+/- 0) $55,574 $80,035 $100,835
City City of Detroit 0 (+/- 0) $0 $0 $0
City City of Donald 0 (+/- 0) $0 $0 $0
City City of Dundee 8 (+/- 0) $104,844 $150,989 $190,229
City City of Durham 1 (+/- 0) $12,080 $17,397 $21,918
City City of Estacada 54 (+/- 0) $674,565 $971,467 $1,223,937
City City of Eugene 411 (+/- 0) $5,147,106 $7,420,826 $9,359,816
City City of Fairview 77 (+/- 0) $963,570 $1,391,691 $1,758,432
City City of Falls City 16 (+/- 0) $193,924 $283,296 $361,983
City City of Forest Grove 8 (+/- 0) $104,676 $150,748 $189,926
City City of Gaston 6 (+/- 0) $80,125 $115,392 $145,380

34
Table 19. Total restoration cost estimates for each DMA.
DMA Type DMA
Average Potential
Restoration Acres
(+/- Upper and Lower
Bound Deviation)
Lower Bound
Total Cost
Average Total
Cost
Upper Bound
Total Cost
City City of Gates 6 (+/- 1) $64,251 $103,901 $145,228
City City of Gervais 4 (+/- 0) $45,224 $65,129 $82,055
City City of Gladstone 38 (+/- 0) $472,912 $685,077 $868,181
City City of Gresham 65 (+/- 0) $818,020 $1,181,880 $1,493,841
City City of Halsey 12 (+/- 0) $148,645 $214,069 $269,703
City City of Happy Valley 76 (+/- 0) $953,190 $1,372,727 $1,729,478
City City of Harrisburg 22 (+/- 0) $280,159 $403,469 $508,324
City City of Hillsboro 234 (+/- 1) $2,923,179 $4,229,834 $5,354,364
City City of Hubbard 6 (+/- 0) $81,464 $117,320 $147,810
City City of Idanha 26 (+/- 1) $320,166 $473,138 $611,285
City City of Independence 45 (+/- 0) $563,835 $812,000 $1,023,027
City City of Jefferson 8 (+/- 0) $101,942 $150,829 $195,089
City City of Johnson City 4 (+/- 0) $48,209 $69,428 $87,471
City City of Junction City 19 (+/- 0) $241,604 $347,943 $438,368
City City of Keizer 64 (+/- 0) $805,271 $1,159,702 $1,461,092
City City of King City 13 (+/- 0) $166,277 $239,462 $301,694
City City of Lafayette 5 (+/- 0) $65,730 $94,660 $119,260
City City of Lake Oswego 39 (+/- 0) $481,784 $697,854 $884,278
City City of Lebanon 103 (+/- 1) $1,289,287 $1,869,650 $2,371,793
City City of Lowell 0 (+/- 0) $0 $0 $0
City City of Lyons 4 (+/- 0) $50,720 $73,044 $92,027
City City of Maywood Park 0 (+/- 0) $0 $0 $0
City City of McMinnville 80 (+/- 0) $994,843 $1,436,730 $1,815,177
City City of Mill City 23 (+/- 0) $293,691 $422,955 $532,875
City City of Millersburg 122 (+/- 0) $1,523,720 $2,196,740 $2,770,627
City City of Milwaukie 30 (+/- 0) $378,336 $544,856 $686,456
City City of Molalla 18 (+/- 0) $231,783 $333,800 $420,550
City City of Monmouth 23 (+/- 0) $294,304 $423,839 $533,989
City City of Monroe 18 (+/- 0) $226,259 $325,845 $410,527
City City of Mt. Angel 5 (+/- 0) $67,292 $96,910 $122,095
35
Table 19. Total restoration cost estimates for each DMA.
DMA Type DMA
Average Potential
Restoration Acres
(+/- Upper and Lower
Bound Deviation)
Lower Bound
Total Cost
Average Total
Cost
Upper Bound
Total Cost
City City of Newberg 53 (+/- 0) $661,927 $953,266 $1,201,006
City City of North Plains 5 (+/- 0) $57,360 $82,606 $104,074
City City of Oakridge 46 (+/- 1) $571,033 $834,420 $1,066,458
City City of Oregon City 68 (+/- 0) $859,088 $1,237,206 $1,558,737
City City of Philomath 24 (+/- 0) $296,062 $432,438 $552,465
City City of Portland 1,107 (+/- 2) $13,858,417 $19,994,889 $25,237,676
City City of Rivergrove 2 (+/- 0) $27,703 $39,897 $50,265
City City of Salem 740 (+/- 1) $9,273,671 $13,371,453 $16,866,747
City City of Sandy 6 (+/- 3) $43,215 $114,468 $210,022
City City of Scappoose 24 (+/- 0) $295,615 $425,727 $536,368
City City of Scio 21 (+/- 0) $263,922 $380,085 $478,864
City City of Scotts Mills 5 (+/- 0) $59,313 $85,419 $107,618
City City of Sheridan 40 (+/- 0) $502,289 $723,367 $911,359
City City of Sherwood 41 (+/- 0) $520,006 $748,880 $943,503
City City of Silverton 26 (+/- 0) $328,843 $473,580 $596,657
City City of Sodaville 0 (+/- 0) $0 $0 $0
City City of Springfield 69 (+/- 1) $856,268 $1,245,200 $1,583,997
City City of St. Helens 50 (+/- 0) $623,539 $899,991 $1,136,415
City City of St. Paul 2 (+/- 0) $23,212 $33,428 $42,116
City City of Stayton 44 (+/- 1) $537,638 $786,326 $1,005,867
City City of Sublimity 11 (+/- 0) $141,530 $203,824 $256,794
City City of Sweet Home 53 (+/- 1) $655,007 $952,945 $1,212,750
City City of Tangent 59 (+/- 0) $730,530 $1,060,101 $1,345,729
City City of Tigard 109 (+/- 1) $1,366,035 $1,976,442 $2,501,633
City City of Troutdale 19 (+/- 0) $241,548 $347,862 $438,267
City City of Tualatin 63 (+/- 0) $787,750 $1,134,470 $1,429,301
City City of Turner 43 (+/- 0) $538,307 $775,238 $976,710
City City of Veneta 0 (+/- 0) $0 $0 $0
City City of Waterloo 0 (+/- 0) $5,301 $7,634 $9,618
City City of West Linn 89 (+/- 1) $1,102,085 $1,599,211 $2,030,009
36
Table 19. Total restoration cost estimates for each DMA.
DMA Type DMA
Average Potential
Restoration Acres
(+/- Upper and Lower
Bound Deviation)
Lower Bound
Total Cost
Average Total
Cost
Upper Bound
Total Cost
City City of Westfir 13 (+/- 1) $157,768 $239,261 $316,627
City City of Willamina 16 (+/- 0) $196,519 $283,015 $356,566
City City of Wilsonville 93 (+/- 0) $1,168,039 $1,686,156 $2,129,424
City City of Wood Village 8 (+/- 0) $98,706 $142,150 $179,093
City City of Woodburn 82 (+/- 0) $1,031,167 $1,485,024 $1,870,959
City City of Yamhill 12 (+/- 0) $152,578 $219,734 $276,840
County Benton County 340 (+/- 4) $4,218,743 $6,145,648 $7,831,093
County Clackamas County 351 (+/- 4) $4,359,124 $6,346,054 $8,081,360
County Columbia County 51 (+/- 0) $640,890 $926,990 $1,172,963
County Lane County 212 (+/- 2) $2,639,447 $3,830,220 $4,862,237
County Linn County 408 (+/- 1) $5,104,669 $7,363,488 $9,292,336
County Marion County 312 (+/- 0) $3,913,475 $5,643,984 $7,120,896
County Multnomah County 99 (+/- 1) $1,234,939 $1,789,534 $2,268,528
County Polk County 121 (+/- 0) $1,512,728 $2,178,539 $2,744,709
County Washington County 381 (+/- 0) $4,771,172 $6,876,973 $8,671,530
County Yamhill County 139 (+/- 0) $1,740,354 $2,514,388 $3,177,964
Federal BLM 626 (+/- 21) $2,357,384 $3,711,770 $4,885,285
Federal BPA 0 (+/- 0) $0 $0 $0
Federal USACE 47 (+/- 1) $155,735 $220,137 $258,032
Federal USCG 0 (+/- 0) $0 $0 $0
Federal USFS 4,206 (+/- 335) $15,070,998 $24,932,928 $34,298,202
Federal USFWS 621 (+/- 5) $2,074,757 $2,915,030 $3,396,648
Forestry - Private Oregon Dept. of Forestry 8,899 (+/- 301) $33,475,402 $52,753,889 $69,489,110
Forestry - State Oregon Dept. of Forestry 100 (+/- 3) $380,115 $594,583 $777,736
State Oregon Dept. of Fish and Wildlife 66 (+/- 1) $218,889 $311,270 $366,974
State Oregon Dept. of State Lands 7 (+/- 0) $23,979 $33,413 $38,615
State Oregon Parks and Recreation 224 (+/- 3) $743,380 $1,051,505 $1,233,322
State State of Oregon (general) 105 (+/- 1) $350,660 $492,794 $574,348
95,138 (+/- 1153) $593,948,427 $902,666,588 $1,190,421,429

37
Table 20. Restoration cost estimates for each DMA using all lower bound values.
DMA Type DMA
Potential
Restoration
Acres
Riparian
Planting
Cost
Habitat
Improvement
Cost
Fencing
Cost Total Cost
Agriculture Oregon Dept. of Agriculture 71,619 $241,312,305 $172,679,316 $23,041,193 $437,032,814
City City of Adair Village 0 $0 $0 $0 $0
City City of Albany 216 $1,641,737 $1,061,850 $0 $2,703,587
City City of Amity 4 $27,445 $17,751 $0 $45,196
City City of Aumsville 31 $232,452 $150,347 $0 $382,799
City City of Aurora 5 $39,626 $25,629 $0 $65,255
City City of Banks 10 $77,320 $50,010 $0 $127,330
City City of Barlow 0 $0 $0 $0 $0
City City of Beaverton 130 $986,868 $638,291 $0 $1,625,159
City City of Brownsville 47 $355,142 $229,700 $0 $584,842
City City of Canby 22 $167,262 $108,183 $0 $275,445
City City of Carlton 24 $181,324 $117,277 $0 $298,601
City City of Coburg 6 $48,097 $31,108 $0 $79,205
City City of Cornelius 5 $39,016 $25,235 $0 $64,251
City City of Corvallis 162 $1,236,892 $800,002 $0 $2,036,894
City City of Cottage Grove 43 $328,053 $212,179 $0 $540,232
City City of Creswell 25 $191,895 $124,115 $0 $316,010
City City of Dallas 81 $614,056 $397,162 $0 $1,011,218
City City of Damascus 197 $1,501,226 $970,969 $0 $2,472,195
City City of Dayton 4 $33,747 $21,827 $0 $55,574
City City of Detroit 0 $0 $0 $0 $0
City City of Donald 0 $0 $0 $0 $0
City City of Dundee 8 $63,666 $41,178 $0 $104,844
City City of Durham 1 $7,336 $4,745 $0 $12,080
City City of Estacada 54 $409,625 $264,939 $0 $674,565
City City of Eugene 410 $3,125,549 $2,021,557 $0 $5,147,106
City City of Fairview 77 $585,122 $378,448 $0 $963,570
City City of Falls City 15 $117,759 $76,165 $0 $193,924
City City of Forest Grove 8 $63,564 $41,112 $0 $104,676
City City of Gaston 6 $48,656 $31,470 $0 $80,125
City City of Gates 5 $39,016 $25,235 $0 $64,251

38
Table 20. Restoration cost estimates for each DMA using all lower bound values.
DMA Type DMA
Potential
Restoration
Acres
Riparian
Planting
Cost
Habitat
Improvement
Cost
Fencing
Cost Total Cost
City City of Gervais 4 $27,462 $17,762 $0 $45,224
City City of Gladstone 38 $287,173 $185,739 $0 $472,912
City City of Gresham 65 $496,738 $321,282 $0 $818,020
City City of Halsey 12 $90,264 $58,381 $0 $148,645
City City of Happy Valley 76 $578,819 $374,371 $0 $953,190
City City of Harrisburg 22 $170,125 $110,034 $0 $280,159
City City of Hillsboro 233 $1,775,083 $1,148,096 $0 $2,923,179
City City of Hubbard 6 $49,469 $31,996 $0 $81,464
City City of Idanha 26 $194,419 $125,747 $0 $320,166
City City of Independence 45 $342,385 $221,449 $0 $563,835
City City of Jefferson 8 $61,904 $40,038 $0 $101,942
City City of Johnson City 4 $29,275 $18,934 $0 $48,209
City City of Junction City 19 $146,712 $94,891 $0 $241,604
City City of Keizer 64 $488,996 $316,275 $0 $805,271
City City of King City 13 $100,971 $65,306 $0 $166,277
City City of Lafayette 5 $39,914 $25,816 $0 $65,730
City City of Lake Oswego 38 $292,560 $189,223 $0 $481,784
City City of Lebanon 103 $782,912 $506,375 $0 $1,289,287
City City of Lowell 0 $0 $0 $0 $0
City City of Lyons 4 $30,799 $19,921 $0 $50,720
City City of Maywood Park 0 $0 $0 $0 $0
City City of McMinnville 79 $604,112 $390,731 $0 $994,843
City City of Mill City 23 $178,342 $115,349 $0 $293,691
City City of Millersburg 121 $925,270 $598,450 $0 $1,523,720
City City of Milwaukie 30 $229,742 $148,594 $0 $378,336
City City of Molalla 18 $140,749 $91,034 $0 $231,783
City City of Monmouth 23 $178,715 $115,590 $0 $294,304
City City of Monroe 18 $137,395 $88,865 $0 $226,259
City City of Mt. Angel 5 $40,863 $26,429 $0 $67,292
City City of Newberg 53 $401,951 $259,976 $0 $661,927
City City of North Plains 5 $34,831 $22,528 $0 $57,360

39
Table 20. Restoration cost estimates for each DMA using all lower bound values.
DMA Type DMA
Potential
Restoration
Acres
Riparian
Planting
Cost
Habitat
Improvement
Cost
Fencing
Cost Total Cost
City City of Oakridge 46 $346,757 $224,277 $0 $571,033
City City of Oregon City 68 $521,676 $337,412 $0 $859,088
City City of Philomath 24 $179,782 $116,280 $0 $296,062
City City of Portland 1,105 $8,415,441 $5,442,976 $0 $13,858,417
City City of Rivergrove 2 $16,823 $10,881 $0 $27,703
City City of Salem 739 $5,631,381 $3,642,290 $0 $9,273,671
City City of Sandy 3 $26,242 $16,973 $0 $43,215
City City of Scappoose 24 $179,511 $116,105 $0 $295,615
City City of Scio 21 $160,265 $103,657 $0 $263,922
City City of Scotts Mills 5 $36,017 $23,295 $0 $59,313
City City of Sheridan 40 $305,012 $197,277 $0 $502,289
City City of Sherwood 41 $315,770 $204,235 $0 $520,006
City City of Silverton 26 $199,688 $129,155 $0 $328,843
City City of Sodaville 0 $0 $0 $0 $0
City City of Springfield 68 $519,964 $336,305 $0 $856,268
City City of St. Helens 50 $378,640 $244,899 $0 $623,539
City City of St. Paul 2 $14,095 $9,117 $0 $23,212
City City of Stayton 43 $326,477 $211,160 $0 $537,638
City City of Sublimity 11 $85,944 $55,587 $0 $141,530
City City of Sweet Home 52 $397,749 $257,258 $0 $655,007
City City of Tangent 58 $443,610 $286,920 $0 $730,530
City City of Tigard 109 $829,516 $536,518 $0 $1,366,035
City City of Troutdale 19 $146,678 $94,869 $0 $241,548
City City of Tualatin 63 $478,356 $309,393 $0 $787,750
City City of Turner 43 $326,884 $211,423 $0 $538,307
City City of Veneta 0 $0 $0 $0 $0
City City of Waterloo 0 $3,219 $2,082 $0 $5,301
City City of West Linn 88 $669,235 $432,851 $0 $1,102,085
City City of Westfir 13 $95,803 $61,964 $0 $157,768
City City of Willamina 16 $119,335 $77,184 $0 $196,519
City City of Wilsonville 93 $709,285 $458,754 $0 $1,168,039

40
Table 20. Restoration cost estimates for each DMA using all lower bound values.
DMA Type DMA
Potential
Restoration
Acres
Riparian
Planting
Cost
Habitat
Improvement
Cost
Fencing
Cost Total Cost
City City of Wood Village 8 $59,939 $38,767 $0 $98,706
City City of Woodburn 82 $626,170 $404,997 $0 $1,031,167
City City of Yamhill 12 $92,652 $59,926 $0 $152,578
County Benton County 336 $2,561,806 $1,656,937 $0 $4,218,743
County Clackamas County 347 $2,647,052 $1,712,072 $0 $4,359,124
County Columbia County 51 $389,177 $251,714 $0 $640,890
County Lane County 210 $1,602,788 $1,036,658 $0 $2,639,447
County Linn County 407 $3,099,780 $2,004,889 $0 $5,104,669
County Marion County 312 $2,376,434 $1,537,041 $0 $3,913,475
County Multnomah County 98 $749,910 $485,030 $0 $1,234,939
County Polk County 121 $918,595 $594,133 $0 $1,512,728
County Washington County 380 $2,897,266 $1,873,906 $0 $4,771,172
County Yamhill County 139 $1,056,820 $683,535 $0 $1,740,354
Federal BLM 605 $2,040,033 $317,351 $0 $2,357,384
Federal BPA 0 $0 $0 $0 $0
Federal USACE 46 $155,735 $0 $0 $155,735
Federal USCG 0 $0 $0 $0 $0
Federal USFS 3,871 $13,042,139 $2,028,859 $0 $15,070,998
Federal USFWS 616 $2,074,757 $0 $0 $2,074,757
Forestry - Private Oregon Dept. of Forestry 8,598 $28,968,941 $4,506,461 $0 $33,475,402
Forestry - State Oregon Dept. of Forestry 98 $328,944 $51,171 $0 $380,115
State Oregon Dept. of Fish and Wildlife 65 $218,889 $0 $0 $218,889
State Oregon Dept. of State Lands 7 $23,979 $0 $0 $23,979
State Oregon Parks and Recreation 221 $743,380 $0 $0 $743,380
State State of Oregon (general) 104 $350,660 $0 $0 $350,660
93,985 $351,237,705 $219,669,529 $23,041,193 $593,948,427

41
Table 21. Restoration cost estimates for each DMA using average values.
DMA Type DMA
Potential
Restoration
Acres
Riparian
Planting
Cost
Habitat
Improvement
Cost
Fencing
Cost Total Cost
Agriculture Oregon Dept. of Agriculture 72,065 $338,346,347 $293,297,639 $36,367,008 $668,010,994
City City of Adair Village 0 $0 $0 $0 $0
City City of Albany 219 $2,307,357 $1,646,452 $0 $3,953,809
City City of Amity 4 $37,984 $27,104 $0 $65,089
City City of Aumsville 31 $321,717 $229,567 $0 $551,284
City City of Aurora 5 $54,843 $39,134 $0 $93,977
City City of Banks 10 $107,013 $76,361 $0 $183,373
City City of Barlow 0 $0 $0 $0 $0
City City of Beaverton 130 $1,365,839 $974,617 $0 $2,340,455
City City of Brownsville 47 $491,521 $350,733 $0 $842,254
City City of Canby 22 $231,493 $165,186 $0 $396,679
City City of Carlton 24 $250,954 $179,072 $0 $430,027
City City of Coburg 6 $66,566 $47,499 $0 $114,066
City City of Cornelius 5 $53,999 $38,532 $0 $92,530
City City of Corvallis 165 $1,737,219 $1,239,621 $0 $2,976,841
City City of Cottage Grove 44 $461,743 $329,485 $0 $791,228
City City of Creswell 25 $265,585 $189,513 $0 $455,098
City City of Dallas 81 $854,341 $609,629 $0 $1,463,970
City City of Damascus 198 $2,084,212 $1,487,223 $0 $3,571,435
City City of Dayton 4 $46,707 $33,328 $0 $80,035
City City of Detroit 0 $0 $0 $0 $0
City City of Donald 0 $0 $0 $0 $0
City City of Dundee 8 $88,114 $62,875 $0 $150,989
City City of Durham 1 $10,153 $7,245 $0 $17,397
City City of Estacada 54 $566,927 $404,540 $0 $971,467
City City of Eugene 411 $4,330,632 $3,090,193 $0 $7,420,826
City City of Fairview 77 $812,161 $579,531 $0 $1,391,691
City City of Falls City 16 $165,325 $117,971 $0 $283,296
City City of Forest Grove 8 $87,973 $62,775 $0 $150,748
City City of Gaston 6 $67,340 $48,052 $0 $115,392
City City of Gates 6 $60,634 $43,267 $0 $103,901
42
Table 21. Restoration cost estimates for each DMA using average values.
DMA Type DMA
Potential
Restoration
Acres
Riparian
Planting
Cost
Habitat
Improvement
Cost
Fencing
Cost Total Cost
City City of Gervais 4 $38,008 $27,121 $0 $65,129
City City of Gladstone 38 $399,796 $285,281 $0 $685,077
City City of Gresham 65 $689,719 $492,160 $0 $1,181,880
City City of Halsey 12 $124,926 $89,143 $0 $214,069
City City of Happy Valley 76 $801,094 $571,633 $0 $1,372,727
City City of Harrisburg 22 $235,456 $168,013 $0 $403,469
City City of Hillsboro 234 $2,468,439 $1,761,395 $0 $4,229,834
City City of Hubbard 6 $68,465 $48,855 $0 $117,320
City City of Idanha 26 $276,113 $197,025 $0 $473,138
City City of Independence 45 $473,866 $338,135 $0 $812,000
City City of Jefferson 8 $88,020 $62,808 $0 $150,829
City City of Johnson City 4 $40,517 $28,911 $0 $69,428
City City of Junction City 19 $203,052 $144,891 $0 $347,943
City City of Keizer 64 $676,777 $482,925 $0 $1,159,702
City City of King City 13 $139,745 $99,717 $0 $239,462
City City of Lafayette 5 $55,241 $39,418 $0 $94,660
City City of Lake Oswego 39 $407,252 $290,602 $0 $697,854
City City of Lebanon 103 $1,091,087 $778,563 $0 $1,869,650
City City of Lowell 0 $0 $0 $0 $0
City City of Lyons 4 $42,627 $30,417 $0 $73,044
City City of Maywood Park 0 $0 $0 $0 $0
City City of McMinnville 80 $838,444 $598,286 $0 $1,436,730
City City of Mill City 23 $246,828 $176,128 $0 $422,955
City City of Millersburg 122 $1,281,970 $914,771 $0 $2,196,740
City City of Milwaukie 30 $317,966 $226,890 $0 $544,856
City City of Molalla 18 $194,798 $139,002 $0 $333,800
City City of Monmouth 23 $247,343 $176,496 $0 $423,839
City City of Monroe 18 $190,156 $135,689 $0 $325,845
City City of Mt. Angel 5 $56,554 $40,355 $0 $96,910
City City of Newberg 53 $556,306 $396,961 $0 $953,266
City City of North Plains 5 $48,207 $34,399 $0 $82,606

43
Table 21. Restoration cost estimates for each DMA using average values.
DMA Type DMA
Potential
Restoration
Acres
Riparian
Planting
Cost
Habitat
Improvement
Cost
Fencing
Cost Total Cost
City City of Oakridge 46 $486,949 $347,471 $0 $834,420
City City of Oregon City 68 $722,006 $515,199 $0 $1,237,206
City City of Philomath 24 $252,361 $180,076 $0 $432,438
City City of Portland 1,107 $11,668,581 $8,326,307 $0 $19,994,889
City City of Rivergrove 2 $23,283 $16,614 $0 $39,897
City City of Salem 740 $7,803,289 $5,568,164 $0 $13,371,453
City City of Sandy 6 $66,801 $47,667 $0 $114,468
City City of Scappoose 24 $248,445 $177,282 $0 $425,727
City City of Scio 21 $221,809 $158,276 $0 $380,085
City City of Scotts Mills 5 $49,849 $35,570 $0 $85,419
City City of Sheridan 40 $422,141 $301,226 $0 $723,367
City City of Sherwood 41 $437,030 $311,850 $0 $748,880
City City of Silverton 26 $276,371 $197,209 $0 $473,580
City City of Sodaville 0 $0 $0 $0 $0
City City of Springfield 69 $726,672 $518,529 $0 $1,245,200
City City of St. Helens 50 $525,215 $374,776 $0 $899,991
City City of St. Paul 2 $19,508 $13,920 $0 $33,428
City City of Stayton 44 $458,883 $327,443 $0 $786,326
City City of Sublimity 11 $118,947 $84,877 $0 $203,824
City City of Sweet Home 53 $556,118 $396,827 $0 $952,945
City City of Tangent 59 $618,652 $441,449 $0 $1,060,101
City City of Tigard 109 $1,153,409 $823,034 $0 $1,976,442
City City of Troutdale 19 $203,005 $144,857 $0 $347,862
City City of Tualatin 63 $662,052 $472,418 $0 $1,134,470
City City of Turner 43 $452,412 $322,826 $0 $775,238
City City of Veneta 0 $0 $0 $0 $0
City City of Waterloo 0 $4,455 $3,179 $0 $7,634
City City of West Linn 89 $933,264 $665,946 $0 $1,599,211
City City of Westfir 13 $139,627 $99,633 $0 $239,261
City City of Willamina 16 $165,161 $117,854 $0 $283,015
City City of Wilsonville 93 $984,004 $702,152 $0 $1,686,156
44
Table 21. Restoration cost estimates for each DMA using average values.
DMA Type DMA
Potential
Restoration
Acres
Riparian
Planting
Cost
Habitat
Improvement
Cost
Fencing
Cost Total Cost
City City of Wood Village 8 $82,956 $59,195 $0 $142,150
City City of Woodburn 82 $866,627 $618,396 $0 $1,485,024
City City of Yamhill 12 $128,232 $91,502 $0 $219,734
County Benton County 340 $3,586,467 $2,559,182 $0 $6,145,648
County Clackamas County 351 $3,703,419 $2,642,635 $0 $6,346,054
County Columbia County 51 $540,971 $386,019 $0 $926,990
County Lane County 212 $2,235,233 $1,594,987 $0 $3,830,220
County Linn County 408 $4,297,171 $3,066,317 $0 $7,363,488
County Marion County 312 $3,293,706 $2,350,278 $0 $5,643,984
County Multnomah County 99 $1,044,333 $745,201 $0 $1,789,534
County Polk County 121 $1,271,348 $907,191 $0 $2,178,539
County Washington County 381 $4,013,252 $2,863,721 $0 $6,876,973
County Yamhill County 139 $1,467,342 $1,047,046 $0 $2,514,388
Federal BLM 626 $2,939,588 $772,182 $0 $3,711,770
Federal BPA 0 $0 $0 $0 $0
Federal USACE 47 $220,137 $0 $0 $220,137
Federal USCG 0 $0 $0 $0 $0
Federal USFS 4,206 $19,745,981 $5,186,947 $0 $24,932,928
Federal USFWS 621 $2,915,030 $0 $0 $2,915,030
Forestry - Private Oregon Dept. of Forestry 8,899 $41,779,179 $10,974,710 $0 $52,753,889
Forestry - State Oregon Dept. of Forestry 100 $470,888 $123,695 $0 $594,583
State Oregon Dept. of Fish and Wildlife 66 $311,270 $0 $0 $311,270
State Oregon Dept. of State Lands 7 $33,413 $0 $0 $33,413
State Oregon Parks and Recreation 224 $1,051,505 $0 $0 $1,051,505
State State of Oregon (general) 105 $492,794 $0 $0 $492,794
95,138 $494,464,615 $371,834,966 $36,367,008 $902,666,588

45
Table 22. Restoration cost estimates for each DMA using all upper bound values.
DMA Type DMA
Potential
Restoration
Acres
Riparian
Planting
Cost
Habitat
Improvement
Cost
Fencing
Cost Total Cost
Agriculture Oregon Dept. of Agriculture 72,512 $393,448,608 $442,226,519 $52,600,004 $888,275,131
City City of Adair Village 0 $0 $0 $0 $0
City City of Albany 222 $2,693,806 $2,363,468 $0 $5,057,274
City City of Amity 4 $43,680 $38,324 $0 $82,004
City City of Aumsville 31 $369,961 $324,593 $0 $694,555
City City of Aurora 5 $63,067 $55,333 $0 $118,400
City City of Banks 10 $123,060 $107,969 $0 $231,029
City City of Barlow 0 $0 $0 $0 $0
City City of Beaverton 130 $1,570,656 $1,378,049 $0 $2,948,705
City City of Brownsville 47 $565,229 $495,915 $0 $1,061,144
City City of Canby 22 $266,207 $233,563 $0 $499,770
City City of Carlton 24 $288,587 $253,198 $0 $541,784
City City of Coburg 6 $76,548 $67,161 $0 $143,710
City City of Cornelius 5 $62,096 $54,481 $0 $116,577
City City of Corvallis 167 $2,026,874 $1,778,321 $0 $3,805,194
City City of Cottage Grove 45 $539,856 $473,654 $0 $1,013,510
City City of Creswell 25 $305,412 $267,959 $0 $573,371
City City of Dallas 81 $987,607 $866,498 $0 $1,854,105
City City of Damascus 198 $2,404,223 $2,109,397 $0 $4,513,620
City City of Dayton 4 $53,711 $47,124 $0 $100,835
City City of Detroit 0 $0 $0 $0 $0
City City of Donald 0 $0 $0 $0 $0
City City of Dundee 8 $101,328 $88,902 $0 $190,229
City City of Durham 1 $11,675 $10,243 $0 $21,918
City City of Estacada 54 $651,942 $571,995 $0 $1,223,937
City City of Eugene 411 $4,985,597 $4,374,219 $0 $9,359,816
City City of Fairview 77 $936,646 $821,786 $0 $1,758,432
City City of Falls City 16 $192,813 $169,169 $0 $361,983
City City of Forest Grove 8 $101,166 $88,760 $0 $189,926
City City of Gaston 6 $77,438 $67,942 $0 $145,380
City City of Gates 6 $77,357 $67,871 $0 $145,228

46
Table 22. Restoration cost estimates for each DMA using all upper bound values.
DMA Type DMA
Potential
Restoration
Acres
Riparian
Planting
Cost
Habitat
Improvement
Cost
Fencing
Cost Total Cost
City City of Gervais 4 $43,707 $38,348 $0 $82,055
City City of Gladstone 38 $462,445 $405,736 $0 $868,181
City City of Gresham 66 $795,709 $698,132 $0 $1,493,841
City City of Halsey 12 $143,660 $126,043 $0 $269,703
City City of Happy Valley 76 $921,223 $808,255 $0 $1,729,478
City City of Harrisburg 22 $270,764 $237,560 $0 $508,324
City City of Hillsboro 235 $2,852,054 $2,502,310 $0 $5,354,364
City City of Hubbard 6 $78,732 $69,078 $0 $147,810
City City of Idanha 27 $325,607 $285,678 $0 $611,285
City City of Independence 45 $544,925 $478,102 $0 $1,023,027
City City of Jefferson 9 $103,916 $91,173 $0 $195,089
City City of Johnson City 4 $46,592 $40,879 $0 $87,471
City City of Junction City 19 $233,501 $204,867 $0 $438,368
City City of Keizer 64 $778,265 $682,827 $0 $1,461,092
City City of King City 13 $160,700 $140,994 $0 $301,694
City City of Lafayette 5 $63,525 $55,735 $0 $119,260
City City of Lake Oswego 39 $471,019 $413,259 $0 $884,278
City City of Lebanon 104 $1,263,358 $1,108,434 $0 $2,371,793
City City of Lowell 0 $0 $0 $0 $0
City City of Lyons 4 $49,019 $43,008 $0 $92,027
City City of Maywood Park 0 $0 $0 $0 $0
City City of McMinnville 80 $966,872 $848,305 $0 $1,815,177
City City of Mill City 23 $283,841 $249,034 $0 $532,875
City City of Millersburg 122 $1,475,802 $1,294,826 $0 $2,770,627
City City of Milwaukie 30 $365,647 $320,809 $0 $686,456
City City of Molalla 18 $224,010 $196,540 $0 $420,550
City City of Monmouth 23 $284,434 $249,554 $0 $533,989
City City of Monroe 18 $218,671 $191,856 $0 $410,527
City City of Mt. Angel 5 $65,035 $57,060 $0 $122,095
City City of Newberg 53 $639,728 $561,279 $0 $1,201,006
City City of North Plains 5 $55,436 $48,638 $0 $104,074
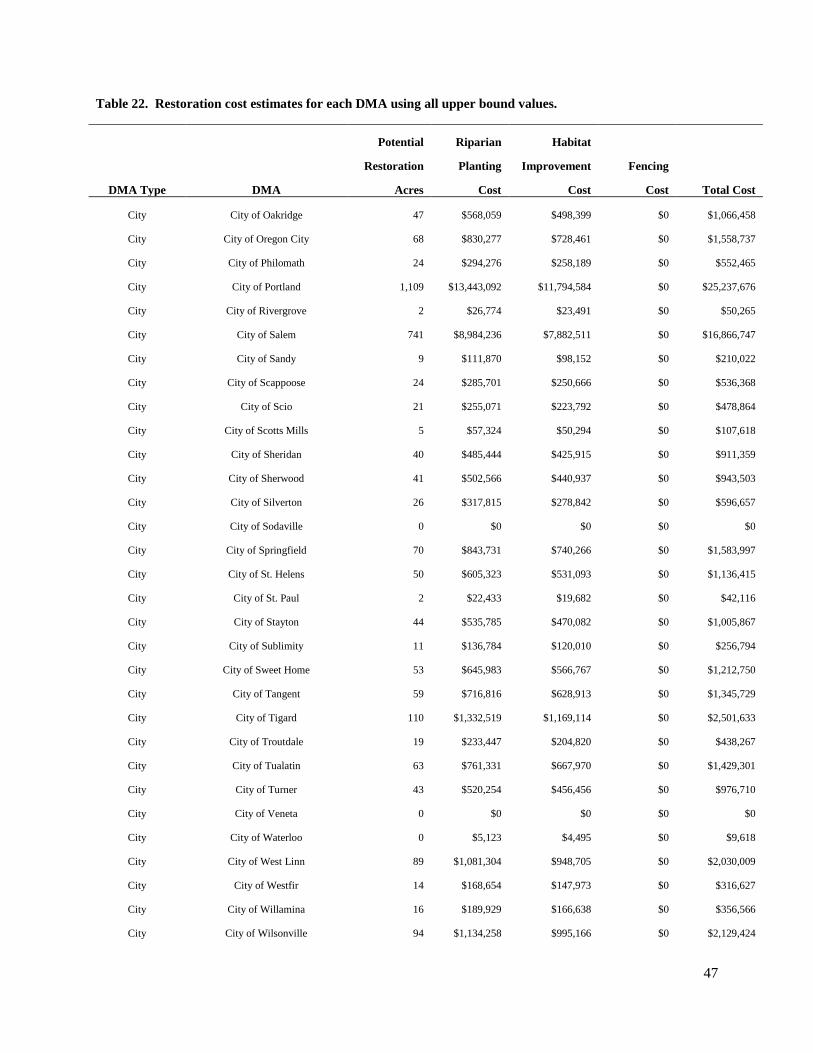
47
Table 22. Restoration cost estimates for each DMA using all upper bound values.
DMA Type DMA
Potential
Restoration
Acres
Riparian
Planting
Cost
Habitat
Improvement
Cost
Fencing
Cost Total Cost
City City of Oakridge 47 $568,059 $498,399 $0 $1,066,458
City City of Oregon City 68 $830,277 $728,461 $0 $1,558,737
City City of Philomath 24 $294,276 $258,189 $0 $552,465
City City of Portland 1,109 $13,443,092 $11,794,584 $0 $25,237,676
City City of Rivergrove 2 $26,774 $23,491 $0 $50,265
City City of Salem 741 $8,984,236 $7,882,511 $0 $16,866,747
City City of Sandy 9 $111,870 $98,152 $0 $210,022
City City of Scappoose 24 $285,701 $250,666 $0 $536,368
City City of Scio 21 $255,071 $223,792 $0 $478,864
City City of Scotts Mills 5 $57,324 $50,294 $0 $107,618
City City of Sheridan 40 $485,444 $425,915 $0 $911,359
City City of Sherwood 41 $502,566 $440,937 $0 $943,503
City City of Silverton 26 $317,815 $278,842 $0 $596,657
City City of Sodaville 0 $0 $0 $0 $0
City City of Springfield 70 $843,731 $740,266 $0 $1,583,997
City City of St. Helens 50 $605,323 $531,093 $0 $1,136,415
City City of St. Paul 2 $22,433 $19,682 $0 $42,116
City City of Stayton 44 $535,785 $470,082 $0 $1,005,867
City City of Sublimity 11 $136,784 $120,010 $0 $256,794
City City of Sweet Home 53 $645,983 $566,767 $0 $1,212,750
City City of Tangent 59 $716,816 $628,913 $0 $1,345,729
City City of Tigard 110 $1,332,519 $1,169,114 $0 $2,501,633
City City of Troutdale 19 $233,447 $204,820 $0 $438,267
City City of Tualatin 63 $761,331 $667,970 $0 $1,429,301
City City of Turner 43 $520,254 $456,456 $0 $976,710
City City of Veneta 0 $0 $0 $0 $0
City City of Waterloo 0 $5,123 $4,495 $0 $9,618
City City of West Linn 89 $1,081,304 $948,705 $0 $2,030,009
City City of Westfir 14 $168,654 $147,973 $0 $316,627
City City of Willamina 16 $189,929 $166,638 $0 $356,566
City City of Wilsonville 94 $1,134,258 $995,166 $0 $2,129,424
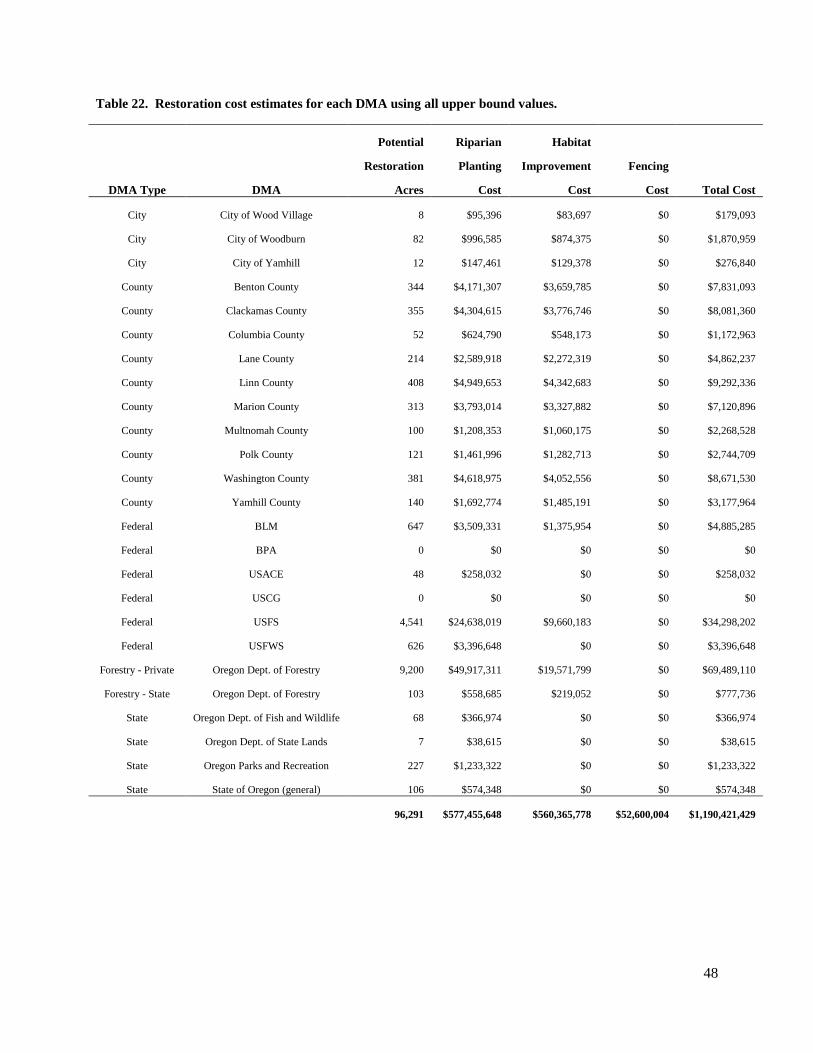
48
Table 22. Restoration cost estimates for each DMA using all upper bound values.
DMA Type DMA
Potential
Restoration
Acres
Riparian
Planting
Cost
Habitat
Improvement
Cost
Fencing
Cost Total Cost
City City of Wood Village 8 $95,396 $83,697 $0 $179,093
City City of Woodburn 82 $996,585 $874,375 $0 $1,870,959
City City of Yamhill 12 $147,461 $129,378 $0 $276,840
County Benton County 344 $4,171,307 $3,659,785 $0 $7,831,093
County Clackamas County 355 $4,304,615 $3,776,746 $0 $8,081,360
County Columbia County 52 $624,790 $548,173 $0 $1,172,963
County Lane County 214 $2,589,918 $2,272,319 $0 $4,862,237
County Linn County 408 $4,949,653 $4,342,683 $0 $9,292,336
County Marion County 313 $3,793,014 $3,327,882 $0 $7,120,896
County Multnomah County 100 $1,208,353 $1,060,175 $0 $2,268,528
County Polk County 121 $1,461,996 $1,282,713 $0 $2,744,709
County Washington County 381 $4,618,975 $4,052,556 $0 $8,671,530
County Yamhill County 140 $1,692,774 $1,485,191 $0 $3,177,964
Federal BLM 647 $3,509,331 $1,375,954 $0 $4,885,285
Federal BPA 0 $0 $0 $0 $0
Federal USACE 48 $258,032 $0 $0 $258,032
Federal USCG 0 $0 $0 $0 $0
Federal USFS 4,541 $24,638,019 $9,660,183 $0 $34,298,202
Federal USFWS 626 $3,396,648 $0 $0 $3,396,648
Forestry - Private Oregon Dept. of Forestry 9,200 $49,917,311 $19,571,799 $0 $69,489,110
Forestry - State Oregon Dept. of Forestry 103 $558,685 $219,052 $0 $777,736
State Oregon Dept. of Fish and Wildlife 68 $366,974 $0 $0 $366,974
State Oregon Dept. of State Lands 7 $38,615 $0 $0 $38,615
State Oregon Parks and Recreation 227 $1,233,322 $0 $0 $1,233,322
State State of Oregon (general) 106 $574,348 $0 $0 $574,348
96,291 $577,455,648 $560,365,778 $52,600,004 $1,190,421,429
49
8 References
Allison, James. Watershed Revegetation Program Project Manager, City of Portland. 2008. Personal Communication. Agouridis, CT, Workman ST, Warmer RC, Jennings GD. 2005. Livestock grazing management impacts on stream water quality: A review. Journal of the American Water Resources Association 41(3): 591-606. Beschta R. 1997. Riparian shade and stream temperature: an alternative perspective. Rangelands, 19(2): 25–28. Bishaw B, Emmingham W, Rogers W. 2002. Riparian forest buffers on agricultural lands in the Oregon Coast Range: Beaver Creek riparian project as a case study. Forest Research Laboratory, College of Forestry, Oregon State University, Corvallis, Oregon. Boyd, M. and B. Kasper. 2003. Analytical Methods for Dynamic Open Channel Heat and Mass Transfer: Methodology for Heat Source Model Version 7.0 Brown GW. 1969. Predicting Temperatures of Small Streams. Water Resources Research, 5(1): 69-75 Butler DM, Franklin DH, Ranells NN, Poore MH, Green JT Jr. 2006. Ground cover impacts on sediment and phosphorus export from manured riparian pasture, Journal of Environmental Quality, 35: 2178-2185. Clean Water Services. 2005. Revised Temperature Management Plan - February 28, 2005, Appendix C. Accessed at http://www.deq.state.or.us/wq/wqpermit/cwspermit.htm Clean Water Services. 2007. Clean Water Service Thermal Credit Cost Summary (Draft). Coyne MS, Gilfillen RA, Villaba A, Zhang Z, Rhodes R, Dunn L, Blevins RL. 1998. Fecal bacteria trapping by grass filter strips during simulated rain. Journal of Soil and Water Conservation, 53(2): 140-145. Dosskey MG. 2001. Toward Quantifying Water Pollution Abatement in Response to Installing Buffers on Crop Land. Environmental Management, 28(5): 577-598. Dosskey MG, Helmers MJ, Eisenhauer, Franti TG, Hoagland KD. 2002. Assessment of concentrated flow though riparian buffers. Journal of Soil and Water Conservation, 57(6): 336-343. Ebbert, JC, Embrey SS, Black RW, Tesoriero AJ, Haggland AL, 2000, Water Quality in the Puget Sound Basin, Washington and British Columbia, 1996–98: U.S. Geological Survey Circular 1216, 31 p., on-line at http://pubs.water.usgs.gov/circ1216/ Entry JA, Hubbard RK, Thies JE, Fuhrmann JJ. 2000. The influence of vegetation in riparian filterstips on coliform bacteria: movement and survival in water. Journal of Environmental Quality, 29(4)

50
Homer C, Huang C. Yang L. Wylie B, Coan M. 2004. Development of a 2001 National Landcover Database for the United States. Photogrammetric Engineering and Remote Sensing, 70(7): 829-840. Huang C, Yang L, Wylie B, Homer C. 2001. A strategy for estimating tree canopy density using Landsat 7 ETM+ and high resolution images over large areas. Proceedings of the Third International Conference on Geospatial Information in Agriculture and Forestry, Denver Colorado CD-ROM, 1 disk. Knoder E. 1995. Benefits and costs of riparian habitat improvement in the Tualatin River basin. Report Number 10, Oregon Water Resources Research Institute. Kauffman JB, Krueger WC, Vavra M. 1983. Impacts of cattle on streambanks in Northeastern Oregon. Journal of Range Management 38(6): 683-685. Johnson SL. 2004. Factors influencing stream temperatures in small streams: substrate effects and a shading experiment. Canadian Journal of Fish and Aquatic Sciences, 61: 913-923 Johnson SL, Jones JA. 2000. Stream temperature responses to forest harvest and debris flows in western Cascades, Oregon. Canadian Journal of Fisheries and Aquatic Sciences, 57: 30–39. Kaufman PR, Levine P, Robison EG, Seeliger C, and DV Peck. 1999. Quantifying Physical Habitat in Wadeable Streams. EPA/620/R-99/003, U.S. Environmental Protection Agency. Loop, Lois. 2008. Unpublished CREP cost data, USDA Farm Service Agency. Mckergo LA, Weaver DM, Prosser IP, Grayson RB. 2003. Before and after riparian management: sediment and nutrient exports from a small agricultural catchment, Western Australia. Journal of Hydrology, 270: 253-272. Muenz, TK, Golladay SW, Vellidis G, Smith LL. 2006. Stream Buffer Effectiveness in Agriculturally Influenced Area, Southwestern Georgia: Response of Water Quality, Macroinvertebrates, and Amphibians. Journal of Environmental Quality 35(5), 1924-1938. [NASS] National Agricultural Statistics Service. 2002. 2002 Census of Agriculture, Agricultural Statistics Board, U.S. Department of Agriculture. [ODEQ] Oregon Department of Environmental Quality, 2001. Tualatin Subbasin Total Maximum Daily Load, Portland, OR. Accessed at http://www.deq.state.or.us/wq/tmdls/willamette.htm [ODEQ] Oregon Department of Environmental Quality, 2006a. Oregon’s 2004/2006 Integrated Report, Portland, OR. Accessed at http://www.deq.state.or.us/wq/assessment/rpt0406.htm [ODEQ] Oregon Department of Environmental Quality, 2006b. Willamette Basin Total Maximum Daily Load, Portland, OR. Accessed at http://www.deq.state.or.us/wq/tmdls/willamette.htm [ODEQ] Oregon Department of Environmental Quality, 2008. Molalla-Pudding Subbasin Total Maximum Daily Load, Portland, OR. Accessed at http://www.deq.state.or.us/wq/tmdls/willamette.htm [ODEQ] Oregon Department of Environmental Quality, 2009. Willamette Basin Rivers & Streams Assessment (Draft), Portland OR.

51
Parkyn SM, Davies-Colley RJ, Cooper BA, and Stroud MJ. 2005. Predictions of stream nutrient and sediment yield changes following restoration of forested riparian buffers. Ecological Engineering, 24: 551-558. Poole GC, Berman CH. 2001. An ecological perspective on in-stream temperature: natural heat dynamics and mechanisms of human-caused thermal degradation. Environmental Management. 27: 787-802 Query, Toby. Restoration Ecologist, City of Portland. 2008. Personal Communication. Schoonover JE, Willard KWJ, Zaczek JJ, Mangun JC, Carver AD. 2005. Nutrient attenuation in agricultural surface runoff by riparian buffer zones in Southern Illinois, USA. Agroforestry Systems, 64: 169-180. Seedang S, Fernald AG, Adams RM, Landers DH. 2008. Economic Analysis of water temperature reduction practices in a large river floodplain: An exploratory study of the Willamette River, Oregon. River Research and Applications, 24(7): 941-959. Sullivan TJ, Moore JA, Thomas DR, Mallery E,Snydern KU, Wustenberg M, Wustenberg J, Mackey SD, Moore DL. 2007. Efficacy of vegetated buffers in preventing transport of fecal coloiform bacteria from pasturelands. Environmental Management, 10(1). Waite IR, Carpenter KD. 2000. Associations among Fish Assemblage Structure and Environmental Variables in Willamette Basin Streams, Oregon. Transactions of the American Fisheries Society: 129( 3): 754–770. Wentz, DA, Bonn, BA, Carpenter, KD, Hinkle, SR, Janet, ML, Rinella, FA, Uhrich, MA, Waite, IR, Laenen, A, Bencala, KE. 1998. Water Quality in the Willamette Basin, Oregon, 1991-95: U.S. Geological Survey Circular 1161 Yang L, Huang, C. Homer, Wylie, B, Coan, M. 2003. An approach for mapping large-area impervious surfaces: Synergistic use of Landsat 7 ETM+ and high spatial resolution imagery. Canadian Journal of Remote Sensing, 29: 2, 230-240

52
Restoration in an urban setting along the headwaters of Tryon Creek in Portland. Photo by Ryan Michie.