WILL REVOLUTIONISE THE ELECTRICITY SYSTEM · Table 2 Investment cost for solar PV power ... rooftop...
52
LETTING IN THE LIGHT HOW SOLAR PHOTOVOLTAICS WILL REVOLUTIONISE THE ELECTRICITY SYSTEM
Transcript of WILL REVOLUTIONISE THE ELECTRICITY SYSTEM · Table 2 Investment cost for solar PV power ... rooftop...
LETTING IN THE LIGHTHOW SOLAR PHOTOVOLTAICS
WILL REVOLUTIONISE
THE ELECTRICITY SYSTEM
Photos in the report©Shutterstock
Copyright © IRENA 2016
ISBN 978-92-95111-95-0 (Print), ISBN 978-92-95111-96-7 (PDF)
Unless otherwise stated, this publication and material herein are the property of the International Renewable Energy Agency (IRENA) and are subject to copyright by IRENA.Material in this publication may be freely used, shared, copied, reproduced, printed and/or stored, provided that all such material is clearly attributed to IRENA and bears a notation of copyright (© IRENA) with the year of copyright.Material contained in this publication attributed to third parties may be subject to third-party copyright and separate terms of use and restrictions, including restrictions in relation to any commercial use.This publication should be cited as: IRENA (2016), ‘Letting in the Light: How solar PV will revolutionise the electricity system,’
Abu Dhabi.
About IRENA
The International Renewable Energy Agency (IRENA) is an intergovernmental organisation that supports countries in their transition to a sustainable energy future and serves as the principal platform for international co-operation, a centre of excellence, and a repository of policy, technology, resource and financial knowledge on renewable energy. IRENA promotes the widespread adoption and sustainable use of all forms of renewable energy, including bioenergy, geothermal, hydropower, ocean, solar and wind energy, in the pursuit of sustainable development, energy access, energy security and low-carbon economic growth and prosperity. www.irena.org
Acknowledgements
IRENA is grateful for the valuable contributions of Mark Turner in the preparation of this study. This report benefited from the reviews and comments of numerous experts, including Morgan Bazilian (World Bank), John Smirnow (Global Solar Council), Tomas Kåberger (Renewable Energy Institute), Paddy Padmanathan (ACWA Power), Linus Mofor (UNECA), DK Khare (Ministry of New and Renewable Energy, India), Maurice Silva (Ministry of Energy, Chile), Eicke Weber (Fraunhofer ISE).
Authors: Dolf Gielen, Ruud Kempener, Michael Taylor, Francisco Boshell and Amr Seleem (IRENA)
For further information or to provide feedback: [email protected]
This report is available for download from www.irena.org/publications
Disclaimer
This publication and the material herein are provided “as is”, for informational purposes.
All reasonable precautions have been taken by IRENA to verify the reliability of the material featured in this publication. Neither IRENA nor any of its officials, agents, data or other, third-party content providers or licensors provides any warranty, including as to the accuracy, completeness, or fitness for a particular purpose or use of such material, or regarding the non-infringement of third-party rights, and they accept no responsibility or liability with regard to the use of this publication and the material therein.The material contained herein does not necessarily represent the views of the members of IRENA. The mention of specific companies or certain projects, products or services does not imply that they are endorsed or recommended by IRENA in preference to others of a similar nature that are not mentioned. The designations employed and the presentation of material herein do not imply the expression of any opinion on the part of IRENA concerning the legal status of any region, country, territory, city or area, or their authorities, or concerning the delimitation of frontiers or boundaries.
Images in the report©Shutterstock (unless otherwise indicated)
CONTENTSSOLAR ENERGY: A NEW ERA . . . . . . . . . . . . . . . . . . . . . . . . . . . . . . . . . . . . . . . . . . . . . . . . . . . . . . . . . . . .7
Plummeting cost of solar . . . . . . . . . . . . . . . . . . . . . . . . . . . . . . . . . . . . . . . . . . . . . . . . . . . . . . . . . . . . . . . . . . . . .7
Dramatic shift in scale . . . . . . . . . . . . . . . . . . . . . . . . . . . . . . . . . . . . . . . . . . . . . . . . . . . . . . . . . . . . . . . . . . . . . 10
Shock to the system . . . . . . . . . . . . . . . . . . . . . . . . . . . . . . . . . . . . . . . . . . . . . . . . . . . . . . . . . . . . . . . . . . . . . . . 10
Revolution in ownership . . . . . . . . . . . . . . . . . . . . . . . . . . . . . . . . . . . . . . . . . . . . . . . . . . . . . . . . . . . . . . . . . . . . . 13
Traditional business models under pressure . . . . . . . . . . . . . . . . . . . . . . . . . . . . . . . . . . . . . . . . . . . . . . . . . . . . . 16
New financial and business models flourishing . . . . . . . . . . . . . . . . . . . . . . . . . . . . . . . . . . . . . . . . . . . . . . . . . . . 18
Integration with old technologies . . . . . . . . . . . . . . . . . . . . . . . . . . . . . . . . . . . . . . . . . . . . . . . . . . . . . . . . . . . . . 19
Driving solar PV forward . . . . . . . . . . . . . . . . . . . . . . . . . . . . . . . . . . . . . . . . . . . . . . . . . . . . . . . . . . . . . . . . . . . . 20
THE ROAD AHEAD . . . . . . . . . . . . . . . . . . . . . . . . . . . . . . . . . . . . . . . . . . . . . . . . . . . . . . . . . . . . . . . . . . . . 27
Solar PV: The technology . . . . . . . . . . . . . . . . . . . . . . . . . . . . . . . . . . . . . . . . . . . . . . . . . . . . . . . . . . . . . . . . . . . 28
Solar PV: The economics . . . . . . . . . . . . . . . . . . . . . . . . . . . . . . . . . . . . . . . . . . . . . . . . . . . . . . . . . . . . . . . . . . . 32
Solar PV: The applications . . . . . . . . . . . . . . . . . . . . . . . . . . . . . . . . . . . . . . . . . . . . . . . . . . . . . . . . . . . . . . . . . . 36
Solar PV: The infrastructure . . . . . . . . . . . . . . . . . . . . . . . . . . . . . . . . . . . . . . . . . . . . . . . . . . . . . . . . . . . . . . . . . . 41
Solar PV: The policy framework . . . . . . . . . . . . . . . . . . . . . . . . . . . . . . . . . . . . . . . . . . . . . . . . . . . . . . . . . . . . . . . 44
Wider impact of solar PV: What to expect . . . . . . . . . . . . . . . . . . . . . . . . . . . . . . . . . . . . . . . . . . . . . . . . . . . . . . . 46
REFERENCES . . . . . . . . . . . . . . . . . . . . . . . . . . . . . . . . . . . . . . . . . . . . . . . . . . . . . . . . . . . . . . . . . . . . . . . . . . 49
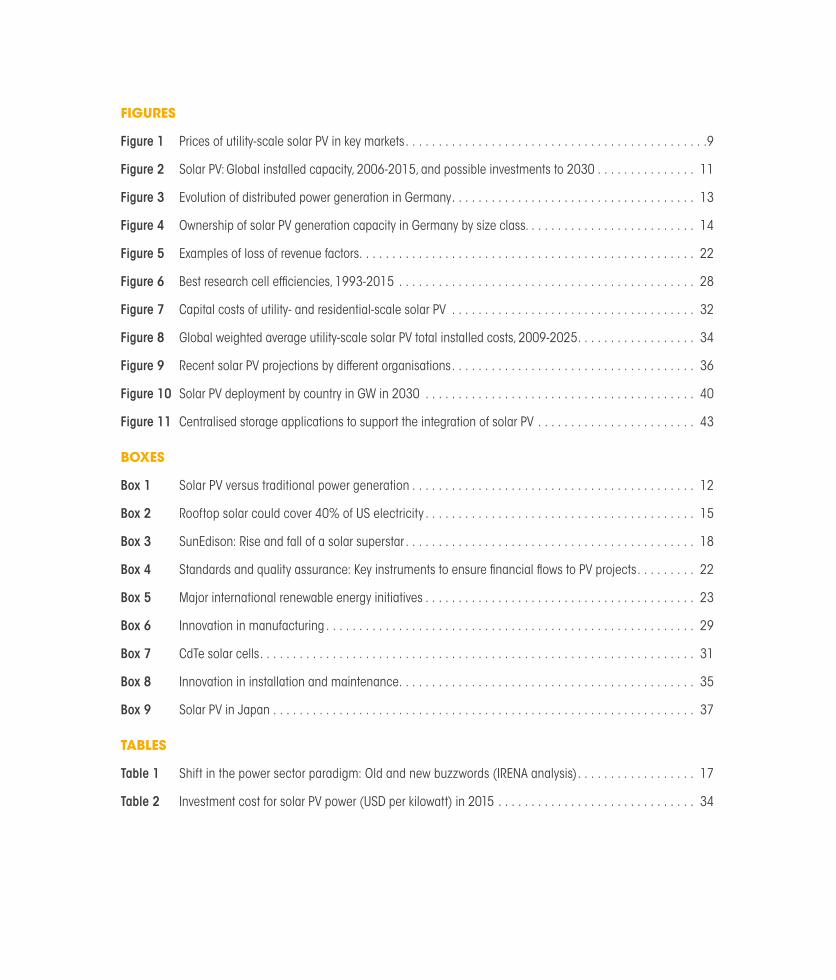
FIGURES
Figure 1 Prices of utility-scale solar PV in key markets . . . . . . . . . . . . . . . . . . . . . . . . . . . . . . . . . . . . . . . . . . . . . .9
Figure 2 Solar PV: Global installed capacity, 2006-2015, and possible investments to 2030 . . . . . . . . . . . . . . . 11
Figure 3 Evolution of distributed power generation in Germany . . . . . . . . . . . . . . . . . . . . . . . . . . . . . . . . . . . . . 13
Figure 4 Ownership of solar PV generation capacity in Germany by size class . . . . . . . . . . . . . . . . . . . . . . . . . . 14
Figure 5 Examples of loss of revenue factors . . . . . . . . . . . . . . . . . . . . . . . . . . . . . . . . . . . . . . . . . . . . . . . . . . . 22
Figure 6 Best research cell efficiencies, 1993-2015 . . . . . . . . . . . . . . . . . . . . . . . . . . . . . . . . . . . . . . . . . . . . . 28
Figure 7 Capital costs of utility- and residential-scale solar PV . . . . . . . . . . . . . . . . . . . . . . . . . . . . . . . . . . . . . 32
Figure 8 Global weighted average utility-scale solar PV total installed costs, 2009-2025 . . . . . . . . . . . . . . . . . . 34
Figure 9 Recent solar PV projections by different organisations . . . . . . . . . . . . . . . . . . . . . . . . . . . . . . . . . . . . . 36
Figure 10 Solar PV deployment by country in GW in 2030 . . . . . . . . . . . . . . . . . . . . . . . . . . . . . . . . . . . . . . . . . 40
Figure 11 Centralised storage applications to support the integration of solar PV . . . . . . . . . . . . . . . . . . . . . . . . 43
BOXES
Box 1 Solar PV versus traditional power generation . . . . . . . . . . . . . . . . . . . . . . . . . . . . . . . . . . . . . . . . . . . 12
Box 2 Rooftop solar could cover 40% of US electricity . . . . . . . . . . . . . . . . . . . . . . . . . . . . . . . . . . . . . . . . . 15
Box 3 SunEdison: Rise and fall of a solar superstar . . . . . . . . . . . . . . . . . . . . . . . . . . . . . . . . . . . . . . . . . . . . 18
Box 4 Standards and quality assurance: Key instruments to ensure financial flows to PV projects . . . . . . . . . 22
Box 5 Major international renewable energy initiatives . . . . . . . . . . . . . . . . . . . . . . . . . . . . . . . . . . . . . . . . . 23
Box 6 Innovation in manufacturing . . . . . . . . . . . . . . . . . . . . . . . . . . . . . . . . . . . . . . . . . . . . . . . . . . . . . . . . 29
Box 7 CdTe solar cells . . . . . . . . . . . . . . . . . . . . . . . . . . . . . . . . . . . . . . . . . . . . . . . . . . . . . . . . . . . . . . . . . . 31
Box 8 Innovation in installation and maintenance . . . . . . . . . . . . . . . . . . . . . . . . . . . . . . . . . . . . . . . . . . . . . 35
Box 9 Solar PV in Japan . . . . . . . . . . . . . . . . . . . . . . . . . . . . . . . . . . . . . . . . . . . . . . . . . . . . . . . . . . . . . . . . 37
TABLES
Table 1 Shift in the power sector paradigm: Old and new buzzwords (IRENA analysis) . . . . . . . . . . . . . . . . . . 17
Table 2 Investment cost for solar PV power (USD per kilowatt) in 2015 . . . . . . . . . . . . . . . . . . . . . . . . . . . . . . 34

HOW SOLAR PV WILL REVOLUTIONISE THE ELECTRICITY SYSTEM 5
SOLAR ENERGY: A NEW ERA

LETTING IN THE LIGHT6
7
SOLAR ENERGY: A NEW ERA The age of solar energy has arrived. It came faster than anyone predicted and is ushering in a global shift in energy ownership. People are only just beginning to recognise the consequences of this change.
Solar photovoltaic (PV) power is already the most widely owned electricity source in the world in terms of number of installations, and its uptake is accelerating. In only five years, global installed capacity has grown from 40 gigawatts (GW) to 227 GW. By comparison, the entire generation capacity of Africa is 175 GW.
Solar PV accounted for 20% of all new power generation capacity in 2015, according to statistics gathered by the International Renewable Energy Agency (IRENA). This amounted to 47 GW in a single year, equivalent to the total power generation capacity of Poland.
We are seeing the emergence of solar power everywhere: from large-scale utilities to micro-grids; from billion-dollar corporate HQs to rural rooftops; and from megacities to small islands and isolated communities. We see solar next to our airports, along our roads, in our fields and on top of our car parks.
This shift is taking place not only in advanced economies but also in the developing world. Solar PV deployment promises to improve the well-being of billions of people previously cut off from reliable electricity.
An electricity system once dominated by monolithic state agencies and a few large corporations is giving way to a vast range of owners and producers. Power generation is diversifying from the hands of the few to the enterprises and homes of the many.
PLUMMETING COST OF SOLAR The primary driver for the solar revolution is dramatic cost reduction.
Solar PV was, until recently, considered an expensive luxury affordable only to rich countries. But in recent years, support polices have accelerated deployment, spurred technological innovations and created a virtuous circle of falling costs.
Utility-scale PV power from plants commissioned in the past year typically costs between six and ten US cents (USD 0.06-0.10) per kilowatt-hour (kWh) in Europe, China, India, South Africa and the United States. In 2015, record low prices were set in the United Arab Emirates (USD 0.0584/kWh),
LETTING IN THE LIGHT8
Peru (USD 0.048/kWh) and Mexico (USD 0.045/kWh median price). In May 2016, an auction of 800 megawatts (MW) of solar PV in Dubai attracted a bid of USD 0.0299/kWh or just under three cents (with the winning bidder still to be announced). While these record lows will not be repeated everywhere, they indicate a continued strong trend and significant potential for further cost reduction.
On a global level, weighted average levelised cost of electricity (LCOE) for utility-scale solar PV was USD 0.13/kWh in 2015. In comparison, electricity production from coal- and gas-fired power stations was in the range of USD 0.05-0.10/kWh. By 2025, the global weighted average LCOE of solar PV could fall by 59% with the right enabling policies (IRENA, 2016a). That would make solar the cheapest form of power generation in an increasing number of cases. Rooftop solar is more expensive than utility-scale PV, but this is balanced by grid savings.
The upfront costs of building a solar PV plant – often cited as a major barrier – are now close to or even lower than those of conventional power generation. For utility-scale projects, the global average total installed cost of solar PV systems could fall from USD 1.8 per watt (W) in 2015 to USD 0.79/W in 2025. This represents a 57% reduction in ten years (IRENA, 2016a). Coal-fired power generation plants, by comparison, cost about USD 3/W, and natural gas plants cost USD 1-1.3/W.
Furthermore, the energy payback (the time needed for a solar PV panel to produce the energy used in its production) has fallen due to improvements in resource use, manufacturing processes and efficiency and is now two years or less, depending on key factors like location (Bhadari et al., 2015).
Consequently, in both developed and developing countries, utility-scale solar PV systems can sometimes be cheaper than new gas- or coal-fired power stations. In many countries, rooftop solar PV systems provide power at a lower cost than the grid. Solar lights and solar home systems are bringing cheap electricity to previously un-electrified regions across Africa and Asia.
Solar PV now represents more than half of all investment in the renewable energy sector. Investment in rooftop solar PV reached USD 67 billion worldwide in 2015. For utility-scale systems, it reached USD 92 billion. Investment in off-grid applications is 15 times higher and now amounts to USD 267 million, according to figures from Lighting Global and Bloomberg New Energy Finance (BNEF) in 2016.
The benefits go far beyond bottom-line costs. The solar PV value chain today employs 2.8 million people in manufacturing, installation and maintenance (IRENA, 2016b).
Solar is a core element of policies to address climate change. Solar PV generation has already reduced carbon dioxide (CO2) emissions by 200 million-300 million tonnes per year, equivalent to total
HOW SOLAR PV WILL REVOLUTIONISE THE ELECTRICITY SYSTEM 9
greenhouse gas emissions in France.1 Depending on the growth of actual solar PV deployment, this CO2 emissions reduction could range between one and three gigatonnes per year in 2030 (IRENA, 2016c). Solar and other renewables provide major health benefits compared to fossil fuels and have the potential to reduce particulate matter emissions by a third.
Yet while the spread of solar PV offers enormous opportunities, it also poses major challenges to regulators and planners. Solar PV provides less than 2% of global electricity today. The experience of countries pioneering solar power, such as Germany, Italy and island states like Samoa, shows that 10-20% solar PV can be integrated into an electricity system without problems. But integrating higher levels will require a host of new activities. These include the introduction of more interconnectors, demand-side management, electrification of the transport and building sectors and ultimately electricity storage.
The question facing policy makers today is not whether the shift to solar PV will happen – it has already begun - but how best to manage it. This paper highlights some of the most important changes in store.
1 Assuming 200-300 terawatt-hours (TWh) solar PV electricity replacing coal at 1 million tonnes CO2 / TWh
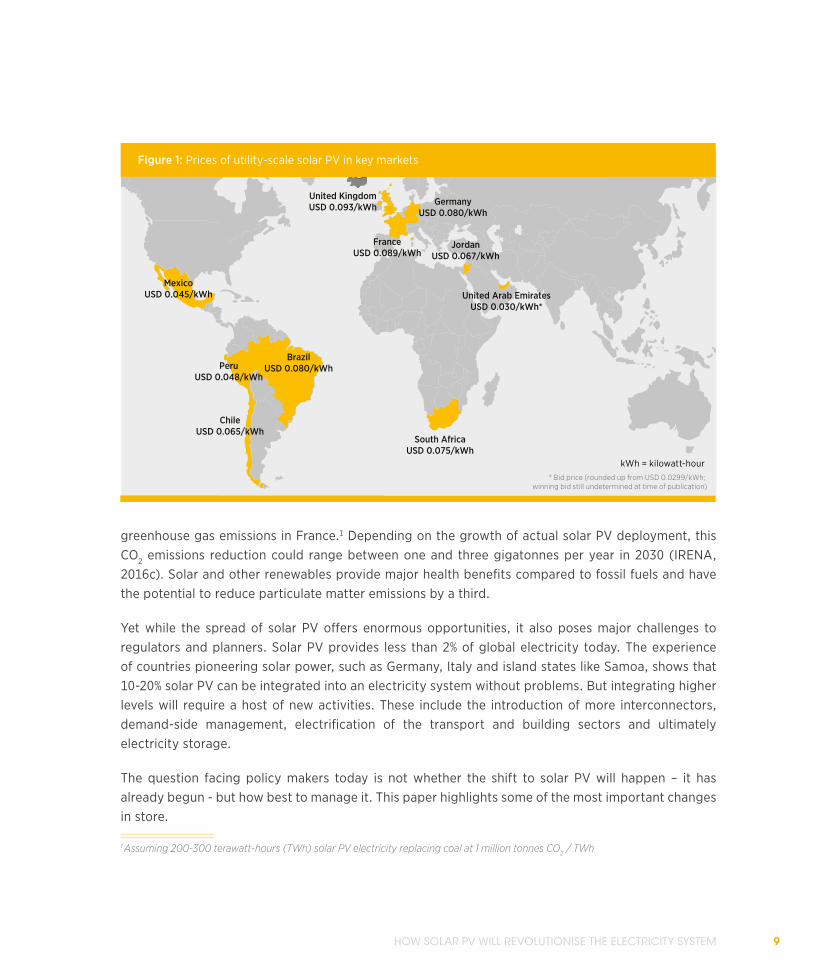
Figure 1: Prices of utility-scale solar PV in key markets
MexicoUSD 0.045/kWh
PeruUSD 0.048/kWh
BrazilUSD 0.080/kWh
ChileUSD 0.065/kWh
South AfricaUSD 0.075/kWh
United Arab EmiratesUSD 0.030/kWh*
JordanUSD 0.067/kWh
GermanyUSD 0.080/kWh
FranceUSD 0.089/kWh
United KingdomUSD 0.093/kWh
* Bid price (rounded up from USD 0.0299/kWh; winning bid still undetermined at time of publication)
kWh = kilowatt-hour
LETTING IN THE LIGHT10
“Between 2030 and 2050, we will see 10-30% of global energy demand covered by solar PV. Right now we are in an embryonic state compared to where we are going in a few decades.” — Eicke Weber, Director Fraunhofer ISE
DRAMATIC SHIFT IN SCALE World electricity demand is expected to grow by more than 50% between 2015 and 2030. Of that growth, 95% will be located in developing and emerging economies. In many of those countries, solar PV is likely to become a key source of electricity.
A recent report identified Brazil, Chile, Israel, Jordan, Mexico, the Philippines, the Russian Federation, Saudi Arabia, South Africa and Turkey as the most attractive markets for solar PV up to 2020 (IHS, 2015). IRENA estimates that solar PV capacity could reach between 1,760 GW and 2,500 GW in 2030, producing between 8% and 13% of global power generation. By comparison, Germany, Greece and Italy are the only three large electricity-consuming countries that exceeded 7% in 2015 (IEA-PVPS, 2016). Fulfilling the overall capacity potential of solar power means a seven- to eightfold increase, requiring average annual capacity additions to more than double, from 47 GW in 2015 to over 100 GW for the next 14 years. (IRENA, 2016a).
This growth is heralded by a continued rise in PV module capacity. The market for modules has changed from a situation of oversupply in 2013 to a supply/demand balance at around 65 GW, well above the 47 GW installed in 2015. Moreover, further capacity additions are planned for the coming years. New technologies will offer better performance and be available at a lower cost. The range of applications will expand, with PV increasingly integrated into buildings and installed on lakes and in lagoons.
SHOCK TO THE SYSTEM In most countries, historically, the electricity system has consisted of a few large power stations connected via transmission lines to local networks. These networks supplied electricity to industrial and residential consumers.2
2 Around 140 countries have electrification rates higher than 90%

HOW SOLAR PV WILL REVOLUTIONISE THE ELECTRICITY SYSTEM 11
Figure 2: Solar PV: Global installed capacity, 2006-2015, and possible investments to 2030
250
200
150
100
50
0
2500
2000
1500
1000
500
0
GW
2006 2007 2008 2009 2010 2011 2012 2013 2014 2015 2015 2030(Reference)
2030(REmap)
2030(Doubling)
Projections for 2030 are in accordance with IRENA’s REmap analysis.
The market structure evolved as the grids grew. Until the early 1990s, local or government-owned electric utilities operated as monopolies, which owned the generation, transmission and distribution networks. This meant utilities with centralised power stations and large grid infrastructures were considered a long-term but reliable investment opportunity with steady rates of return. Operational expenditures had to be kept under control, but fluctuations in fossil fuel prices could be passed on to the consumer.
In a growing number of countries ownership has been liberalised. Vertically integrated utilities have been broken down into separate companies. Different entities are now responsible for generation, managing and operating transmission and distribution networks, and selling electricity to consumers. Electricity is sold through a set of long-term contracts and day-ahead or spot markets Only a small number of generation companies are incentivised to invest in either: a) baseload power, producing a stable flow of electricity 24 hours per day; or b) load-following or peaker plants, which provide electricity when demand spikes.
With cost-competitive utility-scale solar PV power plants starting to replace fossil-fuel plants as the technology of choice, this existing paradigm is being challenged in a number of ways. Grid topology, market structure and power system operation all need adjustment. In the longer term, the spread of solar PV may even drive the relocation of economic activities to areas rich in solar resources.
LETTING IN THE LIGHT12
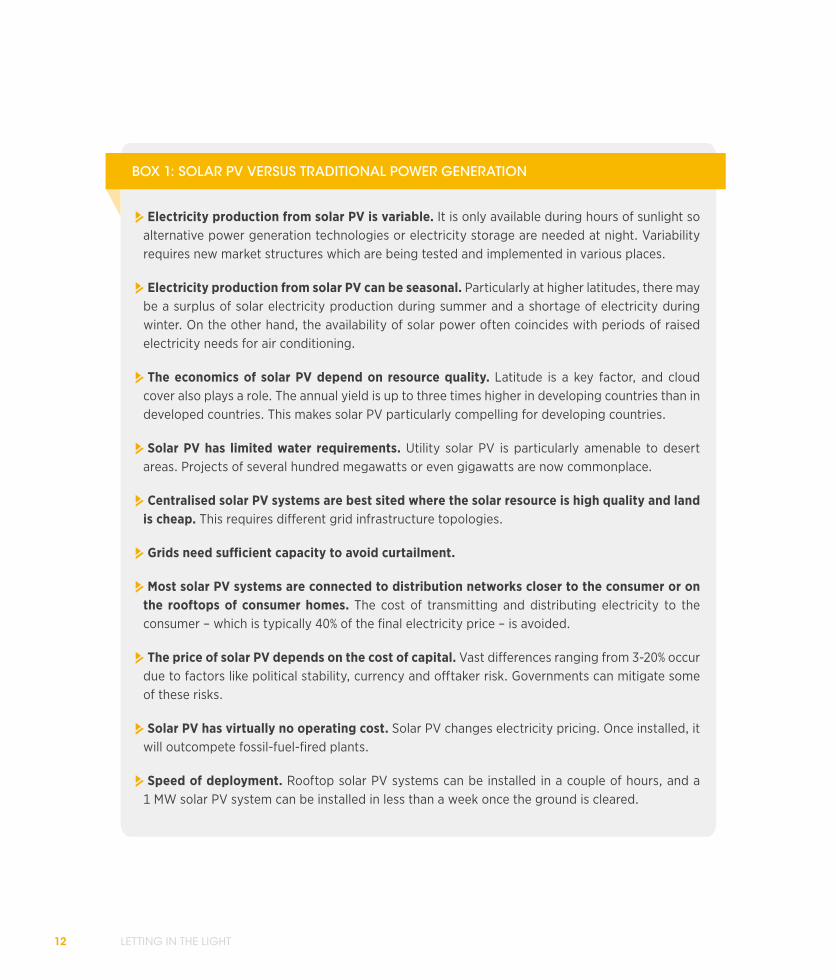
jElectricity production from solar PV is variable. It is only available during hours of sunlight so alternative power generation technologies or electricity storage are needed at night. Variability requires new market structures which are being tested and implemented in various places.
jElectricity production from solar PV can be seasonal. Particularly at higher latitudes, there may be a surplus of solar electricity production during summer and a shortage of electricity during winter. On the other hand, the availability of solar power often coincides with periods of raised electricity needs for air conditioning.
jThe economics of solar PV depend on resource quality. Latitude is a key factor, and cloud cover also plays a role. The annual yield is up to three times higher in developing countries than in developed countries. This makes solar PV particularly compelling for developing countries.
jSolar PV has limited water requirements. Utility solar PV is particularly amenable to desert areas. Projects of several hundred megawatts or even gigawatts are now commonplace.
jCentralised solar PV systems are best sited where the solar resource is high quality and land is cheap. This requires different grid infrastructure topologies.
jGrids need sufficient capacity to avoid curtailment.
jMost solar PV systems are connected to distribution networks closer to the consumer or on the rooftops of consumer homes. The cost of transmitting and distributing electricity to the consumer – which is typically 40% of the final electricity price – is avoided.
jThe price of solar PV depends on the cost of capital. Vast differences ranging from 3-20% occur due to factors like political stability, currency and offtaker risk. Governments can mitigate some of these risks.
jSolar PV has virtually no operating cost. Solar PV changes electricity pricing. Once installed, it will outcompete fossil-fuel-fired plants.
jSpeed of deployment. Rooftop solar PV systems can be installed in a couple of hours, and a 1 MW solar PV system can be installed in less than a week once the ground is cleared.
BOX 1: SOLAR PV VERSUS TRADITIONAL POWER GENERATION
HOW SOLAR PV WILL REVOLUTIONISE THE ELECTRICITY SYSTEM 13
REVOLUTION IN OWNERSHIPThese challenges become even greater in the next phase of solar power’s evolution, in which large-scale generation grows in tandem with an expanding, and increasingly distributed, network of small-scale solar PV installations.
Falling costs at utility scale have been matched by similarly dramatic decreases at the household and community level.
In Australia, Denmark, Germany, Italy, Spain, parts of the United States and many island states, small-scale solar PV systems already produce electricity more cheaply than buying it from the grid. In China and India, small-scale solar PV systems can be installed for around USD 1,500 per kilowatt (kW) (IRENA, 2016b). Residential-scale solar PV systems installed in Germany in 2015 averaged USD 1,600/kW. In Australia, the costs of residential solar PV rooftops declined from USD 7,157/kW in 2010 to USD 2,050/kW in 2015.
“PV prices are going down, and solar is now competing with other energies.” — Marcel Silva, Chilean Ministry of Energy
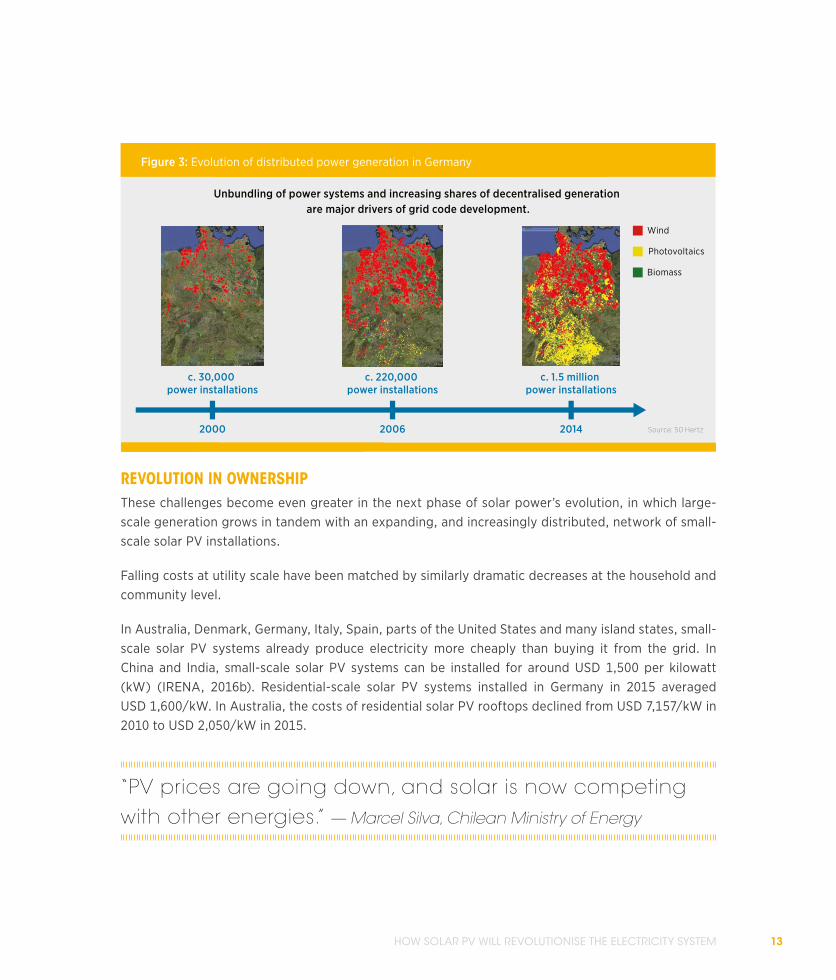
Figure 3: Evolution of distributed power generation in Germany
Unbundling of power systems and increasing shares of decentralised generation are major drivers of grid code development.
Biomass
Wind
Photovoltaics
c. 30,000 power installations
c. 220,000 power installations
c. 1.5 million power installations
2000 2006 2014 Source: 50 Hertz
LETTING IN THE LIGHT14
As prices have dropped, solar PV generation uptake by households and local communities has
increased dramatically. In 2015, around 30% of solar PV capacity installed worldwide involved systems
of of less than 100 kW (IHS, 2015). This is gradually changing the face of power system ownership.
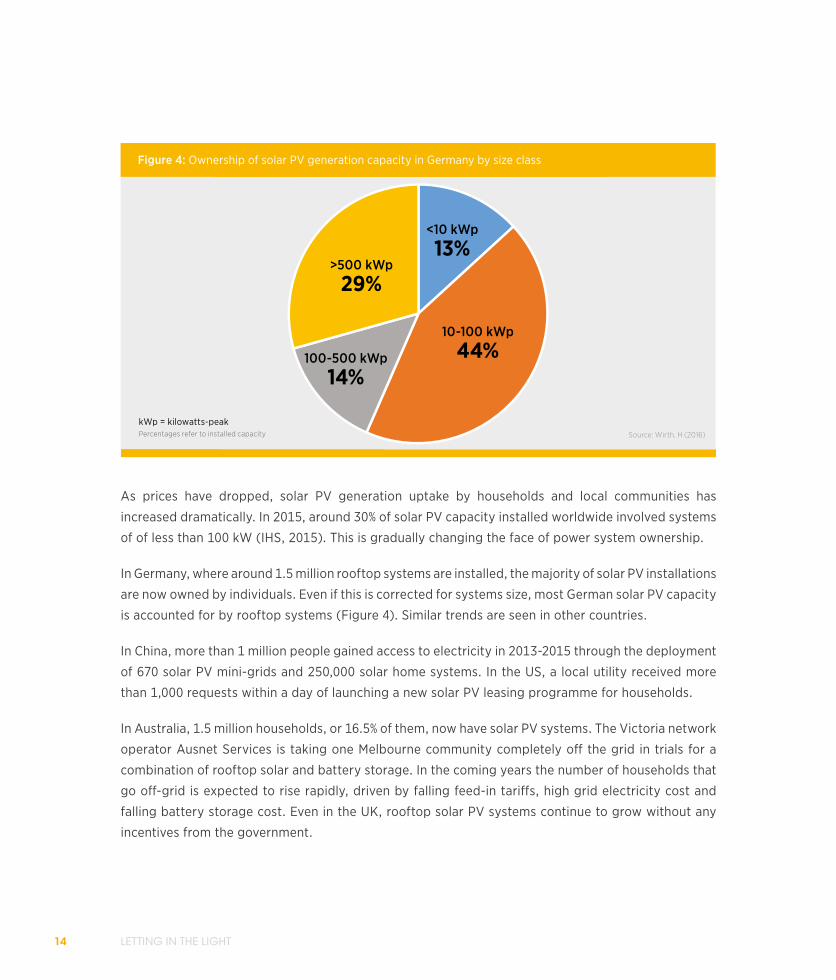
In Germany, where around 1.5 million rooftop systems are installed, the majority of solar PV installations
are now owned by individuals. Even if this is corrected for systems size, most German solar PV capacity
is accounted for by rooftop systems (Figure 4). Similar trends are seen in other countries.
In China, more than 1 million people gained access to electricity in 2013-2015 through the deployment
of 670 solar PV mini-grids and 250,000 solar home systems. In the US, a local utility received more
than 1,000 requests within a day of launching a new solar PV leasing programme for households.
In Australia, 1.5 million households, or 16.5% of them, now have solar PV systems. The Victoria network
operator Ausnet Services is taking one Melbourne community completely off the grid in trials for a
combination of rooftop solar and battery storage. In the coming years the number of households that
go off-grid is expected to rise rapidly, driven by falling feed-in tariffs, high grid electricity cost and
falling battery storage cost. Even in the UK, rooftop solar PV systems continue to grow without any
incentives from the government.
Figure 4: Ownership of solar PV generation capacity in Germany by size class
<10 kWp
13%>500 kWp
29%
100-500 kWp
14%
10-100 kWp
44%
kWp = kilowatts-peakSource: Wirth, H (2016)Percentages refer to installed capacity
HOW SOLAR PV WILL REVOLUTIONISE THE ELECTRICITY SYSTEM 15
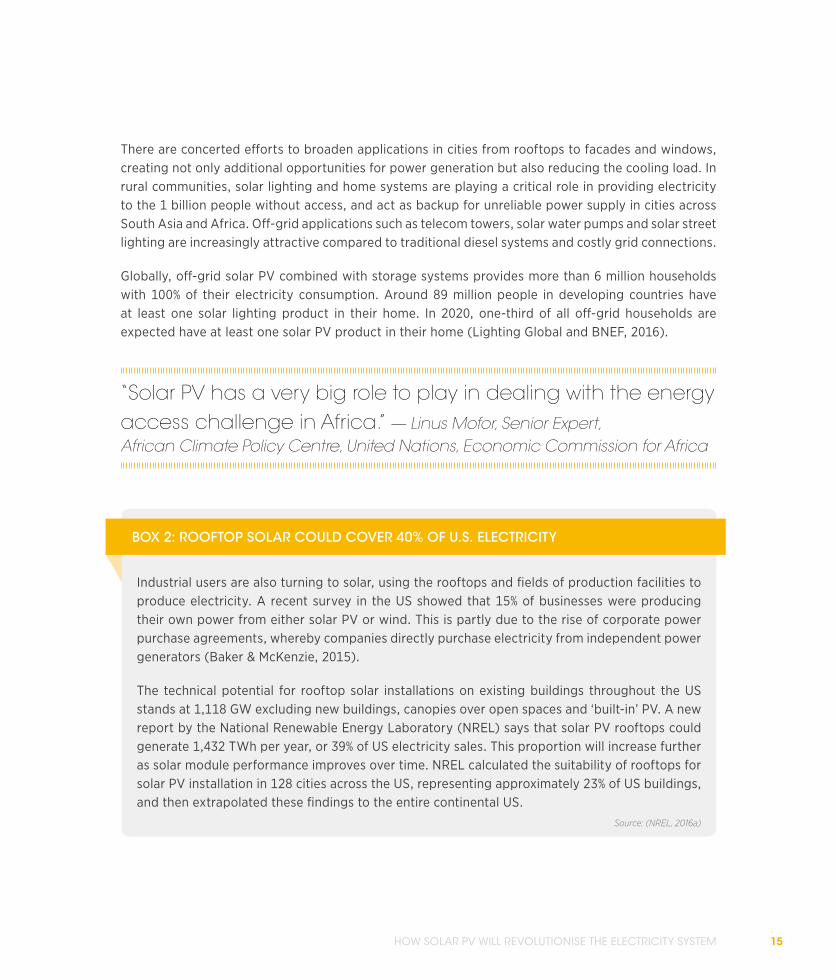
There are concerted efforts to broaden applications in cities from rooftops to facades and windows, creating not only additional opportunities for power generation but also reducing the cooling load. In rural communities, solar lighting and home systems are playing a critical role in providing electricity to the 1 billion people without access, and act as backup for unreliable power supply in cities across South Asia and Africa. Off-grid applications such as telecom towers, solar water pumps and solar street lighting are increasingly attractive compared to traditional diesel systems and costly grid connections.
Globally, off-grid solar PV combined with storage systems provides more than 6 million households with 100% of their electricity consumption. Around 89 million people in developing countries have at least one solar lighting product in their home. In 2020, one-third of all off-grid households are expected have at least one solar PV product in their home (Lighting Global and BNEF, 2016).
“Solar PV has a very big role to play in dealing with the energy access challenge in Africa.” — Linus Mofor, Senior Expert, African Climate Policy Centre, United Nations, Economic Commission for Africa
Industrial users are also turning to solar, using the rooftops and fields of production facilities to produce electricity. A recent survey in the US showed that 15% of businesses were producing their own power from either solar PV or wind. This is partly due to the rise of corporate power purchase agreements, whereby companies directly purchase electricity from independent power generators (Baker & McKenzie, 2015).
The technical potential for rooftop solar installations on existing buildings throughout the US stands at 1,118 GW excluding new buildings, canopies over open spaces and ‘built-in’ PV. A new report by the National Renewable Energy Laboratory (NREL) says that solar PV rooftops could generate 1,432 TWh per year, or 39% of US electricity sales. This proportion will increase further as solar module performance improves over time. NREL calculated the suitability of rooftops for solar PV installation in 128 cities across the US, representing approximately 23% of US buildings, and then extrapolated these findings to the entire continental US.
Source: (NREL, 2016a)
BOX 2: ROOFTOP SOLAR COULD COVER 40% OF U.S. ELECTRICITY
LETTING IN THE LIGHT16
TRADITIONAL BUSINESS MODELS UNDER PRESSUREThe increasingly localised production of solar PV is having a profound impact on energy companies, markets and regulators. What was essentially a command-and-control system is transforming into a vast, complex and rapidly evolving real-time marketplace, involving millions of individual players. Some welcome this as the democratisation of energy. Others fear it could usher in a period of uncertainty.
As consumers become producers, distributors have to deal with electricity flowing both ways, both to and from their homes. In countries with limited electricity demand growth, such as the US and much of Europe, solar PV panels are creating an oversupply of power generation capacity at certain times. This reduces the peak prices that have traditionally supported utility power stations, while the kilowatt-hours sold from their power stations also decline. Some regulators warn that this is creating growing waste and rising grid-management challenges.
Power system operators are accustomed to dealing with variable power flows, and in general variability in demand is larger than variability in supply. But solar demands a rethink of many traditional concepts.
Traditional models use a mix of baseload plants, which have low variable costs when running at full capacity, and ‘peaking power plants’. These have higher running costs but are able to ramp up and down quickly to match demand. Operational needs are predicted far in advance, on the basis of past trends. In between baseload and peak, flexible ‘load-following plants’ are employed to meet demand as it fluctuates during the day. Some reserve capacity is maintained above the peak demand level to deal with plant failures and extreme demand levels.
Variable renewable energy (VRE) generators make baseload redundant. They also squeeze the operating hours for load-following power plants in the electricity markets. When there is a low VRE share, VRE facilities often compete with load-following and peaking plants such as flexible gas-fired power stations. As the share of VRE increases, it starts to squeeze out baseload power plants. At that point, the complementarity between VRE and flexible power plants becomes more important (IRENA, 2015a).
“Baseload is no longer a significant concept when the lowest marginal cost is achieved by solar and wind technologies with no fuel needs.” — Tomas Kåberger, Chair of Executive Board, Renewable Energy Institute, Tokyo
HOW SOLAR PV WILL REVOLUTIONISE THE ELECTRICITY SYSTEM 17
In countries with solar PV penetration levels of 5-10%, the market is already changing. The appearance of VRE, including solar PV, has resulted in new intra-day markets, some operating at less than an hour ahead of time. New capacity and ancillary grid services have emerged. While opinions differ about critical market design elements, there is general agreement that an adjustment is needed as the proportion of variable renewable power rises significantly.
The price of wholesale electricity has tended to fall as the VRE share has grown. Solar PV, in particular, reduces daytime electricity prices. In Germany, for example, the spread between peak and off-peak spot prices has declined because solar PV systems are producing electricity when demand is high.
In recent years, this has reduced the arbitrage potential for energy storage facilities like pumped-storage hydropower plants to a point that new plant investment is unprofitable (FfE, 2014). As the share of solar PV rises, the trend could change again, with pumped-storage hydroelectricity becoming an attractive option to help balance the variability of solar PV.
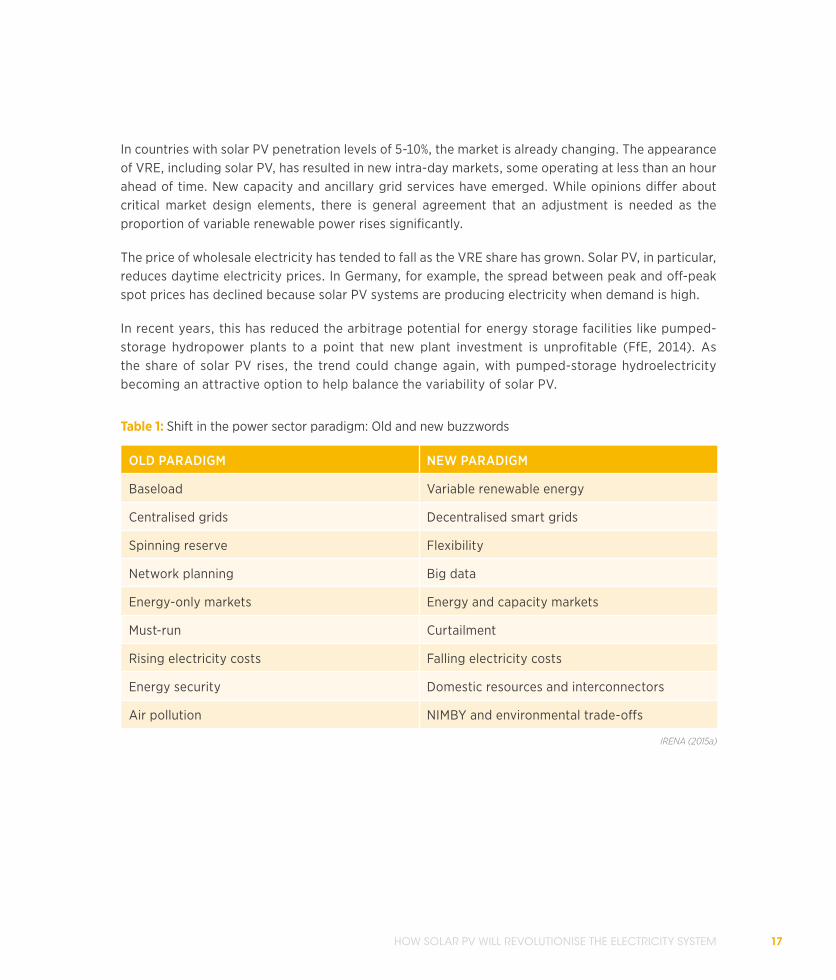
OLD PARADIGM NEW PARADIGM
Baseload Variable renewable energy
Centralised grids Decentralised smart grids
Spinning reserve Flexibility
Network planning Big data
Energy-only markets Energy and capacity markets
Must-run Curtailment
Rising electricity costs Falling electricity costs
Energy security Domestic resources and interconnectors
Air pollution NIMBY and environmental trade-offs
IRENA (2015a)
Table 1: Shift in the power sector paradigm: Old and new buzzwords
LETTING IN THE LIGHT18
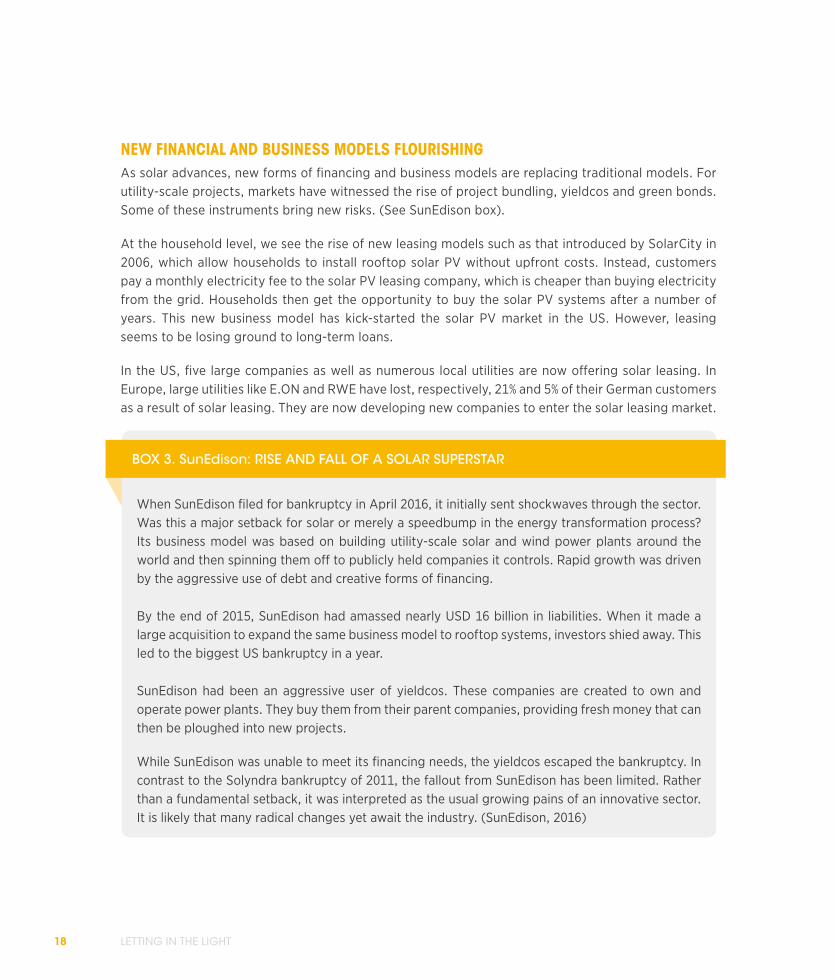
NEW FINANCIAL AND BUSINESS MODELS FLOURISHINGAs solar advances, new forms of financing and business models are replacing traditional models. For utility-scale projects, markets have witnessed the rise of project bundling, yieldcos and green bonds. Some of these instruments bring new risks. (See SunEdison box).
At the household level, we see the rise of new leasing models such as that introduced by SolarCity in 2006, which allow households to install rooftop solar PV without upfront costs. Instead, customers pay a monthly electricity fee to the solar PV leasing company, which is cheaper than buying electricity from the grid. Households then get the opportunity to buy the solar PV systems after a number of years. This new business model has kick-started the solar PV market in the US. However, leasing seems to be losing ground to long-term loans.
In the US, five large companies as well as numerous local utilities are now offering solar leasing. In Europe, large utilities like E.ON and RWE have lost, respectively, 21% and 5% of their German customers as a result of solar leasing. They are now developing new companies to enter the solar leasing market.
When SunEdison filed for bankruptcy in April 2016, it initially sent shockwaves through the sector. Was this a major setback for solar or merely a speedbump in the energy transformation process? Its business model was based on building utility-scale solar and wind power plants around the world and then spinning them off to publicly held companies it controls. Rapid growth was driven by the aggressive use of debt and creative forms of financing.
By the end of 2015, SunEdison had amassed nearly USD 16 billion in liabilities. When it made a large acquisition to expand the same business model to rooftop systems, investors shied away. This led to the biggest US bankruptcy in a year.
SunEdison had been an aggressive user of yieldcos. These companies are created to own and operate power plants. They buy them from their parent companies, providing fresh money that can then be ploughed into new projects.
While SunEdison was unable to meet its financing needs, the yieldcos escaped the bankruptcy. In contrast to the Solyndra bankruptcy of 2011, the fallout from SunEdison has been limited. Rather than a fundamental setback, it was interpreted as the usual growing pains of an innovative sector. It is likely that many radical changes yet await the industry. (SunEdison, 2016)
BOX 3. SunEdison: RISE AND FALL OF A SOLAR SUPERSTAR
HOW SOLAR PV WILL REVOLUTIONISE THE ELECTRICITY SYSTEM 19
“The way in which we use energy, in which we trade energy, in which we dispatch energy will all change. It’s already changing around us.” — Paddy Padmanathan, CEO, ACWA Power
On top of this, smart grid technologies combined with electricity storage at a decentralised level are allowing the creation of virtual communities of solar PV owners who effectively share electricity through the existing grid. According to this model, consumers can buy and sell electricity from each other by trading the electricity contained in their batteries (Martin, Richard, 2015).
INTEGRATION WITH OLD TECHNOLOGIESDespite these shifts, utility-scale solar and small-scale production will not be sufficient between them to meet demand for some time. While renewable energy has begun to dominate new electricity capacity, its contribution is still low compared to total installed capacity and power generation. Furthermore, solar PV systems cannot produce electricity every single hour of the year. The share of solar PV in most countries will remain well below 20% until 2030.
Similarly, rooftop solar PV does not make grid infrastructure obsolete; on the contrary, the grid becomes even more important. Most households will be able to satisfy up to 40% of their annual electricity demand by installing solar PV systems, which means that 60% will still need to be supplied from elsewhere. Most households with rooftop PV produce at certain times more electricity than they consume, resulting in large flows to the grid.
Consequently, grid connections will be maintained but the remuneration will have to be adjusted. At the moment, grid costs are in most cases paid by the consumer through a kilowatt-hour consumption levy. If some users drop their consumption, the cost rises for the rest. Net metering allows power generation by consumers to increase dramatically; but new cost allocation models or self-consumption policies may be needed if the share of self-production rises significantly (IEA-PVPS, 2016). A significant fixed monthly fee plus a lower charge per kilowatt-hour is one alternative tariff model.
The higher share of rooftop solar PV also has important implications for industry, which accounts for up to half of electricity demand and needs reliable power 24 hours a day. Localised solar PV electricity production in distribution networks will not be sufficient, for example, to satisfy electricity-intensive industrial production processes like aluminium smelters. At the same time, the economics of heat
LETTING IN THE LIGHT20
and power cogeneration at conventional baseload plants deteriorate as VRE depresses wholesale electricity prices, so energy supply decision-making for industry becomes more complex.
Instead of replacing centralised electricity production altogether, it is expected that both centralised and distributed production will live side by side, which means they will need to be co-ordinated.
A smart and strong grid infrastructure will be essential to ensure synergies.
The solar age affects not just national and local electricity markets but the international system. The world faces a cascade of interrelated changes at all levels, from individual households and appliances all the way up to relationships between nations.
Going up the chain, solar PV deployment at the consumer level (household/community/commercial users) is putting pressure on network operators and the way national electricity systems are traditionally managed and governed. This is brought about by new developments in electricity storage, electric vehicles and smart appliances. The growth of solar PV and other renewable energy sources will eventually change the generation mix and improve each country’s electricity security (IRENA and IEA, 2016). It will eventually shift the balance of power between nations.
International political initiatives like the International Solar Alliance, China’s concept of a green silk route, and Desertec have gained prominence. In addition, international business alliances such as the Terawatt Initiative have formed as emerging solar powers seek to shape the energy landscape (see Box 3). Solar PV is also a major industrial activity, which creates jobs along the supply chain.
Today, the vast majority of PV production is located in China. But this could change in future, and Chinese companies have already announced capacity expansion plans in India, Malaysia, the Philippines and Vietnam. As countries continue to position and align themselves with solar PV as their common denominator, new market designs and enabling frameworks will gain credibility and global recognition. This will boost the confidence of investors to continue investing in solar PV projects.
DRIVING SOLAR PV FORWARDThe solar PV revolution has just begun, and the technology continues to advance quickly.
National governments spent at least USD 924 million on solar PV research and development (R&D) programmes in 2014 led by the US, Japan, Germany and South Korea (McCormick et al, 2016). These efforts, combined with global competition between solar PV manufacturers, appear set to significantly increase the potential for solar PV.
HOW SOLAR PV WILL REVOLUTIONISE THE ELECTRICITY SYSTEM 21
Increases in the efficiency of conventional crystalline silicon (c-Si) solar PV panels, alongside developments in concentrated solar PV3 and the emergence of new types of modules continue to improve energy yields. This is important for environments with limited space such as residential rooftops and cities, and is likely to prompt a wealth of new applications. Thin-film cadmium telluride (CdTe) and copper indium gallium selenide (CIGS) are already commercially available. Many other materials are in development and are close to commercialisation. Most prominently, these include perovskites and multi-junction cells.
PV efficiencies in the range of 40-50% will allow for radically different uses, such as integration into electric vehicles, making them more autonomous. Lower costs will allow solar to be integrated over large surface areas such as along motorways and in walls. New thin-film technologies and organic cells can further reduce the cost of cells and improve their weight or flexibility. Furthermore, PV yields could be much higher in situations when the sun is not at a favourable angle.
This opens up fascinating new opportunities for solar PV deployment in urban environments and allows electricity to be harvested without the need to create new infrastructure. Zero-energy buildings will become the new standard in the EU after 2020. If adopted more widely, this could completely change the outlook for distributed networks serving residential loads.
At the other end of the spectrum, solar PV systems are already moving from ground-mounted systems to deployment on lakes and oceans. In hydropower plant and reservoir dams in Brazil and Japan, freshwater reserves are already covered with floating solar PV panels. The next frontier is solar PV panel deployment in space, in order to feed electricity back to earth.
Innovation will not only continue to shape solar PV technologies and their applications but will also be needed to strengthen the supply chain of solar PV systems from cradle to grave. This includes innovation in material sciences and recycling techniques to continue to improve the environmental and resource sustainability of the materials (IEA-PVPS, 2015a). Innovations in solar forecasting and software development for siting, operating and maintaining solar PV systems will ensure maximum benefit from the projects on the ground
Different solar PV technologies are finding new ways to co-exist with other technologies. Hybrid power systems using solar PV, wind, biomass, geothermal, hydropower and ocean energy technologies will tend to be more robust and less costly than those entirely relying on solar PV and batteries.
3 Concentrated solar PV systems consist of PV panels with built-in lenses or added mirrors, which concentrate sunshine onto the PV cells or modules.
LETTING IN THE LIGHT22
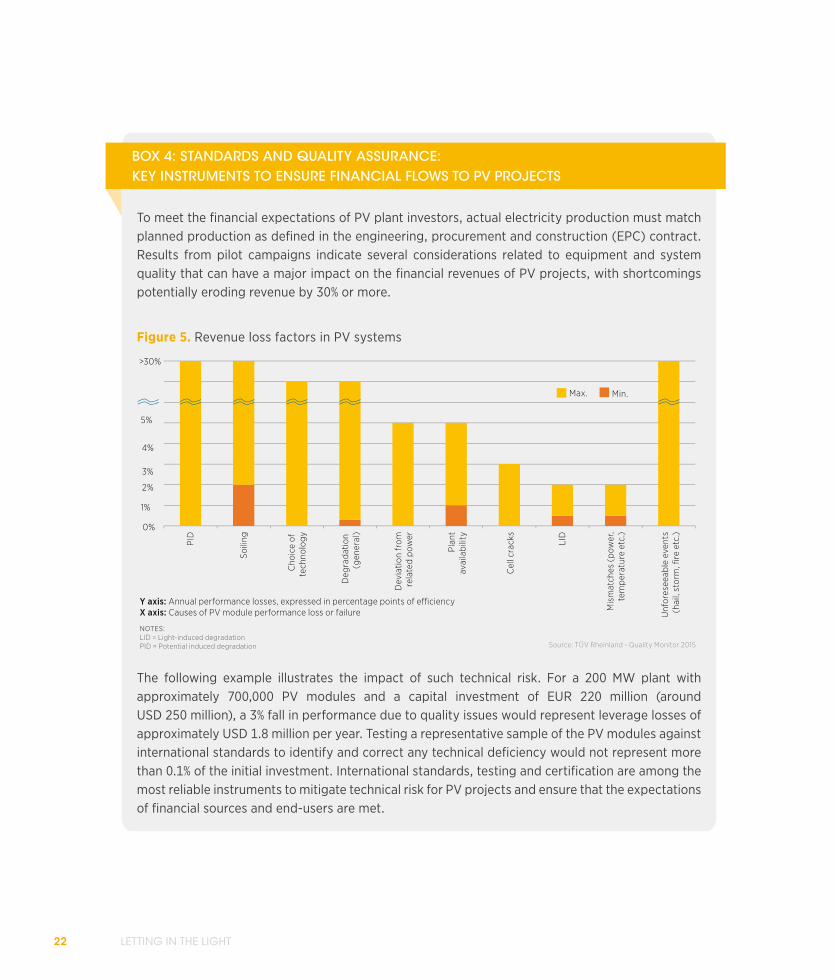
To meet the financial expectations of PV plant investors, actual electricity production must match planned production as defined in the engineering, procurement and construction (EPC) contract. Results from pilot campaigns indicate several considerations related to equipment and system quality that can have a major impact on the financial revenues of PV projects, with shortcomings potentially eroding revenue by 30% or more.
Figure 5. Revenue loss factors in PV systems
The following example illustrates the impact of such technical risk. For a 200 MW plant with approximately 700,000 PV modules and a capital investment of EUR 220 million (around USD 250 million), a 3% fall in performance due to quality issues would represent leverage losses of approximately USD 1.8 million per year. Testing a representative sample of the PV modules against international standards to identify and correct any technical deficiency would not represent more than 0.1% of the initial investment. International standards, testing and certification are among the most reliable instruments to mitigate technical risk for PV projects and ensure that the expectations of financial sources and end-users are met.
BOX 4: STANDARDS AND QUALITY ASSURANCE: KEY INSTRUMENTS TO ENSURE FINANCIAL FLOWS TO PV PROJECTS
1%
2%
3%
4%
5%
>30%
0%
PID
Soili
ng
Cho
ice
of
tech
nolo
gy
Deg
rada
tion
(gen
eral
)
Dev
iatio
n fr
omre
late
d po
wer
Pla
ntav
aila
bilit
y
Cel
l cra
cks
LID
Mis
mat
ches
(po
wer
,te
mpe
ratu
re e
tc.)
Unf
ores
eeab
le e
vent
s(h
ail,
stor
m, fi
re e
tc.)
Max.
Source: TÜV Rheinland - Quality Monitor 2015
Min.
Y axis: Annual performance losses, expressed in percentage points of e�ciencyX axis: Causes of PV module performance loss or failure
NOTES:LID = Light-induced degradationPID = Potential induced degradation
HOW SOLAR PV WILL REVOLUTIONISE THE ELECTRICITY SYSTEM 23
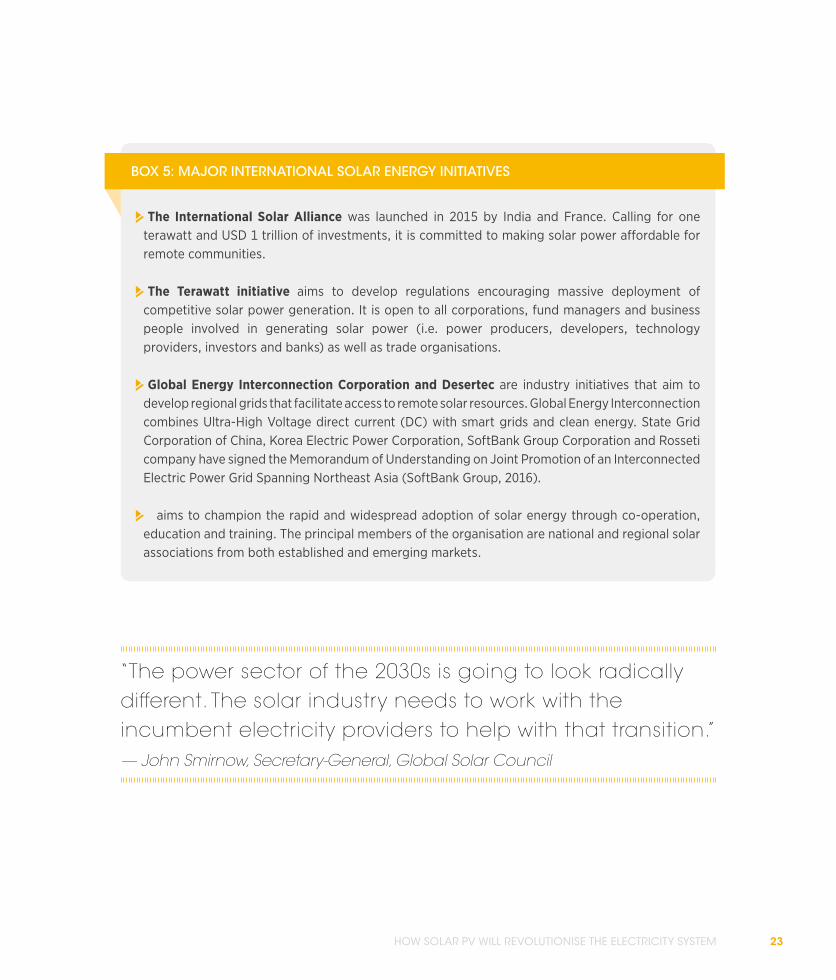
jThe International Solar Alliance was launched in 2015 by India and France. Calling for one terawatt and USD 1 trillion of investments, it is committed to making solar power affordable for remote communities.
jThe Terawatt initiative aims to develop regulations encouraging massive deployment of competitive solar power generation. It is open to all corporations, fund managers and business people involved in generating solar power (i.e. power producers, developers, technology providers, investors and banks) as well as trade organisations.
jGlobal Energy Interconnection Corporation and Desertec are industry initiatives that aim to develop regional grids that facilitate access to remote solar resources. Global Energy Interconnection combines Ultra-High Voltage direct current (DC) with smart grids and clean energy. State Grid Corporation of China, Korea Electric Power Corporation, SoftBank Group Corporation and Rosseti company have signed the Memorandum of Understanding on Joint Promotion of an Interconnected Electric Power Grid Spanning Northeast Asia (SoftBank Group, 2016).
j aims to champion the rapid and widespread adoption of solar energy through co-operation, education and training. The principal members of the organisation are national and regional solar associations from both established and emerging markets.
BOX 5: MAJOR INTERNATIONAL SOLAR ENERGY INITIATIVES
“The power sector of the 2030s is going to look radically different. The solar industry needs to work with the incumbent electricity providers to help with that transition.” — John Smirnow, Secretary-General, Global Solar Council
LETTING IN THE LIGHT24
“Solar PV will be cheaper; we are expecting
that within a year or so it will be on par with
conventional power price. If advanced technology
comes up, costs may come down. If financial
investment comes up, cost will come down. If
strong policy and renewable purchase obligations
are there, which will be made mandatory, these
increase the confidence level of private sector
developers and the cost will come down.”
— DK Khare, scientist, Ministry of New and Renewable Energy,
Government of India

HOW SOLAR PV WILL REVOLUTIONISE THE ELECTRICITY SYSTEM 25
THE ROAD AHEAD

LETTING IN THE LIGHT26
27
THE ROAD AHEADFaced with far-reaching changes, policy makers will need to reconsider a wide array of existing policies.
j Policies should be updated based on the latest technology insights and planning techniques. Energy agencies are encouraged to improve their solar PV forecasting and take recent and short-term projected market growth into account. Energy planning and predictions should consider state-of-the-art tools accounting for the characteristics of variable solar. Energy plans and policies should also incorporate the broader positive macroeconomic and societal impacts of solar.
j Governments need to encourage and support continued research, development and demonstration activities to continue the exploration of advanced solar PV options. There are significant opportunities for reducing cost through best practice and innovation. Markets should be developed to allow further price reductions.
j Solar PV panels require a global framework for standards and quality assurance. The market for solar PV is increasingly global and requires international standards as well as a resilient national quality assurance infrastructure. Standards and quality infrastructure for components and systems is critical to ensuring investor confidence.
j Integration of solar PV into the electricity system deserves special attention:
• The deployment of distributed solar PV requires fundamental market changes. There are technological solutions for connecting and managing power grids with a high share of solar PV. However, the engagement of households and industries in the production of electricity will require new regulation and market structures. Markets need to be designed to facilitate private sector operators and create a level playing field. Free global trade in components tends to reduce cost. Ideally panels should be sourced from anywhere but systems assembled and installed locally.
• Grids, smart grids and storage technologies allow high shares of solar PV to be efficiently integrated into pre-existing power systems. Enabling (smart) grids and storage technologies will accelerate the deployment of solar PV and improve the reliability and efficiency of power systems. Demonstration projects are important to creating the necessary human capacity to take advantage of the multiple co-benefits these technologies provide. Enabling grid infrastructure must be put in place, including strengthened interconnectors with neighbouring grids and countries where applicable. Access to land and rooftops is critical, as well as priority grid access.
• Solar PV deployment should be combined with end-use electrification rollout. Electric vehicles, hot water supply and flexible demand for electricity energy services like cooling and refrigeration can facilitate a much higher proportion of solar PV. The conversion of solar electricity to products like hydrogen can make a contribution once the solar PV share exceeds 15%.
LETTING IN THE LIGHT28
SOLAR PV: THE TECHNOLOGYWhile silicon solar PV has achieved maturity as a technology, the technical limits of other solar PV technologies are far from being met. Low-cost and high-efficiency cells are at different stages of development. Technological advances are making an increasing difference to smart grids, storage, operation and recycling.
PV technology systems have come a long way. The PV effect was first discovered at the end of the 19th century, and its mechanics understood in the early 20th century. The first silicon monocrystalline cell was created in 1941, opening the door to the multi-megawatt solar PV farms of today. Basic R&D in semiconductors for industries like information and communication technology, followed by applied R&D in aerospace, culminated in today’s power generation technology.
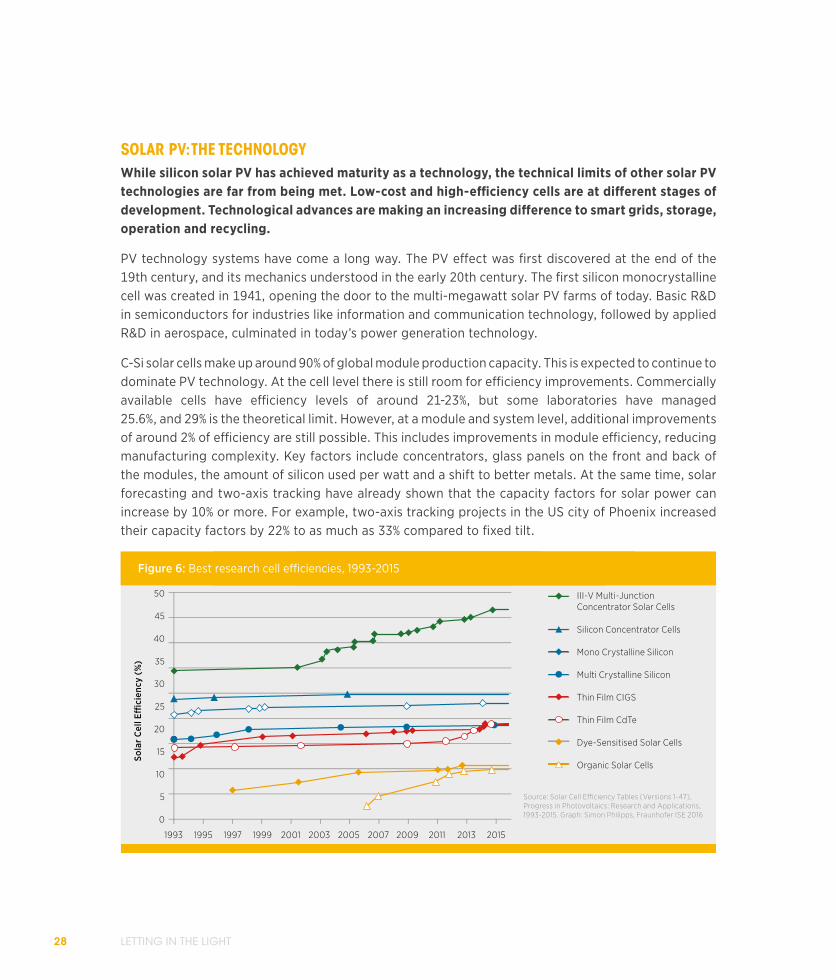
C-Si solar cells make up around 90% of global module production capacity. This is expected to continue to dominate PV technology. At the cell level there is still room for efficiency improvements. Commercially available cells have efficiency levels of around 21-23%, but some laboratories have managed 25.6%, and 29% is the theoretical limit. However, at a module and system level, additional improvements of around 2% of efficiency are still possible. This includes improvements in module efficiency, reducing manufacturing complexity. Key factors include concentrators, glass panels on the front and back of the modules, the amount of silicon used per watt and a shift to better metals. At the same time, solar forecasting and two-axis tracking have already shown that the capacity factors for solar power can increase by 10% or more. For example, two-axis tracking projects in the US city of Phoenix increased their capacity factors by 22% to as much as 33% compared to fixed tilt.
Figure 6: Best research cell e�ciencies, 1993-2015
Source: Solar Cell E�ciency Tables (Versions 1-47), Progress in Photovoltaics: Research and Applications, 1993-2015. Graph: Simon Philipps, Fraunhofer ISE 2016
50
45
40
35
30
25
20
15
10
5
0
Sola
r Cel
l E�
cien
cy (
%)
1993 1995 1997 1999 2001 2003 2005 2007 2009 2011 2013 2015
III-V Multi-Junction Concentrator Solar Cells
Silicon Concentrator Cells
Mono Crystalline Silicon
Multi Crystalline Silicon
Thin Film CIGS
Thin Film CdTe
Dye-Sensitised Solar Cells
Organic Solar Cells
HOW SOLAR PV WILL REVOLUTIONISE THE ELECTRICITY SYSTEM 29
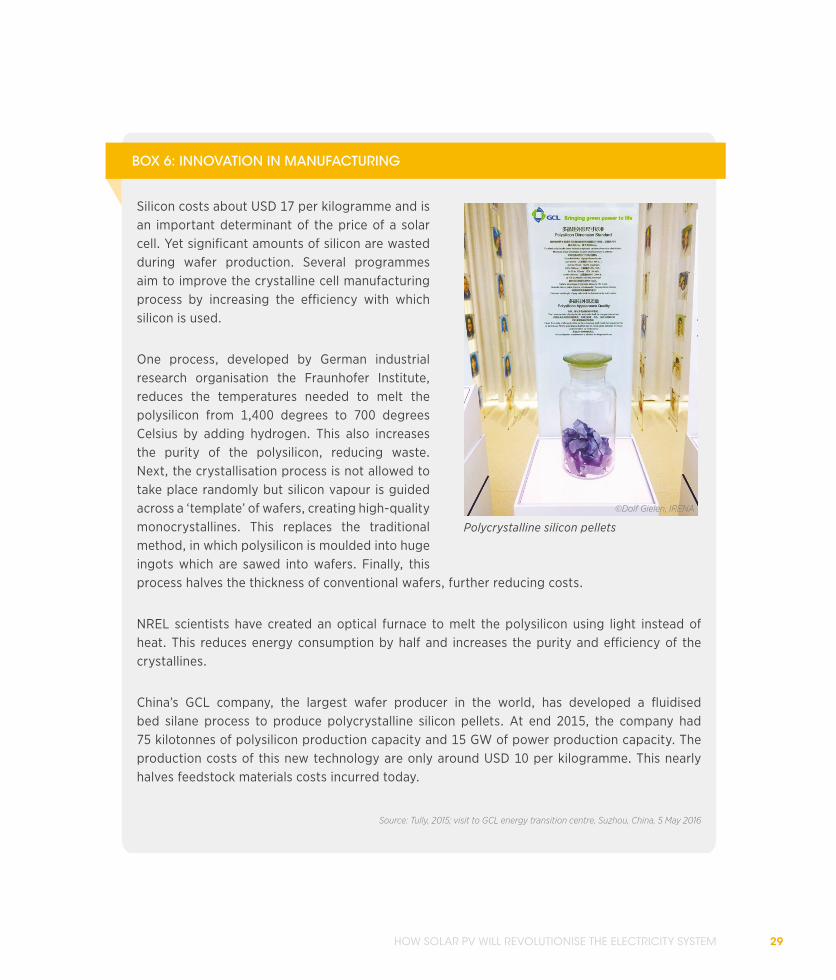
Silicon costs about USD 17 per kilogramme and is an important determinant of the price of a solar cell. Yet significant amounts of silicon are wasted during wafer production. Several programmes aim to improve the crystalline cell manufacturing process by increasing the efficiency with which silicon is used.
One process, developed by German industrial research organisation the Fraunhofer Institute, reduces the temperatures needed to melt the polysilicon from 1,400 degrees to 700 degrees Celsius by adding hydrogen. This also increases the purity of the polysilicon, reducing waste. Next, the crystallisation process is not allowed to take place randomly but silicon vapour is guided across a ‘template’ of wafers, creating high-quality monocrystallines. This replaces the traditional method, in which polysilicon is moulded into huge ingots which are sawed into wafers. Finally, this process halves the thickness of conventional wafers, further reducing costs.
NREL scientists have created an optical furnace to melt the polysilicon using light instead of heat. This reduces energy consumption by half and increases the purity and efficiency of the crystallines.
China’s GCL company, the largest wafer producer in the world, has developed a fluidised bed silane process to produce polycrystalline silicon pellets. At end 2015, the company had 75 kilotonnes of polysilicon production capacity and 15 GW of power production capacity. The production costs of this new technology are only around USD 10 per kilogramme. This nearly halves feedstock materials costs incurred today.
Source: Tully, 2015; visit to GCL energy transition centre, Suzhou, China, 5 May 2016
BOX 6: INNOVATION IN MANUFACTURING
Polycrystalline silicon pellets
©Dolf Gielen, IRENA
LETTING IN THE LIGHT30
Research in thin-film PV technologies is also progressings. Amorphous silicon (a-Si) is now rivalled by CIGS and CdTe (Massachusetts Institute of Technology Energy Initiative, 2015 and NREL, 2016b). Both have achieved cell efficiencies of 22% compared with a-Si efficiency of 13% in laboratories (NREL, 2015). However, there are still issues with CdTe breakage and disposal due to the use of cadmium. Whereas silicon wafers have a thickness of 180 micrometres, thin-film technologies are only 3 micrometres thick. Emerging thin-film technologies have reached a thickness of 0.6 micrometres, which could open up a completely new set of applications.
Both crystalline and thin-film solar PV technologies are experiencing continuous improvements. For example, for instance, passivated emitter rear contact (PERC) cells are enhanced silicon crystalline cells with efficiencies of up to 21.7% higher. Research is ongoing in high-efficiency cells, such as multi-junction cells. These have already been shown to boost efficiencies to 46% with concentrator and 38% without concentrator (Green et al., 2016). At the same time, significant research into low-cost alternatives is in progress. Perovskite cells are among the promising technologies under examination and are based on low-cost materials. Their efficiency in laboratory conditions has improved dramatically from 14% to 22% for the last three years and has further upward potential. However, some practical issues still remain concerning their stability and sensitivity to moisture. Organic cells and dye-sensitised cells are lightweight and flexible and have the potential to be produced very cheaply but their efficiency has not exceeded 12% in laboratory conditions. Researchers are also exploring the use of quantum dots to create PV systems. In theory, these cells have efficiencies of 60% or more but have achieved around 10% efficiency in laboratories.
A factor that is less well understood is the quality of equipment and installation. Deterioration, delamination and structural deterioration can affect the yield over time. Poor installation practices for example can result in a variability of output of 10% or more, under similar conditions.
Today’s modules are typically guaranteed for 25 years. As solar PV is new and technology is evolving rapidly, tests can only provide a proxy for how long solar fields will last. Many are expected to last well over 25 years. Once PV life span is better understood, cost estimates per kilowatt-hour of solar PV generation may further decrease. As the market for ageing projects evolves, interest in sustained quality over time is on the rise.
ImplicationsFirst and foremost, technology costs will continue to fall. The increased energy efficiency of conventional c-Si solar PV panels will allow cheaper and more electricity production per panel. New thin-film technologies and organic cells can further reduce the cost of modules and cut the need for costly support structures for certain applications.
HOW SOLAR PV WILL REVOLUTIONISE THE ELECTRICITY SYSTEM 31
In addition, the yield per area unit will continue to increase. This can be important where space is constrained, such as in urban environments. Today, a single solar PV panel produces around 250-300 W while multi-junction solar PV would produce 600 W per panel. For many households, this means that annual electricity production from their rooftop (assuming ten panels) could increase from 4,000 kWh to 8,000 kWh. For most households, this would be more than enough to cover annual electricity demand.
On the other hand, low-cost solar PV panels will allow for a wider set of applications, such as the incorporation of thin-film technologies into building and road infrastructure or vehicles. This development will allow electricity to be harvested without the need to create new infrastructure.
As solar PV deployment increases, the technological challenges will also change. For example, the solar industry will need to integrate PV into building materials for houses and roads, develop new technologies and processes for recycling PV panels, and continue improving system integration technologies.
A critical milestone has been reached in cadmium telluride (CdTe) solar cell technology that will help pave the way for solar energy to directly compete with electricity generated from conventional energy sources. CdTe solar cells offer a low-cost alternative. These cells also have the lowest carbon footprint and adapt better than silicon in real-world conditions including hot humid weather and low light.
A research team from NREL collaborating with other institutes has improved the maximum voltage available from a CdTe solar cell, which is a key factor in the improvement of solar cell efficiency. The project has shifted away from one of the standard processing steps by using cadmium chloride. However, CdTe solar cells have not been as efficient as multi- crystalline silicon solar cells until recently. One key area in which CdTe has underperformed is the maximum voltage available from the solar cell, a measure called open-circuit voltage. This innovation establishes new research paths for solar cells to become more efficient and provide electricity at lower cost.
The toxicity of cadmium, a heavy metal, is another challenge. The development of other types of materials could avoid future waste treatment problems. If CdTe is deployed on a wide scale, the simultaneous development of a robust collection and waste treatment chain is essential. To cover such costs, some governments have already established a levy on the sale of any type of solar panel.
Source: NREL, 2016b
BOX 7: CdTe SOLAR CELLS
LETTING IN THE LIGHT32
SOLAR PV: THE ECONOMICSUtility-scale solar PV projects are already economically competitive, but considerable opportunities remain to reduce the cost of residential-scale solar PV. Globally, the shift to new finance and business models will play a growing part in reducing costs and increasing benefits.
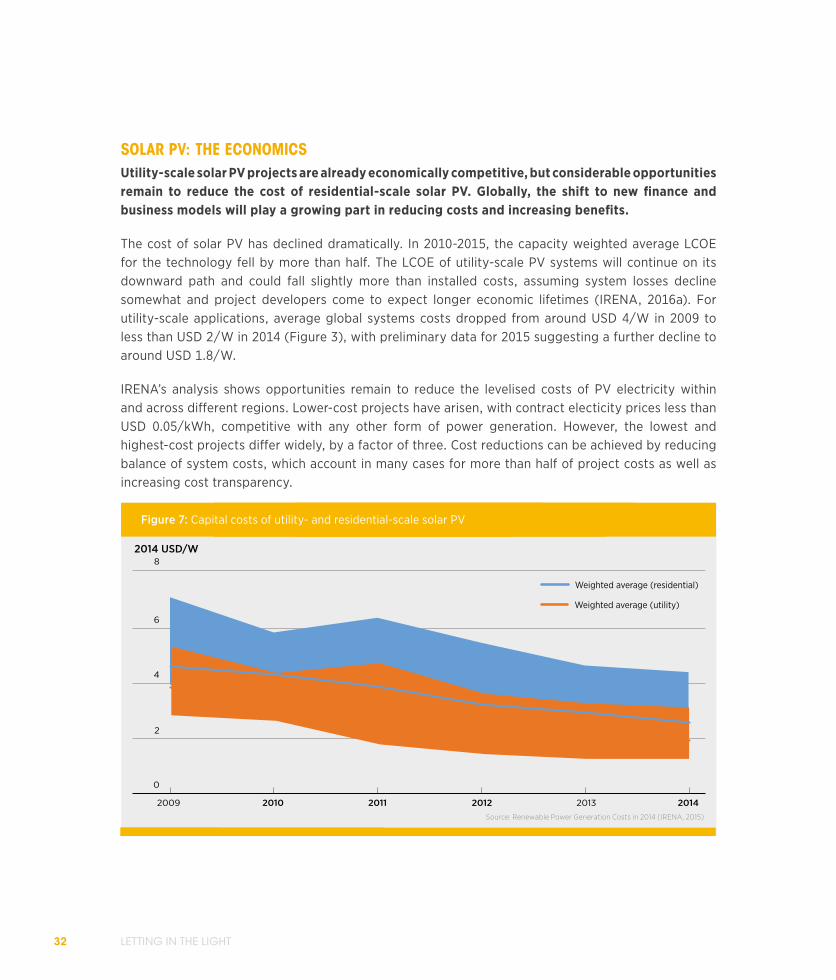
The cost of solar PV has declined dramatically. In 2010-2015, the capacity weighted average LCOE for the technology fell by more than half. The LCOE of utility-scale PV systems will continue on its downward path and could fall slightly more than installed costs, assuming system losses decline somewhat and project developers come to expect longer economic lifetimes (IRENA, 2016a). For utility-scale applications, average global systems costs dropped from around USD 4/W in 2009 to less than USD 2/W in 2014 (Figure 3), with preliminary data for 2015 suggesting a further decline to around USD 1.8/W.
IRENA’s analysis shows opportunities remain to reduce the levelised costs of PV electricity within and across different regions. Lower-cost projects have arisen, with contract electicity prices less than USD 0.05/kWh, competitive with any other form of power generation. However, the lowest and highest-cost projects differ widely, by a factor of three. Cost reductions can be achieved by reducing balance of system costs, which account in many cases for more than half of project costs as well as increasing cost transparency.
2009 2010 2011 2012 2013 2014
8
6
4
2
0
2014 USD/W
Figure 7: Capital costs of utility- and residential-scale solar PV
Weighted average (residential)
Weighted average (utility)
Source: Renewable Power Generation Costs in 2014 (IRENA, 2015)
HOW SOLAR PV WILL REVOLUTIONISE THE ELECTRICITY SYSTEM 33
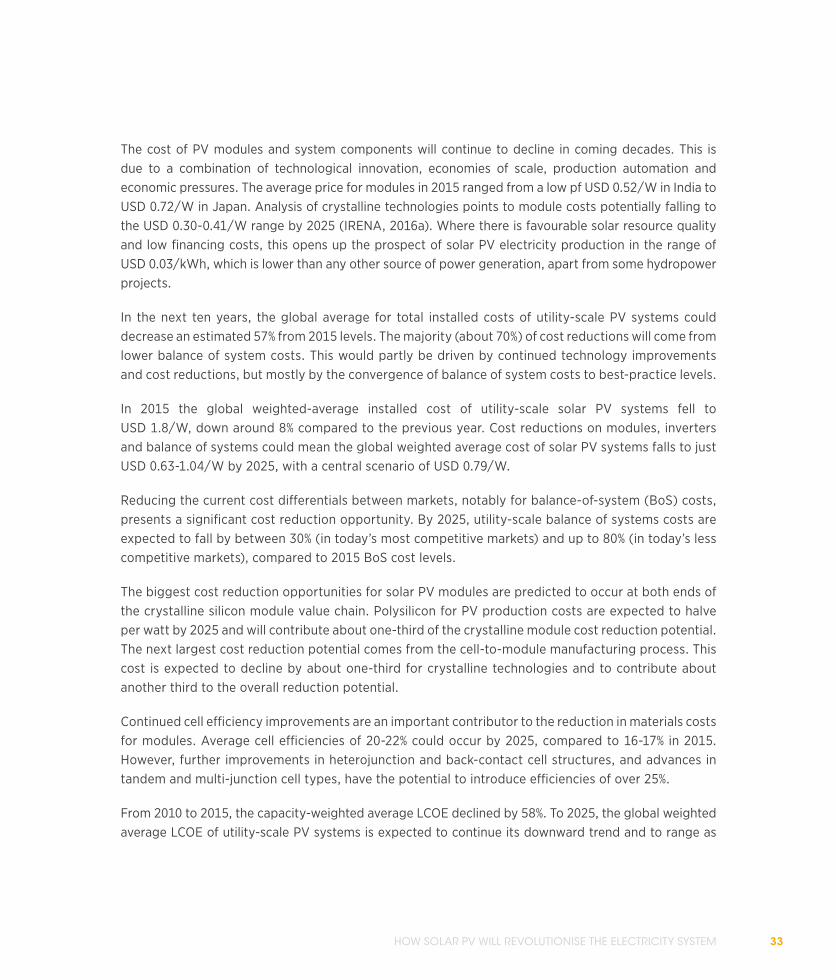
The cost of PV modules and system components will continue to decline in coming decades. This is due to a combination of technological innovation, economies of scale, production automation and economic pressures. The average price for modules in 2015 ranged from a low pf USD 0.52/W in India to USD 0.72/W in Japan. Analysis of crystalline technologies points to module costs potentially falling to the USD 0.30-0.41/W range by 2025 (IRENA, 2016a). Where there is favourable solar resource quality and low financing costs, this opens up the prospect of solar PV electricity production in the range of USD 0.03/kWh, which is lower than any other source of power generation, apart from some hydropower projects.
In the next ten years, the global average for total installed costs of utility-scale PV systems could decrease an estimated 57% from 2015 levels. The majority (about 70%) of cost reductions will come from lower balance of system costs. This would partly be driven by continued technology improvements and cost reductions, but mostly by the convergence of balance of system costs to best-practice levels.
In 2015 the global weighted-average installed cost of utility-scale solar PV systems fell to USD 1.8/W, down around 8% compared to the previous year. Cost reductions on modules, inverters and balance of systems could mean the global weighted average cost of solar PV systems falls to just USD 0.63-1.04/W by 2025, with a central scenario of USD 0.79/W.
Reducing the current cost differentials between markets, notably for balance-of-system (BoS) costs, presents a significant cost reduction opportunity. By 2025, utility-scale balance of systems costs are expected to fall by between 30% (in today’s most competitive markets) and up to 80% (in today’s less competitive markets), compared to 2015 BoS cost levels.
The biggest cost reduction opportunities for solar PV modules are predicted to occur at both ends of the crystalline silicon module value chain. Polysilicon for PV production costs are expected to halve per watt by 2025 and will contribute about one-third of the crystalline module cost reduction potential. The next largest cost reduction potential comes from the cell-to-module manufacturing process. This cost is expected to decline by about one-third for crystalline technologies and to contribute about another third to the overall reduction potential.
Continued cell efficiency improvements are an important contributor to the reduction in materials costs for modules. Average cell efficiencies of 20-22% could occur by 2025, compared to 16-17% in 2015. However, further improvements in heterojunction and back-contact cell structures, and advances in tandem and multi-junction cell types, have the potential to introduce efficiencies of over 25%.
From 2010 to 2015, the capacity-weighted average LCOE declined by 58%. To 2025, the global weighted average LCOE of utility-scale PV systems is expected to continue its downward trend and to range as
LETTING IN THE LIGHT34
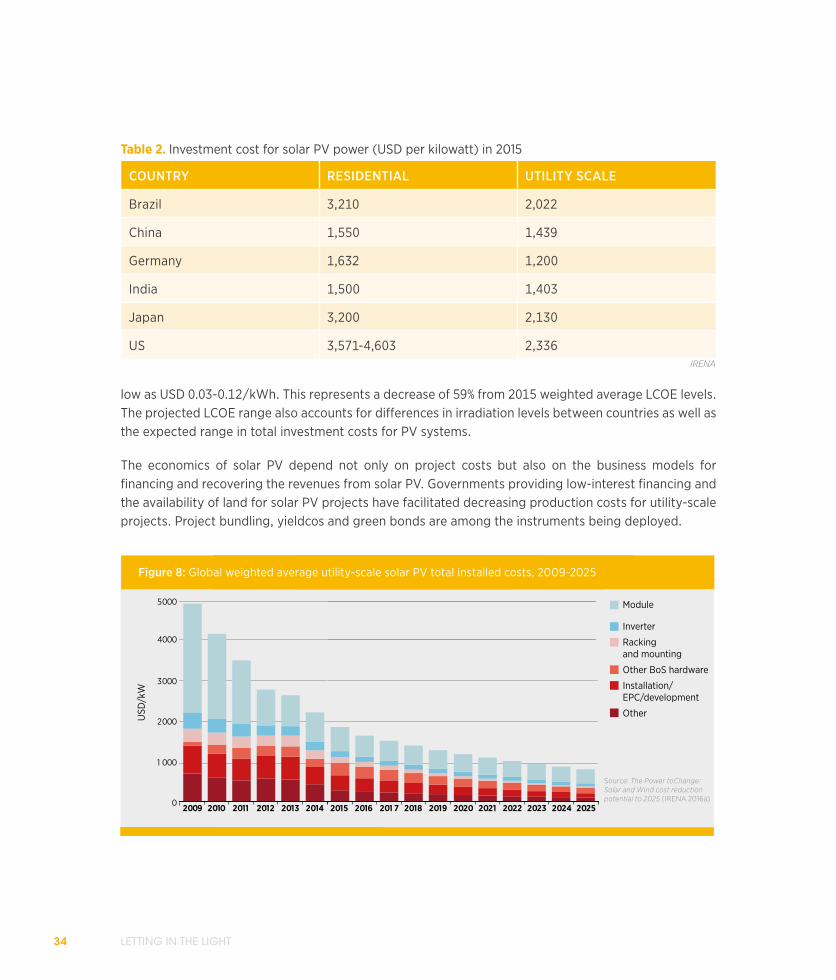
Figure 8: Global weighted average utility-scale solar PV total installed costs, 2009-2025
Source: The Power toChange: Solar and Wind cost reduction potential to 2025 (IRENA 2016a)
Module
Inverter
Racking and mounting
Other BoS hardware
Installation/EPC/development
OtherUSD
/kW
0
1 000
2000
3000
4000
5000
2009 2010 2011 2012 2013 2014 2015 2016 201 7 2018 2019 2020 2021 2022 2023 2024 2025
low as USD 0.03-0.12/kWh. This represents a decrease of 59% from 2015 weighted average LCOE levels. The projected LCOE range also accounts for differences in irradiation levels between countries as well as the expected range in total investment costs for PV systems.
The economics of solar PV depend not only on project costs but also on the business models for financing and recovering the revenues from solar PV. Governments providing low-interest financing and the availability of land for solar PV projects have facilitated decreasing production costs for utility-scale projects. Project bundling, yieldcos and green bonds are among the instruments being deployed.
COUNTRY RESIDENTIAL UTILITY SCALE
Brazil 3,210 2,022
China 1,550 1,439
Germany 1,632 1,200
India 1,500 1,403
Japan 3,200 2,130
US 3,571-4,603 2,336IRENA
Table 2. Investment cost for solar PV power (USD per kilowatt) in 2015

HOW SOLAR PV WILL REVOLUTIONISE THE ELECTRICITY SYSTEM 35
At the same time, new business models have appeared for the deployment of solar PV. For example, consumer-oriented businesses in the US have emerged supplying upfront financing for rooftop applications, crowdfunding mechanisms, and leasing structures that are undercutting electricity prices from the grid. These models allow for a much wider expansion of solar PV in the rooftop sector. In the context of extending or improving electricity access, new models for the creation of a local value chain for solar products have been developed allowing local entrepreneurs to set up their own solar shops. In emerging economies, these new business models include pay-as-you-go systems, hybrid microgrids and business models in which individuals own utility-scale solar PV power plants to hedge against raising electricity tariffs (IEA-PVPS, 2015b).
ImplicationsThe continued cost decline for solar PV will make its deployment competitive with other utility-scale power generation technologies. This will attract new investments and the need for specific policies to integrate solar PV into electricity sector regulation.
At the same time, small-scale solar PV will become a widely adopted consumer product that will rival some of the functions provided by the grid. This will require the involvement of a whole new and more complex set of stakeholders, including consumer agencies.
From a systems perspective, large-scale deployment of solar PV means the economics of the electricity system will be in transition. The practices of the typical incumbent utility, where power prices are shaped largely by fixed operating costs, will make way for an alternative approach. The production costs of solar PV are largely determined by upfront capital costs, since the resources to produce electricity (sun and wind) are free. In power systems with wholesale markets, this will change the price
The share of BoS costs for solar PV systems (including inverters) ranges between 50% and 80% of installed costs. Various initiatives aim to cut these costs. One of these innovations is techniques that allow installers to simply click and plug the panels into an existing system mounted on residential rooftops. For utility-scale solar PV systems, new robots have been invented to keep systems clean and detect any faults. Special films have been created to avoid dust settling on the panels. Another innovation is the use of micro-inverters to ensure that one faulty panel does not affect the performance and output of the rest.
Source: NREL, 2015
BOX 8: INNOVATION IN INSTALLATION AND MAINTENANCE
LETTING IN THE LIGHT36
dynamics, especially in periods with high or low VRE power generation availability. As a result, the governance structure needs to revisit remuneration and compensation schemes for generators and system operators. It needs to focus on cost-efficient ways of ensuring the reliability and adequacy of the electricity system (IRENA, 2015a).
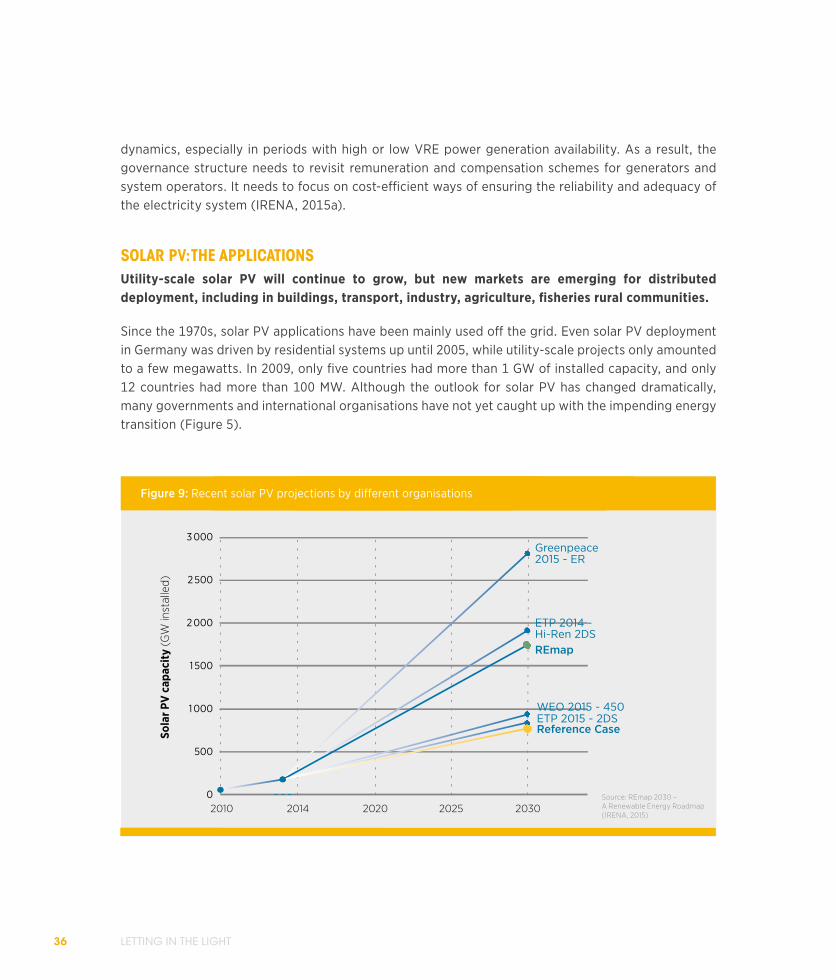
SOLAR PV: THE APPLICATIONSUtility-scale solar PV will continue to grow, but new markets are emerging for distributed deployment, including in buildings, transport, industry, agriculture, fisheries rural communities.
Since the 1970s, solar PV applications have been mainly used off the grid. Even solar PV deployment in Germany was driven by residential systems up until 2005, while utility-scale projects only amounted to a few megawatts. In 2009, only five countries had more than 1 GW of installed capacity, and only 12 countries had more than 100 MW. Although the outlook for solar PV has changed dramatically, many governments and international organisations have not yet caught up with the impending energy transition (Figure 5).
Figure 9: Recent solar PV projections by di�erent organisations
Sola
r PV
cap
acity
(GW
inst
alle
d)
3 000
2 500
2 000
1 500
1 000
500
02010 2014 2020 2025 2030
REmap
Reference Case
Greenpeace2015 - ER
ETP 2014 -Hi-Ren 2DS
WEO 2015 - 450ETP 2015 - 2DS
Source: REmap 2030 – A Renewable Energy Roadmap (IRENA, 2015)
HOW SOLAR PV WILL REVOLUTIONISE THE ELECTRICITY SYSTEM 37
Since 2009 we have moved from 1 MW systems to mega-scale solar farms across the world. In the US the Topaz Solar Farm in California was commissioned in November 2014 with a nominal capacity of 500 MW. Its panels cover almost 25 square kilometres and produce energy to supply around 160,000 homes. The size continues to increase, and more solar farms are in the pipeline. One example is the McCoy installation in the US, amounting to 750 MW. Dubai recently auctioned 800 MW of solar PV.
In other regions utility-scale solar PV systems are also growing rapidly. For example, India is planning 60 GW of utility-scale solar PV, of which 20 GW would be located in ‘ultra-mega solar power parks’ with a minimum capacity of 500 MW. Solar auctions in Africa, Latin America and the Middle East are equally encouraging for the large-scale deployment of utility-scale solar PV parks of 100 MW or more.
Utility-scale solar PV accounts today for around 65% of new solar PV capacity additions. The remainder is rooftop and off-grid systems.
Through cost reductions, the utility-scale applications are also having a positive impact on rooftop deployment. Globally, around 30% of electricity consumption is by residential users. In households
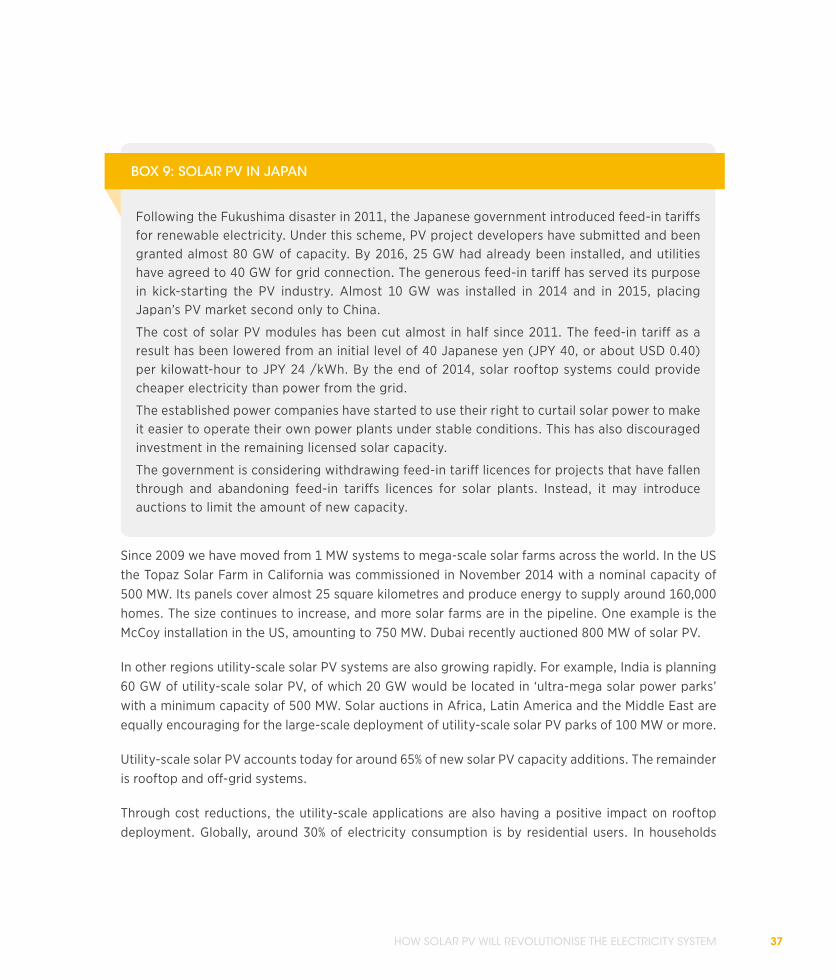
Following the Fukushima disaster in 2011, the Japanese government introduced feed-in tariffs for renewable electricity. Under this scheme, PV project developers have submitted and been granted almost 80 GW of capacity. By 2016, 25 GW had already been installed, and utilities have agreed to 40 GW for grid connection. The generous feed-in tariff has served its purpose in kick-starting the PV industry. Almost 10 GW was installed in 2014 and in 2015, placing Japan’s PV market second only to China.
The cost of solar PV modules has been cut almost in half since 2011. The feed-in tariff as a result has been lowered from an initial level of 40 Japanese yen (JPY 40, or about USD 0.40) per kilowatt-hour to JPY 24 /kWh. By the end of 2014, solar rooftop systems could provide cheaper electricity than power from the grid.
The established power companies have started to use their right to curtail solar power to make it easier to operate their own power plants under stable conditions. This has also discouraged investment in the remaining licensed solar capacity.
The government is considering withdrawing feed-in tariff licences for projects that have fallen through and abandoning feed-in tariffs licences for solar plants. Instead, it may introduce auctions to limit the amount of new capacity.
BOX 9: SOLAR PV IN JAPAN
LETTING IN THE LIGHT38
with high electricity demand, rooftop solar PV provides around 40% of yearly electricity consumption – reducing the need for electricity supplied by the grid. Solar plus storage can increase the share of self-consumption to 60%. Connecting multiple households with solar PV, storage systems and smart grids can increase self-consumption up to 80% (Wirth, 2016). Connecting multiple community networks could increase the share even further. This could lead to whole residential communities with limited needs for electricity from the grid.
“Up to 2015, we were doing 5 MW, 10 MW, in this part of the world. All of a sudden that moved across into 100-200 MW projects. Now, in 2016, we are already preparing a single, 800 MW solar PV project.” — Paddy Padmanathan, Chief Executive Officer, ACWA Power
Rooftop solar PV is insufficient to meet demand in cities, particularly those with limited space and high living density. Mass-scale integration in cities calls for taking the technology into consideration in urban planning alongside new architectural concepts. Applications such as solar windows, solar roof tiles and bifacial PV modules are being tested. Such technologies are confined for now to a niche market, with only a small section of the population able to afford them. To be viable at this stage the equipment needs to be available in attractive designs that make solar PV an appealing high-end consumer product.
Cooling is another potential application for solar PV. In general, it accounts for a major share of electricity demand in cities in developing countries. Cooling represents 70% of peak demand in comparatively urbanised countries with a hot climate, such as Saudi Arabia and the United Arab Emirates, where power demand could reach 10 exajoules (EJ) by 2030. This equates to peak demand of more than 3,000 GW globally. District cooling systems are well suited to accommodating VRE. In these systems, cooled water circulates through a pipeline, and the cold is transferred to building cooling systems through a heat exchanger. The water temperature in the pipeline distribution system may vary and the distribution system can store significant amounts of cold. Cold can be generated with electricity (e.g. from solar PV) or using residual heat (e.g. from concentrated solar power, or CSP). Both can be generated from renewable resources. A district cooling system, therefore, is also particularly suited to storing renewable energy. A cooling system of this kind can act as a low-cost battery.
HOW SOLAR PV WILL REVOLUTIONISE THE ELECTRICITY SYSTEM 39
District cooling systems are widely deployed. The United Arab Emirates is a world leader in this field.
The second largest system in the world is operated by Engie in the French capital, Paris, while Malaysia
and Singapore also operate major district cooling systems. Local or household-level cooling systems
can also be operated in conjunction with cold storage with chilled water or ice. Several thousand
such systems have operated for decades in New York. Initially they were designed to accommodate
inflexible baseload but these systems would also be very appropriate as a flexibility option for
integrating variable renewables. At the same time, these individual cooling systems could also be
used for cooling demand for agricultural and fishery products, as well as cooling medicines in local
hospitals (UNEP, 2016).
Desalination plants are another important category. Reverse osmosis is the technology of choice
for all future plants. More than 18,000 desalination plants are thought to be operating worldwide.
Together they have a maximum daily production capacity of around 90 million cubic metres of
water (International Desalination Association, IDA Desalination Yearbook 2015-2016). Installed and
operational desalination plants worldwide are estimated to emit around 76 million tonnes of CO2 per
year (Masdar, 2015), which could account for 50 GW or more than 1% of global electricity demand.
With access to drinking water becoming a rising concern for a quarter of humanity, the increasing
desalination can be expected just to ensure survival for large sections of the population.
A planned desalination plant in El Khafji in Saudi Arabia is one of the leading examples of coupling
reverse osmosis plants with solar PV. The USD 130 million facility will desalinate 60,000 cubic metres
of seawater each day, ensuring a stable supply of drinking water throughout the year. The use of solar
PV for desalination at the moment is minor. However, water is much cheaper to store than electricity
is, so plant operation makes the most economic sense where solar electricity is available (Oxford
Business Group, 2016).
Coupling solar PV with water applications is also of interest to the agricultural sector. Solar-based
solutions can provide reliable, cost-effective and environmentally sustainable energy for decentralised
irrigation services in a growing number of settings. Multiple benefits result from solar deployment,
including improvement of livelihoods (via increasing productivity, incomes and food security), social
well-being (through poverty alleviation as well as emissions reduction) and reduce spending on fossil
fuel subsidies and centralised energy infrastructure. Solar PV facilities, therefore, can help to fulfil
several Sustainable Development Goals. New targets and initiatives announced by a growing number
of governments, development agencies and the private sector attest to growing recognition of the
broad socio-economic benefits of renewables, including solar energy applications. India, for instance,
has set out to deploy more than 100,000 solar water pumps for irrigation (IRENA, 2016d).
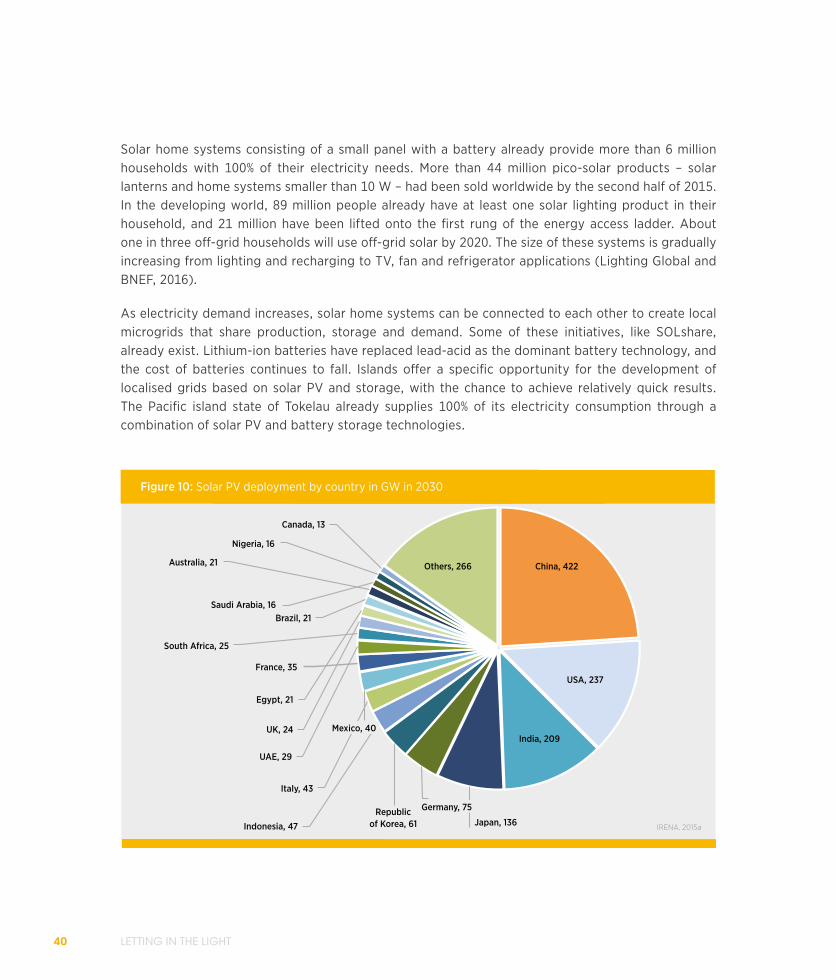
LETTING IN THE LIGHT40
Solar home systems consisting of a small panel with a battery already provide more than 6 million households with 100% of their electricity needs. More than 44 million pico-solar products – solar lanterns and home systems smaller than 10 W – had been sold worldwide by the second half of 2015. In the developing world, 89 million people already have at least one solar lighting product in their household, and 21 million have been lifted onto the first rung of the energy access ladder. About one in three off-grid households will use off-grid solar by 2020. The size of these systems is gradually increasing from lighting and recharging to TV, fan and refrigerator applications (Lighting Global and BNEF, 2016).
As electricity demand increases, solar home systems can be connected to each other to create local microgrids that share production, storage and demand. Some of these initiatives, like SOLshare, already exist. Lithium-ion batteries have replaced lead-acid as the dominant battery technology, and the cost of batteries continues to fall. Islands offer a specific opportunity for the development of localised grids based on solar PV and storage, with the chance to achieve relatively quick results. The Pacific island state of Tokelau already supplies 100% of its electricity consumption through a combination of solar PV and battery storage technologies.
Figure 10: Solar PV deployment by country in GW in 2030
Canada, 13
Nigeria, 16
Australia, 21
Saudi Arabia, 16Brazil, 21
South Africa, 25
France, 35
Egypt, 21
UK, 24
UAE, 29
Italy, 43
Republic of Korea, 61
Germany, 75
Japan, 136Indonesia, 47
Mexico, 40
Others, 266 China, 422
USA, 237
India, 209
IRENA, 2015a
HOW SOLAR PV WILL REVOLUTIONISE THE ELECTRICITY SYSTEM 41
IRENA’s renewable energy roadmap shows that solar PV deployment will be global and spread across utility-scale applications and rooftop solar PV systems as well as pico-solar systems such as solar lanterns. In 2030, more than 20 different countries are expected to have over 15 GW of PV capacity installed, and at least some PV will be deployed in every country worldwide (IRENA, 2016 c).
ImplicationsSolar PV growth is set to continue around the world. Utility-scale solar PV projects will require specific regulatory policies to manage the variability and impact of solar PV on electricity storage.
Furthermore, solar PV will rapidly expand from utility-scale projects. It will diversify into residential, commercial and industrial applications as well as solutions for rural areas and niche markets like the agricultural sector, the fishing industry and healthcare. As a result, users of solar PV will keep increasing, and new agencies will need to be formed to craft specific policies for these new markets. Stakeholders must be educated and policies realigned.
SOLAR PV: THE INFRASTRUCTUREContinued solar PV growth equires a transformation in the way existing grids are managed and operated. At the same time, distributed solar PV is catalysing developments in distributed grids.
Some major economies have already attained significant proportions of solar PV in their electricity mix. For example, Italy generated around 10% of its electricity from solar PV in 2014. Germany has installed PV capacity of 40 GW in a power system where demand ranges from 40 GW to 80 GW. On 8 May 2016, Germany set a new record, achieving 88% renewable power for several hours during the day. More than half of all German power was produced from solar PV during this part of the day, and the country’s electricity exports soared. An increasing concern is how to deal with surpluses that can result in negative power prices as conventional must-run plants also continue to produce.
Some impact on transmission infrastructure is inevitable. Most developers of utility-scale solar PV parks are planning their projects in areas with high solar irradiation because this lowers LCOE and improves a project’s competitiveness during auctions. However, locations with high solar irradiation may not correspond to places with electricity demand. This results in increased investment in transmission lines. For example, many project developers of utility-scale solar PV systems in South Africa are planning their projects in the sparsely populated region of the Northern Cape. Locating these projects closer to demand centres would increase LCOE but reduce grid investments in transmission lines.
In addition to national transmission network expansion, interregional interconnections are another possibility for increasing the deployment and use of solar PV. Introducing more interconnectors in an
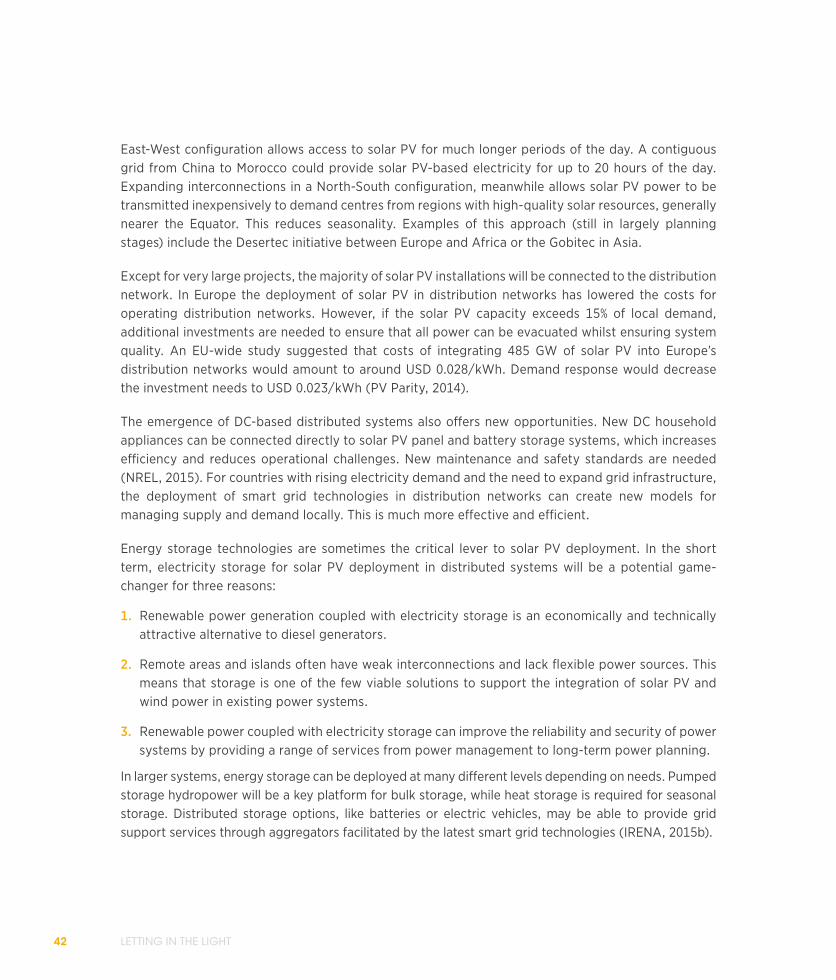
LETTING IN THE LIGHT42
East-West configuration allows access to solar PV for much longer periods of the day. A contiguous grid from China to Morocco could provide solar PV-based electricity for up to 20 hours of the day. Expanding interconnections in a North-South configuration, meanwhile allows solar PV power to be transmitted inexpensively to demand centres from regions with high-quality solar resources, generally nearer the Equator. This reduces seasonality. Examples of this approach (still in largely planning stages) include the Desertec initiative between Europe and Africa or the Gobitec in Asia.
Except for very large projects, the majority of solar PV installations will be connected to the distribution network. In Europe the deployment of solar PV in distribution networks has lowered the costs for operating distribution networks. However, if the solar PV capacity exceeds 15% of local demand, additional investments are needed to ensure that all power can be evacuated whilst ensuring system quality. An EU-wide study suggested that costs of integrating 485 GW of solar PV into Europe’s distribution networks would amount to around USD 0.028/kWh. Demand response would decrease the investment needs to USD 0.023/kWh (PV Parity, 2014).
The emergence of DC-based distributed systems also offers new opportunities. New DC household appliances can be connected directly to solar PV panel and battery storage systems, which increases efficiency and reduces operational challenges. New maintenance and safety standards are needed (NREL, 2015). For countries with rising electricity demand and the need to expand grid infrastructure, the deployment of smart grid technologies in distribution networks can create new models for managing supply and demand locally. This is much more effective and efficient.
Energy storage technologies are sometimes the critical lever to solar PV deployment. In the short term, electricity storage for solar PV deployment in distributed systems will be a potential game-changer for three reasons:
1. Renewable power generation coupled with electricity storage is an economically and technically attractive alternative to diesel generators.
2. Remote areas and islands often have weak interconnections and lack flexible power sources. This means that storage is one of the few viable solutions to support the integration of solar PV and wind power in existing power systems.
3. Renewable power coupled with electricity storage can improve the reliability and security of power systems by providing a range of services from power management to long-term power planning.
In larger systems, energy storage can be deployed at many different levels depending on needs. Pumped storage hydropower will be a key platform for bulk storage, while heat storage is required for seasonal storage. Distributed storage options, like batteries or electric vehicles, may be able to provide grid support services through aggregators facilitated by the latest smart grid technologies (IRENA, 2015b).
HOW SOLAR PV WILL REVOLUTIONISE THE ELECTRICITY SYSTEM 43
The electrification of end-use sectors is another strategy that will become increasingly relevant when the share of solar PV increases. For example, today we have total potential electric vehicle battery storage capacity of 130 GWh (125 GWh from two- or three-wheelers and 5 GWh from battery electric vehicles. In REmap 2030 this total increases to 8 TWh for battery electric vehicles (from 160 million vehicles with average 50 kWh battery size) to 1.8 TWh from two- or three-wheelers (from 900 million two- or three-wheelers with average 2 kWh battery size, an average from small and large vehicles) (IRENA, 2016c).
ImplicationsAlthough most operational impacts of solar PV can easily be solved through various technical solutions, the rise of solar PV deployment will ultimately require a fundamental transformation of the power sector. The immediate driver for this transformation is the distributed nature of solar PV, which will entice new stakeholders into the power market to start producing their own electricity. As an
Figure 11: Centralised storage applications to support the integration of solar PV
IRENA, 2015
BalancingStorage
Bulk Storage
DistributedStorage
CommercialStorageResidential
Storage
ThermalStorage
V2G
LETTING IN THE LIGHT44
immediate consequence, policy makers are already exploring different models of remuneration and compensation for use of the grid infrastructure.
As the share of solar PV increases, its intermittency will increasingly need to be managed. Potential solutions are the creation of a generation mix with more flexible generation plants, interconnectors, demand-side management and electricity storage. Depending on the specific circumstances, one or all of these options are available. Furthermore, the management of both supply and demand at a local level represents a potential yet untested solution for dealing with this variability with knock-on effects on national and regional grid infrastructure. Either way, new regulation will be key to allow these different flexibility tools to enter and engage in electricity markets.
SOLAR PV: THE POLICY FRAMEWORKGovernments must increasingly create integrated frameworks to nurture technology development, spur deployment and provide support mechanisms for local supply chains.
Successful policies have been instrumental in encouraging investments in solar and stimulating the development of the sector. Experience shows how a combination of basic and applied R&D in the first two decades of PV uptake was essential. An additional 30 year period was required for commercial scale-up through policy instruments that created long-term demand, supported niche market formation and promoted industrial co-ordination. Innovation efforts based on a learning-by-doing pathway, pulled by market incentives in countries such as Germany, brought about a reduction of two orders of magnitude in the cost of the technology.
In 2016, solar PV is commercially available and economically attractive. At the same time, there are still plenty of opportunities to improve solar technologies. Consequently, deployment policies stimulating market pull and business engagement need to go hand-in-hand with technology and innovation policies to support continuous support for research, development and demonstration. In addition, energy policies cannot be considered in isolation from industrial policies. Institutional frameworks need to be developed to ensure that countries take advantage of solar PV contributions across the value chain from project initiation to operation and management of installed capacity.
Current research, development and demonstration (RD&D) in solar PV is below the expenditure levels of the 1980s. For example, the US spent around USD 300 million annually on solar PV research in the 1980s compared to around USD 60 million in 2016 (McCormick et al., 2016). More research will have to be directed at the reduction of soft costs, innovations in manufacturing and system integration. This will require dedicated programmes to allow entrepreneurs and other early adopters to experiment with new deployment models and focus on learning by experience. Almost all countries have increased
HOW SOLAR PV WILL REVOLUTIONISE THE ELECTRICITY SYSTEM 45
deployment. Standardisation and testing enables harmonised technical platforms to document technology developments while objectively benchmarking performance among industry players. This will thus be required to accelerate improvements based on competition.
“Costs have come down because of incremental improvements in the industrial supply chain, and that will continue. What is important is the institutional setting; and the access to the electricity market for new players.” — Tomas Kåberger, Chair of Executive Board, Renewable Energy Institute, Tokyo
Deployment policies need to be designed taking into consideration the following key requirements (IRENA, 2015c, 2014): 4
j A long-term policy framework showing government commitment towards the market.
j Credible short, medium and long-term targets backed up by action plans designed to remove barriers.
j Policies aligned between countries in order to minimise risks faced by investors domestically and internationally.
j Smart remuneration arrangements which provide long-term predictable revenue streams and include built-in flexibility to allow for adaptation as costs reduce so as to minimise policy costs.
j Actions to tackle non-economic barriers, including streamlining planning and permitting, developing the necessary skills base and providing public information.
j Measures to enable technical and market integration once deployment grows.
Policy makers need also to make sure that their deployment policies are able to adapt to the dynamics related to the business environment such as technology costs. This is a delicate task which requires
3 This is particularly true for countries only just starting solar PV deployment, as effective policy principles can be distilled from prior experience. The “key requirements” cited here can provide a basis for formulating country-specific policies.
LETTING IN THE LIGHT46
long-term planning and targets on the one hand, and an agile set of policies to support this long-term vision on the other. For example, Germany’s feed-in tariff for solar PV has a clearly defined expiry date with regular and predetermined evaluation steps along the way. As solar PV costs have fallen and deployment increased, market-based mechanisms like renewable energy auctions are increasingly being adopted to support deployment. The complete transformation of the energy system can only happen by addressing the three major sectors (power, heat and transport). Policies therefore need to be designed to support solar deployment across sectors.
WIDER IMPACT OF SOLAR PV: WHAT TO EXPECTThe impact of solar PV extends beyond the power sector and across the value chain, with business and policy implications related to equipment production, operation and maintenance.
The rapid development of solar PV has some immediate consequences for the key indicators for the power sector in both established and growing economies: reliability, affordability and security. First, solar PV is cost-competitive with other power generation technologies in a growing range of locations and conditions. Second, solar PV produces electricity based on nationally available resources alleviating any security issues associated with imported fuels. Third, the variability of solar PV requires sufficient flexibility within the power system to ensure that supply and demand are matched at all times. The latter will require a transformation of the power sector on a technical and institutional level (IRENA and IEA, 2016).
Beyond the power sector, solar PV has also direct consequences for the environment, economy and society at large. For the wider economy, solar PV accounts for the bulk of renewable energy investments to the order of USD 80 billion per year. Around half of this economic activity is related to production of hardware but local project development, installation, and operation and maintenance activities account for the other half. For the environment, solar PV is already contributing to greenhouse gas mitigation in the range of 200-300 million tonnes CO2 per year. Increased solar PV deployment from 200 GW today to 1,600 GW in 2030 will result in greenhouse gas emission reductions of between one and three gigatonnes in 2030. This emission reduction potential entails important economic benefits from the avoidance of climate risks. Another important advantage is lower water intensity, so that solar PV offers water-saving potential compared to thermoelectric options (conventional or renewable). At the same time, solar PV deployment in the power sector as well as in rural applications help to reduce local pollution and thus avoid some harm to health.
Solar PV also has important implications for job creation. Solar PV is the largest renewable energy employer, accounting for 2.8 million jobs in 2015, of which about two-thirds were in China. China produced around 34 GW of solar PV modules in 2014 (70% of world’s production). The
HOW SOLAR PV WILL REVOLUTIONISE THE ELECTRICITY SYSTEM 47
manufacturing segment employed close to 80% of China’s 1.7 million solar PV workforce, followed by installation, operation and maintenance. However, the manufacturing segment is not the only way to increase deployment. In the US, the latest National Solar Job Census indicates that installations (adding 1.4 GW during 2014) were the main engine of job growth.
Installations accounted for 97,000 out of the 173,800 jobs in the US solar PV industry in 2014. In 2015, solar jobs in the US had grown to 300,000, two-thirds of which are permanent. The expanding global market for solar PV is also creating shifts in employment structure and along different parts of the value chain. For example, both market and manufacturing capacity has shifted from Europe to Asia.
This has led to a growth in solar PV jobs in Japan while jobs decreased in the EU. Solar PV deployment in the off-grid market also creates significant jobs. This is exemplified by the Bangladesh programme resulting in the installation of 3.6 million solar home systems and the creation of 115,000 direct jobs through manufacturing, assembly and deployment. In addition, the provision of electricity in rural areas has increased economic activities and creates an additional 50,000 downstream jobs.
LETTING IN THE LIGHT48
j Baker & McKenzie (2015), The Rise of Corporate PPAs: A new driver for renewables, Baker & McKenzie, www.bakermckenzie.com/files/Uploads/Documents/Global%20EMI/report_RE_CorporatePPAs_20151202.pdf
j Bhandarib, K. P., Colliera, J. M., Ellingsonb, R. J., Apul, D. S., (2015), Energy payback time (EPBT) and energy return on energy invested (EROI) of solar photovoltaic systems: A systematic review and meta-analysis, Renewable and Sustainable Energy Reviews 47, 133-141
j FfE (Forschungsstelle für Energiewirtschaft) (2014), Gutachten zur Rentabilitaet von Pumpspeicherkraftwerken. Elsevier. www.stmwi.bayern.de/fileadmin/user_upload/stmwivt/Themen/Energie_und_Rohstoffe/Dokumente_und_Cover/2014-Pumpspeicher-Rentabilitaetsanalyse.pdf
j Green, M.A et al (2016), “Solar Cell Efficiency Tables (version 47),” Progress in Photovoltaics 24, 3–11
j IEA-PVPS (2016), 2015 Snapshot of Global Photovoltaic Markets, www.iea-pvps.org/fileadmin/dam/public/report/statistics/International Energy Agency Photovoltaic Power Systems Programme, IEA-PVPS_-__A_Snapshot_of_Global_PV_-_1992-2015_-_Final.pdf
j IEA-PVPS (2015a), Life Cycle Inventories and Life Cycle Assessments of Photovoltaic Systems, IEA-PVPS. www.iea-pvps.org/index.php?id=350
j IEA-PVPS (2015b), Innovative Business Models and Financing Mechanisms for PV Deployment in Emerging Regions. www.iea-pvps.org/index.php?id=311
j IHS (2015), Top Solar Power Industry Trends in 2015, IHS. www.ihs.com/pdf/Top-Solar-Power-Industry-Trends-for-2015_213963110915583632.pdf
j IRENA (2016a), The Power to Change: Solar and Wind Cost Reduction Potential to 2025, International Renewable Energy Agency, Abu Dhabi. www.irena.org/DocumentDownloads/Publications/IRENA_Power_to_Change_2016.pdf
j IRENA (2016b), Renewable Energy and Jobs: Annual Review 2016, IRENA, Abu Dhabi. www.irena.org/DocumentDownloads/Publications/IRENA_RE_Jobs_Annual_Review_2016.pdf
j IRENA (2016c), REmap: Roadmap for A Renewable Energy Future: 2016 Edition, IRENA, Abu Dhabi. www.irena.org/remap
j IRENA (2016d), Solar Pumping for Irrigation: Improving Livelihoods and Sustainability, IRENA, Abu Dhabi.
j IRENA (2015a), The Age of Renewable Power: Designing National Roadmaps for a Successful Transformation, IRENA, Abu Dhabi. www.irena.org/DocumentDownloads/Publications/IRENA_PST_Age_of_Renewable_Power_2015.pdf
j IRENA (2015b), Renewables and Electricity Storage: A Technology Roadmap for REmap 2030, IRENA, Abu Dhabi. www.irena.org/DocumentDownloads/Publications/IRENA_REmap_Electricity_Storage_2015.pdf
j IRENA (2015c), REthinking Energy: Renewable Energy and Climate Change, IRENA, Abu Dhabi. www.irena.org/rethinking/IRENA%20_REthinking_Energy_2nd_report_2015.pdf
j IRENA (2014), Adapting Renewable Energy Policies to Dynamic Market Conditions, IRENA, Abu Dhabi. www.irena.org/DocumentDownloads/Publications/policy_adaptation.pdf
REFERENCES
HOW SOLAR PV WILL REVOLUTIONISE THE ELECTRICITY SYSTEM 49
j IRENA and IEA (2016), System Integration of Renewables: Implications for Electricity Security
(report to the G7), IRENA and OECD/IEA, Abu Dhabi and Paris. www.iea.org/media/topics/
engagementworldwide/g7/IEAIRENAReporttotheG7onSystemIntegrationofRenewables.pdf
j IRENA and IEA-PVPS (2016), End-of-Life Management: Solar Photovoltaic Panels, IRENA and IEA-PVPS.
j Lighting Global and Bloomberg New Energy Finance (BNEF) (2016), Off-grid Solar Market Trends
Report 2016. www.lightingglobal.org/launch-of-off-grid-solar-market-trends-report-2016/
j McCormick, C. and Sandalow, D. (2016), Solar Together: A Proposal, Center on Global Energy Policy,
Columbia University, New York.
j MIT Energy Initiative, 2015, The Future of Solar Energy, Massachusetts Institute of Technology.http://
mitei.mit.edu/system/files/MIT%20Future%20of%20Solar%20Energy%20Study_compressed.pdf
j NREL (2016a), Rooftop Solar Photovoltaic Technical Potential in the United States: A Detailed
Assessment, National Renewable Energy Laboratory. www.nrel.gov/docs/fy16osti/65298.pdf
j NREL (2016b), CdTe Solar Cells with Open-Circuit Voltage Breaking the 1 V Barrier, Nature Energy.
www.nrel.gov/news/press/2016/23648
j NREL (2015), SAPC Best Practices in PV Operations and Maintenance. www.nrel.gov/docs/
fy15osti/63235.pdf
j Oxford Business Group (2016), “Saudi Arabia expands its desalination capacity”, The Report: Saudi
Arabia, Oxford Business Group, London. www.oxfordbusinessgroup.com/analysis/world-leader-
efforts-under-way-expand-desalination-capacity
j SunEdison (2016), SunEdison Undertakes Chapter 11 Reorganization, Press Releases.
http://investors.sunedison.com/phoenix.zhtml?c=106680&p=irol-newsArticle&ID=2159218
j SoftBank (2016), SoftBank Group Corp. Signs Joint Memorandum of Understanding with State Grid,
KEPCO and ROSSETI to Cooperate on Research and Planning for Interconnected Power Grid Spanning
Northeast Asia, Press Releases. www.softbank.jp/en/corp/news/press/sb/2016/20160330_01/
j PV Parity (2014), PV Parity Project: How to Support Different Photovoltaic Applications in the
Achievement of Competitiveness and Beyond. www.pvparity.eu/fileadmin/PVPARITY_docs/public/
PVParity_Final_Report.pdf
j TÜV Rheinland (2015) - Quality Monitor Report. http://m.tuv-e3.com/downloads/detail/file/quality-
assurance-and-risk-management-of-photovoltaic-projects.html
j UNEP (2016), District Energy in Cities, Unlocking the Potential of Energy Efficiency and Renewable
Energy. United Nations Environment Programme. www.unep.org/energy/portals/50177/DES_
District_Energy_Report_full_02_d.pdf
j Wirth, H.(2016), Aktuelle Fakten zur Photovoltaik in Deutschland (Current Facts on PV in Germany).
www.ise.fraunhofer.de/de/veroeffentlichungen/veroeffentlichungen-pdf-dateien/studien-und-
konzeptpapiere/aktuelle-fakten-zur-photovoltaik-in-deutschland.pdf


Copyright © IRENA 2016
www.irena.org
www.twitter.com/irena
www.facebook.com/irena.org
www.instagram.com/irenaimages