Will Harmonizing Accounting Standards Really Harmonize
42
Will Harmonizing Accounting Standards Really Harmonize Accounting? Evidence from Non-U.S. Firms Adopting US GAAP Mark T. Bradshaw Associate Professor of Accounting Harvard Business School Soldiers Field Road Boston, MA 02163 [email protected] Gregory S. Miller Associate Professor of Accounting Harvard Business School Soldiers Field Road Boston, MA 02163 [email protected] August 2007 _______________________ Previously titled “Are Detailed Accounting Standards Sufficient to Ensure Compliance?” We thank Holly Ashbaugh, Phil Berger, Lisa Bryant, Paul Healy, Ole Kristian-Hope, Peter Joos, Bjorn Jorgensen, Mike Kirschenheiter, Mark Kohlbeck, Richard Leftwich , Christian Leuz, Asis Martinez-Jerez, Jana Raedy, Abbie Smith, Terry Warfield, Ross Watts, Joanna Wu, Jerold Zimmerman, and workshop participants at University of Chicago, Harvard Business School, University of North Carolina – Chapel Hill, University of Rochester, Syracuse University, University of Wisconsin, and the Utah Winter Accounting Conference for comments on earlier versions of this paper. We also thank Paul Michaud and Sarah Woolverton for programming assistance and Anne Karshis and David Porter for research assistance. We are grateful for the funding of this research by the Harvard Business School.
Transcript of Will Harmonizing Accounting Standards Really Harmonize

Will Harmonizing Accounting Standards Really Harmonize Accounting?
Evidence from Non-U.S. Firms Adopting US GAAP
Mark T. Bradshaw Associate Professor of Accounting
Harvard Business School Soldiers Field Road Boston, MA 02163
Gregory S. Miller Associate Professor of Accounting
Harvard Business School Soldiers Field Road Boston, MA 02163 [email protected]
August 2007
_______________________ Previously titled “Are Detailed Accounting Standards Sufficient to Ensure Compliance?” We thank Holly Ashbaugh, Phil Berger, Lisa Bryant, Paul Healy, Ole Kristian-Hope, Peter Joos, Bjorn Jorgensen, Mike Kirschenheiter, Mark Kohlbeck, Richard Leftwich , Christian Leuz, Asis Martinez-Jerez, Jana Raedy, Abbie Smith, Terry Warfield, Ross Watts, Joanna Wu, Jerold Zimmerman, and workshop participants at University of Chicago, Harvard Business School, University of North Carolina – Chapel Hill, University of Rochester, Syracuse University, University of Wisconsin, and the Utah Winter Accounting Conference for comments on earlier versions of this paper. We also thank Paul Michaud and Sarah Woolverton for programming assistance and Anne Karshis and David Porter for research assistance. We are grateful for the funding of this research by the Harvard Business School.

Will Harmonizing Accounting Standards Really Harmonize Accounting?
Evidence from Non-U.S. Firms Adopting US GAAP
ABSTRACT International harmonization of accounting standards appears to be inevitable. However, little evidence exists regarding whether harmonizing accounting standards will result in actual harmonization of accounting practices. Using a sample of non-US firms that adopt US GAAP to provide evidence on this issue, we find that most firms that adopt US GAAP adjust their accounting methods to those required by US GAAP. Properties of the firms’ accounting numbers also change significantly after adopting US GAAP, but do not fully converge towards that of US firms. In the cross-section, regulatory oversight is associated with more successful implementation of US GAAP; firm-specific capital market incentives are not. These results suggest that harmonizing accounting standards may result in more comparable accounting methods and numbers, but that effective regulatory oversight will be important in reaching this outcome. JEL classification: F00, G15, M41 Keywords: Accounting choice; Accounting standards; International accounting; International financial reporting; US GAAP

1
1. Introduction
Proponents of international harmonization of accounting standards argue that a single set
of standards would assure similar transactions are treated the same by companies around the
world, resulting in globally comparable financial statements. 1 However, findings in the academic
literature challenge whether one set of accounting standards would be applied consistently by
firms operating in varying economic, political, and cultural settings. In fact, prior research on
early users of IAS finds that firms are not compliant in meeting even the easily observable
disclosure requirements (Street and Gray 2001). Additionally, studies of the properties of
accounting output find that similar standards are applied very differently around the world (Ball,
Robin and Wu 2003). These findings have lead many authors to conclude that global
comparability will be driven by factors other than the accounting standards. Specifically, most
authors point to either regulatory oversight or capital market pressures (Land and Lang 2002, Ball,
Robin and Wu 2003, Burgstahler, Hail and Leuz 2006).
As a body of work, prior research has raised substantial doubt regarding whether a global
accounting standard would result in comparable accounting around the world. However, prior
studies suffer from at least one of two major limitations. First, the papers often compare similar
but not identical accounting regimes. This makes it difficult to determine what drives the
observed differences in accounting (Guenther 2002, Holthausen 2003, Leuz 2006). Second,
studies frequently lack a benchmark for the proper application of the various accounting standards
examined (Holthausen 2003). Thus, it is difficult to determine whether and how incorrect
applications of accounting have occurred.
This paper uses a sample of firms and research design that overcomes these limitations.
We examine 178 non-US firms that have voluntarily adopted US Generally Accepted Accounting 1 For example, Sir David Tweedie, Chairman of the International Accounting Standards Board argues that “If they all use the same methods and the accounting for one transaction is the same in Sydney, as it is in Seattle, as in Strasburg, as in Sheffield, then they know where they are, and there is a demand for that type of certainty.” (FEI 2001).

2
Principles (US GAAP) - generally viewed as an ‘international’ set of accounting standards with
detailed guidance (Dye and Sunder 2001). The 27 countries from six continents represented by
the sample firms reflect a wide range of reporting environments and institutional backgrounds.
The diversity in this sample is similar to that likely to exist under any globally mandated set of
accounting standards, providing a natural experiment to examine how a single set of standards is
applied across companies with heterogeneous backgrounds.
We use two matched samples as benchmarks: US firms that report under US GAAP and
non-US firms that report under local accounting standards. The matched samples were formed by
matching on country (for the non-US matched sample only), industry, and size. They create
reference points for examining relative compliance with US GAAP. Non-US firms using local
standards are not expected to comply with US GAAP, providing a lower bound of US GAAP
compliance; US firms are expected to comply with US GAAP and provide an upper bound.
Combined, these samples allow us to examine whether non-US firms purporting to use US GAAP
actually changed their accounting, or if they simply report a version of their home GAAP labeled
as US GAAP.
We address two related questions. First, will non-US companies adopting US GAAP
apply that GAAP in a consistent manner globally? Second, do regulatory oversight or capital
market incentives impact the level of compliance in form and/or implementation? We investigate
these questions by assessing both the accounting methods disclosed in the financial statements and
the properties of accounting outputs (e.g., earnings). Prior research indicates these two features of
international financial reporting are driven by different factors, so it is important to examine both
(Nair and Frank 1980). This broad set of accounting attributes, combined with our sample and
research design, provides a comprehensive view of which aspects of accounting are most likely to
meet the goals of comparability espoused by proponents of accounting harmonization.

3
We test accounting method disclosure compliance using both a changes approach and
cross-sectional comparisons among the matched samples. In the changes analysis, we find that
non-US firms adopting US GAAP change accounting methods to comply with US GAAP. While
some non-compliance remains, it is due to primarily to nondisclosure of certain accounting
method choices, making it difficult to determine whether it is strictly a disclosure issue or
evidence of non-compliant choices being applied in the preparation of the statements.
We then examine whether the properties of the accounting output also change with the
adoption. Consistent with prior research demonstrating that the relation between cash flows and
accounting accruals is a fundamental property of different accounting standards, we construct
several variables that capture this basic accounting relation (i.e. the impact of making accrual
adjustments to cash flows). Prior literature documents that the correlation between accruals and
cash flows is generally less negative for firms reporting under US GAAP (e.g., Leuz et al. 2003,
Lang et al. 2006) and that the behavior of net income varies in predictable ways under US GAAP
(e.g., Dechow and Dichev 2002, Lang, Raedy and Yetman 2003, Lang et al. 2006). We also
construct variables that measure the level of conservatism/timeliness in reported earnings.
Although conservatism is not a deliberate property of US GAAP, it has been shown to differ
systematically across countries and accounting standards (e.g., Bushman and Piotroski 2006,
Watts 2003a, 2003b, Ball, Robin and Wu 2003). Our analyses indicate that properties of
accounting outputs for US GAAP adopters converge substantially towards those of US firms (and
away from the domestic matched firms), but that convergence is not complete. This suggests that
accounting standards will impact the level of comparability, but also indicates a need to
investigate other factors.
We then examine factors that potentially explain the variation in the implementation of US
GAAP observed in our first set of results, focusing on regulatory and capital market factors. First,
presuming that US regulators should be more familiar with monitoring and enforcing US GAAP

4
than regulators in other countries and given that the US regulatory oversight framework is often
cited as being of high quality (Foerster and Karolyi 1999, Doidge, Karolyi, and Stulz 2004), we
partition the sample into firms that have a security trading in the US and those that do not. We
predict firms that cross-list in the US face a higher degree of regulatory oversight and will exhibit
a higher level of compliance with US GAAP. However, Watts (2003a, 2003b) argues that
accounting conservatism is not part of regulatory oversight, and instead is driven by litigation and
contracting. Siegel (2005) shows that cross listing does not subject foreign firms to US litigation
and we have no reason to believe that cross-listing impacts contracting. Accordingly, we do not
expect regulatory oversight will impact the properties of accounting conservatism. As predicted,
we find that these firms generally disclose more compliant accounting choices and exhibit base
accounting properties (i.e., accruals) more consistent with the US matched sample than do firms
without a US security. Also consistent with our predictions there is no evidence of differences in
measures of conservatism across regulatory oversight partitions. Thus, regulatory oversight
contributes to higher US GAAP compliance for our sample firms, but only for items that the SEC
actively oversees.
Finally, we examine whether capital market incentives (need for equity capital, ownership
structure, analysts following etc.) influence adopting firms’ degree of compliance with US GAAP.
Prior studies have suggested that these influences have a strong impact on reported accounting
numbers (Land and Lang 2002). We develop a selection model of capital market incentives to
adopt US GAAP, and then use predicted values to partition the US GAAP adopters into firms with
low and high levels of capital market incentives. While we find that firms with high incentives
generally have a higher level of compliance in disclosure, we do not find the properties of their
accounting output differ across our proxy of capital market incentives.
Overall, the evidence suggests that global adoption of a single set of accounting standards
has the potential to increase the comparability of accounting information across countries that
5
differ economically, politically, and culturally. This conclusion stands in contrast to relatively
pessimistic conclusions in some prior research (Ball, Robin, and Wu 2003, Lang, Ready and
Wilson 2006). Our results emphasize the crucial role of regulation, which has been relatively less
emphasized in prior work (Leuz 2006). However, we find limited evidence that capital market
incentives impact the implementation of accounting standards.
This paper proceeds as follows. Section 2 discusses relevant international accounting
literature and motivation. Data and sample are described in section 3. Section 4 discusses results,
and section 5 concludes.
2. Motivation and Predictions
Differences in accounting practices across countries can result in similar economic
transactions being recorded differently. This lack of comparability complicates cross-border
financial analysis and investment (e.g., Harris 1998, Hawkins 2000, Bradshaw, Bushee, and Miller
2004). International standard setters have argued that this dilemma could be solved by creating a
single set of global accounting standards. However, accounting research indicates that global
implementation of the standards would vary, resulting in a failure to achieve the desired
comparability. That research has tested for comparability either by examining compliance with
disclosure rules or comparing properties of accounting information globally.
Studies of compliance with disclosure requirements focus predominantly on the
application of International Accounting Standards (IAS). Early studies document non-compliance
across a large number of firms claiming to apply IAS in their audited financial statements (Cairns
2001, Street and Gray 2001). More recently, a high degree of non-compliance in disclosure was
found in German Neuer Market firms that claimed to report with IAS or US GAAP (Glaum and
Street 2003). Non-compliance for these easily verifiable disclosures casts serious doubt that a
single accounting standard will be applied consistently on a global basis.
6
Additionally, many studies examine properties of accounting information across different
accounting regimes. Overall, these studies indicate that similar accounting is applied very
differently around the world. Ball, Robin and Wu (2003), an influential early study in the area,
compares the timeliness of earnings in reporting bad news across several countries that have
accounting systems based on common law sources. They document large variation in earnings
across these countries and conclude, “international differences in reporting incentives inherently
limit the extent to which international comparability of accounting information can be achieved
through homogenization of accounting standards alone” (p. 259). Subsequent studies support the
inferences of Ball, Robin, and Wu (2003). For example, Lang, Raedy and Wilson (2006) find that
non-US firms’ 20-F earnings reconciliations from home-country GAAP to US GAAP are not
comparable to earnings reported by US firms.
The general consensus from this literature is that both disclosure practices and properties
of accounting information are unlikely to fully converge under a single set of global accounting
standards. However, recent summaries of the literature call for further examination of these
issues, particularly in regards to understanding which factors impact implementation of accounting
standards (Ball 2006, Leuz 2006).
Prior studies face at least one of two limitations on their ability to generalize their results to
the outcome that would occur with a single set of high quality standards. First, papers often
compare accounting across similar but not identical accounting standards. Thus, the observed
differences in accounting properties may actually be driven by (seemingly minor) differences in
the accounting standards examined (Guenther 2002, Holthausen 2003, Leuz 2006). Second,
studies frequently lack benchmarks for the proper application of the various accounting standards
examined. For example, the early disclosure studies used the standards themselves as the
benchmark, but IAS was unclear in major respects during that time – leaving much of the decision
to judgment (Street and Gray 2001). Similarly, many of the subsequent studies on properties of

7
accounting information lack a reference point for properly applied accounting (Holthausen
(2003)). Absent good benchmarks, it is difficult to determine whether and how incorrect
applications of accounting standards occur. While this research provides valuable insights into the
current features of financial reporting around the world, these limitations make it tenuous to
generalize findings to a hypothetical global adoption of a single set of accounting standards.
In this paper, we use a sample of firms and research design that overcome these two
limitations. The firms all report under the same accounting standards (US GAAP) but are
domiciled across 27 different countries on six continents. This setting provides clear variation in
institutional, cultural, and economic backgrounds representative of what is expected under any
global adoption of a single set of accounting standards. In addition, we provide two benchmarks
to the sample firms: (i) a matched sample of US firms (that obviously report under US GAAP) and
(ii) a matched sample of firms from their home country (that report under their domestic GAAP).
These benchmarks allow us to determine whether firms claiming to adopt US GAAP actually
report accounting that is similar to that GAAP, or if they simply continue to report a version of
their home-country GAAP labeled as US GAAP.
Our first prediction is that firms will exhibit a noticeable shift in their accounting
disclosures and properties of accounting information after adopting US GAAP. The sample firms
combined with the two benchmark samples permit us to examine the following hypothesis (stated
in alternative form):
H1: Non-US firms that adopt US GAAP disclose accounting method choices and exhibit properties of accounting information similar (dissimilar) to that of US (home country) firms.
The literature argues that accounting standards are only one aspect that impacts the degree
of harmonization of accounting practices (Ball 2001). Prior research has suggested two broad
categories that will impact the success of harmonization: the regulatory environment and capital
market incentives faced by preparers (e.g., Land and Lang 2002, Burgstahler, Hail and Leuz

8
2006). We examine both of these factors to identify the extent to which they affect proper
implementation of US GAAP by our sample firms.
To examine the impact of regulatory environment, we partition our sample into firms that
cross-list on a US exchange (approximately 54% of the sample) and those that do not. Firms that
cross-list on a US exchange become subject to US regulatory review. Prior research has argued
that US oversight is stricter than that faced in other countries (e.g., Coffee 1999, Lang, Lins, and
Miller 2003).2 Additionally, the US SEC has greater experience in reviewing financial
information that is reported according to US GAAP. In comparison to regulators who rarely
review US GAAP statements, this increased familiarity should allow the US SEC to more
effectively review US GAAP financial statements. Thus, we expect that the subset of our sample
firms that also cross-list in the US will exhibit disclosure compliance and properties of accounting
information more similar to that of US firms.
As discussed later, we categorize our measures of properties of accounting information as
relating to ‘base’ accounting properties (i.e., accruals-related) and ‘conservatism’ properties.
While it is clear that the SEC is interested in application of proper accounting choices and accrual
accounting, prior research argues that conservatism is not an explicit feature of the US
governmental regulatory system (Watts 2003a). Rather, conservatism appears to be driven by
litigation concerns (Basu 1997, Watts 2003a, 2003b). Siegel (2005) provides evidence that cross-
listing in the US actually does not subject firms to the US litigation environment. Together, these
2 These papers propose an encompassing version of the “bonding” hypothesis, which assumes that cross-listed firms adopt the entire US regulatory and information environment when they cross-list. This suggests that our cross-listing partition captures more than just regulatory oversight. For example, cross-listed firms experience increased visibility, analyst following, and information environment (Lang, Lins, and Miller 2003, Lang, Raedy, and Yetman 2003). However, recent papers have challenged this encompassing version of the bonding hypothesis (i.e., Siegel 2005, Gozzi, Levine, and Shmukler 2006). Regardless of the status of this literature, if cross-listing proxies for the broader set of capital market influences predicted under the full bonding hypothesis, then we would find that all accounting attributes of cross-listed firms converge towards those of US firms, including those related to conservatism. As our subsequent results show, the results are more consistent with the more limited, regulatory interpretation of cross-listing that we provide in support of H2. Further, we provide direct tests of capital market influences in H3.

9
observations imply that US SEC oversight, will affect disclosure and base accounting properties,
but not accounting conservatism.
H2: Non-US firms that adopt US GAAP and list (do not list) a security on a US exchange will exhibit accounting disclosure and base properties of accounting information that are similar (dissimilar) to those of US firms. Cross-listing will have no impact on relative properties of accounting conservatism.
In addition to the regulatory environment, prior research emphasizes that capital market
incentives impact reporting behavior (e.g., Ali and Hwang 2000, Ball, Robin, and Wu 2003, Leuz,
Nanda, and Wysocki 2003, Burgstahler, Hail, and Leuz 2006). Indeed, Land and Lang (2002)
argue that such incentives have led to de facto harmonization in accounting implementation
despite continuing variation in standards. If non-US firms that adopt US GAAP do so to accrue
capital market benefits, then those firms with relatively more incentives will more completely
implement US GAAP. We model our firms’ exposure to various factors that proxy for capital
market related incentives, and use this measure to partition the sample. We test the following
hypothesis.
H3: Non-US firms that adopt US GAAP and display high (low) capital market incentives will exhibit earnings properties similar (dissimilar) to those of US firms.
3. Sample Description
3.1 SAMPLE CREATION
The primary data used in this study are obtained from a custom download of the Primark
Worldscope database that includes coverage from 1980 through February of 2001. The
Worldscope database has been used in many other studies (e.g., Leuz et al. 2003, Bhattacharya, et
al. 2003). Our sample firms are based outside of the United States and Canada and are identified
as using US GAAP as their basis of financial reporting (henceforth ‘sample’).3 For obvious
3 We exclude Canadian firms from our sample due to the implicit similarities between U.S. and Canadian GAAP. For example, the Multijurisdictional Disclosure System that allowed Canadian firms to file in the US using Canadian GAAP was in place throughout much of our sample period. The main rationale for this system was that the accounting standards and review environments were so similar. If Canadian firms are included in the analysis the statistical significance of many of the results decreases but the findings remain qualitatively similar.

10
reasons, we require all firms in our sample to have data for the accounting standards followed (i.e.
US GAAP, local).
Worldscope identifies 223 firms as reporting under US GAAP at some point during our
sample period. To validate Worldscope’s classification of the accounting standards followed, we
reviewed the most current annual report for which the firm was listed as employing US GAAP
(generally either fiscal 1999 or 2000). With exceptions noted below, for most firms the audit
opinion states that US GAAP was used for financial reporting. We find eight firms that
Worldscope classifies as reporting under US GAAP but that actually report under other standards.4
While these eight firms were the only observations with clearly identified miscoding, we also
exclude firms based on several other items noted during our review of annual reports. For 18 of
the remaining 215 firms we cannot find annual reports for the last year during which Worldscope
identifies the firms as reporting using US GAAP but can find subsequent financial statements that
indicate the firm no longer uses US GAAP. Presumably these firms once followed US GAAP but
have now switched to some other GAAP. However, it is possible that the firms always followed
non-US GAAP and were miscoded during some periods by Worldscope, we exclude these firms
from our sample. We also exclude five of the remaining 197 firms because the audit opinion does
not specifically identify which accounting standards the firm uses and three firms that have
financial statements without an audit opinion. Finally, we exclude eight firms for which all data
during our sample period is based on backfilling from historical financial statements filed as part
of an initial public offering and three firms that are majority owned by other firms in the sample.
The final sample consists of 178 firms.
Panel A of table 1 indicates that the sample firms represent 27 different countries from six
different continents with concentrations in Germany (32.6% of the sample), Japan (20.2%) and the
Netherlands (9.6%). Thirteen of the 178 firms have 1980 as their first year of US GAAP 4 Three of these firms report using German standards, two under IASB standards and one each under French, Irish and Chinese standards. There does not appear to be a systematic bias in the coding within any given country.

11
adoption. However, this is the earliest year on the database, and these 13 firms may have been
following US GAAP for some time prior to 1980. Of the remaining 165 firms, 119 were added to
the database after 1980 and report under US GAAP in the initial year of coverage (i.e., no data for
the year prior to US GAAP adoption). For the remaining 46 firms, we can positively identify a
switch to US GAAP from either local GAAP or International Accounting Standards while being
covered by Worldscope.
Several aspects of the final sample reflect macroeconomic changes. For example, the
majority of the German firms were added to the database in 1999 and 2000, consistent with these
firms being listed on the recently founded ‘Neuer Market’ that allows registrants to file US GAAP
financials.5 Similarly, many of the European firms were added in the late 1990s as markets such
as EASDAQ and SEAQ began to allow US GAAP for listings. On the other hand, Japanese firms
make up the bulk of the 13 firms using US GAAP in 1980. This is consistent with reporting rules
in Japan that have long allowed domestic firms trading on US exchanges to provide financial
reports under US GAAP. Thus, the timing and coverage of firms reporting under US GAAP is
consistent with changes in the financial markets that permit such reporting.
We construct two matched samples to be used for comparison purposes in several of the
tests. The first sample consists of non-US firms that report under their respective local GAAP
(henceforth ‘non-US’ sample). We do not predict or expect that the accounting method choices
for the non-US sample firms should be compliant with US GAAP. Rather, we use the non-US
sample as a benchmark to assess whether firms purporting to use US GAAP modify their
accounting relative to similar firms in their home country. For each firm in our primary sample,
we identify firms from the same country that follow local accounting standards. We attempt to
match as closely as possible on (i) industry (using four digit SICs), (ii) calendar year, and (iii)
market value. Preference for matching criteria follows this order. We are able to match all sample
5 See Leuz (2003) for a detailed discussion of this stock exchange.

12
firms with a firm from their home country and most firms at the two-digit SIC level. Similarly,
most matched non-US firm-years are the same or within one year of the respective sample firm-
year. The ability to obtain a match with reasonably close market values, our last matching criteria,
varies greatly across countries.
The second matched sample consists of US firms. This control sample provides a
benchmark for assessing whether the sample firms comply with US GAAP in a manner consistent
with those of similar firms in the US. The matching criteria resemble that for the non-US sample
with the exception of the country-level criterion. For most firms, we are able to achieve relatively
close industry matches. However, the Worldscope database did not begin covering US firms until
1985. Thus, it is impossible to match calendar years for approximately 8.5% of firms with year 0
occurring prior to 1985.
From the above discussion, it is obvious that the firms in our sample self-selected to use
US GAAP. This naturally leads to the question of whether the self-selection necessarily leads to a
bias in interpreting the results. There are several reasons to believe self-selection bias does not
have a large impact on our results, which are discussed in Appendix 1. There, we argue that there
are strong ex-ante reasons to believe there is zero or very small correlation between adoption of
US GAAP and the ability to implement that GAAP. Further, our research design includes
matching and longitudinal analysis, both of which mitigate any self-selection biases that might
exist. Finally, even if some bias remains, examining our sample of firms provides a number of
benefits to our understanding of implementation of non-local accounting standards.
4. Results
4.1 COMPLIANCE WITH US GAAP
4.1.1 Measuring Compliance in Form with US GAAP
We first examine the accounting choices made by non-US firms adopting US GAAP to
determine whether the firms actually adopt compliant accounting methods. The Worldscope

13
database provides information on 32 accounting method choices for each firm, covering a number
of accounting choices such as goodwill, research and development (R&D), and financial statement
cost basis. Many of the accounting method choices are merely descriptive in nature (e.g., reasons
for disclosed contingent liabilities, explanation of the nature of extraordinary items recorded), and
others are characterized by options that are all permissible under US GAAP (e.g., depreciation
method choices). After removing accounting choices that are descriptive or nondiscriminatory, we
retain 13 accounting method choices. Appendix 2 lists these choices, the alternatives we treated as
being compliant with US GAAP, and those we treated as non-compliant.6 This appendix also
shows the percentage of all US firm-years on Worldscope that would be treated as having
compliant accounting choices under our coding algorithm.7 For the majority of the accounting
methods, the overall US firm compliance level is greater than 95%, providing empirical support
for our definition of compliance, as well as some assurance regarding the integrity of
Worldscope’s coding of accounting choices.8
Having classified each independent accounting choice as either compliant or not compliant
with US GAAP, we next compute US GAAP compliance ratios, where the numerator is the
number of accounting method choices that comply with US GAAP and the denominator is the 6 During our sample period, 1980-2000, there were changes in US GAAP for several of our coded accounting method choices. Our coding is based on US GAAP rules that were in place at the time the firm filed the financial statements. For example, prior to 1989 APB 19 allowed a wide range of funds definitions on the cash flow statement. However, when the FASB issued Statement of Financial Accounting Standards No. 95 effective in 1989, this latitude was reduced. Our coding was adjusted appropriately. 7 Bradshaw, Bushee and Miller (2004) use the same set of accounting choices to examine whether firms with a greater proportion of accounting choices that conform to US GAAP attract more US investment. As part of their analyses, they use a sample of firms listing ADRs on US exchanges to examine the relation between 20-F reconciliations of home country statements and US GAAP. They find that the compliance ratio is significantly negatively related to the magnitude of 20-F reconciling items, indicating that firms with a less compliant ratio have a greater magnitude of reconciling items, providing further evidence that the ratios capture US GAAP conformity. 8 Two accounting methods have a low percentage of compliance. Research and development expense is coded as consistent with US GAAP in 43.4% of the firm-year observations. Remaining observations were recorded as not reporting their treatment of such expenses. This low level of compliance is likely due to firms not incurring material R&D costs, and hence not disclosing a method of accounting for R&D. Second, the funds definition on the statement of changes in financial position has a compliance rate of 86.0%. This likely reflects uncertainties that continued to exist after the issuance of Statement of Financial Accounting Standards No. 95 regarding what definition of cash was to be reconciled on the statement of cash flows. In unreported analysis, we find that the compliance rate of this method climbs steadily over the five years following the issuance of the standard and approaches 100% compliance by 2000.

14
total number of accounting method choices under consideration. While the treatment of disclosed
non-compliant methods is clear (such as expensing taxes on a cash basis), the treatment of non-
disclosed items is not. One could argue that US GAAP requires disclosure of many of these items,
and hence non-disclosure is tantamount to non-compliance with US GAAP. Alternatively, one
could argue that non-disclosure is less problematic and should not be treated as non-compliance or
that non-disclosure simply reflects that the related financial statement accounts are not applicable
or immaterial (e.g., R&D). As the proper assumptions are not obvious, we compute two different
ratios for each firm.
RATIO1 is defined as the number of accounting method choices in compliance with US
GAAP divided by the number of all accounting choices we code (n=13).9 This ratio assumes that
any non-disclosed accounting choices are inconsistent with US GAAP. This ratio is a strict
interpretation of US GAAP, placing equal emphasis on disclosure and validity of accounting
method choice. RATIO2 relaxes the non-disclosure assumption by including only accounting
methods the firm discloses. The total number of methods consistent with US GAAP is then
divided by the total number of items disclosed. The number of accounting methods included in
the denominator of this ratio can vary across both firms and years.
4.1.2 Tests of Disclosure Compliance with US GAAP
Figure 1 provides the distribution of compliance ratios for the sample firms and their non-
US and US matched samples; table 2 provides distributional statistics and tests of differences
among the compliance ratios. For RATIO1, the evidence suggests that many non-US firms
claiming to use US GAAP (sample firms) are not fully compliant with US GAAP. In fact, the
mean firm complies with just over half of the accounting choices. The pattern improves markedly
for RATIO2, which does not penalize non-disclosure. Mean (median) compliance with US GAAP
9 The numerator is simply a count variable, and we transform it to a ratio to be consistent with the alternative measure, RATIO2, discussed below.

15
climbs to 93.7% (100%). The appreciable shift in the distribution shown in figure 1B relative to
1A suggests incomplete disclosure characterizes the financial reporting of many non-US firms.
Given the unobservability of the non-disclosed items, it is impossible to tell whether they are
simply non-applicable, applicable and not disclosed but compliant with US GAAP, or strategically
not disclosed due to non-compliance with US GAAP.
For 46 of the firms we have time-series data regarding accounting choice that allows us to
examine whether these firms actually change accounting choices as they adopt US GAAP or if
they have always been more compliant than their non-US matches. Where such data is available,
we compare the year US GAAP is adopted (year 0) to the 3 years before and after adoption
(labeled years -1,-2, -3, and +1, +2, and +3). Figure 2 shows this analysis, which finds our sample
firms made noticeable accounting method changes in the year of US GAAP adoption. There is a
slight drift upward in years -2 and -1, but the major changes occur in the year of official adoption.
Combined, these results suggest that the sample firms are significantly more compliant
with US GAAP than their matched non-US counterparts, indicating the sample firms are making
at least some attempt to comply with US GAAP as they claim. The significant changes in
disclosed accounting method choices are consistent with H1. However, final interpretation of the
results on our measures of compliance relies primarily on how one views non-disclosure. If one
believes that non-disclosure indicates a non-applicable accounting method, then RATIO2 points
towards a strong attempt to properly implement US GAAP. This interpretation might be due to
the industry and size matching not properly controlling for firm characteristics. Alternatively, the
non-disclosure could reflect persistent cultural differences in disclosure (Hope 2003). Thus, firms
may be following accounting methods required under US GAAP, but simply failing to disclose
those accounting methods. Finally, it is also possible that managers are purposely withholding
disclosure of accounting methods that are non-compliant with US GAAP. In the absence of

16
disclosure, it is not possible to discriminate among these explanations, so we rely on the observed
properties of accounting output, discussed next.
4.2 PROPERTIES OF ACCOUNTING OUTPUT
For all variables, our analyses are cross-sectional within sample and use all data available
within the three years prior to (periods -3, -2, -1) and/or three years subsequent to (period +1, +2,
+3) adoption of US GAAP.10 We focus on two categories of accounting properties: ‘base’
accounting relations and ‘conservatism/timeliness’ properties. The first category relies on accruals
being the defining characteristic of any accounting system, representing judgments and
adjustments made to cash flows to arrive at accounting income. Accordingly, differences in
accounting methods should not impact cash flows, but should influence the level of accruals for a
given level of cash flows. Two of our variables measure accruals directly. The first is the
univariate correlation between accruals and cash flows; the second is the standard deviation of the
Dechow and Dichev (2002) residual (hereafter, ‘Dechow-Dichev residual’).11 Cash flows are net
cash flows from operations, and accruals are computed as the difference between net income
(before extraordinary items and preferred dividends) and cash flows. Both variables are scaled by
beginning total assets. Consistent with prior research (Leuz et al. 2003, Lang et al. 2006) we also
examine the variance of the absolute value of change in net income as another measure of accrual
effects.
Our second category captures conservatism or timeliness of bad news loss recognition
(e.g., Ball, Kothari and Robin 2000, Ball, Robin and Wu 2003, Ball and Shivakumar 2005, Lang,
Raedy, and Wilson 2006). Prior studies clearly demonstrate that timeliness of recognizing bad
news events is a distinguishing feature of accounting information across different reporting 10 This results in sample sizes that vary according to the availablity of data, which is common in this literature. 11 Dechow and Dichev (2002) use OLS regressions to examine the extent to which accruals can be explained by lagged, contemporaneous, and next period cash flows. Their study examines US firms only, and they interpret a smaller standard deviation of residuals as indicative of higher quality earnings. We are not aware of any studies that examine this variable in an international reporting context. Thus, it is an empirical question whether their interpretation holds in other settings, so our tests of differences are non-directional.

17
environments. We use four measures of conservatism/timeliness (hereafter ‘conservatism’)
identified in prior research: frequency of large negative net income, skewness of net income, the
coefficient on the interaction of negative returns and net income as described in Basu (1997), and
the coefficient on negative cash flows as described in Ball and Shivakumar (2005).
In table 3, we report sample means or distributional statistics for each variable. For each
sample, we report statistics for data pooled across the three years subsequent to adoption of US
GAAP by the sample firms (columns labeled ‘After’). For the sample firms only, we also tabulate
means for data pooled across the three years prior to adoption of US GAAP (labeled ‘Before’).
Sample sizes (i.e., firm-years) are noted below each test statistic. Significance levels for tests of
differences across samples and between periods (for the US GAAP adopters) are indicated next to
each test statistic.
Results for the base accounting relations are presented in panel A of table 3, and results for
conservatism in panel B. For the sample firms, the Before-After comparison in panel A indicates
that the accruals-cash flows correlation becomes significantly less negative and the variance of net
income changes increases following adoption of US GAAP. We find no significant change in the
Dechow-Dichev residuals. Similarly, comparison between the sample and non-US matched
sample indicates that after adoption of US GAAP, the sample firms differ significantly from the
non-US matched sample for all three variables. Comparing the sample and US firms yields mixed
results. There is no statistically significant difference between the accruals-cash flow correlations
and Dechow-Dichev residuals, consistent with successful implementation of US GAAP by the
sample firms. However, the variance of net income changes remains significantly higher for the
US firms. Overall, the results in table 3 indicate noticeable changes in the properties of
accounting for the sample firms away from that of the non-US counterparts and towards that of
US firms.

18
Panel B of table 3 presents analogous tests for measures of conservatism. Again, most of
the measures demonstrate a convergence of reported accounting numbers by the US GAAP
adopters towards that of US firms. The within sample test indicates three of the four variables
change to be more consistent with US firms.12 Similarly, three of the four variables are
statistically indistinguishable from those of US firms. Additionally, for two of the four variables,
the sample firms report accounting numbers that diverge predictably from the non-US matched
sample. As with the base accounting relations in panel A, the overall evidence in panel B
indicates an adjustment in accounting properties post US GAAP adoption. The results for base
accounting properties and conservatism are consistent with the prediction in H1.13
4.3 IMPACT OF REGULATORY OVERSIGHT
H2 predicts regulatory oversight will impact the degree of compliance with US GAAP.
Results of testing this hypothesis are presented in table 4. As predicted, the results show that firms
with securities trading in the US have significantly higher mean (and untabulated median)
disclosure compliance ratios when compared to firms without US securities. Additionally, panel
A of table 4 shows that for all three base accounting metrics, firms subject to US regulation
exhibit accounting properties that are closer to those of US firms. This is consistent with
regulatory oversight impacting the base accrual properties of US GAAP. Also consistent with our
predictions, Panel B of table 4 finds no relation between conservatism and US regulatory
oversight. Overall, our results are consistent with both components of H2.
12 The Basu Return*Dummy coefficient is the only insignificant variable. The relatively low magnitudes of the coefficient estimates (e.g., approximately 0.03) are similar to prior research (e.g., Ball, Robin, and Wu 2003), with the exception of US firms, where we obtain an estimate of 0.12 relative to approximately 2-3X this magnitude. Our sample size is relatively small and the resulting Basu coefficients appear to be relatively unstable. In untabulated analysis, we have replicated that this instability is common in small samples using the Basu approach. 13 We also compared the properties of accounting outputs for firms with the highest compliance ratios with those of firms with the lowest ratios. If compliance in form leads to compliance in implementation, we expect the high compliance in form group to exhibit accounting numbers with properties closer to those of US firms. For the base accounting relation variables, we found evidence consistent with higher compliance in form being associated with a less negative accruals-cash flows correlation, higher variance of net income changes, and lower Dechow-Dichev residuals (the last two statistically significant). However, for the conservatism variables, we find limited evidence of any difference between the subsamples.

19
These results highlight the importance of regulatory oversight in achieving comparability
of accounting data (Street 2002). Our results imply that sufficient regulatory oversight can
overcome (or at least mitigate) the institutional incentives that prior research indicates will hinder
harmonization (Ball, Robin and Wu 2003, Lang, Raedy and Wilson, 2006). However, our
findings also indicate that users of financial information will need to be aware of which properties
of accounting are reviewed by regulators, since it is likely that unreviewed items (e.g.,
conservatism) will be less comparable.
4.4 CAPITAL MARKET INCENTIVES
Our final analysis provides evidence for H3 regarding firm-specific incentives to properly
implement US GAAP. H3 argues that conditional on having adopted US GAAP, firms with
greater incentives should be more motivated to properly implement it. To test H3, we first must
model firms’ capital market incentives. We develop a model that estimates capital market
incentives of firms that adopt US GAAP relative to the matched sample of home country firms
that continue to report on their domestic GAAP. We then use the fitted values from this model to
partition the firms that adopt US GAAP into those with high vs. low capital market incentives.
Table 5 present the comparison of firms adopting US GAAP with those reporting under
domestic standards. Panel A of table 5 presents tests of differences in means and medians of
various characteristics (discussed below), while panel B examines the relation between these
variables and the probability of adopting US GAAP using a logit analysis.14 We first consider
whether non-domestic equity security listings are associated with the decision to adopt US GAAP,
consistent with US institutional investor preferences (Bradshaw, Bushee and Miller 2004). Firms
that list on multiple exchanges are likely to have a wide range of shareholders examining their
financial statements, so we count the total number of exchanges on which the firm trades
14 Given our country-level matching procedure, we need not examine country-level characteristics. The firm-level factors we focus on are related to a need or incentive to communicate with global external firm stakeholders.

20
(#EXCHANGES). Consistent with our expectations, univariate analyses show that the sample
firms to be more likely to trade on a greater number of exchanges.
Firms with a high-level of block shareholders can communicate to these groups informally
or by providing additional analysis on request. Accordingly, such firms are less likely to need to
use their formal accounting system as a means of external communication. Consistent with this,
we find that the proportion of shares closely held (by officers, directors and their immediate
families, pension plans, and large block shareholders, CLOSEHELD) is negatively related to the
likelihood a firm will chose to report using US GAAP. Conversely, firms that rely heavily on
external capital providers are likely to benefit from US GAAP. We measure the absolute value of
net financing from issuance and retirement of stock and debt (ABSEXFIN). The sample firms
have significantly higher ABSEXFIN, indicating they are likely to benefit from reporting under an
internationally recognized set of accounting standards.
Managers might be able to enhance the external credibility of financial reports by hiring an
established and internationally recognized auditing firm. Indeed, our sample firms are more likely
than their non-US counterparts to be audited by one of the big four international accounting firms
(BIG4).15 Similarly, a large and active analyst following may reassure external investors that
sophisticated users are analyzing the firm’s financial information. However, we find no relation
between analyst following (NUMEST) and the adoption of US GAAP.
Debt lenders tend to make conservative investment decisions, leaving high growth and
innovation-oriented firms to struggle for capital in debt-based systems (Leuz and Verrecchia
2000). Thus, we expect our sample firms are more likely to be high growth firms investing in
innovation. We examine sales growth (GROWTH) and research and development (RD) of our
firms, with mixed results. Consistent (inconsistent) with expectations, RD (GROWTH) is
significantly higher (no different) for the sample firms. A caveat here is that both variables are 15 Approximately 25% of our sample firms were missing data on the auditor used by the firm. For these firms, we searched several databases, such as One Scope and Compact Disclosure to identify their auditor.

21
calculated using information produced under different accounting systems, which may add noise
or bias to a comparison across the samples. We also include control variables for firm performance
(ROE) and size (in $US, LOGMV). ROE does not differ between the non-US and US GAAP
adopters, but LOGMV is significantly larger for sample firms.
We use the fitted values from the logit model to proxy for capital market incentives within
our firms. In table 6, we partition the sample of US GAAP adopters based on the fitted values and
revisit the earlier analyses for properties of reported accounting numbers. While the high
incentive firms are significantly more compliant in disclosure (as measured by RATIO1), none of
the seven output variables are statistically significant in predicted directions, inconsistent with the
prediction in H3. Thus, in contrast to our results conditional on regulation, these results offer no
support for capital market incentives being a significant determinant of the proper implementation
of accounting standards.16
5. Conclusion
Accounting standard setters and regulators around the globe are striving to harmonize
accounting standards with the goal of creating one set of high quality accounting rules to be
applied around the world. Little evidence exists regarding the feasibility of this goal. In this
paper, we examine a sample of non-US firms that adopt US GAAP as their primary accounting
standards to provide evidence related to the use of a single set of detailed accounting standards
across widely varying cultural and institutional settings. Our sample firms are domiciled in 27
different countries across six continents, representing significant geographic, economic, political,
and cultural diversity. Accordingly, our sample and research design provides a unique opportunity
for simulating the environment that is likely to occur when a globally harmonized set of standards
is implemented.
16 While there are three significant differences on the table, all are in the opposite direction of our predictions. Our prior predictions provide no explanation for why capital market incentives would lead to less successful application of US GAAP.

22
We find that adopting US GAAP significantly alters non-US firms reported accounting
method choices, and impacts the properties of reported accounting numbers in terms of accruals-
cash flows relations and some measures of conservatism. In addition, we find that regulation
generally increases compliance in disclosed accounting choices and generates accrual relations
similar to US firms, but has little impact on measures of conservatism. We find no support for
capital market incentives being a primary driver of compliance. Overall, we interpret our results
as consistent with harmonization of accounting standards being likely to have a significant impact
on increasing global comparability of accounting information.
Our study is subject to several caveats. First, our conclusions regarding whether sample
firms actually adjust accounting method choices to be compliant with US GAAP are dependent on
assumptions made regarding non-disclosure of accounting method choices. Treating non-
disclosure as a violation, we conclude that sample firms are not compliant with US GAAP.
Relaxing this assumption, we conclude that most sample firms are compliant with US GAAP,
although a non-trivial number of firms appear non-compliant. Second, as with much of the
international literature, many of our tests rely on small samples due to data limitations. Third, the
firms in our sample implement US GAAP in environments where it is not normally used. Many
of the agents that constitute the support structure for local GAAP, such as auditors and regulators,
may not be as efficient in helping to implement US GAAP. Obviously, if a broadly used
international set of standards was created, the supporting agents would become more familiar with
these standards and overall compliance (including disclosure) might be higher than suggested
here.

23
References Ali, A. and Hwang, L. “Country-Specific Factors Related to Financial Reporting and the Value
Relevance of Accounting Data.” Journal of Accounting Research 38, no.1 (2000): 1-21. Ball, R., 2001. “Infrastructure Requirements for an Economically Efficient System of Public
Financial Reporting and Disclosure.” Brookings-Wharton Papers on Financial Services, 127-169.
Ball, R., 2006. “IFRS: Pros and Cons for Investors.” Working paper, June 4. Available at http://www.icaew.co.uk/cbp/index.cfm.
Ball, R., S.P. Kothari and A. Robin. “The effects of institutional factors on properties of accounting earnings: international evidence.” Journal of Accounting and Economics 29 (2000): 1-51.
Ball, R., A. Robin and J. Wu “Incentives Versus Standards: Properties of Accounting Income in Four East Asian Countries, and Implications for Acceptance of IAS.” Journal of Accounting and Economics (2003): pp 235-270.
Ball, R and L. Shivakumar. "Earnings quality in UK private firms: comparative loss recognition timeliness.” Journal of Accounting and Economics 39 (2005): 83-128.
Basu, S. “The conservatism principle and the asymmetric timeliness of earnings”, Journal of Accounting and Economics (1997): pp. 3-37.
Bhattacharya, U., H. Daouk and M. Welker. “The world price of earnings opacity.” Accounting Review 78 (2003): 641-678.
Bradshaw, M., B. Bushee and G.Miller “Accounting Choice, Home Bias, and US Investment in Non-US Firms” Journal of Accounting Research Vol. 42 No. 5 (December 2004), pp. 795-841.
Burghstahler, D., L. Hail and C. Leuz. “The importance of reporting incentives: earnings management in European private and public firms.” The Accounting Review (2006, forthcoming).
Bushman, R. and J. Piotroski. “Financial reporting incentives for conservative accounting: the influence of legal and political institutions.” Journal of Accounting and Economics (2006, forthcoming).
Cairns, D. “International Accounting Standards Survey 2000.” David Cairns International Financial Reporting, 2001.
Coffee, J., 1999. “The Future as History: The Prospects for Global Convergence in Corporate Governance and its Implications.” Northwestern University Law Review, 641-708.
Dechow, P. and I. Dichev “The quality of accruals and earnings: The role of accrual estimation errors”, The Accounting Review 77 (Supplement 2002): pp 35-59.
Doidge, C., G. A. Karolyi and R.M. Stulz. “Why are foreign firms listed in the U.S. worth more?” Journal of Financial Economics 71 (2004): 205-238.
Dye, R. and S. Sunder, “Why Not Allow the FASB and the IASB Standards to Compete in the U.S.?” Accounting Horizons (2001): 257-71.
FEI Online, “Harmonization of Accounting & Reporting Standards – International Outlook 2001” http://www.fei.org/magazine/Exclusives/tweedie1_17_01.cfm
Foerster, S. and A. Karolyi, “The effects of market segmentation and investor recognition on asset prices: evidence from foreign stocks listing in the U.S.” Journal of Finance 54 (1999): 981-1013.
Glaum, M. and D.L. Street, 2003. “Compliance with the Disclosure Requirements of Germany’s New Market: IAS Versus US GAAP.” Journal of International Financial Management and Accounting 14, 64-100.

24
Gozzi, J., R. Levine, and S. Shmukler, 2006. “Internationalization and the Evolution of Corporate Valuation.” Working Paper, Policy Research Working Paper Series, The World Bank, 2006.
Guenther, D.A., 2002. “Discussion of Empirical Evidence on the Evolution of International Earnings.” The Accounting Review 77 Supplement, 135-138.
Harris, T. “Overcoming Accounting Differences: A Stockpicker’s Guide to the Numbers that Count.” Morgan Stanley Dean Witter Apples to Apples project, 1998.
Hawkins, D. “International Accounting Standards: Updated Review, Handling Diversity and US GAAP Contrasted.” Merrill Lynch, Pierce, Fenner & Smith, 2000.
Heckman, J., 1979. “Sample Selection Bias As A Specification Error.” Econometrica, Vol 47, No 1. (January): 153-161.
Heckman, J., 1990. “Varieties of Selection Bias.” AEA Papers and Proceedings: 313-318. Heckman, J., 2000. “Causal Parameters and Policy Analysis in Economics: A Twentieth
Century Retrospective.” The Quarterly Journal of Economics (February): 45-97. Holthausen, R. “Testing the relative power of accounting standards versus incentives and other
institutional features to influence the outcome of financial reporting in an international setting” Journal of Accounting and Economics (2003): pp 271-283.
Hope, O.K. “Firm-level Disclosure and the Relative Roles of Culture and Legal Origin” Journal of International Financial Management & Accounting (2003): pp 218-248.
Land, J. and M. Lang “Empirical Evidence on the Evolution of International Earnings”, The Accounting Review (2002)
Lang, M., K. Lins, and D. Miller, 2003. “ADRs, Analysts, and Accuracy: Does Cross Listing in the United States Improve a Firm’s Information Environment and Increase market Value?” Journal of Accounting Research 41, 317-345.
Lang, M., J. Raedy and M. Yetman “How Representative are Cross-Listed Firms? An Analysis of Firm and Accounting Quality.” Journal of Accounting Research Vol. 41 No. 2, (2003): pp 363-396.
Lang, M., J. Raedy and W. Wilson. “Earnings management and cross Listing: Are reconciled earnings comparable to US earnings?” Journal of Accounting and Economics (2006, forthcoming).
Larcker, D.F. and T. Rusticus, 2005. “On the Use of Instrumental Variables in Accounting Research.” Working Paper. The Wharton School.
Leuz, C. “IAS versus US GAAP: A ‘New Market’ Based Comparison.” Journal of Accounting Research (2003): pp 445-472.
Leuz, C., “Cross Listing, Bonding and Firms’ Reporting Incentives: A Discussion of Lang, Raedy and Wilson.” Journal of Accounting and Economics (2006, forthcoming).
Leuz, C., D. Nanda and P. Wysocki “Investor Protection and Earnings Management: An International Comparison.” Journal of Financial Economics (2003): pp 505-527.
Leuz, C., and R. Verrecchia “The Economic Consequences of Increased Disclosure.” Journal of Accounting Research Vol. 38, Supplement (2000): pp 91-124.
Lewis, G. “Unionism and Relative Wages Effects: A Survey.” Chicago, IL: University of Chicago Press, 1986.
Li, K. and N.R. Prabhala. “Self-Selection models in corporate finance.” In Handbook of Corporate Finance: Empirical Corporate Finance, ed. B. Espen Eckbo. Elsevier/North-Holland, forthcoming.
Nair, R.D. and W. G. Frank, 1980. “The Impact of Disclosure and Measurement Practices on International Accounting Classifications.” The Accounting Review, July, 426-450.
Robinson, C., 1989. “The Joint Determination of Union Status and Union Wage Effects: Some Tests of Alternative Models.” Journal of Political Economy, Vol.97, No. 31: 639-667.

25
Siegel, J. “Can Foreign Firms Bond Themselves Effectively by Renting U.S. Securities Laws?" Journal of Financial Economics 75 No. 2, February (2005): pp. 319-359.
Street, D.L., 2002. “An Interview with Sir David Tweedie, Chair International Accounting Standards Board.” Journal of International Financial Management and Accounting 13, 73-100.
Street, D.L. and S.J. Gray, 2001. “Observance of International Accounting Standards: Factors Explaining Non-compliance by Companies Referring to the Use of IAS (ACCA Research Monograph).
Watts, R. “Conservatism in Accounting, Part I: Explanations and Implications.” Accounting Horizons (2003a): pp. 207-221.
Watts, R. “Conservatism in Accounting, Part II: Evidence and Research Opportunities,” Accounting Horizons (2003b): pp. 287-301.

26
Appendix 1: Self-selection vs. self-selection bias
Firms in our primary sample have self-selected to report under US GAAP rather than
their home-country GAAP, raising the obvious question of how such self-selection impacts the
empirical results. The primary issue is whether this self-selection biases our ability to generalize
the results. While recent research in accounting and finance has often made econometric
adjustments in an attempt to account for self-selection bias, methodologies are largely based on
advances in the labor economics literature (e.g., the effect of unionization or training on wages).
This appendix draws analogies between that literature and our study to address self-selection
bias, and discusses three reasons why such self-selection concerns need not limit the contribution
of our study.
Self-selection bias is a correlated omitted variable problem (e.g., Heckman 1979, 1990,
2000, Li and Prabhala 2006, etc.). It is often overlooked that self-selection does not necessarily
create bias; there must be correlation between the selection criteria and the dependent variable of
interest (Heckman 1979, 1990, Robinson 1989). For example, if an individual joins a union
based on private information about the relative value of union membership to him, then that
private information must be modeled in the research design and/or statistical tests examining the
wage benefits from joining a union. If these selection criteria are correlated with observed wages
but not modeled by the researcher (e.g., nonunion alternatives undesirable), a classical correlated
omitted variable problem arises. If the decision, however, is due to factors either unrelated to the
treatment or dependent variable, then self-selection bias is not a concern (e.g., unknowingly
joined a union due to confusing human resources paperwork). 17
In our study, it seems reasonable that firms adopt US GAAP when they perceive it will
have some benefits, resulting in self-selection. However, our interest is not in benefits of
adopting US GAAP per se, but whether non-US adopting firms implement US GAAP similar to
implementation by US firms. The self-selection to adopt US GAAP leads to self-selection bias
only if the non-US firms’ assessment of potential benefits from US GAAP adoption is correlated
17 Many years ago, both of the authors inadvertently became union members (temporarily) for this reason.

27
with the ability to properly implement US GAAP. If there is no correlation between adoption
and implementation ability, then our sample firms’ self-selection does not create a self-selection
bias. If there is correlation, but it is adjusted for in research design, then there is no self-
selection bias in interpreting the results. In this appendix, we discuss three items that suggest
self-selection bias is not a limiting factor in this study: (1) we argue that there are reasons to
believe that adoption and ability are uncorrelated, (2) our matched sample research design likely
mitigates any residual self-selection bias, and (3) even allowing for self-selection bias, our
results provide useful evidence to the literature.
(1) No correlation between decision to adopt and ability to implement
There are several economic reasons to expect zero or low correlation between US GAAP
adoption and implementation ability. First, managers may be uncertain as to their ability to
implement US GAAP, particularly relative to the ability of other firms. Such uncertainty (often
referred to as “imperfect foresight”), leads to low or zero correlations between adoption and
outcomes (Heckman 1990). Second, firms that do not expect benefits from adopting US GAAP
are not likely to adopt even if they could properly implement US GAAP. Indirect relations of
this type lead to zero correlations, and thus no bias (Robinson 1989). Third, empirical evidence
in our paper and earlier accounting papers suggest benefits and implementation ability are not
linked. For example, we test whether a firm’s ex-ante expectations of benefits is related to
implementation, finding no evidence of such a correlation (Table 6). Additionally, Leuz and
Verrecchia (2000) study a sample of German firms that adopted US or IAS GAAP, and report
evidence consistent with the firms receiving benefits through reductions in information
asymmetry. However, their sample firms traded on the Neur Market, which was subsequently
disbanded due to fraud, suggesting that these firms received benefits without proper
implementation.18 In summary, all of these arguments are consistent with our sample being
subject to self-selection but not self-selection bias.
18 Glaum and Street (2003) study German Neuer Market firms and find a high degree of non-compliance with IAS and USGAAP. Similarly, untabulated analysis within our sample finds the German firms have an extremely low

28
(2) Research design to mitigate self-selection biases
Notwithstanding the above arguments regarding reasons to expect that the decision to
adopt US GAAP is uncorrelated with the ability to implement US GAAP, our research design
deliberately addresses concerns of self-selection bias. First, we employ a matched sample design
based on factors that we expect ex ante to be correlated with implementation ability, including
country, industry and firm size. To the extent these variables effectively capture unobserved
implementation abilities, they mitigate self-selection bias. Our approach is consistent with
economics and corporate finance literature, in which usesof matched samples are “methods du
jour in the most recent applications” (Li and Prabhala 2006).19 Second, many of our tests
employ a changes methodology, where the firm serves as its own control (Table 3). Our ‘before’
and ‘after’ tests are longitudinal analyses, which have been shown to be a useful methodology
for mitigating possible effects of self-selection bias (Robinson 1989).
(3) Useful evidence even with self-selection bias
Finally, even if our research design was plagued by unspecified self-selection biases, it is
useful to consider whether our results might still provide evidence useful to the literature.
Although researchers are frequently concerned with the impact of biases on generalizability of
results, there is merit in understanding the ability of our sample firms to implement US GAAP.20
Within the international accounting literature, prior research suggests that cultural factors will
prevent globally comparable financial statements under a single set of standards (Ball, Robin and
compliance with implementation. Conditional on the sample overlap with Leuz and Verrecchia (2000), this provides further evidence that benefits and implementation are not linked. 19 Lai and Prabhala (2006) argue that matching is being used due to its simplicity, ease of interpretation, and the minimal specification structure required. They correctly point out a trade-off that matching also requires a strong assumption that unobserved economic information is irrelevant. While a properly implemented two-step model may allow for modeling of some limited subset of unobserved information, a review of the economics literature indicates that practical implementation of such models has generally met with mixed success (Lewis 1986, Heckman 1990, Robinson 1989). In fact, such adjustments possibly result in inconsistent estimates and perhaps create a separate bias. These issues may be even more pronounced in an accounting setting, particularly one that involves voluntary disclosure (Larcker and Rusticus 2005). 20 As an example from the economics literature, in discussing the possible self-selection bias in the context of examining wages and unionization, Heckman (1990, p. 314), points out that “It is also interesting to know what is the effect of unionism on the unionized.”

29
Wu 2003).21 That literature implies that even within a group of self-selected GAAP adopters
from varying cultural backgrounds we would not find an increase in the comparability of
financial statements. However, we find increased comparability in many aspects of accounting.
Additionally, within-sample cross-sectional tests (Table 4) provide evidence that regulatory
oversight is one means of generating better implementation. All of these findings provide
evidence useful for assessing the potential outcomes of firms from varying economic, political,
and cultural backgrounds adopting a single set of accounting. Relative to prior literature, our
results indicate a very different, and more positive, view of the potential for an international set
of accounting standards. If one believes some self-selection bias exists, the ability to generalize
these within sample findings depends on the ex ante abilities of non-adopting firms to implement
a new set of standards and on the perceived level of bias remaining after our matched-sample
research design. If one believes the majority of firms will make reasonable efforts to implement
some set of globally accepted set of accounting standards, then our results provide evidence that
such international standards would increase the comparability of financial statements. Indeed,
with the advent of any globally accepted set of accounting standards, the infrastructure of
accountants and implementation guidance would surely increase as well, implying that our
results are not an upper bound on the implementability of non-local accounting standards.
However, if one believes that firms lacking current incentives to adopt also lack abilities to
properly implement a set of non-local accounting standards, then our results provide only limited
generalizability.
21 Prior literature in this area has relied primarily on entire countries with “similar” accounting standards or regulatory reconciliations provided by cross-listing firms. In neither situation are the firms actually attempting to implement an identical form of GAAP, making it difficult to interpret observed differences to a true inability versus remaining differences in accounting regimes (Holthausen 2003).

30
Appendix 2 Classification of Accounting Practices as Consistent/Inconsistent with US GAAP
US GAAP?
Compliant Not compliant
% US Firms Disclosing Compliant Practice
1. Accounting for goodwill • Amortized • Amortized and/or taken
to reserves
• Not amortized, expensed when incurred • Written off at management discretion • Taken to reserves
99.9%
2. Accounting for other
intangibles/deferred charges • Amortized • Capitalized, not amortized
• Expensed when incurred • Capitalized, written off at management
discretion, • Taken to reserves
99.9%
3. Accounting for long term
financial leases • Capitalized and
amortized • Expensed • Some capitalized and some expensed 99.7%
4. Accounting method for long term
investments less than 20% • Cost • Lower of cost and
intrinsic value
• Equity • Market value 99.7%
5. Accounting method for long term investments 21-50%
• Equity • Equity but consolidated
where significant influence
• Equity and cost depending on significant influence
• Cost • Cost but consolidated where significant
influence • Equity and proportional consolidation 99.8%
6. Accounting method for long term investments greater than 50%
• All subsidiaries are consolidated
• Consolidation for significant subsidiaries - others are on an equity
• Domestic subsidiaries consolidated - others on a cost basis
• Domestic subsidiaries consolidated - others on a equity basis
• Foreign subsidiaries consolidated - others
94.3%

31
basis • Consolidation for
significant subsidiaries, others are on a cost basis
on a cost basis • Foreign subsidiaries consolidated - others
on a equity basis • No consolidation - cost basis (parent
company only) • No consolidation - equity basis (parent
company only) •
7. Deferred taxes recorded • Yes • No - taxes paid as incurred 100.0% 8. Financial statements cost basis • Historical cost entirely
• Historical cost with price-level adjustment or revaluation of specific accounts
• Historical cost with supplementary current cost financial information
• Current cost statements entirely • Modified historical cost with
supplemental current cost financial information
• Current cost with supplemental historical cost financial information
100.0%
9. Funds definition on statement of
changes in financial position • Cash • Modified cash • Prior to 1989, other
definitions acceptable under APB 19
• Working capital • Modified working capital • Unique definition • Net borrowings • Net liquid assets
86.0%
10. Marketable securities valuation • Lower of cost or market
• Historical cost • Subsequent to 1993,
current market value and cost with periodic valuation acceptable under SFAS115
• Current market value • Moving average • Weighted average • Periodic average • Cost with periodic revaluation
99.8%

32
11. Research and development costs
• Expensed currently • For computer companies
in SIC codes 5054, 7371, or 7372, Capitalized and amortized later or Some expensed some capitalized are considered consistent with US GAAP
• Capitalized and amortized later • Expensed and capitalized later • Some expensed - some capitalized
43.4%
12. Starting line of statement of
changes in financial position • Net income, bottom line • Prior to 1989, Net
income before minority interest, Net income before extraordinary items, and other definitions were acceptable under APB 19.
• Net income before net allocations to reserves
• Net income before minority interest and taxes
• Unique • Sales • Sales plus other operating income • Operating income • Net income before interest • Cash receipts • Operating income before depreciation • etc.
95.1%
13. Treasury stock location on
balance sheet • Deduction from
shareholders' equity • Long term investment • Other asset • Current assets 99.7%

33
FIGURE 1 Distribution of US GAAP Compliance Ratios for Sample firms
and Matched non-US and U.S. Sample Firms
Panel A: RATIO1 Distribution
0
20
40
60
80
100
120
140
160
180
[0.0,0.1] (0.1,0.2] (0.2,0.3] (0.3,0.4] (0.4,0.5] (0.5,0.6] (0.6,0.7] (0.7,0.8] (0.8,0.9] (0.9,1.0]
Range
Freq
uenc
y
Foreign Sample U.S. Panel B: RATIO2 Distribution
0
20
40
60
80
100
120
140
160
180
[0.0,0.1] (0.1,0.2] (0.2,0.3] (0.3,0.4] (0.4,0.5] (0.5,0.6] (0.6,0.7] (0.7,0.8] (0.8,0.9] (0.9,1.0]
Range
Freq
uenc
y
Foreign Sample U.S. This figure plots means of two ratios of US GAAP compliance for a sample of non-US firms that voluntarily adopt US GAAP and two matched samples of non-US and US firms. The sample size for each sample is 178 firms. RATIO1 is defined as (# of accounting method choices compliant with US GAAP)/13. RATIO2 is defined as (# of accounting method choices compliant with US GAAP)/(# of accounting method choices disclosed for the firm-year observation). See Appendix 2 for a listing of the 13 accounting method choices.

34
Figure 2 Time-series Plots of US GAAP Compliance Ratios for Sample Firms
and Matched Foreign and U.S. Samples
Panel A: RATIO1
0.0
0.2
0.4
0.6
0.8
1.0
-3 -2 -1 0 +1 +2 +3
Period
RA
TIO
1
US Sample Foreign Panel B: RATIO2
0.0
0.2
0.4
0.6
0.8
1.0
-3 -2 -1 0 +1 +2 +3
Period
RA
TIO
2
US Sample Foreign ____________________ This figure presents the time-series means of US GAAP compliance ratios surrounding year 0, defined as the initial year of US GAAP adoption by the sample of foreign firms. For a set of matched foreign and U.S. samples, year 0 is defined as the year corresponding to the sample firm to which the firm is matched. Sample sizes are as tabulated in table 4. RATIO1 is defined as (# of accounting method choices compliant with US GAAP)/13. RATIO2 is defined as (# of accounting method choices compliant with US GAAP)/(# of accounting method choices disclosed for the firm-year observation). See Appendix 2 for a listing of the 13 accounting method choices.
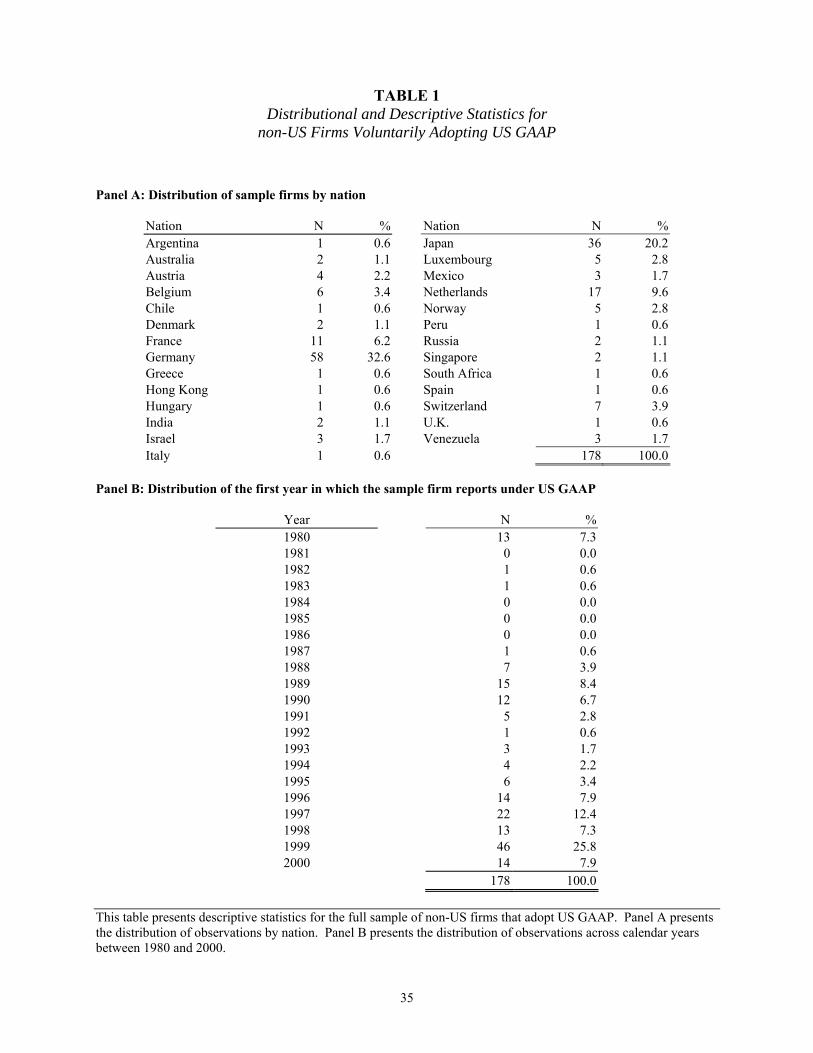
35
TABLE 1 Distributional and Descriptive Statistics for
non-US Firms Voluntarily Adopting US GAAP Panel A: Distribution of sample firms by nation
Nation N % Nation N %Argentina 1 0.6 Japan 36 20.2Australia 2 1.1 Luxembourg 5 2.8Austria 4 2.2 Mexico 3 1.7Belgium 6 3.4 Netherlands 17 9.6Chile 1 0.6 Norway 5 2.8Denmark 2 1.1 Peru 1 0.6France 11 6.2 Russia 2 1.1Germany 58 32.6 Singapore 2 1.1Greece 1 0.6 South Africa 1 0.6Hong Kong 1 0.6 Spain 1 0.6Hungary 1 0.6 Switzerland 7 3.9India 2 1.1 U.K. 1 0.6Israel 3 1.7 Venezuela 3 1.7Italy 1 0.6 178 100.0
Panel B: Distribution of the first year in which the sample firm reports under US GAAP
Year N % 1980 13 7.3 1981 0 0.0 1982 1 0.6 1983 1 0.6 1984 0 0.0 1985 0 0.0 1986 0 0.0 1987 1 0.6 1988 7 3.9 1989 15 8.4 1990 12 6.7 1991 5 2.8 1992 1 0.6 1993 3 1.7 1994 4 2.2 1995 6 3.4 1996 14 7.9 1997 22 12.4 1998 13 7.3 1999 46 25.8 2000 14 7.9
178 100.0 This table presents descriptive statistics for the full sample of non-US firms that adopt US GAAP. Panel A presents the distribution of observations by nation. Panel B presents the distribution of observations across calendar years between 1980 and 2000.

36
TABLE 2 T-statistics (Z-statistics) for tests for differences between means (medians) in compliance ratios
across samples in the year of US GAAP adoption by Sample firms Means and medians for ratios by sample
Sample RATIO1 RATIO2
Mean Non-US 0.404 0.788 Sample 0.446 0.937 US 0.930 0.990
Median Non-US 0.462 0.818 Sample 0.538 1.000 US 1.000 1.000
T-statistics and Z-statistics for tests of differences in means and medians across samples
RATIO1 RATIO2
Sample vs. Non-US Mean 1.6* 7.4*** Median 1.7* 8.7***
US vs. Sample Mean 22.4*** 4.3*** Median 16.1*** 4.0***
This table presents pooled cross-sectional and time-series means and medians of US GAAP compliance ratios partitioned by samples (‘Sample’ firms, and matched ‘non-US’ and ‘US’ samples) for year 0, defined as the initial year in which the sample firm reported under US GAAP. The sample size for each sample is 178 firms. RATIO1 is defined as (# of accounting method choices compliant with US GAAP)/13. RATIO2 is defined as (# of accounting method choices compliant with US GAAP)/(# of accounting method choices disclosed for the firm-year observation). See Appendix 2 for a listing of the 13 accounting method choices utilized to construct the ratios. ***,**,* are significant at the .01, .05 and .10 level, respectively. Tests of the Sample vs. Non-US firms are one tailed. Tests of the Sample vs. US firms are two tailed.

37
TABLE 3 Tests for Differences in Properties of Accounting Numbers
for Sample Firms and Matched non-US and US Firms
Non-US
(178 firms) Sample
(178 firms) US
(178 firms) Panel A: Base Accounting Properties
After Before After After Corr(Accruals, Cash flows) -0.60*** -0.79 -0.16*** -0.23 216 107 247 291 Dechow-Dichev residual σ 0.042*** 0.049 0.056 0.059 184 84 211 277 Variance of |Δnet income| 0.000448*** 0.000546 0.001368*** 0.007576*** 186 90 236 276
Panel B: Conservatism/Timeliness properties Frequency of large negative net income 1.8% 0.0% 3.7%** 7.2%* 5/282 0/125 10/274 22/305 Skewness of net income 1.24*** 1.44 -2.46*** -2.23 282 125 274 305 Basu Return*Dummy coefficient -0.02 0.03 0.04 0.12 203 48 150 233 Ball-Shivakumar Cash Flow*Dummy coefficient -0.06*** 0.03 0.49*** 0.30 202 89 233 277
This table presents univariate tests for differences in various measures of the properties of accounting numbers for the subsample of US GAAP adopters and the non-US and US matched samples. For each subsample, tabulated statistics reflect pooled data from the three-year period preceding (‘Before’) or subsequent (‘After’) to the year of US GAAP adoption by the sample firms. All accounting variables are scaled by beginning total assets. Sample size (number of firm-years) is listed in italics below tabulated statistics. Corr(accruals, cash flows) represents the subsample univariate Pearson correlation between accruals and cash flows. Cash flows are net cash flows from operations, and accruals are computed as the difference between net income and cash flows. Net income is before extraordinary items and preferred dividends. Dechow-Dichev residual σ is the standard deviation of the error terms from the following regression: Accrualst = α+β1Cash flowst-1+β2Cash flowst+β3Cash flowst+1+ε, estimated using pooled cross-sectional data within each sample and period. Variance of |Δnet income| is the variance of changes in net income. Frequency of large negative net income is the percent of firm-years reporting net income (scaled) less than -0.20. Skewness of net income reflects the subsample skewness of net income. Basu Return*Dummy coefficient is the estimate of β3 from the following regression: NIt = α+β1Returnt+β2Dummyt+β3Return*Dummy +ε, where NI is net income, Return is the annual raw stock return, and Dummy is an indicator variable equal to 1 if the annual raw stock return is negative. Ball-Shivakumar Cash Flow*Dummy coefficient is the estimate of β3 from the following regression: Accrualst = α+β1Cash flowst+β2Dummyt+β3Cash flows*Dummy +ε, where Dummy is an indicator variable equal to 1 if cash flows are negative. Significance levels reflect tests for differences between non-US and Sample firms (non-US column), Sample firms before and after adoption of US GAAP (Sample-After column), and US and Sample firms (US column). ***, **, and * indicate significance levels of 0.01, 0.05, and 0.10, respectively; ‡ indicates that the differences are significant in the opposite direction predicted.

38
TABLE 4 Tests for Differences in Properties of Accounting Numbers
for Sample Firms Conditional on U.S. Regulatory Oversight Panel A: Base Accounting Properties
No US listing
(96 firms) US listing (82 firms)
RATIO1 0.56 0.62** 105 171 Corr(accruals, cash flows) -0.29 -0.07* 92 155 Dechow-Dichev residual σ 0.064 0.049*** 71 140 Variance of |Δnet income| 0.000722 0.001692*** 78 158
Panel B: Conservatism/Timeliness properties Frequency of large negative net income 4.8% 2.9% 5/104 5/170 Skewness of net income -1.93 -2.96 104 170 Basu Return*Dummy coefficient -0.00 0.03 41 109 Ball-Shivakumar Cash Flow*Dummy coefficient 0.53 0.46 85 151
This table presents univariate tests for differences in various measures of the properties of accounting numbers for the subsample of US GAAP adopters and the non-US and US matched samples. Tabulated statistics reflect pooled data from the three-year period subsequent to the year of US GAAP adoption. All accounting properties variables are as described in the footnotes to table 3. Significance levels reflect tests for differences between Sample firms with and without US listings (US listing column). ***, **, and * indicate significance levels of 0.01, 0.05, and 0.10, respectively.

39
TABLE 5 Analysis of Firm Characteristics of Firms that Voluntarily Adopt US GAAP
relative to Matched non-US Firms that Report under Local GAAP Panel A: Univariate Comparison of Explanatory Variables for Sample and non-US Match Firms
Means: Medians: Variable Non-US Sample Non-US Sample
#EXCHANGES 1.81 2.26 *** 1.00 2.00 *
CLOSEHELD 0.28 0.14 *** 0.10 0.00 *** ABSEXFIN 0.12 0.21 ** 0.03 0.06 ** BIG4 0.62 0.83 *** 1.00 1.00 *** NUMEST 2.67 2.21 1.00 1.00 GROWTH 0.20 0.23 0.10 0.08 * RD 0.01 0.03 *** 0.00 0.00 *** ROE 0.10 0.11 0.10 0.11 logMV 19.6 20.7 *** 19.4 20.6 ***
Panel B: Logit Analysis of Sample and non-US Firms (Dependent variable=[0,1] for [non-US, sample] firms
Independent variable Coefficient INTERCEPT -5.47 *** #EXCHANGES 0.15 CLOSEHELD -1.87 *** ABSEXFIN 1.20 ** BIG4 1.01 *** NUMEST -0.04 GROWTH 0.48 RD 15.17 *** ROE -0.19 logMV 0.22 *** Likelihood Ratio 91.3 *** Pseudo R2 31.91%
This table presents univariate and logistic analyses of firms that report under their domestic GAAP (‘non-US’) and non-US firms that choose to report using US GAAP (‘Sample’). The sample size is 178 observations per sample. All data except NUMEST is from the Worldscope database. #EXCHANGES measures the total number of exchanges on which the firm trades. US_SECURITY is an indicator variable coded as one if the firm has a security that trades in the United States. CLOSEHELD is a percentage measure of the number of shares Worldscope classifies as being held by related entities such as executives of the firms or large block shareholders. ABSEXFIN is the absolute value of the current period external financing transactions of the firm(including both equity and debt), scaled by total assets. BIG4 is an indicator variable coded as 1 if the firm is audited by one of the big 4 accounting firms or their predecessors. NUMEST is the number of analyst estimates in the current year, based on IBES data, and is set to zero if IBES reports no analysts for the company. GROWTH is the current year growth in sales. RD is the current year R&D expense per the financial statements, scaled by total assets. ROE is the current year return on equity, winsorized at +/- 100%. logMV is the log of the end of year market value of equity measured in US dollars. Significance levels reflect t-tests for differences in means and Z-tests for differences in median distribution. ***, **, and * indicate significance levels of 0.01, 0.05, and 0.10, respectively.

40
TABLE 6 Tests for Differences in Properties of Accounting Numbers
for Sample Firms Conditional on Predicted Incentive Levels Panel A: Base Accounting Properties
Low Incentives (89 firms,
mean Pr= 0.42)
High Incentives (89 firms,
mean Pr=0.80) RATIO1 0.55 0.63*** 106 170 Corr(accruals, cash flows) -0.10 -0.20 91 156 Dechow-Dichev residual σ 0.060 0.052 72 139 Variance of |Δnet income| 0.001703 0.001183‡ 87 149
Panel B: Conservatism/Timeliness properties Frequency of large negative net income 4.8% 2.9%. 5/104 5/170 Skewness of net income -2.85 -2.33‡ 104 170 Basu Return*Dummy coefficient -0.01 0.05 57 96 Ball-Shivakumar Cash Flow*Dummy coefficient 1.07 0.37‡ 86 150
This table presents univariate tests for differences in various measures of the properties of accounting numbers for the sample of US GAAP adopters, partitioned based on the level of capital market incentives computed as the fitted values from the logistic regression in panel B of table 5. Means of Predicted probability (Pr) and RATIO1 are for period 0; other data reflect years subsequent to period 0. Significance levels reflect tests for differences between Sample firms with and without US listings (US listing column). Significance levels reflect tests for differences between subsamples. ***, **, and * indicate significance levels of 0.01, 0.05, and 0.10, respectively. ‡ indicates that the differences are significant in the opposite direction predicted.