Will Container Shipping Sail or Sink
22
WILL GLOBAL CONTAINER SHIPPING SAIL OR SINK? Jefferies Asia Pacific : Cross-Thinking Summit Hong Kong/Singapore 10/13 July 2012 The worldwide reference in liner shipping Important Disclosure: Any views or opinions expressed by the third party experts are solely those of the speaker, not Jefferies, and this does not represent an endorsement by Jefferies of the view or opinions expressed.
-
Upload
rolanddsilva -
Category
Documents
-
view
33 -
download
0
description
Outlook for Container Shipping Industry in 2013
Transcript of Will Container Shipping Sail or Sink

WILL GLOBAL CONTAINER SHIPPING SAIL OR SINK? Jefferies Asia Pacific : Cross-Thinking Summit Hong Kong/Singapore 10/13 July 2012
The worldwide reference in liner shipping
Important Disclosure: Any views or opinions expressed by the third party experts are solely those of the speaker, not Jefferies, and this does not represent an endorsement by Jefferies of the view or opinions expressed.

Turnaround play but recovery remains fragile ► 2009-2012 has been the most volatile period in industry history ► Despite the recovery in 2012, outlook remains weak and tentative
(c) Alphaliner 2011 2
‐16% ‐16% ‐16% ‐10%
0%
9%
15%
7%
‐1% ‐5%
‐7% ‐10%
‐11%
1Q09
2Q09
3Q09
4Q09
1Q10
2Q10
3Q10
4Q10
1Q11
2Q11
3Q11
4Q11
1Q12
2Q12
3Q12
4Q12
Average Ca
rrier O
peratin
g Margin
Average of APL, CMA CGM, CCNI, CSAV, CSCL, EMC, Hanjin, HMM, Hapag‐Lloyd, KL, Maersk, MOL, NYK, RCL, SITC, STX Pan Ocean, WHL, YML, Zim
Potential
“negative to neutral” results for full year
Demand contraction Excess supply
Demand recovery Discipline or desperation??
Market forecasts 1Q 2012 results below market forecast

First - the Good News! ► Breakeven by some lines in April-May ► June should be profitable for most carriers ► 2Q cashflow remains tight but 3Q liquidity will improve
(c) Alphaliner 2011 3
Freight rates up sharply
0
200
400
600
800
1,000
1,200
1,400
1,600
Jan‐98
Jan‐99
Jan‐00
Jan‐01
Jan‐02
Jan‐03
Jan‐04
Jan‐05
Jan‐06
Jan‐07
Jan‐08
Jan‐09
Jan‐10
Jan‐11
Jan‐12
CCFI In
dex (Jan
1998=1,00
0)
CCFI
0
200
400
600
800
1,000
1,200
1,400
1,600
Jan‐98
Jan‐99
Jan‐00
Jan‐01
Jan‐02
Jan‐03
Jan‐04
Jan‐05
Jan‐06
Jan‐07
Jan‐08
Jan‐09
Jan‐10
Jan‐11
Jan‐12
CCFI In
dex (Jan
1998=1,00
0)
CCFI
Fuel Adjusted Freight Index
(both gross & adjusted)
0
200
400
600
800
1000
1200
1400
1600
Jan‐98
Jan‐99
Jan‐00
Jan‐01
Jan‐02
Jan‐03
Jan‐04
Jan‐05
Jan‐06
Jan‐07
Jan‐08
Jan‐09
Jan‐10
Jan‐11
Jan‐12
CCFI In
dex (Jan
1998=1,000)
FO $/tonCCFIFuel Adjusted Freight Index
Bunker costs down 20% ~ 4-5% margin improvement

Rates increased despite moderate load factors ► 2012 rate increases unusual - sharp jump achieved despite lacklustre
load factors 85-90% ► Historically, rate increases sustainable only when load factors > 95%
4

Demand outlook remains week ► 2012 rate recovery is not driven by demand growth
(c) Alphaliner 2011 5
2009 2010 2011 2012(F) FE‐Europe ‐14.8% 17.3% 4.7% 0.2% FE‐US ‐14.9% 16.9% ‐0.8% 3.3%

Can carriers live with lower load factors? ► Other asset-heavy industries can live with lower utilisation levels
(c) Alphaliner 2011 6

Container shipping as a commodity ► Fragmented/overcrowded industry; no M&A impetus ► Lower prices needed to win – Market leadership mainly by price ► Differentiation extremely difficult ► Contestable markets intense competition
(c) Alphaliner 2011 7
Few innovations in the industry Daily Maersk – launched Sep 2011
Competitors response:- CSCL : up to 10 sailings/wk CKYH : up to 9 sailings/wk Evergreen : up to 9 sailings/wk CMA CGM : 7 sailings/wk G6 : 6 sailings/wk

Forward rates trending down ► Rates in backwardation - trending down in 2H 2012 ► Forward rates suggests peak season expected to be brief
(c) Alphaliner 2011 8
Rate recovery has been tentative with significant rate volatility expected over the next 6 months In absence of space crunch, rates can only be held up with pricing discipline. Such discipline has only been exhibited in the past only when lines are in negative cashflow situations

Significant new deliveries committed ► High level of new vessel deliveries amongst Top 20 carriers in 2012
… will continue into 2013 ► Actions of a few carriers could disrupt market
(c) Alphaliner 2011 9
2013 Scheduled Deliveries
2012 Actual and Scheduled Deliveries (1 Jul 2012)
Total deliveries for main carriers in 2012 = 1.30 Mteu
Total deliveries for main carriers in 2013 = 1.38 Mteu
Already delivered

Scrapping is insufficient to redress balance ► 1H 2012 Deliveries YTD 805,000 teu ► 1H 2012 Scrapping YTD 169,000 teu ► New deliveries vs scrapping ratio : 5-to-1
(c) Alphaliner 2011 10
‐50,000
0
50,000
100,000
150,000
200,000
250,000
2008
Jan Jul
2009
Jan Jul
2010
Jan Jul
2011
Jan Jul
2012
Jan
Capa
city in
TEU
TEU ScrappedTEU deliveredNet Increase

Scrap candidates are limited ► Relatively young containership fleet ► Average TEU-weighted age is only 8 years
(c) Alphaliner 2011 11
0.00
0.20
0.40
0.60
0.80
1.00
1.20
1.40
1.60
2012
2011
2010
2009
2008
2007
2006
2005
2004
2003
2002
2001
2000
1999
1998
1997
1996
1995
1994
1993
1992
1991
1990
1989
1988
1987
1986
Pre‐19
86
TEU
Millions
Year Built
Size Range (TEU) >10,000 teu7,500‐10,000 teu5,100‐7,500 teu4,000‐5,100 teu3,000‐4,000 teu2,000‐3,000 teu1,000‐2,000 teu<1,000 teu
Ships built 1992 or earlier (20 years and above) represent only 5.3% of current fleet

Carriers fleet have different age profiles ► MSC – 12% of current fleet are potential scrap candidates ► APL, Maersk, Evergreen - Not many ships to scrap
(c) Alphaliner 2011 12
2%
12%
1%
4%
2%
9%
6%
5%
3%
0%
0%
0% 2%
0%
5%
0%
6%
2%
0%
1%
5%
0%
2%
4%
6%
8%
10%
12%
14%
0
50,000
100,000
150,000
200,000
250,000
300,000AP
M‐M
aersk
MSC
CMA CG
MCO
SCON
Evergreen
Hapag‐Lloyd APL
CSCL
Hanjin Shg
MOL
OOCL
NYK
Ham
burg Süd
Yang
Ming
HMM
K Line Zim PIL
CSAV
UAS
CWan
Hai
TEU
Ships ≥ 20 years As % of fleet (1 Jul 2012)

Chartered tonnage mismatch ► Chartered tonnage redeliveries would not solve carriers’
overcapacity challenge ► Size mismatch between vessels for redelivery vs new ships
(c) Alphaliner 2011 13
461
196
65 70
29 9
43
5 17
33
15 54
0
50
100
150
200
250
300
350
400
450
500
1000‐2000 2000‐3000 3000‐4000 4000‐5000 5000‐7500 above 7500
Units fo
r delivery
Size Range in TEU
Charter redeliveries vs New ship deliveries Jun‐Dec 2012
Charter redeliveries
New ship deliveries

Vessel Delivery Schedule ► High levels of new ship deliveries to continue in 2013
(c) Alphaliner 2011 14

Delivery schedule will not slow until 2014 ► Deliveries will only start to slow from 2H 2014
(c) Alphaliner 2011 15
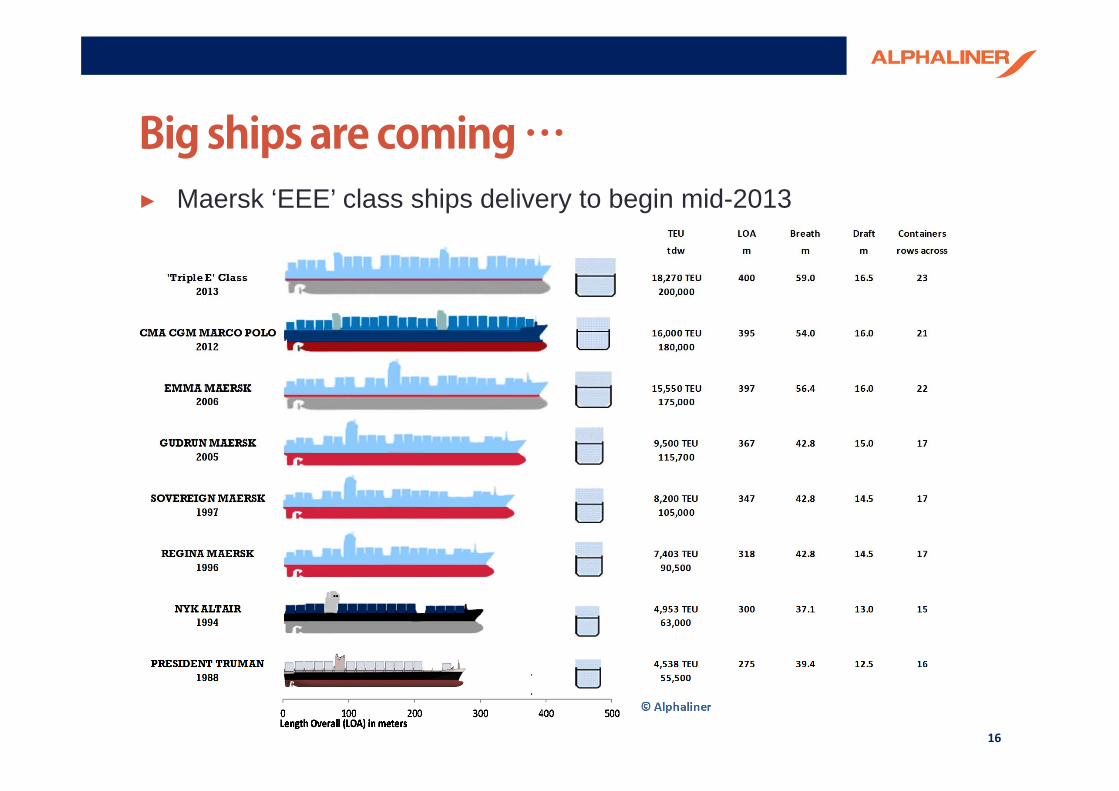
Big ships are coming … ► Maersk ‘EEE’ class ships delivery to begin mid-2013
(c) Alphaliner 2011 16

2013 remains challenging ► 2013 will see over 100 units of new VLCS deliveries ► Pace of deliveries will only slow in 2014
(c) Alphaliner 2011 17

Capacity discipline is key ► Rise in idle tonnage in 1Q 2012 sign of capacity discipline and key
driver of successful rate increase implementation in Jan-Apr ► But idle capacity has halved from 915,000 teu in March to 430,000
teu at end June
(c) Alphaliner 2011 18

Capacity creeping back ► Carriers have reintroduced 9% of capacity on FE-Europe and 10%
on FE-US routes since March ► Capacity restraint could be coming to an end – cascade of ULCS to
secondary trades are not optimal ► Further capacity in August could jeopardise rate recovery
(c) Alphaliner 2011 19

Slow Steaming not the cure-all But going slower does not … ►Slow steaming from 23 knots to 18 knots cuts FO consumption by 100 tons/day
►Super slow steaming from 18 knots to 13 knots cuts FO consumption by 55 tons/day
(c) Alphaliner 2011 20
Source : Maersk 2012

Conclusions ► Cycle has turned up but coming off a very weak 2011, while
earnings outlook is uncertain ► Liquidity remains a concern, especially for those with weak
capitalisation ► Positive 3Q results could provide relief and short-term positive
catalyst for equities but rate gains may not last into 4Q ► 2013 will still be a challenging year with supply-demand balance
likely only in 2014 ► Key indicators to track:-
► SCFI/CCFI – spot vs forward rates ► Capacity utilisation – space crunch as catalyst for sustained rate increase ► Idle capacity/Capacity deployment in main trades – indicator of carrier
discipline ► Port handling volumes – indicator of demand growth
(c) Alphaliner 2011 21

Speaker Bio ► Tan Hua Joo is Executive Consultant with Alphaliner – a leading market
research service provider for the container shipping industry. He has over fifteen years experience in the shipping industry and has held senior positions in leading container shipping, container leasing and shipowning companies.
► Mr. Tan graduated with a BA in Politics, Philosophy and Economics from Oxford University and holds an MBA from Stanford University.
(c) Alphaliner 2011
Tel : (65) 96479147 Email : [email protected]
Website : www.alphaliner.com
22