Wildlife Trade 2004 - Europa
84
Wildlife Trade 2004 An analysis of the European Community and Candidate Countries Annual Reports to CITES Prepared by United Nations Environment Programme World Conservation Monitoring Centre
Transcript of Wildlife Trade 2004 - Europa

Wildlife Trade 2004 An analysis of the European Community and Candidate
Countries Annual Reports to CITES
Prepared by
United Nations Environment Programme World Conservation Monitoring Centre

Analysis of the European Community and Candidate Countries Annual Report to CITES
Prepared for the European Commission Directorate General E – Environment ENV E.4 – Development and Environment
Under contract number:
07.040200/2004/396774/MAR/E2
by the United Nations Environment Programme
World Conservation Monitoring Centre
219 Huntingdon Road, Cambridge CB3 0DL, UK
Tel: +44 (0) 1223 277314
Fax: +44 (0) 1223277136
Website: www.unepwcmc.org
ABOUT UNEP WORLD CONSERVATION MONITORING CENTRE
The UNEP World Conservation Monitoring Centre is the biodiversity assessment and policy implementation arm of the United Nations Environment Programme (UNEP), the world’s foremost intergovernmental environmental organisation. UNEPWCMC aims to help decision makers recognize the value of biodiversity to people everywhere, and to apply this knowledge to all that they do. The Centre’s challenge is to transform complex data into policyrelevant information, to build tools and systems for analysis and integration, and to support the needs of nations and the international community as they engage in joint programmes of action.
UNEPWCMC provides objective, scientifically rigorous products and services that include
ecosystem assessments, support for implementation of environmental agreements, regional and global biodiversity information, research on threats and impacts, and development of future scenarios for the living world.
Printed by: UNEP World Conservation Monitoring Centre
PHOTOGRAPHS
Front Cover: Male Leopard, Tsavo West, Kenya, December 2006. Copyright Stuart Butchart
© Copyright: 2007, UNEP World Conservation Monitoring Centre/European Commission
The contents of this report do not necessarily reflect the views or policies of UNEP or contributory organisations. The designations employed and the presentations do not imply the expressions of any opinion whatsoever on the part of UNEP, the European Commission or contributory organisations concerning the legal status of any country, territory, city or area or its authority, or concerning the delimitation of its frontiers or boundaries
.

Analysis of the European Community and Candidate Countries Annual Report to CITES
1
Table of Contents
GLOSSARY..................................................................................................................................................................... 2 CONVERSION FACTORS............................................................................................................................................ 2 EXECUTIVE SUMMARY .............................................................................................................................................. 3 1. INTRODUCTION ...................................................................................................................................................... 6 2. DATA INCLUDED..................................................................................................................................................... 6 3. SPECIES SHOWING NOTEWORTHY PATTERNS OF TRADE.......................................................................... 9
3.1 Criteria used to select species ................................................................................................................................. 9 3.2 Species accounts .................................................................................................................................................... 11
3.2.1 Mammals ......................................................................................................................................................... 11 3.2.2 Birds................................................................................................................................................................. 18 3.2.3 Reptiles ............................................................................................................................................................ 22 3.2.4 Amphibians ..................................................................................................................................................... 28 3.2.5 Fish................................................................................................................................................................... 28 3.2.6 Invertebrates.................................................................................................................................................... 29 3.2.7 Plants (nontimber) ......................................................................................................................................... 30 3.2.8 Plants (timber) ................................................................................................................................................. 34
4. ANALYSIS OF IMPORTS IN SELECTED GROUPS............................................................................................ 37 4.1 Mammals Sport hunting trophies....................................................................................................................... 37 4.2 Caviar..................................................................................................................................................................... 39 4.3 Clams...................................................................................................................................................................... 41 4.4 Corals ..................................................................................................................................................................... 42 4.5 Cacti........................................................................................................................................................................ 45 4.6 Orchids................................................................................................................................................................... 47
5. CHANGING PATTERNS IN SOURCE OF TRADE: TORTOISES..................................................................... 49 5.1 Introduction........................................................................................................................................................... 49 5.2 Trade ...................................................................................................................................................................... 49
6. EXPORTS AND REEXPORTS................................................................................................................................ 58 6.1 Export of wildcollected species ........................................................................................................................... 58 6.2 High Volume net exports and reexports............................................................................................................. 64
7. TRADE IN NONCITES SPECIES.......................................................................................................................... 72 7.1 Annex A species .................................................................................................................................................... 72 7.2 Annex B species..................................................................................................................................................... 72 7.3 Annex D species .................................................................................................................................................... 73
REFERENCES ............................................................................................................................................................... 82

Analysis of the European Community and Candidate Countries Annual Report to CITES
2
Glossary AppendixI/II/III species Species listed in Appendix I/II/III to CITES
Article Refers to article in the CITES Convention text
CITES Convention on International Trade in Endangered Species of wild fauna and flora
CITESlisted Species listed in one of the Appendices to CITES
EC European Community
Member States Member States of the European Community
Species For simplicity, the term “species” may be used to refer to a list of species and subspecies
Taxonomy The taxonomy accepted by CITES is followed in this report.
Wildlife Trade Regulations European Commission Regulation No. 338/97 and subsequent updates
Conversion factors Trade is reported using a variety of terms and units. In some instances these terms or units were converted to facilitate analysis. The relevant terms and units are listed below.
General
Converted from: Converted to:
Grams; milligrams Kilograms (kg) or Tonnes [1 tonne = 1,000 kg]
Millilitres Litres (l)
Items Whole values
Pairs Whole values [1 pair = 2 items]
Sides Whole skins [2 sides = 1 skin]
Coral
Mean mass of pieces of coral were calculated following Green and Shirley (1999):
Live coral 206.1 ± 13.1 g Raw coral 580 ± 121 g
Timber
Comparable terms (e.g., logs, sawn wood and timber) were combined.
Trade reported in kilograms was converted to m 3 using the midpoint of the range of specific weights provided in the CITES Identification Manual (Vales et al., 1999)

Analysis of the European Community and Candidate Countries Annual Report to CITES
3
Executive Summary This report provides a detailed analysis of the information submitted by the EC Member States and candidate countries in their 2004 Annual Reports to CITES, describing their trade in species listed in the Appendices to CITES and the Annexes of the Wildlife Trade Regulations.
The analysis includes data from the 25 Member States (i.e., including the 10 new Member States that acceded on 1 May 2004). The four candidate countries included in this analysis were Bulgaria 1 , Croatia, Romania 1 and Turkey.
Trade analyses The trade data were analysed to identify: 1) species with noteworthy patterns of trade; 2) trade in particular taxonomic groups or item traded; 3) changing patterns in the source of trade; 4) species exported or reexported; and 5) trade in nonCITES species. Further information is provided in the report on each of the species identified.
Member States
1 Noteworthy patterns of trade
Species were identified on the basis of four criteria:
1 High levels of trade
2 Sharp increase or decrease in trade
3 Longerterm (1995–2004) trends in trade
4 Global threat status.
AppendixI species
Eight AppendixI, fortyeight AppendixII and four AppendixIII taxa were identified on the basis of high volume trade and changing trends in trade. These included mammal, reptile and plant species, but no birds, amphibians or invertebrates.
These comprised three AppendixI mammal species: Leopard Panthera pardus, African Elephant Loxodonta africana and Mongolian Wild Ass Equus hemionus hemionus identified on the basis of a high volume of imports. Trade consisted primarily of wildsourced trophies, tusks and trophies, and skulls respectively, mostly from wild sources. A decrease in imports of
1 Considered an accession country as of April 2005
wildsourced AppendixI African Elephant trophies and tusks was also noted.
Trade in one AppendixI reptile species, Siamese Crocodile Crocodylus siamensis, and one species of AppendixI fish, Asian Arowana Scleropages formosus, were identified on the basis of a high volume of imports. This trade mostly involved captivebred specimens.
Three AppendixI plant species, Monkey Puzzle Araucaria araucana, Costus Root Saussurea costus and Slipper Orchids Paphiopedilum spp., met the criteria for high trade volume. The majority of trade in these species was in artificially propagated specimens.
AppendixII species
Nine AppendixII mammal species were identified on the basis of high trade volumes or changing trends in trade: Narwhal Monodon monoceros, Argentine Grey Fox Pseudalopex griseus, Canada Lynx Lynx Canadensis, Bobcat L. rufus, Lion Panthera leo, Leopard Cat Prionailurus bengalensis, Cape Fur Seal Arctocephalus pusillus, Collared Peccary Pecari
tajacu and Whitelipped Peccary Tayassu pecari. Imports primarily involved skins, as well as tusks of African Elephant and Narwhal carvings, most of which were from wild sources.
Ten AppendixII bird species were identified on the basis of high trade volumes or changing trends in trade: Peachedfaced Lovebird Agapornis roseicollis, Bluefronted Amazon Amazona aestiva, Mitred Parakeet Aratinga mitrata, Ducorps’s Cockatoo Cacatua ducorpsii, Burrowing Parakeet Cyanoliseus patagonus, Greybreasted Parakeet Myiopsitta monachus, Senegal Parrot Poicephalus senegalus, Grey Parrot Psittacus erithacus, Redbilled Leiothrix
Leiothrix lutea and Hill Myna Gracula religiosa. High volumes were reported for imports of live, wild sourced Grey Parrots and Senegal Parrots, and live, captivebred Peachedfaced Lovebirds and Red billed Leiothrix. Bluefronted Amazon trade in live, wildsourced specimens showed a longer term increase from 1995 (5 birds) to 2004 (4,726 birds). Conversely, imports of Burrowing Parakeets decreased steadily from 10,000 birds in 2000 to 1,428 birds in 2004.

Analysis of the European Community and Candidate Countries Annual Report to CITES
4
Twelve AppendixII reptile taxa were identified on the basis of high trade volumes or changing trends in trade: Elongated Turtle Indotestudo elongata, American Alligator Alligator mississippiensis, South American Spectacled Caiman Caiman crocodilus crocodilus, Yacare Caiman C. yacare, Green Iguana Iguana iguana, Argentine Black and White Tegu Tupinambis merianae, Water Monitor Varanus salvator, Blood Python Python brongersmai, Royal Python P. regius, Reticulated Python P. reticulates, Yellow Anaconda Eunectes notaeus and Common
Rat Snake Ptyas mucosus. Skins and live specimens were the main terms in trade, which included animals from wild, captive and ranched sources.
One species of AppendixII amphibian, Tiger Frog Hoplobatrachus tigerinus, was identified on the basis of a high volume of EC imports. Imports comprised primarily of meat (frog legs) from captivebreeding operations in Viet Nam. Some trade in wildsourced specimens was also reported for Viet Nam, a non range State.
Imports of one species of AppendixII fish, Paddlefish Polyodon spathula, showed an overall increase in trade during 1995–2004.
ECreported imports of wildsourced caviar, continued to decrease, imports reported in 2004 (41,800 kg) being nearly half the volume of those reported in 2000.
Two AppendixII invertebrate taxa were identified on the basis of a high trade volume and/or increases in trade: Acropora tenuis and Agaricia agaricites. Imports of corals increased in 2004 to their highest levels during 2000–2004, with the proportion of those imported as live corals continuing to rise.
Nine AppendixII (nontimber) plant taxa were identified on the basis of high trade volumes or changing trends in trade: Snowdrops Galanthus elwesii and G. woronowii, Tree Ferns Cyathea spp., Candelilla Euphorbia antisyphilitica, Primroseleaf Euphorbia E. primulifolia, Cape Aloe Aloe ferox, Cyclamens Cyclamen cilicium, C. coum and C. hederifolium. Seven of these qualified on the basis of high trade volume, two as a consequence of a sharp increase in trade, and five based on an overall increase in trade during 1995–2004.
EC Member States reported the import of 19.9 million wildsourced bulbs of Snowdrop Galanthus woronowii and 5.6 million wildsourced bulbs of
Snowdrop G. elwesii, mainly originating in Turkey. As in previous years, trade in Cape Aloe was dominated by the import of extract, but there was also a notable increase in imports of wildsourced leaves, and live and dried plants 2004.
Three AppendixII timber taxa were imported into the EC in high volumes: Afromosia/African Teak Pericopsis elata, Bigleaf Mahogany Swietenia macrophylla, African Cherry Prunus africana and Ramin Gonystylus spp. EC imports of Lignum Vitae Guaiacum sanctum also showed a notable increase.
AppendixIII Species
One species of AppendixIII mammal (Siberian Weasel Mustela sibirica), two AppendixIII bird species (Green Singing Finch Serinus mozambicus and Redcheeked Cordonbleu Uraeginthus bengalus) and Ramin Gonystylus spp., were identified on the basis of a high volume of trade. (Ramin was listed in Appendix II in 2005).
2 Trade in particular taxonomic groups or item traded
Trade in six areas of particular interest was analysed separately: sporthunted mammal trophies, caviar, clams, corals, cacti and orchids.
Most trade in sporthunted mammal trophies proved to be in wildsourced items, or in items from animals bred in captivity. Imports have decreased steadily from 20002004. Imports of caviar also show a steady decrease over the same period. Trade in clams remained steady from 20024, but is lower than in 2000 and 2001. Discrepancies in reporting make it difficult to assess trade levels in artificially propagated AppendixI cacti seed and AppendixII cacti rainsticks, however trade in cacti flowers has shown a marked increase, from no trade during 19952001, to 7,000 in 2004. Trade in artificially propagated AppendixI orchids increased steadily from 20002003, with a sharper increase from 20034. In contrast, in 2004 trade in live wild collected AppendixII orchids decreased to its lowest level for five years.
3 Changing patterns in the source of trade
Trade in live Tortoises Testudinidae spp. was selected for analysis due to the changing nature of the trade in recent years.
Imports of wildsourced Tortoises declined from 1998 to 2000 when trade in specimens of captive

Analysis of the European Community and Candidate Countries Annual Report to CITES
5
bred, first generation and ranched specimens increased. Eight species showed particular shifts in trade from one source to another.
4 Species exported or reexported
EC net exports of 16 mammal, 25 bird, 16 reptile, one amphibian, nine fish, seven invertebrate, 24 plant and four timber taxa exceeded 1,000 units, although in practice many of these related to re exports of nonnative species.
The EU reported 195 export transactions of wild collected CITES species from the EU, mostly for scientific purposes.
Mammals were mostly exported for their skins, fur and hair, birds were mostly traded as live animals or for their feathers, reptiles were mainly exported as skins (reexports). There was a high volume of export of eggs of captive bred Sturgeon Acipenser spp. Most of the invertebrate trade was in Medicinal Leech Hirudo medicinalis. There were very high exports of Snowdrops Galanthus elwesii, G. nivalis, G. woronowii.
5 Trade in nonCITES species
The EC did not report any trade in nonCITES Annex A species. Imports of nonCITES Annex B species consisted of 43 live specimens of Common Slider Trachemys scripta, 310 eggs and 153 live
specimens of Redeared Slider Trachemys scripta elegans and a small quantity of American Bullfrog Rana catesbeiana skins. Ten Member States reported imports of Annex D species and their derivatives. Live imports of Annex D species showed a marked increase on 2003 levels, with almost half of the 2004 trade volume relating to live plants of Jackinthe pulpit Arisaema spp. Imports of nonlive items were dominated by reptile skins and plant parts and derivatives.
Candidate countries
The candidate countries were not, in relation to the global trade, notable importers of CITESlisted species of fauna and flora.
In contrast to the Member States who mostly exported wildcollected species for scientific purposes, wildcollected exports from candidate countries were mostly for hunting trophies or for commercial purposes. These included hunting trophies of Brown Bear Ursus arctos and Wolf Canis lupus, live Snowdrop Galanthus spp. and Cyclamen Cyclamen spp. and captivebred specimens of many nonnative CITESlisted species. They also acted as entrepôts for parts and products of several species imported from producer nations, particularly sport hunting trophies, caviar from Acipenseriformes spp., and Medicinal Leech Hirudo medicinalis.

Analysis of the European Community and Candidate Countries Annual Report to CITES
6
1. Introduction This analysis of the Member States and candidate countries 2004 annual reports to CITES provides a discussion of the reported trade in species listed in the Appendices to CITES and the Annexes of the Wildlife Trade Regulations, which enforces CITES in the EC.
This analysis includes data from the 25 Member States (i.e., including the 10 new Member States that acceded on 1 May 2004).
The four candidate countries included in this analysis were Bulgaria, Croatia, Romania and Turkey. Bulgaria and Romania were considered to be accession countries as of April 2005.
2. Data included 2.1 Data included The 2004 data used for the analysis were taken from the CITES Trade Database at the end of March 2006, following the submission of CITES annual reports by Member States and their key trading partners. Specific mention is made elsewhere in the report where data received after this date have been included in analyses.
Unless otherwise stated, trade figures for previous years have been taken from confidential analyses of Member States reports prepared for the European Commission by UNEPWCMC.
Trade data excluded from the analysis comprised:
• Artificially propagated AppendixII species
• Reexports of AppendixII manufactured articles
• Scientific specimens, which often refer to blood, hair, tissue, etc., and other terms that could not easily be related to numbers of individuals (e.g., feathers)
2.2 Annual Reports The Wildlife Trade Regulations state that Member States should compile their reports ’in accordance with the guidelines for the preparation and submission of CITES annual reports issued by the Secretariat of the Convention’.
All Member States followed these guidelines, with the exception of the use of recommended term and unit combinations.
Many Member States, when importing items, rely on information provided by exporting countries, and these trading partners may not use the recommended terms and units.
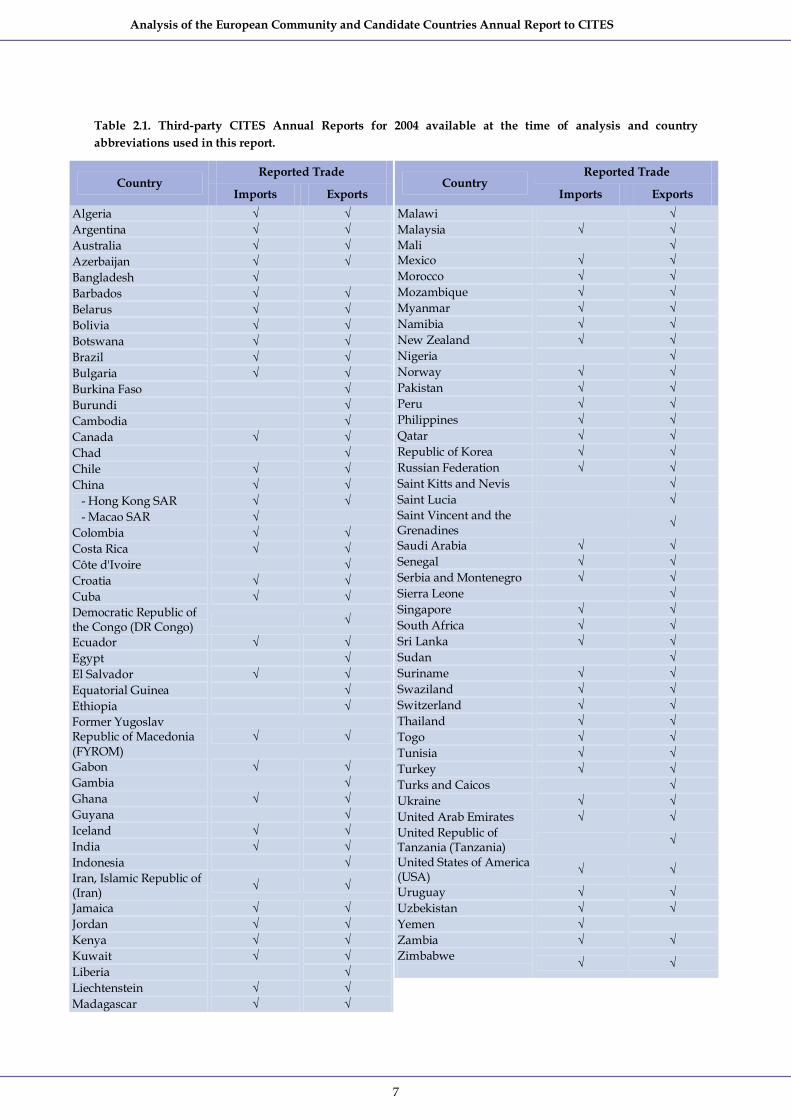
2.3 Thirdparty data included in the analysis Data were also taken from the reports of key trading partners with Member States. Table 2.3 lists the 92 nonEC CITES Parties and dependent territories
(including the candidate countries) that had submitted their annual reports for 2004 at the time of the analysis.
Analysis of the European Community and Candidate Countries Annual Report to CITES
7
Table 2.1. Thirdparty CITES Annual Reports for 2004 available at the time of analysis and country abbreviations used in this report.
Reported Trade Country
Imports Exports Algeria √ √ Argentina √ √ Australia √ √ Azerbaijan √ √ Bangladesh √ Barbados √ √ Belarus √ √ Bolivia √ √ Botswana √ √ Brazil √ √ Bulgaria √ √ Burkina Faso √ Burundi √ Cambodia √ Canada √ √ Chad √ Chile √ √ China √ √
Hong Kong SAR √ √ Macao SAR √
Colombia √ √ Costa Rica √ √ Côte d'Ivoire √ Croatia √ √ Cuba √ √ Democratic Republic of the Congo (DR Congo) √
Ecuador √ √ Egypt √ El Salvador √ √ Equatorial Guinea √ Ethiopia √ Former Yugoslav Republic of Macedonia (FYROM)
√ √
Gabon √ √ Gambia √ Ghana √ √ Guyana √ Iceland √ √ India √ √ Indonesia √ Iran, Islamic Republic of (Iran) √ √
Jamaica √ √ Jordan √ √ Kenya √ √ Kuwait √ √ Liberia √ Liechtenstein √ √ Madagascar √ √
Reported Trade Country
Imports Exports Malawi √ Malaysia √ √ Mali √ Mexico √ √ Morocco √ √ Mozambique √ √ Myanmar √ √ Namibia √ √ New Zealand √ √ Nigeria √ Norway √ √ Pakistan √ √ Peru √ √ Philippines √ √ Qatar √ √ Republic of Korea √ √ Russian Federation √ √ Saint Kitts and Nevis √ Saint Lucia √ Saint Vincent and the Grenadines √
Saudi Arabia √ √ Senegal √ √ Serbia and Montenegro √ √ Sierra Leone √ Singapore √ √ South Africa √ √ Sri Lanka √ √ Sudan √ Suriname √ √ Swaziland √ √ Switzerland √ √ Thailand √ √ Togo √ √ Tunisia √ √ Turkey √ √ Turks and Caicos √ Ukraine √ √ United Arab Emirates √ √ United Republic of Tanzania (Tanzania) √
United States of America (USA) √ √
Uruguay √ √ Uzbekistan √ √ Yemen √ Zambia √ √ Zimbabwe √ √

Analysis of the European Community and Candidate Countries Annual Report to CITES
8

Analysis of the European Community and Candidate Countries Annual Report to CITES
9
3. Species showing noteworthy patterns of trade “Annually, international wildlife trade is estimated to be worth billions of dollars and to include hundreds of millions of plant and animal specimens. The trade is diverse, ranging from live animals and plants to a vast array of wildlife products derived from them, including food products, exotic leather goods, wooden musical instruments, timber, tourist curios and medicines. Levels of exploitation of some animal and plant species are high and the trade in them, together with other factors, such as habitat loss, is capable of heavily depleting their populations and even bringing some species close to extinction. Many wildlife species in trade are not endangered, but the existence of an agreement to ensure the sustainability of the trade is important in order to safeguard these resources for the future.
Because the trade in wild animals and plants crosses
borders between countries, the effort to regulate requires international cooperation to safeguard certain species from overexploitation. CITES was conceived in the spirit of such cooperation. Today, it accords varying degrees of protection to more than 30,000 species of animals and plants, whether they are traded as live specimens, fur coats or dried herbs” (CITES, 2007).
All Member States and candidate countries referred to in this section are parties to CITES and are important international traders of wildlife.
Member States imported approximately 1,300 animals and plants species listed on the CITES appendices, whilst candidate countries imported 140 species (Table 3 1).
The species are listed here under CITES major taxonomic classification.
Table 3.1. Number of species imported in 2004 as reported by the importers
Group EC 25 # Candidate Countries #
Mammals 196 36 Birds 375 46 Reptiles 212 37 Amphibians 15 0 Fish 33 5 Invertebrates 167 4 Plants (nontimber) 326 11 Plants (timber) 10 1 Total 1,334 140
# data are at times reported to the genus level only, which will affect these counts
3.1 Criteria used to select species This chapter discusses Member State and candidate country imports of species showing noteworthy
patterns of trade, selected according to the four criteria listed below.
Criterion1: High trade volume Species were taken to qualify for inclusion on the basis of 'high volume' if levels of importerreported imports exceeded differing thresholds for each Appendix, listed in Table 3.2. With the exception of the thresholds for timber species, the values are intended to refer to numbers of individuals.
A provisional list of highlytraded species was initially identified by comparing imports for 2004 as reported by the Member States with exports/re exports to the EU reported by the rest of the world.
Unless otherwise specified in the text, trade volumes relate to importerreported quantities.
Analysis of the European Community and Candidate Countries Annual Report to CITES
10
Species that only qualified for the high volume criterion on the basis of exporterreported quantities
are mentioned at the start of each taxonomic section.
Table 3.2. Minimum level of trade required for selection on the basis of high trade volume.
CITES Appendix Taxonomic group
I II III Mammals 100 10,000 50,000 Birds 100 10,000 50,000 Reptiles 100 50,000 100,000 Amphibians 100 50,000 — Fish 100 50,000 — Invertebrates 500 50,000 100,000 Plants (nontimber) 500 50,000 100,000 Plants (timber) — 1,000 m 3 5,000 m 3
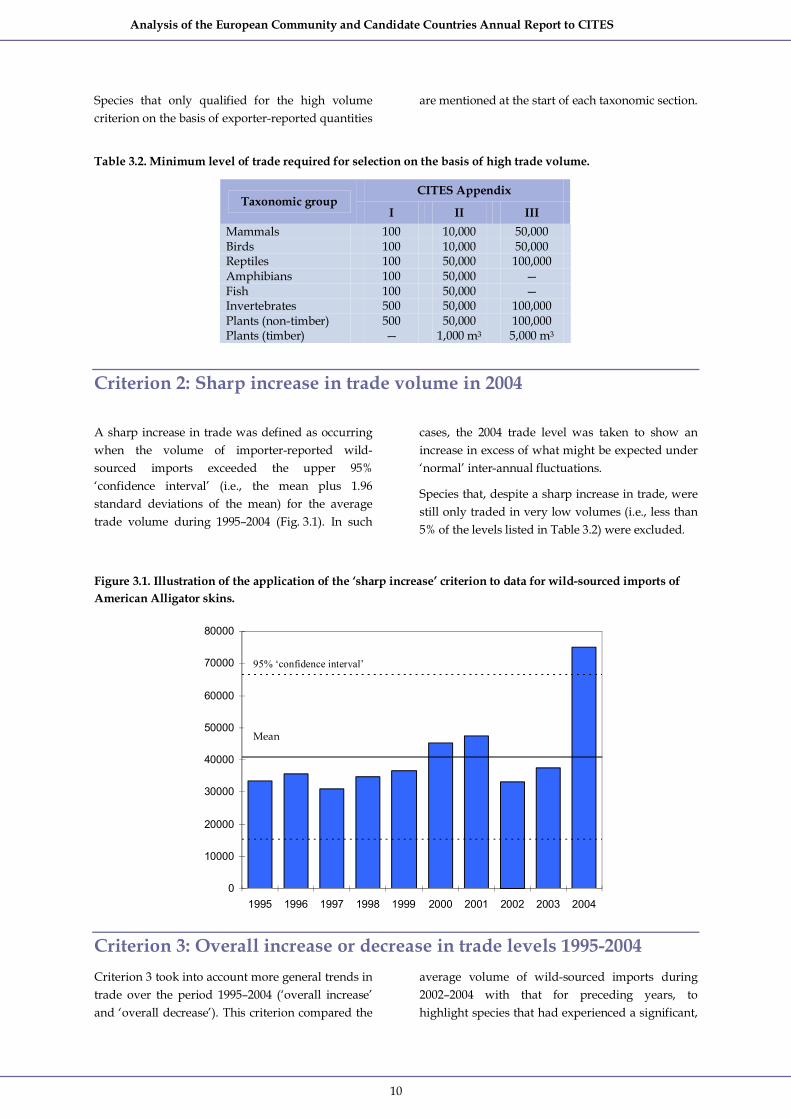
Criterion 2: Sharp increase in trade volume in 2004
A sharp increase in trade was defined as occurring when the volume of importerreported wild sourced imports exceeded the upper 95% ‘confidence interval’ (i.e., the mean plus 1.96 standard deviations of the mean) for the average trade volume during 1995–2004 (Fig. 3.1). In such
cases, the 2004 trade level was taken to show an increase in excess of what might be expected under ‘normal’ interannual fluctuations.
Species that, despite a sharp increase in trade, were still only traded in very low volumes (i.e., less than 5% of the levels listed in Table 3.2) were excluded.
Figure 3.1. Illustration of the application of the ‘sharp increase’ criterion to data for wildsourced imports of American Alligator skins.
0
10000
20000
30000
40000
50000
60000
70000
80000
1995 1996 1997 1998 1999 2000 2001 2002 2003 2004
Criterion 3: Overall increase or decrease in trade levels 19952004 Criterion 3 took into account more general trends in trade over the period 1995–2004 (‘overall increase’ and ‘overall decrease’). This criterion compared the
average volume of wildsourced imports during 2002–2004 with that for preceding years, to highlight species that had experienced a significant,
Mean
95% ‘confidence interval’

Analysis of the European Community and Candidate Countries Annual Report to CITES
11
but less sudden, increase or decrease over the ten year period. All species initially identified by the criterion were subsequently inspected manually to exclude any for which the averages were disproportionately influenced by one or two atypical years.
As with the previous criterion, species that were traded in low numbers during 1995–2004 were excluded.
Criterion 4: Global threat status Globally threatened species are more likely to be adversely affected by trade than nonthreatened ones. The global threat status (Vulnerable, Endangered or Critically Endangered) assigned by IUCN (2006) was therefore taken into account when applying the preceding two criteria.
For these species, the thresholds for the minimum volume of trade required to warrant discussion in this chapter (Criterion 1) were reduced to the Appendix I threshold, to ensure the inclusion of instances where fluctuations in relatively low levels of trade may still be significant.
3.2 Species accounts
3.2.1 Mammals Member States reported trade in 196 mammal species. A wide variety of products were traded, skins and their derivatives being the most numerous items.
Thirteen species of mammals are discussed in this section: three AppendixI, nine AppendixII and one AppendixIII species.
The three AppendixI mammals that met the criteria for inclusion in this section were: Leopard Panthera pardus, African Elephant Loxodonta africana and Mongolian Wild Ass Equus hemionus hemionus. All three qualified on the basis of a high volume of trade, with the Mongolian Wild Ass also showing a sharp increase in trade. African Elephant and Mongolian Wild Ass are both globally threatened.
Nine AppendixII mammal species qualified for inclusion in this section: Narwhal Monodon monoceros, Argentine Grey Fox Pseudalopex griseus, Canadian Lynx Lynx Canadensis, Bobcat Lynx rufus, Lion Panthera leo, Leopard Cat Prionailurus bengalensis, Cape Fur Seal Arctocephalus pusillus, Collared Peccary Pecari tajacu and Whitelipped
Peccary Tayassu pecari. Six of these qualified on the basis of high trade volume, one as a consequence of a sharp increase in trade, four based on an overall increase in trade during 1995–2004, and two based on a decrease in trade during the same period. Panthera leo is globally threatened; Monodon monoceros is classified as Data Deficient.
Crabeating Macaque Macaca fascicularis met the high trade volume criterion on the basis of exporter reported quantities only. Much of the trade related to scientific specimens, but a significant number of live individuals of these macaques, mostly captive bred but also some wild, were also imported by the EC for commercial and scientific purposes. The EC’s trading partners (most notably Mauritius) reported the export of 10,176 live macaques, but Member States only reported the import of just over half of this total.
Siberian Weasel Mustela sibirica was the only species of AppendixIII mammal to meet the criteria for inclusion in this section. It qualified on the basis of high volume of trade.
Analysis of the European Community and Candidate Countries Annual Report to CITES
12
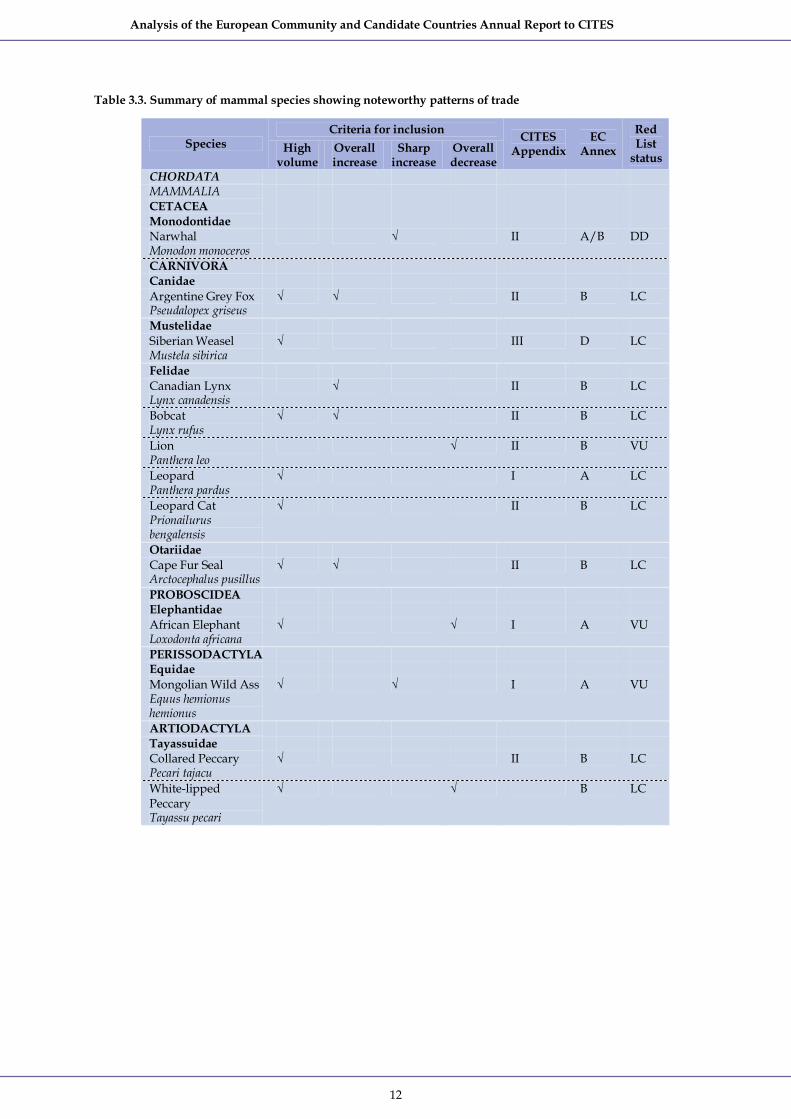
Table 3.3. Summary of mammal species showing noteworthy patterns of trade
Criteria for inclusion Species High
volume Overall increase
Sharp increase
Overall decrease
CITES Appendix
EC Annex
Red List
status CHORDATA MAMMALIA CETACEA Monodontidae Narwhal Monodon monoceros
√ II A/B DD
CARNIVORA Canidae Argentine Grey Fox Pseudalopex griseus
√ √ II B LC
Mustelidae Siberian Weasel Mustela sibirica
√ III D LC
Felidae Canadian Lynx Lynx canadensis
√ II B LC
Bobcat Lynx rufus
√ √ II B LC
Lion Panthera leo
√ II B VU
Leopard Panthera pardus
√ I A LC
Leopard Cat Prionailurus bengalensis
√ II B LC
Otariidae Cape Fur Seal Arctocephalus pusillus
√ √ II B LC
PROBOSCIDEA Elephantidae African Elephant Loxodonta africana
√ √ I A VU
PERISSODACTYLA Equidae Mongolian Wild Ass Equus hemionus hemionus
√ √ I A VU
ARTIODACTYLA Tayassuidae Collared Peccary Pecari tajacu
√ II B LC
Whitelipped Peccary Tayassu pecari
√ √ B LC

Analysis of the European Community and Candidate Countries Annual Report to CITES
13
Narwhal Monodon monoceros Criteria for inclusion: sharp increase Principal trade term: carvings EC imports as % of total trade:>99% of carvings Principal source: wild Top trading partner: Greenland CITES Appendix/EC Annex: II/A and B IUCN Red List status: Data Deficient Although reported trade did not approach the threshold for qualification on the basis of a high volume of trade, there was a sharp increase in EC imports of wildsourced carvings (Annex B trade).
Argentine Grey Fox Pseudalopex griseus Criteria for inclusion: high volume, overall increase Principal trade term: skins EC imports as % of total trade: 54% skins Principal source: wild Top trading partner: Argentina CITES Appendix/EC Annex: II/B IUCN Red List status: Least Concern The majority of imports related to skins (46,492, plus 92 kg), with the remainder of trade comprising garments (1,020), skin pieces (597, plus 36 kg), plates (190, plus 181 kg) and small leather products (six). Over 95% of EC imports were exported directly by (or originated in) Argentina; the remaining c.1,950 skins originated in Chile. All trade was in wild sourced articles. Although the volume of trade reported in 2004 was down from its peak in 2003 and 2002, ECreported imports of wildsourced Grey Fox skins have shown a significant overall increase since the late 1990s, when annual imports had yet to exceed 20,000 skins.
Siberian Weasel Mustela sibirica Criteria for inclusion: high volume Principal trade term: plates EC imports as % of total trade: >95% of plates Principal source: wild Top trading partner: China CITES Appendix/EC Annex: III/D IUCN Red List status: Least Concern The EC reported the import of 20,133 (and 190 m 2
of) plates, 1,030 skins, 700 skin pieces, 7000 (and 21 kg of) tails, and 3,000 (no units) and c.520 kg of hair. All ECreported imports originated in China. The vast majority of trade was in articles from wild sources.
Canadian Lynx Lynx canadensis Criteria for inclusion: overall increase Principal trade term: skins EC imports as % of total trade: 74% of skins Principal source: wild Top trading partners: Canada CITES Appendix/EC Annex: II/B IUCN Red List status: Least Concern Almost 95% of imports related to wildsourced skins (8,527), with the bulk of the remainder comprising skin pieces (436). With the exception of 390 skins originating in the USA, all remaining imports of Canadian Lynx were reported as coming from Canada. Although the overall level of trade was slightly below the threshold for qualification on the basis of high trade volume, ECreported imports of wildsourced skins have shown a notable increase overall during the period 1995–2004.
Bobcat Lynx rufus Criteria for inclusion: high volume, overall increase Principal trade term: skins EC imports as % of total trade: 63% of skins Principal source: wild Top trading partners: USA, Canada CITES Appendix/EC Annex: II/B IUCN Red List status: Least Concern EC imports were almost exclusively of wildsourced skins. The great majority of skins originated in the USA, although over onethird of these were re exported by Canada; the remainder originated directly from Canada. EC imports of wildsourced Bobcat skins have shown a significant overall increase since 1995, with the volume of imports reported in 2004 over ten times that reported in 1995 (Fig. 3.4).
African Lion (©Peter Dollinger)

Analysis of the European Community and Candidate Countries Annual Report to CITES
14
Lion Panthera leo Criteria for inclusion: overall decrease Principal trade term: trophies EC imports as % of total trade: 30% of trophies Principal source: wild Top trading partners: Tanzania, South Africa CITES Appendix/EC Annex: II/B (except P. l. persica, which is listed in Annex A). IUCN Red List status: Vulnerable (except Panthera leo persica, which is Critically Endangered).
The overall level of trade was below the threshold for qualification on the basis of high trade volume; nonetheless this species qualified for this section on
the basis of the notable decrease in reported total imports of wildsourced Lions over the period 1995– 2004. Wild Lions are mostly traded as trophies, skins and skulls. Although some fluctuations were observed, especially in trophy numbers, over the past ten years total import quantities have dropped reaching their lowest figures (Fig. 3.5). Eightyfour trophies, skins or skulls were reported; the main exporters were the Tanzania (46%), South Africa (19%) and Zimbabwe (18%). Captivebred specimens on the other hand were mostly traded as ‘live’ specimens originating from Switzerland and South Africa (15%). Captivebred trophy imports from South Africa recorded their highest level rising from six in 2003 to 29 in 2004.
Figure 3.4. Imports of wildsourced Bobcats Lynx rufus skins 1995 2004
0
5000
10000
15000
20000
25000
30000
35000
1995 1996 1997 1998 1999 2000 2001 2002 2003 2004
No.
of s
kins
Figure 3.5: Imports of wildcaught Lion Panthera leo main products 19952004
0
50
100
150
200
250
300
350
400
450
1995 1996 1997 1998 1999 2000 2001 2002 2003 2004
No.
impo
rted
skins
skulls
trophies
TOTAL
Analysis of the European Community and Candidate Countries Annual Report to CITES
15
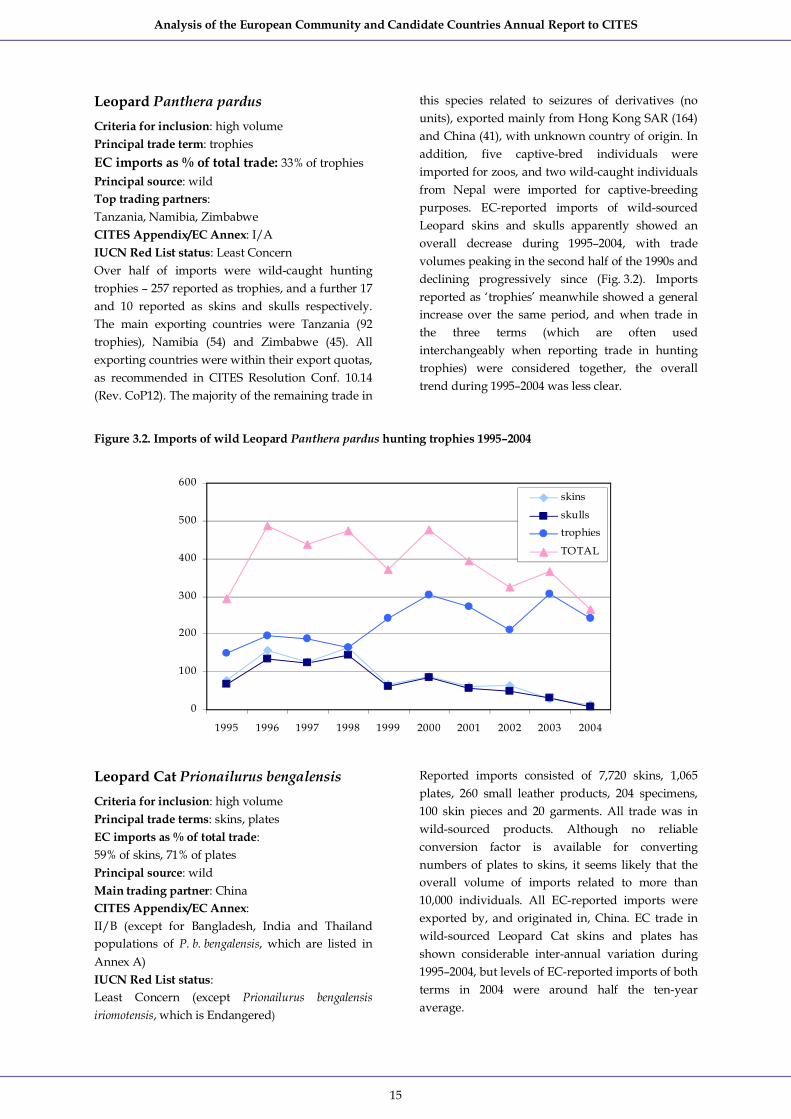
Leopard Panthera pardus Criteria for inclusion: high volume Principal trade term: trophies EC imports as % of total trade: 33% of trophies Principal source: wild Top trading partners: Tanzania, Namibia, Zimbabwe CITES Appendix/EC Annex: I/A IUCN Red List status: Least Concern Over half of imports were wildcaught hunting trophies – 257 reported as trophies, and a further 17 and 10 reported as skins and skulls respectively. The main exporting countries were Tanzania (92 trophies), Namibia (54) and Zimbabwe (45). All exporting countries were within their export quotas, as recommended in CITES Resolution Conf. 10.14 (Rev. CoP12). The majority of the remaining trade in
this species related to seizures of derivatives (no units), exported mainly from Hong Kong SAR (164) and China (41), with unknown country of origin. In addition, five captivebred individuals were imported for zoos, and two wildcaught individuals from Nepal were imported for captivebreeding purposes. ECreported imports of wildsourced Leopard skins and skulls apparently showed an overall decrease during 1995–2004, with trade volumes peaking in the second half of the 1990s and declining progressively since (Fig. 3.2). Imports reported as ‘trophies’ meanwhile showed a general increase over the same period, and when trade in the three terms (which are often used interchangeably when reporting trade in hunting trophies) were considered together, the overall trend during 1995–2004 was less clear.
Figure 3.2. Imports of wild Leopard Panthera pardus hunting trophies 1995–2004
0
100
200
300
400
500
600
1995 1996 1997 1998 1999 2000 2001 2002 2003 2004
skins
skulls trophies
TOTAL
Leopard Cat Prionailurus bengalensis Criteria for inclusion: high volume Principal trade terms: skins, plates EC imports as % of total trade: 59% of skins, 71% of plates Principal source: wild Main trading partner: China CITES Appendix/EC Annex: II/B (except for Bangladesh, India and Thailand populations of P. b. bengalensis, which are listed in Annex A) IUCN Red List status: Least Concern (except Prionailurus bengalensis iriomotensis, which is Endangered)
Reported imports consisted of 7,720 skins, 1,065 plates, 260 small leather products, 204 specimens, 100 skin pieces and 20 garments. All trade was in wildsourced products. Although no reliable conversion factor is available for converting numbers of plates to skins, it seems likely that the overall volume of imports related to more than 10,000 individuals. All ECreported imports were exported by, and originated in, China. EC trade in wildsourced Leopard Cat skins and plates has shown considerable interannual variation during 1995–2004, but levels of ECreported imports of both terms in 2004 were around half the tenyear average.

Analysis of the European Community and Candidate Countries Annual Report to CITES
16
Cape Fur Seal Arctocephalus pusillus Criteria for inclusion: high volume, overall increase Principal trade term: skins EC imports as % of total trade: 27% of skins Principal source: wild CITES Appendix/EC Annex: II/B IUCN Red List status: Least Concern Imports were almost exclusively of wildsourced skins. All skins originated in Namibia: over 90% were exported directly, and the remainder came as reexports from Canada, Norway, Switzerland and Thailand. ECreported imports of wildsourced skins were in excess of 15,000 for the fourth successive year in 2004, which represented a notable overall increase from trade volumes during 1995– 2000, when the annual average was less than 3,000 skins.
Cape Fur Seal (© Nicholas Warren)
African Elephant Loxodonta africana Criteria for inclusion: high volume, overall decrease Principal trade terms:
trophies, tusks, ivory carvings EC imports as % of total trade: 75% of trophies, 3% tusks (kg), c.10% ivory carvings Principal sources: wild (trophies), preConvention (ivory carvings) Top trading partners: Tanzania, Cameroon, Mozambique, Côte d’Ivoire, China, USA CITES Appendix/EC Annex: I/A (except for the populations of Botswana, Namibia, South Africa and Zimbabwe, which are included in Annex B) IUCN Red List status: Vulnerable Imports of AppendixI African Elephant parts fell into two main categories: wildsourced hunting trophies or tusks, and preConvention ivory carvings.
Member States reported the import of 112 wild sourced hunting trophies and 45 wildsourced tusks, which probably derive from a total of roughly 85 animals.
The principal exporters of wildsourced trophies and tusks were Cameroon (44 trophies and 10 tusks), Tanzania (37 trophies and four tusks) and Mozambique (29 trophies and four tusks); Gabon and Côte d’Ivoire between them exported a further 25 tusks. None of the exporters used their entire export quota. In addition, Member States reported the import of 16 (no units), and 36 kg of pre Convention tusks, mainly from Côte d’Ivoire.
ECreported imports of wildsourced trophies and tusks of AppendixI African Elephants have shown a notable decrease overall during 1995–2004, with trade volumes since 1998 around four times lower on average than during 1995–1997 (Fig. 3.3). Member States reported the import of 844 (no units), and 38 kg of preConvention ivory carvings, with a further 156 and 72 seized ivory carvings reported as of unknown source. The principal exporters were Côte d’Ivoire (38 kg of carvings), Switzerland (367 carvings) and the USA (360 carvings); for the majority of ivory carvings the country of origin was unknown.

Analysis of the European Community and Candidate Countries Annual Report to CITES
17
Figure 3.3. Imports of wildsourced AppendixI African Elephants Loxodonta africana trophies and tusks 1995–2004
0
50
100
150
200
250
300
350
400
450
500
1995 1996 1997 1998 1999 2000 2001 2002 2003 2004
No.
impo
rted
trophies
tusks
Mongolian Wild Ass
Equus hemionus hemionus Criteria for inclusion: high volume, sharp increase Principal trade term: skulls EC imports as % of total trade: 100% (all terms) Principal source: wild Top trading partner: Mongolia CITES Appendix/EC Annex: I/A IUCN Red List status: Vulnerable The EC reported the import, for scientific purposes, of 250 wildsourced skulls from Mongolia. This is the only record of trade for the species over the period 19952004.
Collared Peccary Pecari tajacu Criteria for inclusion: high volume Principal trade term: skins EC imports as % of total trade: 87% of skins Principal source: wild Top trading partner: Peru CITES Appendix/EC Annex: II/B (except populations of Mexico and the USA, which are not included in the Annexes of the Regulations) IUCN Red List status: Least Concern Over 90% of imports related to skins, with garments (8%) and skin pieces (1%) making up the remainder of ECreported trade. The vast majority of imports originated in Peru, and all imports were from wild sources. The overall volume of trade in 2004 was slightly below the annual average for 1995–2004.
Whitelipped Peccary Tayassu pecari Criteria for inclusion: high volume, overall decrease Principal trade term: skins EC imports as % of total trade: 71% of skins Principal source: wild Top trading partner: Peru EC Annex: B IUCN Red List status: Least Concern The vast majority of imports were of wildsourced skins. All EC imports of peccary skins (and garments) originated in Peru. Although the number of wildsourced skins imported into the EC during 2004 was slightly up on 2003, trade volumes were still considerably lower than levels during the second half of the 1990s.
Whitelipped Peccary (© Peter Dollinger)

Analysis of the European Community and Candidate Countries Annual Report to CITES
18
3.2.2 Birds The EC imported 375 bird species listed in the Appendices to CITES (Table 3.1) mostly as live animals for the pet trade. No AppendixI bird species met the criteria for inclusion in this section.
Ten AppendixII bird species qualified for inclusion in this section: Peachedfaced Lovebird Agapornis roseicollis, Bluefronted Amazon Amazona aestiva, Mitred Parakeet Aratinga mitrata, Ducorps’s Cockatoo Cacatua ducorpsii, Burrowing Parakeet Cyanoliseus patagonus, Greybreasted Parakeet Myiopsitta monachus, Senegal Parrot Poicephalus senegalus, Grey Parrot Psittacus erithacus, Redbilled Leiothrix Leiothrix lutea and Hill Myna Gracula religiosa.
Four of these species qualified on the basis of high trade volume, two as a consequence of a sharp increase in trade, three based on an overall increase in trade during 1995–2004, and three based on a
decrease in trade during the same period. None of the species is globally threatened.
One species of AppendixII bird, Fischer’s Lovebird Agapornis fischeri, met the high trade volume criterion on the basis of exporterreported quantities only. The EC’s trading partners reported the export of 10,147 live individuals, whereas Member States reported the import of only 6,132 individuals (from captivebred sources). The discrepancy was largely accounted for by reported exports from China (2,400 individuals) and Serbia and Montenegro (700 individuals), which were not reported by the importers.
Two AppendixIII bird species met the criteria for inclusion in this section: Green Singing Finch Serinus mozambicus and Redcheeked Cordonbleu Uraeginthus bengalus, both of which qualified on the basis of a high volume of trade.
Table 3.4. Summary of bird species showing noteworthy patterns of trade
Criteria for inclusion Species High
volume Overall increase
Sharp increase
Overall decrease
CITES Appendix
EC Annex
Red List
status
CHORDATA AVES PSITTACIFORMES Psittacidae Peachfaced Lovebird Agapornis roseicollis
√ II B LC
Bluefronted Amazon Amazona aestiva
√ II B LC
Mitred Parakeet Aratinga mitrata
√ √ II B LC
Burrowing Parakeet Cyanoliseus patagonus
√ II B LC
Greybreasted Parakeet Myiopsitta monachus
√ II B LC
Senegal Parrot Poicephalus senegalus
√ B LC
Grey Parrot Psittacus erithacus
√ II B LC
Cacatuidae Ducorps’s Cockatoo Cacatua ducorpsii
√ √ II B LC
PASSERIFORMES Muscicapidae Redbilled Leiothrix Leiothrix lutea
√ II B LC

Analysis of the European Community and Candidate Countries Annual Report to CITES
19
Criteria for inclusion Species High
volume Overall increase
Sharp increase
Overall decrease
CITES Appendix
EC Annex
Red List
status
Fringillidae Green Singing Finch Serinus mozambicus
√ III C LC
Estrildidae Redcheeked Cordonbleu Uraeginthus bengalus
√ III C LC
Sturnidae Hill Myna Gracula religiosa
√ II B LC
Peachfaced Lovebird
Agapornis roseicollis Criteria for inclusion: high volume Principal trade term: live EC imports as % of total trade: 47% of live Principal source: captivebred Top trading partner: Cuba CITES Appendix/EC Annex: II/B IUCN Red List status: Least Concern All reported imports were of live birds from captivebred sources. The principal trading partner was Cuba, which exported 85% of ECreported imports. Over twothirds of the remaining exports came from South Africa (2,101 individuals).
Agapornis roseicollis was subsequently removed from the CITES Appendices and EC Annexes in 2005.
Bluefronted Amazon Amazona aestiva Criteria for inclusion: overall increase Principal trade term: live EC imports as % of total trade: 82% of live Principal source: wild Top trading partners: Argentina CITES Appendix/EC Annex: II/B IUCN Red List status: Least Concern EC Member States reported the import of 4,918 live Bluefronted Amazon, 96% of which were wild sourced specimens, with the remainder being captivebred. All wildcaught birds originated in Argentina, as did 64% of captivebred birds. South Africa was also a major exporter of captivebred specimens accounting for 28% of EC imports.
ECimports of live specimens increased from five birds in 1995 to 4,726 birds in 2004 (Fig. 3.6).
Figure 3.6. Imports of wildcaught Bluefronted Amazon Amazona aestiva 19952004
0
500
1000
1500
2000
2500
3000
3500
4000
4500
5000
1995 1996 1997 1998 1999 2000 2001 2002 2003 2004
No.
impo
rted
Analysis of the European Community and Candidate Countries Annual Report to CITES
20
Mitred Parakeet Aratinga mitrata Criteria for inclusion: sharp increase, overall increase Principal trade term: live EC imports as % of total trade: 88% of live Principal source: wild Top trading partners: Argentina, Peru CITES Appendix/EC Annex: II/B IUCN Red List status: Least Concern EC Member States reported the import of 1,844 Mitred Parakeet, all from wildsources. All imports were from Argentina and Peru, which accounted for 95% (1,747 birds) and 5% (97 birds) of the trade respectively. As with the Bluefronted Amazon, the trade increased notably during the past decade.
Burrowing Parakeet
Cyanoliseus patagonus Criteria for inclusion: overall decrease Principal trade term: live EC imports as % of total trade: 61% of live Principal source: wild Top trading partners: Argentina CITES Appendix/EC Annex: II/B IUCN Red List status: Least Concern All imports were of live birds, the vast majority (99.5%) of which were wild specimens. All wild birds (1,428) were imported from Argentina; captivebred birds were imported from South Africa and Switzerland.
From 19952000, imports of wild specimens into the EC increased from 3,258 to 10,010 birds. From 2000, imports steadily decreased to 1,428 birds in 2004, the lowest number reported in the decade.
Greybreasted Parakeet
Myiopsitta monachus Criteria for inclusion: overall decrease Principal trade term: live EC imports as % of total trade: 65% of live Principal source: wild Top trading partners: Argentina, Uruguay CITES Appendix/EC Annex: II/B IUCN Red List status: Least Concern Imports comprised 5,930 live birds, 91% (5,420) of which were wildsourced birds and 8% (500) from ranching operations. Uruguay and Argentina were the main countries of origin accounting for 4,300 (72.5%) and 1,620 (27%) specimens respectively.
This included the import of 500 ranched specimens from Uruguay.
The overall level of trade was below the threshold for qualification on the basis of high trade volume; nonetheless this species qualified for this section on the basis of the notable decrease in ECreported total imports of wildsourced birds over the period 1995–2004. Between 19952004, the number of wild caught birds imported into the EC dropped from 21,167 in 1995 to 5,420 in 2004.
Senegal Parrot Poicephalus senegalus Criteria for inclusion: high volume Principal trade term: live EC imports as % of total trade: 83% of live Principal source: wild Top trading partners: Guinea, Senegal, Mali CITES Appendix/EC Annex: B IUCN Red List status: Least Concern Over 99% (26,167 individuals) of reported imports were live birds from wild sources, with the vast majority of the remaining imports relating to captivebred birds (110 individuals). The top exporters of wildsourced birds were Guinea (11,248), Senegal (7,413) and Mali (7,412). Reported imports from Guinea were almost double those in 2003 (5,252 individuals), whereas exports from Senegal continued to decline from their 2000 levels (14,465 individuals). None of the imports from Guinea was reported by the exporter, with overall exporterreported quantities for this species totalling to just 70% of those reported by Member States.
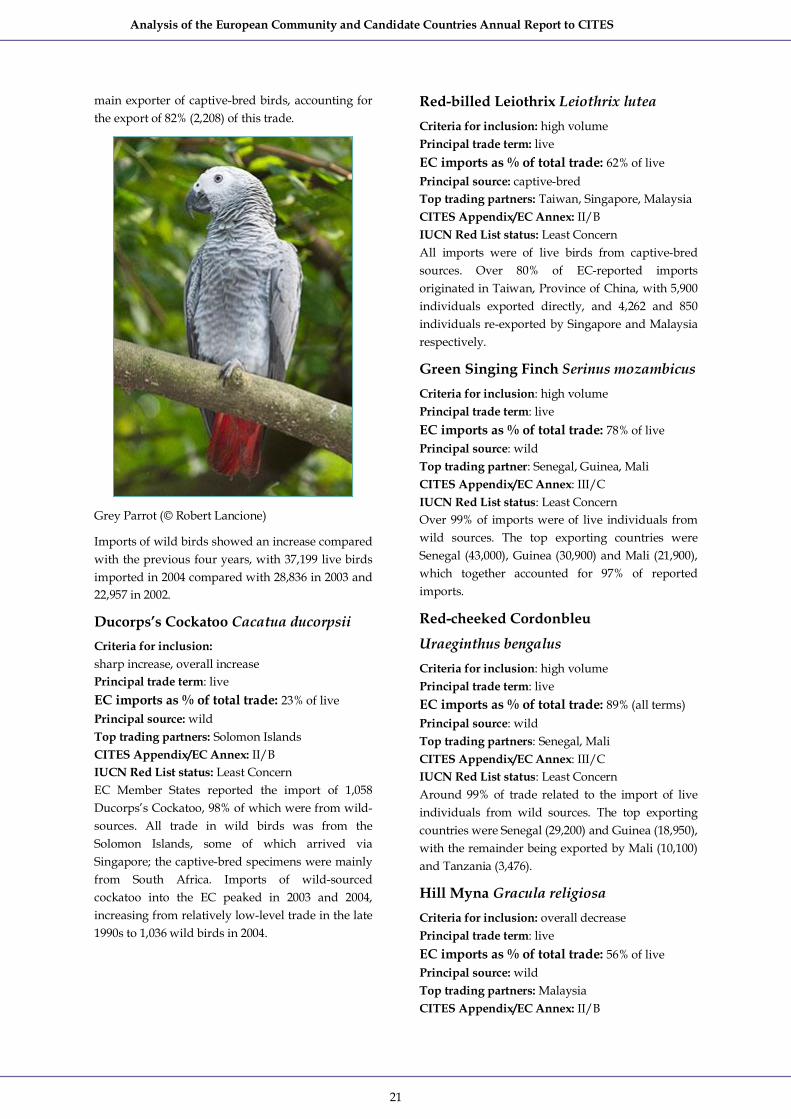
Grey Parrot Psittacus erithacus Criteria for inclusion: high volume Principal trade term: live EC imports as % of total trade: 73% of live Principal source: wild Top trading partners: DR Congo, Cameroon, Congo, Côte d'Ivoire CITES Appendix/EC Annex: II/B IUCN Red List status: Least Concern Member States reported the import of 39,908 live specimens, 3,424 of which were reported as the sub species P. e. timneh. The majority (93%) involved wildsourced birds; captivebred specimens (sources C and F) accounted for 6% of the trade.
The main exporters of wildsourced Grey Parrot were DR Congo (38%), Cameroon (30%), Congo (15%) and Côte d'Ivoire (11%). South Africa was the
Analysis of the European Community and Candidate Countries Annual Report to CITES
21
main exporter of captivebred birds, accounting for the export of 82% (2,208) of this trade.
Grey Parrot (© Robert Lancione)
Imports of wild birds showed an increase compared with the previous four years, with 37,199 live birds imported in 2004 compared with 28,836 in 2003 and 22,957 in 2002.
Ducorps’s Cockatoo Cacatua ducorpsii Criteria for inclusion: sharp increase, overall increase Principal trade term: live EC imports as % of total trade: 23% of live Principal source: wild Top trading partners: Solomon Islands CITES Appendix/EC Annex: II/B IUCN Red List status: Least Concern EC Member States reported the import of 1,058 Ducorps’s Cockatoo, 98% of which were from wild sources. All trade in wild birds was from the Solomon Islands, some of which arrived via Singapore; the captivebred specimens were mainly from South Africa. Imports of wildsourced cockatoo into the EC peaked in 2003 and 2004, increasing from relatively lowlevel trade in the late 1990s to 1,036 wild birds in 2004.
Redbilled Leiothrix Leiothrix lutea Criteria for inclusion: high volume Principal trade term: live EC imports as % of total trade: 62% of live Principal source: captivebred Top trading partners: Taiwan, Singapore, Malaysia CITES Appendix/EC Annex: II/B IUCN Red List status: Least Concern All imports were of live birds from captivebred sources. Over 80% of ECreported imports originated in Taiwan, Province of China, with 5,900 individuals exported directly, and 4,262 and 850 individuals reexported by Singapore and Malaysia respectively.
Green Singing Finch Serinus mozambicus Criteria for inclusion: high volume Principal trade term: live EC imports as % of total trade: 78% of live Principal source: wild Top trading partner: Senegal, Guinea, Mali CITES Appendix/EC Annex: III/C IUCN Red List status: Least Concern Over 99% of imports were of live individuals from wild sources. The top exporting countries were Senegal (43,000), Guinea (30,900) and Mali (21,900), which together accounted for 97% of reported imports.
Redcheeked Cordonbleu
Uraeginthus bengalus Criteria for inclusion: high volume Principal trade term: live EC imports as % of total trade: 89% (all terms) Principal source: wild Top trading partners: Senegal, Mali CITES Appendix/EC Annex: III/C IUCN Red List status: Least Concern Around 99% of trade related to the import of live individuals from wild sources. The top exporting countries were Senegal (29,200) and Guinea (18,950), with the remainder being exported by Mali (10,100) and Tanzania (3,476).
Hill Myna Gracula religiosa Criteria for inclusion: overall decrease Principal trade term: live EC imports as % of total trade: 56% of live Principal source: wild Top trading partners: Malaysia CITES Appendix/EC Annex: II/B

Analysis of the European Community and Candidate Countries Annual Report to CITES
22
IUCN Red List status: Least Concern Imports comprised 1,584 live individuals, 93% from wild sources and 7% from captivebred sources. All imports of wild birds to the EC originated in Malaysia (1,335 were direct imports and 144 specimens via Singapore). Captivebred birds were mostly (95%) imported from Taiwan, Province of China.
Following its listing in Appendix II in 1997, trade in wild specimens increased gradually, and imports peaked in 2000 when over 16,000 wild birds were imported into the EC. Trade in Hill Myna has since declined with much lower numbers reported in 2002 (1,430), 2003 (2,217) and 2004 (1,479).
3.2.3 Reptiles A diverse range of reptile species is traded internationally. Currently, 67 species are listed in the Appendix I, 508 species are listed in Appendix II and 25 species in Appendix III. Members of the EC imported 212 species of CITES listed reptiles. This trade involved the import of over 270,000 live animals, approximately 45,000 kg of meat and over 1,200,000 skins.
Taxa qualifying for inclusion in the analysis are listed in Table 3.5 and discussed below.
Only one AppendixI reptile species met the criteria for inclusion in this section: Siamese Crocodile Crocodylus siamensis, which qualified on the basis of a high volume of trade. This species is also globally threatened.
A further two species of AppendixI reptile met the high trade volume criterion on the basis of exporter reported quantities only, thus in neither case was the trade reported by Member States: Mexico reported the export to the EC of 120 skins (and 70 small leather products) of captivebred Morelet's Crocodile Crocodylus moreletii; Japan and Singapore reported the export of a total of 592 skins of captive bred Saltwater Crocodile Crocodylus porosus.
Twelve AppendixII reptile taxa qualified for inclusion in this section. Eight of these qualified on the basis of high trade volume, one as a consequence of a sharp increase in trade, one based on an overall increase in trade during 1995–2004, and four based on a decrease in trade during the same period. Elongated Turtle Indotestudo elongata is globally threatened.
Three species of AppendixII reptile met the high trade volume criterion on the basis of exporter reported quantities only: Nile Monitor Varanus niloticus, Royal Python Python regius and Common Rat Snake Ptyas mucosus. The latter two species qualified for inclusion in this section on other criteria, and are discussed further below. In the case of Nile Monitor Varanus niloticus, the EC’s trading partners reported the export of 170,933 wild sourced skins, whereas Member States reported the import of just 38,764 skins. This discrepancy was largely explained by the large quantity of exports reported by Chad (34,900 skins) and Mali (89,679 skins) that were not reported, or were reported in much lower quantities, by the importers.
No AppendixIII reptiles met the criteria for inclusion in this section.
Table 3.5. Summary of reptile species showing noteworthy patterns of trade
Criteria for inclusion
Species High volu me
Overall increase
Sharp increase
Overall decrease
CITES Appendix
EC Annex
Red List
status
CHORDATA REPTILIA TESTUDINES Testudinidae Elongated Turtle Indotestudo elongata
√ II B EN

Analysis of the European Community and Candidate Countries Annual Report to CITES
23
Criteria for inclusion
Species High volu me
Overall increase
Sharp increase
Overall decrease
CITES Appendix
EC Annex
Red List
status
CROCODYLIA Alligatoridae American Alligator Alligator mississippiensis
√ √ B LC
South American Spectacled Caiman Caiman crocodilus crocodilus
√ II B NE
Yacare Caiman Caiman yacare
√ √ II B LC
Crocodylidae Siamese Crocodile Crocodylus siamensis
√ I A CR
SAURIA Iguanidae Green Iguana Iguana iguana
√ II B NE
Teiidae Argentine Black and White Tegu Tupinambis merianae
√ II B NE
Varanidae Water Monitor Varanus salvator
√ II B NE
SERPENTES Pythonidae Royal Python Python regius
√ II B NE
Blood Python Python brongersmai
√ II B NE
Reticulated Python Python reticulatus
√ II B NE
Boidae Yellow Anaconda Eunectes notaeus
√ II B NE
Colubridae Common Ratsnake Ptyas mucosus
√ II B NE
Elongated Turtle Indotestudo elongata Criteria for inclusion: overall decrease Principal trade term: live EC imports as % of total trade: 90% of live Principal source: wild Top trading partner: Malaysia CITES Appendix /EC Annex: II/B IUCN Red List status: Endangered All imports were of wildsourced specimens from Malaysia.
The overall level of trade was below the threshold for qualification on the basis of high trade volume; nonetheless this endangered species qualified for this section on the basis of the notable decrease in
reported total imports of wildsourced specimens over the period 1995–2004. Following the highs of 1,205 and 1,370 wild tortoises that were imported in 1996 and 1997 respectively, numbers of imports into the EC did not exceed 300 specimens from 2001 2004.
American Alligator
Alligator mississippiensis Criteria for inclusion: high volume, sharp increase Principal trade term: skins EC imports as % of total trade: 55% of skins Principal sources: captivebred, wild Top trading partner: USA
Analysis of the European Community and Candidate Countries Annual Report to CITES
24
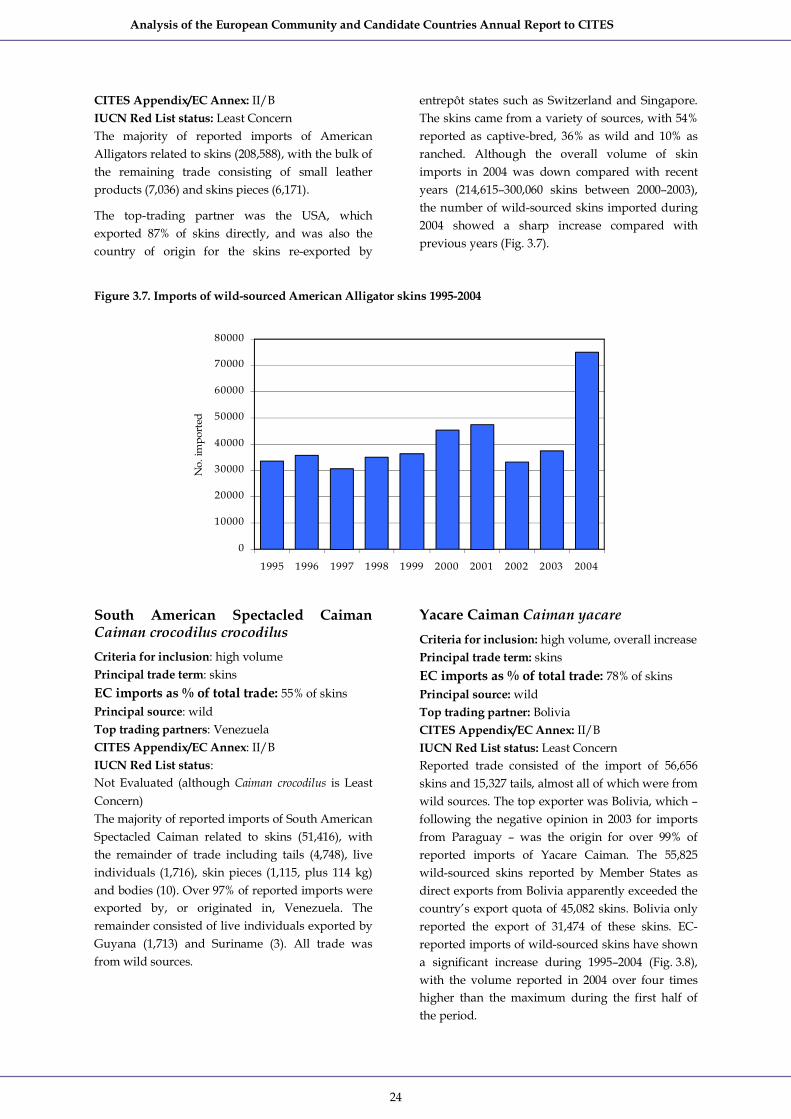
CITES Appendix/EC Annex: II/B IUCN Red List status: Least Concern The majority of reported imports of American Alligators related to skins (208,588), with the bulk of the remaining trade consisting of small leather products (7,036) and skins pieces (6,171).
The toptrading partner was the USA, which exported 87% of skins directly, and was also the country of origin for the skins reexported by
entrepôt states such as Switzerland and Singapore. The skins came from a variety of sources, with 54% reported as captivebred, 36% as wild and 10% as ranched. Although the overall volume of skin imports in 2004 was down compared with recent years (214,615–300,060 skins between 2000–2003), the number of wildsourced skins imported during 2004 showed a sharp increase compared with previous years (Fig. 3.7).
Figure 3.7. Imports of wildsourced American Alligator skins 19952004
0
10000
20000
30000
40000
50000
60000
70000
80000
1995 1996 1997 1998 1999 2000 2001 2002 2003 2004
No.
impo
rted
South American Spectacled Caiman Caiman crocodilus crocodilus Criteria for inclusion: high volume Principal trade term: skins EC imports as % of total trade: 55% of skins Principal source: wild Top trading partners: Venezuela CITES Appendix/EC Annex: II/B IUCN Red List status: Not Evaluated (although Caiman crocodilus is Least Concern) The majority of reported imports of South American Spectacled Caiman related to skins (51,416), with the remainder of trade including tails (4,748), live individuals (1,716), skin pieces (1,115, plus 114 kg) and bodies (10). Over 97% of reported imports were exported by, or originated in, Venezuela. The remainder consisted of live individuals exported by Guyana (1,713) and Suriname (3). All trade was from wild sources.
Yacare Caiman Caiman yacare Criteria for inclusion: high volume, overall increase Principal trade term: skins EC imports as % of total trade: 78% of skins Principal source: wild Top trading partner: Bolivia CITES Appendix/EC Annex: II/B IUCN Red List status: Least Concern Reported trade consisted of the import of 56,656 skins and 15,327 tails, almost all of which were from wild sources. The top exporter was Bolivia, which – following the negative opinion in 2003 for imports from Paraguay – was the origin for over 99% of reported imports of Yacare Caiman. The 55,825 wildsourced skins reported by Member States as direct exports from Bolivia apparently exceeded the country’s export quota of 45,082 skins. Bolivia only reported the export of 31,474 of these skins. EC reported imports of wildsourced skins have shown a significant increase during 1995–2004 (Fig. 3.8), with the volume reported in 2004 over four times higher than the maximum during the first half of the period.

Analysis of the European Community and Candidate Countries Annual Report to CITES
25
Figure 3.8. Imports of wildcollected Yacare Caiman skins 19952004
0
20000
40000
60000
80000
100000
120000
140000
1995 1996 1997 1998 1999 2000 2001 2002 2003 2004
No.
of s
kins
Siamese Crocodile Crocodylus siamensis Criteria for inclusion: high volume Principal trade term: skins EC imports as % of total trade: 6% of skins Principal source: captivebred Top trading partner: Thailand CITES Appendix/EC Annex: I/A IUCN Red List status: Critically Endangered The majority of the trade was in skins. Member States also reported the import of 247 small leather products. In addition, Thailand reported the export of 1,200 flasks of meat and 1,000 teeth but neither of these transactions was reported by the EC. All trade was reported to be from captivebred sources (‘D’); in Thailand there are 20 captivebreeding operations for this species registered with the CITES Secretariat.
Green Iguana Iguana iguana Criteria for inclusion: high volume Principal trade term: live EC imports as % of total trade: 21% of live Principal source: captivebred Top trading partners: El Salvador CITES Appendix/EC Annex: II/B IUCN Red List status: Not Evaluated All reported imports related exclusively to live individuals, the vast majority (over 97%) of which came from captivebred sources.
The top trading partner was El Salvador, which accounted for 76% (115,809 individuals) of direct imports to the EC, and was the country of origin for
a further 17,627 individuals reexported by the USA and Canada. The small number of wildsourced exports originated in Peru (400), Suriname (150) and Guyana (39).
Greem Iguana (© Ben Lascelles)
Argentine Black and White Tegu Tupinambis merianae Criteria for inclusion: high volume Principal trade term: skins EC imports as % of total trade: 49% of skins Principal source: wild Top trading partner: Argentina CITES Appendix/EC Annex: II/B IUCN Red List status: Not Evaluated
Imports comprised mostly skins (125,417) with low level trade in small leather products (2,650), skin pieces (510 and 15 kg) and live animals (461) also reported. All trade was in wildsourced specimens with the exception of the live specimens, which were captive bred.
Analysis of the European Community and Candidate Countries Annual Report to CITES
26
Of the 125,417 wildcaught skins, almost all (123,417) were exported from or originated in Argentina, and 2,000 skins were imported from Paraguay.
Water Monitor Varanus salvator Criteria for inclusion: high volume Principal trade term: skins EC imports as % of total trade: 17% of skins Principal source: wild Top trading partner: Singapore, Indonesia CITES Appendix/EC Annex: II/B IUCN Red List status: Not Evaluated Wildsourced skins, 120,117 of which were imported, dominated reported imports. The top trading partners were Singapore, which exported 87,355 skins, and Indonesia, which exported 32,377 skins. All skins exported by Singapore were re exports from either Indonesia (76%) or Malaysia (24%).
Water Monitor (© Mark Auliya)
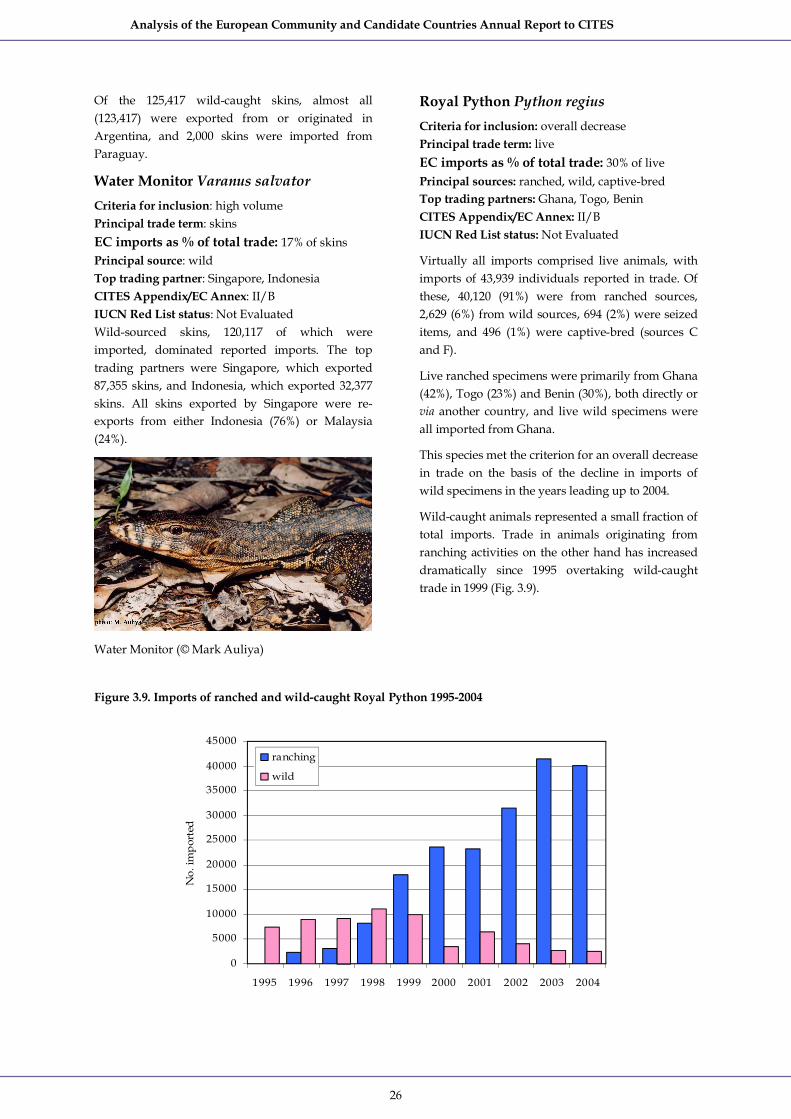
Royal Python Python regius Criteria for inclusion: overall decrease Principal trade term: live EC imports as % of total trade: 30% of live Principal sources: ranched, wild, captivebred Top trading partners: Ghana, Togo, Benin CITES Appendix/EC Annex: II/B IUCN Red List status: Not Evaluated
Virtually all imports comprised live animals, with imports of 43,939 individuals reported in trade. Of these, 40,120 (91%) were from ranched sources, 2,629 (6%) from wild sources, 694 (2%) were seized items, and 496 (1%) were captivebred (sources C and F).
Live ranched specimens were primarily from Ghana (42%), Togo (23%) and Benin (30%), both directly or via another country, and live wild specimens were all imported from Ghana.
This species met the criterion for an overall decrease in trade on the basis of the decline in imports of wild specimens in the years leading up to 2004.
Wildcaught animals represented a small fraction of total imports. Trade in animals originating from ranching activities on the other hand has increased dramatically since 1995 overtaking wildcaught trade in 1999 (Fig. 3.9).
Figure 3.9. Imports of ranched and wildcaught Royal Python 19952004
0
5000
10000
15000
20000
25000
30000
35000
40000
45000
1995 1996 1997 1998 1999 2000 2001 2002 2003 2004
No.
impo
rted
ranching
wild

Analysis of the European Community and Candidate Countries Annual Report to CITES
27
Blood Python Python brongersmai Criteria for inclusion: high volume Principal trade term: skins EC imports as % of total trade: 78% of skins Principal sources: wild Top trading partners: Malaysia, Indonesia CITES Appendix/EC Annex: II/B IUCN Red List status: Not Evaluated
EC Member States reported imports of 69,284 skins, all of which were wildsourced. These imports were from Malaysia (67%) and Indonesia (33%), although approximately one third of skins originating in Indonesia were imported via Singapore. In addition, 19 live individuals were imported, 10 from wild sources and nine from captivebred sources.
This year was also the first time imports were reported by EC Member States for this species, reflecting the change in nomenclature of P. curtus agreed at the 12th CITES Conference of the Parties (CoP) in Chile in 2002, where full species status was given to three subspecies, namely P. curtus Schlegel, 1872, P. brongersmai Stull, 1938, and P. breitensteini Steindachner, 1880.
These amendments render trade analysis difficult. Nonetheless, when taken into account, trade in skins has increased throughout the past decade for this cluster although imports for 2003 and 2004 were below those for 2002. P. brongersmai accounted for 58% of the combined skin imports of P. curtus, P. brongersmai and P. breitensteini.
Reticulated Python Python reticulatus Criteria for inclusion: high volume Principal trade term: skins EC imports as % of total trade: 40% of skins Principal sources: wild, captivebred Top trading partners: Singapore, Indonesia, Malaysia, Viet Nam CITES Appendix/EC Annex: II/B IUCN Red List status: Not Evaluated Reported imports consisted almost exclusively of skins, 257,329 of which were imported.
The top exporting country was Singapore, which exported 158,200 skins to the EC. The latter all related to reexports from Indonesia (81%), Viet Nam (18%) and Malaysia (1%). When considering both direct exports and reexports, 66% (170,742) of ECreported skins imports originated in
Indonesia and 29% (73,472 skins) originated in Viet Nam.
With the possible exception of 2,782 seized skins, all skins that originated in Indonesia were reported as from wild sources. The skins originating in Viet Nam were all from captivebred sources.
Reticulated Python (© Mark Auliya)
Yellow Anaconda Eunectes notaeus Criteria for inclusion: overall decrease Principal trade term: skins EC imports as % of total trade: 89% of skins Principal sources: wild Top trading partners: Argentina CITES Appendix/EC Annex: II/B IUCN Red List status: Not Evaluated
EC Member States imported 4,875 skins from Argentina (either directly or indirectly). Very low level imports of live specimens were also reported, from captivebred and unknown sources.
EC imports of skins increased between 19951997, with 43,725 skins imported in 1997. Since then, imports declined, averaging approximately 4,000 skins for the years.

Analysis of the European Community and Candidate Countries Annual Report to CITES
28
Common Ratsnake Ptyas mucosus Criteria for inclusion: overall decrease Principal trade term: skins EC imports as % of total trade: 40% of skins Principal sources: wild Top trading partners: Singapore CITES Appendix EC Annex: II/B IUCN Red List status: Not Evaluated All imports involved wildsourced skins, which were imported from Thailand via China and Singapore. A total of 37,215 skins were imported.
The Common Ratsnake qualified for discussion due to the overall decrease in ECreported imports of wildsourced skins over the period 19952004. EC imports in 1998 were anomalously high, with over 580,000 skins being reported. However, levels of trade in each of 2001 to 2004 did not exceed 60,000 skins, and averaged 29,500 skins.
3.2.4 Amphibians Member States reported the import of fifteen CITESlisted amphibian species. The imports included live animals and specimens but the bulk of the trade was meat.
Only one species of amphibian met the criteria for inclusion in this section: Tiger Frog Hoplobatrachus tigerinus, listed in Appendix II.
Table 3.6. Summary of amphibian species showing noteworthy patterns of trade
Criteria for inclusion Species High
volume Overall increase
Sharp increase
Overall decrease
CITES Appendix
EC Annex
Red List
status
CHORDATA AMPHIBIA ANURA Ranidae Tiger Frog Hoplobatrachus tigerinus
√ II B LC
Tiger Frog Hoplobatrachus tigerinus Criteria for inclusion: high volume Principal trade term: meat EC imports as % of total trade: 62% of meat (kg) Principal source: captivebred
Top trading partner: Viet Nam CITES Appendix/EC Annex: II/B IUCN Red List status: Least Concern Trade consisted mainly of the import of meat (frog legs) from captivebreeding operations in Viet Nam.
3.2.5 Fish The ECreported imports of thirtythree species of fish. Fish are traded principally as live animals, for their meat or eggs. Trade in caviar and other sturgeon products is discussed in Chapter 4. Two
species qualified for inclusion in this section: Asian Arowana Scleropages formosus and Paddlefish Polyodon spathula.
Table 3.7. Summary of fish species showing noteworthy patterns of trade
Criteria for inclusion Species High
volume Overall increase
Sharp increase
Overall decrease
CITES Appendix
EC Annex
Red List
status
CHORDATA ACTINOPTERYGII OSTEOGLOSSIFORMES Osteoglossidae
Analysis of the European Community and Candidate Countries Annual Report to CITES
29
Criteria for inclusion Species High
volume Overall increase
Sharp increase
Overall decrease
CITES Appendix
EC Annex
Red List
status
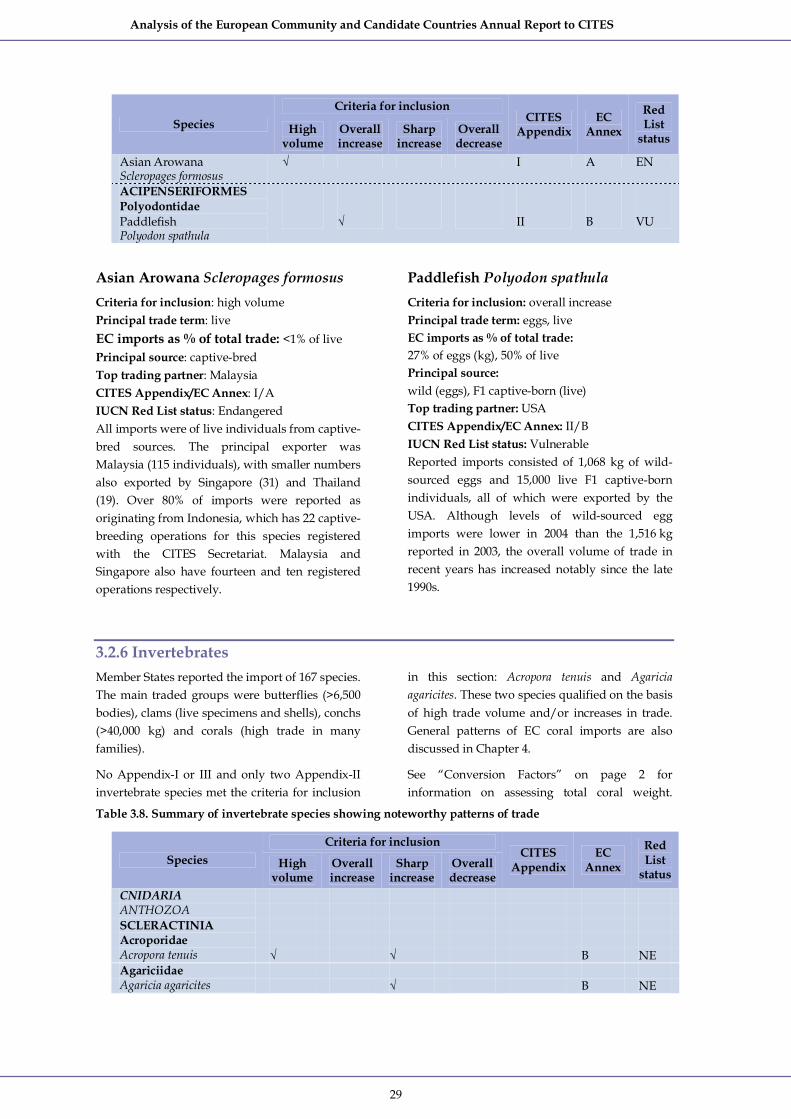
Asian Arowana Scleropages formosus
√ I A EN
ACIPENSERIFORMES Polyodontidae Paddlefish Polyodon spathula
√ II B VU
Asian Arowana Scleropages formosus Criteria for inclusion: high volume Principal trade term: live EC imports as % of total trade: <1% of live Principal source: captivebred Top trading partner: Malaysia CITES Appendix/EC Annex: I/A IUCN Red List status: Endangered All imports were of live individuals from captive bred sources. The principal exporter was Malaysia (115 individuals), with smaller numbers also exported by Singapore (31) and Thailand (19). Over 80% of imports were reported as originating from Indonesia, which has 22 captive breeding operations for this species registered with the CITES Secretariat. Malaysia and Singapore also have fourteen and ten registered operations respectively.
Paddlefish Polyodon spathula Criteria for inclusion: overall increase Principal trade term: eggs, live EC imports as % of total trade: 27% of eggs (kg), 50% of live Principal source: wild (eggs), F1 captiveborn (live) Top trading partner: USA CITES Appendix/EC Annex: II/B IUCN Red List status: Vulnerable Reported imports consisted of 1,068 kg of wild sourced eggs and 15,000 live F1 captiveborn individuals, all of which were exported by the USA. Although levels of wildsourced egg imports were lower in 2004 than the 1,516 kg reported in 2003, the overall volume of trade in recent years has increased notably since the late 1990s.
3.2.6 Invertebrates Member States reported the import of 167 species. The main traded groups were butterflies (>6,500 bodies), clams (live specimens and shells), conchs (>40,000 kg) and corals (high trade in many families).
No AppendixI or III and only two AppendixII invertebrate species met the criteria for inclusion
in this section: Acropora tenuis and Agaricia agaricites. These two species qualified on the basis of high trade volume and/or increases in trade. General patterns of EC coral imports are also discussed in Chapter 4.
See “Conversion Factors” on page 2 for information on assessing total coral weight.
Table 3.8. Summary of invertebrate species showing noteworthy patterns of trade
Criteria for inclusion Species High
volume Overall increase
Sharp increase
Overall decrease
CITES Appendix
EC Annex
Red List
status
CNIDARIA ANTHOZOA SCLERACTINIA Acroporidae Acropora tenuis √ √ B NE Agariciidae Agaricia agaricites √ B NE

Analysis of the European Community and Candidate Countries Annual Report to CITES
30
Acropora tenuis Criteria for inclusion: high volume, sharp increase Principal trade term: raw corals EC imports as % of total trade: 98% (all terms) Principal source: wild Top trading partner: Japan Appendix/EC Annex: II/B IUCN Red List status: Not Evaluated Reported imports were dominated by the import, for scientific purposes, of 60,000 pieces of wild sourced raw coral from Japan. This represented a sharp increase in trade.
The only other trade reported by Member States was the import of 630 pieces of wildsourced live coral from Indonesia.
Agaricia agaricites Criteria for inclusion: sharp increase
Principal trade term: raw corals EC imports as % of total trade: 20% raw corals (kg) Principal source: wild Top trading partner: USA Appendix/EC Annex: II/B IUCN Red List status: Not Evaluated The EC reported the import of 9,283 kg of wild sourced raw Agaricia agaricites from Haiti and the USA. The USA also reported the export of a further 2,848 kg of wildsourced live coral to the EC (trade not reported by Member States).
The only previous imports of wildsourced specimens reported in the EC during 1995–2003 were 32 pieces of live coral imported in 2002 and 2003. The quantity imported hence represented a sharp increase in trade volume.
3.2.7 Plants (nontimber) Trade in AppendixI species (Araucaria araucana, Saussurea costus, Paphiopedilum spp., Astrophytum asterias) was reported to be of artificially propagated specimens, which is treated as Appendix II trade (Article VII: 4). As such, the trade levels did not meet the criteria for inclusion in the analysis.
Nine AppendixII taxa qualified for inclusion in this section. Seven of these qualified on the basis of high trade volume, two as a consequence of a sharp increase in trade, and five based on an overall increase in trade during 1995–2004.
Trade in two species of cactus, Eulychnia acida and Opuntia ficusindica is included in the discussions on cactus rainsticks and flowers in Chapter 4. No AppendixIII nontimber plant species met the criteria for inclusion in this section.
Table 3.9. Summary of nontimber plant species showing noteworthy patterns of trade
Criteria for inclusion Species High
volume Overall increase
Sharp increase
Overall decrease
Cites Appendix
EC Annex
Red List
status
FLORA Amaryllidaceae Snowdrop Galanthus elwesii
√ II B NE
Snowdrop Galanthus woronowii
√ √ II B NE
Cyatheaceae Tree Fern Cyathea spp.
√ II B NE/ DD/ NT/ VU/ EN

Analysis of the European Community and Candidate Countries Annual Report to CITES
31
Criteria for inclusion Species High
volume Overall increase
Sharp increase
Overall decrease
Cites Appendix
EC Annex
Red List
status
Euphorbiaceae Candelilla Euphorbia antisyphilitica
√ √ II B NE
“Primrose Leaf” Euphorbia Euphorbia primulifolia
√ II B VU
Liliaceae Cape Aloe Aloe ferox
√ √ √ II B NE
Primulaceae Cyclamen cilicium √ II B NE Cyclamen coum √ √ II B NE Cyclamen hederifolium √ II B NE
Snowdrop Galanthus elwesii Criteria for inclusion: high volume Principal trade term: live/bulbs EC imports as % of total trade: 76% (all terms) Principal source: wild
Top trading partner: Turkey CITES Appendix/EC Annex: II/B IUCN Red List status: Not Evaluated
The only reported trade in Galanthus elwesii was the import of 5.6 million wildsourced bulbs from Turkey. This transaction represented nearly 95% of Turkey’s 2004 export quota for the species.
Galanthus spp. (© Christine Warren)
Snowdrop Galanthus woronowii Criteria for inclusion: high volume, overall increase Principal trade term: live/bulbs EC imports as % of total trade: 97% (all terms)
Principal source: wild Top trading partner: Turkey CITES Appendix/EC Annex: II/B IUCN Red List status: Not Evaluated Reported imports consisted entirely of bulbs. The principal importer reported the import of 19.9 million wildsourced bulbs. These originated from Turkey (1.9 million) and Georgia (18 million) represented 95% and 100% respectively of the countries’ 2004 export quotas for the species. The EC also reported the seizure of 3,620 bulbs exported by Switzerland with unknown origin and purpose ‘N’ (i.e., for introduction into the wild).
Although trade volumes in 2004 were broadly comparable with those in 2003, EC imports of wild sourced G. woronowii (including synonym G. ikariae), have shown a marked increase overall during 1995–2004 (Fig. 3.11). The conspicuous drop in imports in 2001 related to the export by Turkey and Georgia of almost 8 million plants reported as from ranched sources
Tree Fern Cyathea spp. Criteria for inclusion: overall increase Principal trade term: dried plants EC imports as % of total trade: 100% of dried plants (kg) Principal source: wild Top trading partner: Indonesia CITES Appendix/EC Annex: II/B IUCN Red List status: Not Evaluated/ Data Deficient/ Near Threatened/ Vulnerable/ Endangered Trade was dominated by the import of 11,400 kg of wildsourced dried plants from Indonesia. The EC

Analysis of the European Community and Candidate Countries Annual Report to CITES
32
also reported the seizure of 170 dried plants from Cameroon and 459 live plants from New Zealand. Although the quantity imported in 2004 was lower
than the 14,400 kg reported in 2003, ECreported imports of wildsourced Cyathea spp. have shown a notable increase overall since 1995.
Figure 3.11. Imports of wildsourced Galanthus woronowii bulbs 1995–2004
0
5000000
10000000
15000000
20000000
25000000
1995 1996 1997 1998 1999 2000 2001 2002 2003 2004
No.
of b
ulbs
Candelilla Euphorbia antisyphilitica Criteria for inclusion: high volume, overall increase Principal trade term: wax EC imports as % of total trade: 56% of wax (kg) Principal source: wild Top trading partner: Mexico CITES Appendix/EC Annex: II/B IUCN Red List status: Not Evaluated The EC reported the import of 218,500 kg of wax and 147 kg of extract (which was reported as wax by the exporter, Switzerland). All trade was from wild sources and originated in Mexico. Following several years without any reported trade, ECreported imports of wild sourced wax rose to 41,000 kg in 2001, jumped to 195,000 kg and 191,525 kg in 2002 and 2003 respectively, and increased again.
“Primrose Leaf” Euphorbia Euphorbia primulifolia Criteria for inclusion: sharp increase Principal trade term: live EC imports as % of total trade: 21% (all terms) Principal source: wild Top trading partner: Madagascar CITES Appendix/EC Annex: II/B
IUCN Red List status: Vulnerable The EC reported the import from Madagascar of wildsourced live specimens for trade purposes (630), for artificial propagation (50) and for botanical gardens (12). The 692 plants imported in 2004 represented a sharp increase in trade compared to previous years; annual imports of wildsourced plants did not exceed 150 individuals during 1995–2003.√
Cape Aloe Aloe ferox Criteria for inclusion: high volume, sharp increase, overall increase Principal trade term: extract, dried plants, leaves EC imports as % of total trade: 65% of extract (kg), 42% of extract (litres) Principal source: wild Top trading partner: South Africa CITES Appendix/EC Annex: II/B IUCN Red List status: Not Evaluated Trade was dominated by the import of extract, reported using a variety of units: 149,165 kg, 50,293 litres and 16,921 (no units). EC Member States also reported the import of 43,600 dried plants, 14,020 leaves and 3,200 live plants. All trade was in wildsourced products originating in South Africa. Although imports of extract have remained relatively stable in recent years
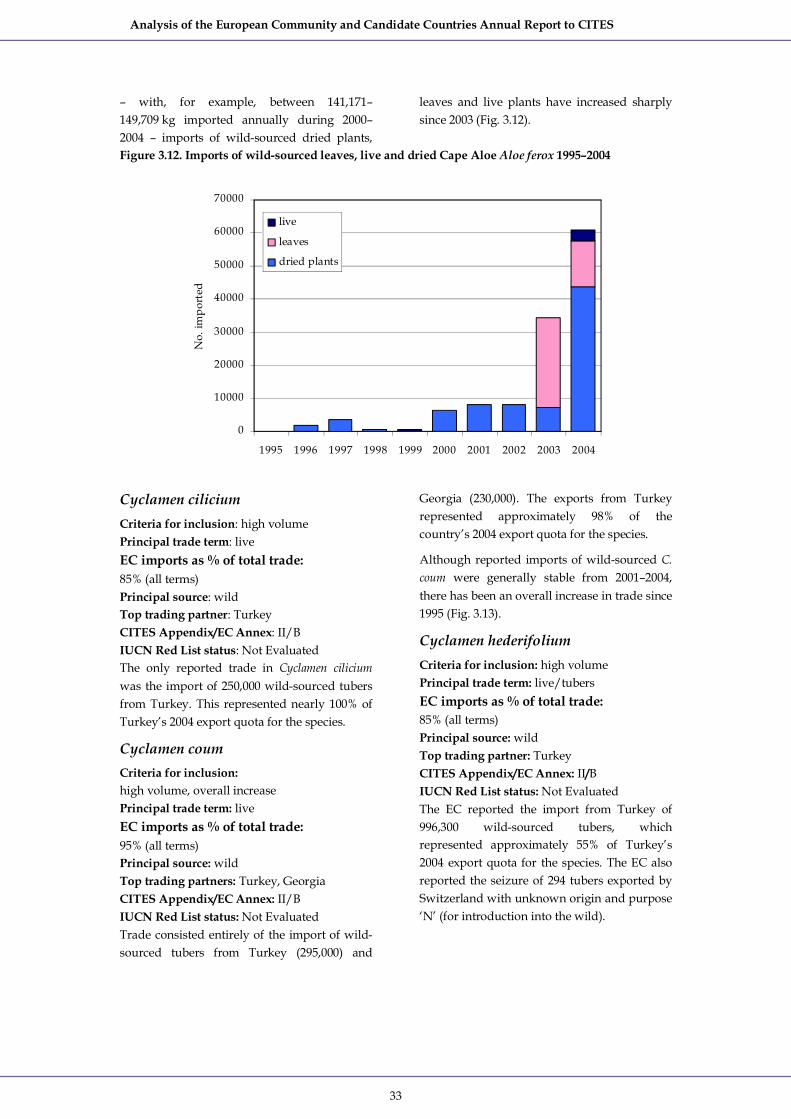
Analysis of the European Community and Candidate Countries Annual Report to CITES
33
– with, for example, between 141,171– 149,709 kg imported annually during 2000– 2004 – imports of wildsourced dried plants,
leaves and live plants have increased sharply since 2003 (Fig. 3.12).
Figure 3.12. Imports of wildsourced leaves, live and dried Cape Aloe Aloe ferox 1995–2004
0
10000
20000
30000
40000
50000
60000
70000
1995 1996 1997 1998 1999 2000 2001 2002 2003 2004
No.
impo
rted
live
leaves
dried plants
Cyclamen cilicium Criteria for inclusion: high volume Principal trade term: live EC imports as % of total trade: 85% (all terms) Principal source: wild Top trading partner: Turkey CITES Appendix/EC Annex: II/B IUCN Red List status: Not Evaluated The only reported trade in Cyclamen cilicium was the import of 250,000 wildsourced tubers from Turkey. This represented nearly 100% of Turkey’s 2004 export quota for the species.
Cyclamen coum Criteria for inclusion: high volume, overall increase Principal trade term: live EC imports as % of total trade: 95% (all terms) Principal source: wild Top trading partners: Turkey, Georgia CITES Appendix/EC Annex: II/B IUCN Red List status: Not Evaluated Trade consisted entirely of the import of wild sourced tubers from Turkey (295,000) and
Georgia (230,000). The exports from Turkey represented approximately 98% of the country’s 2004 export quota for the species.
Although reported imports of wildsourced C. coum were generally stable from 2001–2004, there has been an overall increase in trade since 1995 (Fig. 3.13).
Cyclamen hederifolium Criteria for inclusion: high volume Principal trade term: live/tubers EC imports as % of total trade: 85% (all terms) Principal source: wild Top trading partner: Turkey CITES Appendix/EC Annex: II/B IUCN Red List status: Not Evaluated The EC reported the import from Turkey of 996,300 wildsourced tubers, which represented approximately 55% of Turkey’s 2004 export quota for the species. The EC also reported the seizure of 294 tubers exported by Switzerland with unknown origin and purpose ‘N’ (for introduction into the wild).

Analysis of the European Community and Candidate Countries Annual Report to CITES
34
Figure 3.13. Imports of wildsourced live Cyclamen coum 1995–2004
0
100000
200000
300000
400000
500000
600000
700000
1995 1996 1997 1998 1999 2000 2001 2002 2003 2004
No.
impo
rted
3.2.8 Plants (timber) Timber terms and units were converted according to the details provided in ”Conversion Factors” page 2.
Four AppendixII timber species and the
AppendixIII genus Gonystylus met the criteria for inclusion in this section.
Fifteen species of Gonystylus, including G. bancanus, are globally threatened.
Table 3.10. Summary of timber plant species showing noteworthy patterns of trade
Criteria for inclusion Species High
volume Overall increase
Sharp increase
Overall decrease
CITES Appendix
EC Annex
Red List status
FLORA Leguminosae Afromosia/African Teak Pericopsis elata
√ II B EN
Meliaceae Bigleaf Mahogany Swietenia macrophylla
√ II B VU
Rosaceae African Cherry Prunus africana
√ II B VU
Thymelaeaceae Ramin Gonystylus spp.
√ III C NE/VU
Zygophyllaceae Lignum Vitae Guaiacum sanctum
√ II B EN

Analysis of the European Community and Candidate Countries Annual Report to CITES
35
Afromosia/African Teak Pericopsis elata Criteria for inclusion: high volume Principal trade term: timber EC imports as % of total trade: 77% of timber (m 3 ) Principal source: wild Top trading partner: Cameroon CITES Appendix/EC Annex: II/B IUCN Red List status: Endangered Reported imports consisted entirely of timber from wild sources (9,072 m 3 ).
The EC also reported the seizure of 18 m 3 of timber (from DR Congo). The top exporter was Cameroon, which accounted for over 80% of ECreported imports; DR Congo (1,241 m 3 ) and Congo (296 m 3 ) exported the remainder.
There were notable discrepancies in level of trade reported by exporters and importers.
None of the exports from Cameroon or Congo was reported by the exporting country, whereas DR Congo reported the export of more than twice the volume of timber (2,952 m 3 ) than was reported by the EC.
Overall volumes of wildsourced timber imports in 2004 were slightly up on those reported in 2003.
Bigleaf Mahogany
Swietenia macrophylla Criteria for inclusion: high volume Principal trade term: timber EC imports as % of total trade: 2% of timber (m 3 ) Principal source: wild Top trading partner: Peru CITES Appendix EC Annex: II/B IUCN Red List status: Vulnerable EC Member States reported the import of 1,021 m 3
of wildsourced timber, as well as small volumes of veneer. The EC also reported the seizure of 28 m 3 of timber (from Peru).
The major trading partner was Peru, which accounted around 50% of ECreported imports, with Guatemala (16%) and Nicaragua (14%) also exporting significant volumes.
The remaining imports originated in Brazil, Bolivia and Mexico, with around threequarters of the timber from Brazil reaching the EC as reexports from the USA.
African Cherry Prunus africana Criteria for inclusion: high volume Principal trade term: bark EC imports as % of total trade: 78% of bark (kg) Principal source: wild Top trading partner: Cameroon CITES Appendix/EC Annex: II/B IUCN Red List status: Vulnerable The bulk of reported imports consisted of bark (1,320,004 kg), with smaller quantities of extract (3,165 kg) also imported.
The top exporter was Cameroon, which accounted for 77% of reported imports of bark, with Equatorial Guinea (141,228 kg of bark), DR Congo (100,000 kg of bark) and Tanzania (57,130 kg of bark) exporting the bulk of the remainder. All trade was in wild sourced products.
Although imports of bark in 2004 apparently showed a sharp increase compared with 2003, the overall level of trade was found to be lower than that observed in 1998 when imports of powder (which is used interchangeably with bark when reporting P. africana trade) were also taken into account.
Lignum Vitae Guaiacum sanctum Criteria for inclusion: sharp increase Principal trade term: timber EC imports as % of total trade: 38% (all terms) Principal source: wild Top trading partner: Mexico CITES Appendix/EC Annex: II/B IUCN Red List status: Endangered EC Member States reported the import of 45 m 3
wildsourced timber; the exporting country, Mexico, reported the export of 57 m 3 . In 2003, Member States reported the import of 28 m 3 of timber from Mexico.
There were no ECreported imports 1995–2002.
Ramin Gonystylus spp. Criteria for inclusion: high volume Principal trade term: timber, carvings EC imports as % of total trade: 38% of timber (m 3 ) Principal source: wild Top trading partners: Malaysia, Indonesia CITES Appendix/EC Annex: III/C (2004); II/B (2005) IUCN Red List status: Not Evaluated/Vulnerable

Analysis of the European Community and Candidate Countries Annual Report to CITES
36
Imports of Ramin including Gonystylus bancanus, the only species of Gonystylus reported in trade at the specific level, were reported using a range of terms and units, which complicated the assessment of the total volume of trade. Nevertheless, the EC reported the import of 1,789 m 3 of sawn wood, 91,080 (plus 195 m 3 of) carvings and 200 pieces of timber, all from wild sources. The EC also reported
the seizure of 280,321 (plus 974 kg of) timber pieces and 33,536 kg of carvings. The bulk of reported imports originated in Malaysia and Indonesia.
As the genus Gonystylus was only included in Appendix III in 2001, it was not possible to assess patterns of trade over time reliably.
Nevertheless, the volume of sawn wood imported in 2004 was considerably lower than import levels in both 2003 and 2002. The genus was listed in Appendix II in 2005.

Analysis of the European Community and Candidate Countries Annual Report to CITES
37
4. Analysis of imports in selected groups The groups discussed in this section are those in which there was high volume or high profile trade across a range of related species. All the trade figures tabulated in this section were derived from
Member States’ and candidate countries’ reports, unless otherwise stated. Where figures differed noticeably from those reported by exporters, this has been discussed in the text.
4.1 Mammals Sport hunting trophies The analysis of sport hunting trophy data is complicated by the various terms used, and differences in the reported purpose of the trade. Sport hunting trophies may be reported as: trophies, skins, skulls and bodies, or other terms. Some items are reported with the purpose of the trade as: commercial (T), hunting trophy (H) or personal (P). Interpretation of these data in terms of the number of animals involved is not always possible.
The Guidelines for the preparation and submission of CITES annual reports, included with CITES Notification No. 2002/022, state that all the trophy parts of one animal such as the horns (2), skull, cape, back skin, tail and feet (i.e., ten specimens) – constitute one trophy if they are exported together. Similarly, if the skull and horns are the only specimens of an animal that are exported, then these items together should be recorded as one trophy. Otherwise, the items should be recorded separately.
Despite this, many Parties still report all the individual parts of an animal. If these factors are not considered when carrying out an analysis of these data, this can lead to an overestimation of the trade. There is also the added complication of yearend reporting issues with sport hunting trophies, particularly for those exported from Africa where
the trophies are prepared or mounted before finally being exported.
Data were extracted for selected terms: bodies, skins, trophies, Hippopotamus teeth and African Elephant tusks. Only purpose codes H, P and T were selected. Commercial shipments of skins, that were not clearly hunting trophies, were excluded from the data set. African Elephant skins were also excluded from the analysis, as they do not necessarily represent single animals. The skins are very thick and can be split several times. The numbers for African Elephant tusks and Hippopotamus teeth were divided by 1.88 and 12 respectively so that they might represent individual animals (Parker & Martin, 1982).
Data analysis was based on direct export data only, as Hong Kong SAR and South Africa, for example, act as entrepôt states for Hippopotamus ivory and trophies.
4.1.1 European Community Trade in sporthunted mammal species is generally sourced from specimens taken from the wild as well as from specimens that were bred in captivity or F1 (or subsequent generations) born in captivity.
The main species hunted that originated from captive breeding and ranching activities were Caracal Caracal caracal, Lion Panthera leo and Aoudad Ammotragus lervia, all originating in South
Africa. This trade accounted for about 2% of the total sport trophy hunting trade.
The remainder of this section discusses sport trophy hunting of mammal species sourced from the wild.
Over the past five years, EC imports of sporthunted mammal species have decreased form over 5,000 in 2000 to around 3,450 in 2003 and 2004. Table 4.1 summarises trade in the twentytwo species for

Analysis of the European Community and Candidate Countries Annual Report to CITES
38
which over 100 trophies were imported into the EC during 20002004..
Black Bear Ursus americanus, Hippopotamus Hippopotamus amphibious, African Elephant
Loxodonta africana and Hartmann's Mountain Zebra Equus zebra hartmannae were the most commonly hunted mammal species over that period. Import numbers for Black Bear have been declining since 2000, but the species’ population is considered to be stable throughout most its range (Servheen et al., 1999). Blackbuck Antilope cervicapra saw the highest increase in trade.
Overall, during 20004, the main exporters of hunting trophies were: Canada 21%; Namibia 16%; Tanzania 14%; Zimbabwe 14%; South Africa 9%.
Seventyseven percent of Canada’s sport trophy exports were of Black Bear. Namibia’s main export was of Hartmann's Mountain Zebra (55%) and Tanzania’s main exports were of Hippopotamus (48%), Leopard (23%), Lion (12%) and African Elephant (11%). South Africa exported many species at lower levels and Zimbabwe exported mainly African Elephant (34%) Hippopotamus (32%) and Leopard (13%).
Twentytwo of the twentyfive Member States imported wild hunted mammals.
Table 4.1. Imports of wildsourced sporthunted mammal trophies 20002004 (totals exceeding 100 individuals)
Taxon 2000 2001 2002 2003 2004 Total CHORDATA MAMMALIA PRIMATES Cercopithecidae Vervet Monkey Chlorocebus aethiops 24 7 30 23 31 115
Hamadryas Baboon Papio hamadryas (including subspecies) 216 136 187 226 113 878
CETACEA Monodontidae Narwhal Monodon monoceros 10 35 34 49 57 185
CARNIVORA Canidae Wolf Canis lupus 168 138 75 81 77 539
Ursidae Black Bear Ursus americanus 1,487 563 520 403 339 3,312
Brown Bear Ursus arctos 273 245 285 268 290 1,361
Polar Bear Ursus maritimus 36 38 63 99 92 328
Viverridae African Civet Civettictis civetta 22 20 28 27 32 129
Felidae Cheetah Acinonyx jubatus 49 62 93 77 64 345
Caracal Caracal caracal 42 67 77 73 91 350
Wild Cat Felis silvestris (including subspecies) 40 30 34 40 35 179
Lion Panthera leo 297 173 91 100 78 739
Leopard Panthera pardus 373 328 268 330 261 1,560
Puma 94 59 53 81 80 367

Analysis of the European Community and Candidate Countries Annual Report to CITES
39
Taxon 2000 2001 2002 2003 2004 Total Puma concolor PROBOSCIDAE Elephantidae African Elephant Loxodonta Africana 648 475 568 547 384 2,622
PERISSODACTYLA Equidae Hartmann’s Mountain Zebra Equus zebra hartmannae 349 421 337 355 376 1,838
ARTIODACTYLA Hippopotamidae Hippopotamus Hippopotamus amphibious 396 872 787 281 606 2,942
Bovidae Blackbuck Antilope cervicapra 22 10 19 51 136 238
Blue Duiker Cephalophus monticola 44 40 29 34 28 175
Topi Damaliscus lunatus 82 43 74 47 48 294
Blesbok Damaliscus pygargus (including subspecies) 30 26 20 16 21 113
Lechwe Kobus leche (including subspecies) 87 53 67 77 48 332
Total 4,789 3,841 3,739 3,285 3,287 18,941
4.1.2 Candidate countries Over the period 20002004, Bulgaria, Croatia, Romania and Turkey have imported very few hunting trophies, reporting a total of eleven species.
Quantities reported by the importers did not exceed ten animals for any of these species.
4.2 Caviar Wildsourced caviar imports from the principal supplying nations are listed in Table 4.2. Some imports arrived via third parties, in particular from Switzerland (1,860 kg) and USA (1,006 kg). Twelve Member States imported caviar.
As in 2003, the main exporting countries were Azerbaijan, Iran, Kazakhstan and the Russian Federation, representing approximately 12%, 69%, 8% and 10% of trade respectively. Caviar imports into the EC showed a further decrease from previous years, with quantities traded 50% less than in 2000 (Fig. 4.1.)
No countries fulfilled their 2004 quotas set on the basis of CITES Resolution Conf. 12.7.
Persian Sturgeon Acipenser persicus was the main species traded for caviar (57% of trade) although it originated only in Iran.
Trade in live captivebred and F1 captiveborn sturgeon for aquaculture remained substantial, with over 86,000 live Sturgeon being imported into the EC from the Russian Federation. Since 2003 imports have declined, although this can mainly be explained by the inclusion of important trader countries into the EC.
Iran also continued to export large quantities of wildsourced sturgeon meat (approximately 20 tonnes) though the numbers were down on 2003. Although Beluga Huso huso represented less than 5% of eggs traded, it accounted for over 95% of the meat trade.

Analysis of the European Community and Candidate Countries Annual Report to CITES
40
Table 4.2. Imports of wildsourced caviar (kg), and exporting countries 2004
Source Azerbaijan Iran Kazakhstan Russian Federation Other # Total
CHORDATA ACTINOPTERYGII ACIPENSERIFORMES Acipenseridae Sturgeon Acipenseriformes spp. 420 245 420
Danube Sturgeon Acipenser gueldenstaedtii 3,065 743 300 2,079 5 6,192
Persian Sturgeon Acipenser persicus 23,773 23,773
Star Sturgeon Acipenser stellatus 1,622 3,386 2,763 1,929 28 9,728
Beluga Huso huso 113 810 132 123 243 1,421
Total (kg) 4,800 29,132 3,195 4,131 521 41,779 # All countries for which trade was <1,000 kg
Figure 4.1. Imports of wildsourced caviar 20002004.
0
10000
20000
30000
40000
50000
60000
70000
80000
90000
2000 2001 2002 2003 2004
No.
impo
rted
(kg)
4.2.2 Candidate countries Turkey imported 99% of the 2,147 kg eggs imported into the four candidate countries; the two main species were Persian Sturgeon Acipenser persicus and Danube Sturgeon Acipenser gueldenstaedtii. Compared with the previous five years, the highest
level of egg imports into the candidate countries were recorded in 2004s. Bulgaria imported 5,000 live Beluga Huso huso from Romania, whilst Romania imported 500 kilograms of meat from Bulgaria.
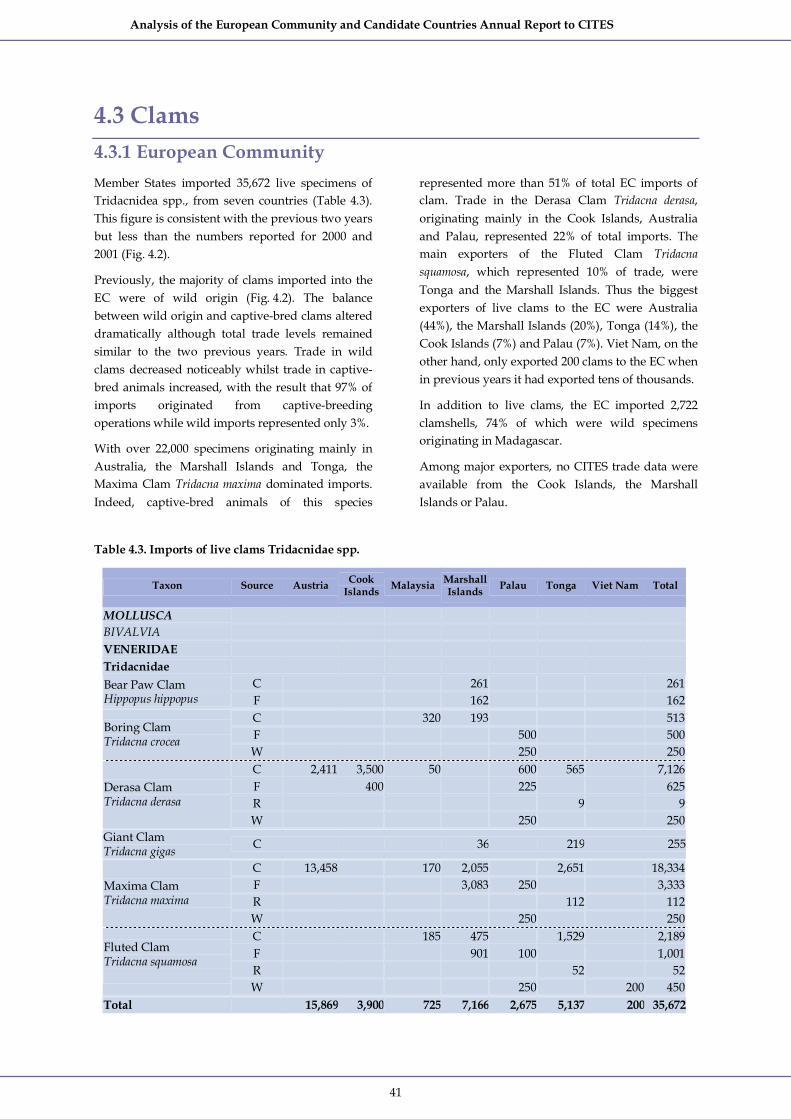
Analysis of the European Community and Candidate Countries Annual Report to CITES
41
4.3 Clams 4.3.1 European Community Member States imported 35,672 live specimens of Tridacnidea spp., from seven countries (Table 4.3). This figure is consistent with the previous two years but less than the numbers reported for 2000 and 2001 (Fig. 4.2).
Previously, the majority of clams imported into the EC were of wild origin (Fig. 4.2). The balance between wild origin and captivebred clams altered dramatically although total trade levels remained similar to the two previous years. Trade in wild clams decreased noticeably whilst trade in captive bred animals increased, with the result that 97% of imports originated from captivebreeding operations while wild imports represented only 3%.
With over 22,000 specimens originating mainly in Australia, the Marshall Islands and Tonga, the Maxima Clam Tridacna maxima dominated imports. Indeed, captivebred animals of this species
represented more than 51% of total EC imports of clam. Trade in the Derasa Clam Tridacna derasa, originating mainly in the Cook Islands, Australia and Palau, represented 22% of total imports. The main exporters of the Fluted Clam Tridacna squamosa, which represented 10% of trade, were Tonga and the Marshall Islands. Thus the biggest exporters of live clams to the EC were Australia (44%), the Marshall Islands (20%), Tonga (14%), the Cook Islands (7%) and Palau (7%). Viet Nam, on the other hand, only exported 200 clams to the EC when in previous years it had exported tens of thousands.
In addition to live clams, the EC imported 2,722 clamshells, 74% of which were wild specimens originating in Madagascar.
Among major exporters, no CITES trade data were available from the Cook Islands, the Marshall Islands or Palau.
Table 4.3. Imports of live clams Tridacnidae spp.
Taxon Source Austria Cook Islands Malaysia Marshall
Islands Palau Tonga Viet Nam Total
MOLLUSCA BIVALVIA VENERIDAE Tridacnidae
C 261 261 Bear Paw Clam Hippopus hippopus F 162 162
C 320 193 513 F 500 500 Boring Clam
Tridacna crocea W 250 250 C 2,411 3,500 50 600 565 7,126 F 400 225 625 R 9 9
Derasa Clam Tridacna derasa
W 250 250 Giant Clam Tridacna gigas C 36 219 255
C 13,458 170 2,055 2,651 18,334 F 3,083 250 3,333 R 112 112
Maxima Clam Tridacna maxima
W 250 250 C 185 475 1,529 2,189 F 901 100 1,001 R 52 52
Fluted Clam Tridacna squamosa
W 250 200 450 Total 15,869 3,900 725 7,166 2,675 5,137 200 35,672

Analysis of the European Community and Candidate Countries Annual Report to CITES
42
Figure 4.2. Quantities and source of imported clams 20002004
0
10000
20000
30000
40000
50000
60000
70000
2000 2001 2002 2003 2004
No.
impo
rted
C F I R W
4.3.2 Candidate countries The only imports of Tridacnidae spp. reported into candidate countries were of illegal source specimens that were imported for the purposes of law enforcement or education.
4.4 Corals The analysis of coral data was complicated by several factors. Some shipments were recorded by weight, some in pieces, and some wrongly recorded as raw coral when in fact they were live coral, or vice versa. There was also the added complication of countries reporting on the basis of permits issued
and others on actual trade, and even countries reporting on a mixture of actual trade and permits issued.
Trade in coral is reported in a variety of terms. The section on conversion factors following the index lists the terms and units converted for the analysis.
4.4.1 European Community Corals are imported into the EC essentially as ‘live’ or ‘raw’ corals. Trade in both these terms is analysed below.
Over the fiveyear period 20002004, total imports of corals, both in units of kilograms and when no units
were reported, have increased from approximately 180,000 kg and 178,000 (no units) in 2000 to 246,000 (kg) and 354,500 (no units) (Figs 4.3 a & b). Ninety species of coral were traded with some transactions being described only to genus level.

Analysis of the European Community and Candidate Countries Annual Report to CITES
43
Figure 4.3a. Imports of ‘raw’ and ‘live’ corals 20002004 (kg)
0
50000
100000
150000
200000
250000
2000 2001 2002 2003 2004
Impo
rts
(kg)
'raw' corals
'live' corals
Figure 4.3b. Imports of ‘raw’ and ‘live’ corals 20002004 (units not specified)
0
100000
200000
300000
400000
2000 2001 2002 2003 2004
Impo
rts
(no
units
)
'raw' corals
'live' corals
Table 4.4 shows EC imports of corals for totals greater than 100 units. The majority of imported live corals were from Indonesia (92%), although imports were also reported from Fiji (6%) and Tonga (1%). Imports from Japan decreased by over 95% when compared to 2003 data.
Imports of raw corals were of similar volume to previous years, remaining below figures reported in 2002. Raw coral was exported in large quantities from Indonesia (48%), Fiji (20%), Japan (17%) and Viet Nam (11%).
The number of units of live and raw corals can be converted to weight, using standard conversion factors (see “Conversion Factors” page 2).
Combining the converted figures (live coral: 38,764 kg; raw: 96,299 kg) and the weights listed in Table 4.4, gives final trade figures for live coral (93 tonnes) and raw coral (288 tonnes).

Analysis of the European Community and Candidate Countries Annual Report to CITES
44
Box 1: The rise in trade of Scleractinia spp.
Imports of live and raw ‘Scleractinia spp.’ increased dramatically from 1995–2004 (Fig. 4.4.).
In 1995 the Member States imported approximately 50,000 kg raw and 270 kg live wildsourced corals. By 2004, trade volumes of wildsourced raw corals had increased by more than four times (to approximately 238,000 kg), and those of live corals had soared to approximately 59,000 kg.
Figure 4.4. Imports of live and raw wildsourced Scleractinia spp. 1995–2004.
0
10000
20000
30000
40000
50000
60000
70000
1995 1996 1997 1998 1999 2000 2001 2002 2003 2004
Impo
rts
of li
ve c
oral
s (k
g)
0
50000
100000
150000
200000
250000
300000
Impo
rts
of ra
w c
oral
s (k
g)
live
raw
The vast majority of live coral imports originated in Indonesia.
Raw corals originated primarily in Indonesia (54%), Fiji (29%) and Viet Nam (16%).
Table 4.4. Imports of corals (per exporting country and for totals greater than 100 units)
Term and Unit live raw corals Exporter
kg no units kg no units Fiji 14,709 69,926 192 Haiti 1,635 Indonesia 54,598 169,888 73,195 99,681 Japan 750 60,000 Marshall Islands 193 Solomon Islands 5,548 Taiwan, Prov. of China 1 610 Tonga 2,434 USA 8 110 7,652 2 Viet Nam 39,099 Total 54,606 188,084 191,508 166,033
4.4.2 Candidate countries Over the period 20002004, Bulgaria, Croatia, Romania and Turkey have traded very few corals.
Numbers reported by both the importers or exporters did not exceed fifteen.

Analysis of the European Community and Candidate Countries Annual Report to CITES
45
4.5 Cacti 4.5.1 European Community Trade in cacti can be divided largely into two groups: 1) Farmed or artificially propagated live cacti and seeds, of AppendixI listed species; 2) Rainsticks. There has also been trade in cactus flowers.
Farmed or artificially propagated live cacti and seeds, of AppendixI species Trade in AppendixI cacti in this group, reported by both the EC and exporting partners is illustrated in Table 4.5.
Some notable discrepancies in import and export figures can be observed. EC Member States as a whole underreported imports by 1,357 live plants and 60,260 seeds compared to numbers reported by exporters. Based on reported figures from exporters, import records into the EC showed a decrease in live specimen trade whilst it increased for seeds.
In 2004, imports of live specimens decreased by approximately 5,000 from the previous year.
The majority of imports originated in Thailand (87%) and the USA (13%). Eleven Member States imported 21 species of live cacti; Astrophytum asterias was the most abundantly traded species (75%).
A total of 60,310 seeds of 58 different species or subspecies of cactus were imported into the EC, none of which accounted for more than 10% of the total import. All but very few of these were exported from the USA (99.9%).
The new Member States accounted for 23% of imports. As with live specimens, the addition of new Member States could explain most of the 30% increase in imported seed, compared with 2003.
Table 4.5. Trade in AppendixI cacti 2004
Live plants Seeds Exporter Quantity reported by
importer Quantity reported by
exporter Quantity reported by
importer Quantity reported by
exporter
Canada 20 Thailand 648 1,751 250 USA 254 8,800 69,290 Total 648 2,005 9,050 69,310
Rainsticks EC imports of AppendixII cacti rainsticks are reported under various terms including stems, dried plants, carvings and timber pieces. These terms are equivalent, in that each represents one rainstick and the different terms have therefore been summed for this analysis.
There are considerable discrepancies in the rainstick trade figures reported by exporting and importing countries (Table 4.6).
Three countries exported rainsticks to the EC: Chile, Kenya and Peru. As in 2003, Chile was the principal exporter making up 76.8% of the overall trade volume. Kenya, for which no trade had been recorded since 2001, made up 19.7% of trade and Peru accounted for the remaining 3.5%.

Analysis of the European Community and Candidate Countries Annual Report to CITES
46
Table 4.6. Imports of rainsticks 2004
Exporter Taxon Importer's reported quantity
Exporter's reported quantity
Echinopsis chiloensis 7,428 6,043 Chile
Eulychnia acida 31,990 52,430 Kenya Opuntia subulata 14,996
Corryocactus brevistylus 1,288 Echinopsis peruviana ssp. puquiensis 930 Peru Echinopsis spp. 450
Total 42,086 73,469 Note: when discrepancies between importer’s and exporter’s quantities occur the highest value was used for analysis.
Cactus flowers In addition to the trade in rainsticks an increase in trade of cactus flowers has been noted for the past three years (Fig. 4.4).
Over the tenyear period 19952004, no trade was reported from 19952001; in 2002 and 2003
approximately 5,000 flowers were imported, increasing to 7,000 in 2004. These originated from Morocco.
Figure 4.4. Imports of cactus flowers, as reported by importers and exporters 19952004
0
1000
2000
3000
4000
5000
6000
7000
8000
1995 1996 1997 1998 1999 2000 2001 2002 2003 2004
Repo
rted
qua
ntiti
es
by importer
by Exporter
4.5.2 Candidate countries Cacti were traded in small quantities by the candidate states, with tens of seeds and a handful of
live specimens being imported into Bulgaria, Croatia, Romania and Turkey.

Analysis of the European Community and Candidate Countries Annual Report to CITES
47
4.6 Orchids 4.6.1 European Community Live artificially propagated or farmed AppendixI orchids Trade in artificially propagated AppendixI species is considered to be AppendixII trade (Article VII: 4). The EC imported 4,510 live, artificially propagated AppendixI listed orchids (source codes A: artificially propagated and D: captive bred) comprising 75 species.
The most traded genus was Paphiopedilum (76% of trade) of which 40% was imported without information on the species involved. The main exporters were Thailand and the USA, accounting for 48% and 24% respectively of total imports (Table 7).
Table 4.7. EC trading partners of live AppendixI orchids.
Exporter Number of species Total
Brazil 3 106 Ecuador 15 347 Malaysia 5 371 Peru 5 42 South Africa 1 6 Switzerland 11 154 Taiwan, Prov. of China 7 219 Thailand 36 2,158 USA 49 1,086 Venezuela 2 21 Total 4,510
Over the period 20002004, imports of AppendixI live artificially propagated orchids increased annually from 1,125 in 2000 to 4,510 in 2004 (Fig. 4.5). Most of the increase was due to increased
imports into old Member States, rather than any impact resulting from trade into the ten new Member States.
Figure 4.5. Imports of AppendixI listed live orchids 20002004 (import data)
0
1000
2000
3000
4000
5000
2000 2001 2002 2003 2004
No.
impo
rted

Analysis of the European Community and Candidate Countries Annual Report to CITES
48
Live wildcollected AppendixII orchids By contrast, over the same period, commercial imports of live wildcollected AppendixII listed orchids were at their lowest in 2004 (Fig. 4.6), with only four countries (Belize, Madagascar, Papua New Guinea and Panama) exporting orchids to the EC, each trading uniquely with one Member State.
The trade between Papua New Guinea and the EC represented 68% of the total annual trade though no specific information on species traded was available.
Figure 4.6. Imports of live wildcollected AppendixII orchids 20002004 (import data)
0
2000
4000
6000
8000
10000
12000
2000 2001 2002 2003 2004
No.
impo
rted
.
Derivatives of AppendixII orchids. Finally, most derivatives of AppendixII orchids for the past five years were exported from China to the EC (99.7% of trade).
Although few units were given, making comparisons difficult, numbers reported by the importer in 2004 indicated a dramatic increase compared with previous years, accounting in one year for over three times the amount reported for the other four years together.
Paphiopedilum esquirolei (© Greg Allikas)
4.6.2 Candidate countries One candidate country reported orchid trade. This was for enforcement purposes.
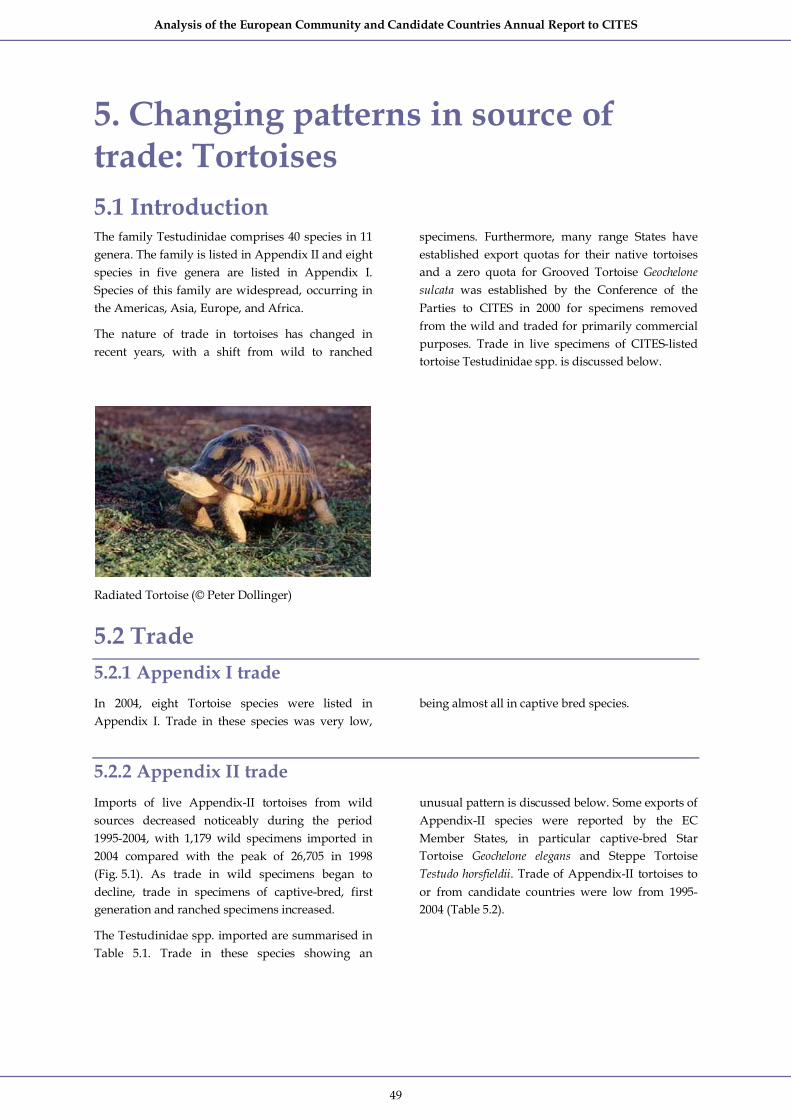
Analysis of the European Community and Candidate Countries Annual Report to CITES
49
5. Changing patterns in source of trade: Tortoises 5.1 Introduction The family Testudinidae comprises 40 species in 11 genera. The family is listed in Appendix II and eight species in five genera are listed in Appendix I. Species of this family are widespread, occurring in the Americas, Asia, Europe, and Africa.
The nature of trade in tortoises has changed in recent years, with a shift from wild to ranched
specimens. Furthermore, many range States have established export quotas for their native tortoises and a zero quota for Grooved Tortoise Geochelone sulcata was established by the Conference of the Parties to CITES in 2000 for specimens removed from the wild and traded for primarily commercial purposes. Trade in live specimens of CITESlisted tortoise Testudinidae spp. is discussed below.
Radiated Tortoise (© Peter Dollinger)
5.2 Trade 5.2.1 Appendix I trade In 2004, eight Tortoise species were listed in Appendix I. Trade in these species was very low,
being almost all in captive bred species.
5.2.2 Appendix II trade Imports of live AppendixII tortoises from wild sources decreased noticeably during the period 19952004, with 1,179 wild specimens imported in 2004 compared with the peak of 26,705 in 1998 (Fig. 5.1). As trade in wild specimens began to decline, trade in specimens of captivebred, first generation and ranched specimens increased.
The Testudinidae spp. imported are summarised in Table 5.1. Trade in these species showing an
unusual pattern is discussed below. Some exports of AppendixII species were reported by the EC Member States, in particular captivebred Star Tortoise Geochelone elegans and Steppe Tortoise Testudo horsfieldii. Trade of AppendixII tortoises to or from candidate countries were low from 1995 2004 (Table 5.2).

Analysis of the European Community and Candidate Countries Annual Report to CITES
50
Figure 5.1. Imports of all live specimens of wildsourced AppendixII tortoises 19952004
0
5000
10000
15000
20000
25000
30000
1994 1995 1996 1997 1998 1999 2000 2001 2002 2003 2004
No.
C
F
R
W
Table 5.1 Imports of live AppendixII Tortoises, sources ‘C’, ’F’ and ‘W’, reported by Member States 19952004
Taxon Source 1995 1996 1997 1998 1999 2000 2001 2002 2003 2004 Total CHORDATA REPTILIA TESTUDINES Testudinidae
C 10 15 10 10 17 62 Angulated Tortoise Chersina angulata W 2 2
C 50 5 73 222 151 530 978 1,290 1,917 2,423 7,639 F 2 65 226 78 15 6 91 483 Redfooted Tortoise
Geochelone carbonaria W 89 254 477 392 478 470 333 198 481 403 3,575 C 10 45 106 122 283 Chaco Tortoise
Geochelone chilensis W 1 1 2 C 8 13 196 51 12 282 40 602 F 12 1 13 Yellowfooted Tortoise
Geochelone denticulate W 123 260 416 411 123 3 10 4 2 1,352 C 11 661 23 589 471 494 2 2,251 F 2 2 26 2 32 Star Tortoise
Geochelone elegans W 450 450 C 2 73 1 14 73 13 10 34 54 65 339 Aldabra Giant Tortoise
Geochelone gigantean F 38 3 10 4 10 75 140 C 19 9 4 15 5 1,856 2,112 650 200 4,870 F 2 7 62 129 105 1,344 1,243 1,716 2,157 6,765 R 580 200 46 30 500 200 1,556
Leopard Tortoise Geochelone pardalis
W 881 1,858 2,625 4,540 5,986 3 1,483 743 1,286 472 19,877 C 107 52 108 167 622 1,454 1,569 1,732 2,702 1,275 9,788 F 10 100 150 816 627 330 299 163 410 329 3,234 R 120 162 144 30 50 506
Grooved Tortoise Geochelone sulcata
W 651 324 111 102 41 2 2 1,233 C 8 6 3 4 21 Areolated Tortoise
Homopus areolatus W 1 1 Speckled Padloper Homopus signatus C 2 2

Analysis of the European Community and Candidate Countries Annual Report to CITES
51
Taxon Source 1995 1996 1997 1998 1999 2000 2001 2002 2003 2004 Total
C 130 2 99 231 Elongated Tortoise Indotestudo elongata W 1,205 1,370 485 510 330 200 98 136 284 4,618
C 3 3 F 76 26 102 Celebes Tortoise
Indotestudo forstenii W 16 108 42 4 10 180 C 75 6 3 84 F 4 11 29 7 26 77 R 480 1,512 515 832 3,110 2,310 2,500 2,048 784 14,091
Bell’s Hinged Tortoise Kinixys belliana
W 97 135 980 3,040 221 300 20 4,793 R 8 99 117 252 4 3 483 Forest Hinged Tortoise
Kinixys erosa W 10 40 16 55 11 1 133 C 50 1 51 R 528 800 286 378 1,056 964 1,173 986 392 6,563 Home’s Hinged Tortoise
Kinixys homeana W 99 20 605 887 134 1,745 F 9 8 87 77 181 Asian Tortoise
Manouria emys W 18 105 12 6 9 150 C 14 14 Impressed Tortoise
Manouria impressa W 8 8 African Tent Tortoise Psammobates tentorius C 4 4
C 1 252 1,872 4,135 2,655 188 9,103 F 2,000 3 80 5,306 3,579 10,968 R 2,000 2,000 4,350 6,000 14,350
Steppe Tortoise Testudo horsfieldii
W 4,000 2,000 1,350 16,289 7,502 2 1 31,144 Testudo spp. W 25 25
Table 5.2 Imports of live Annex B Testudinidae species from sources ‘C’, ’F’ and ‘W’ by candidate countries 19952004.
Taxon Source 1995 1996 1997 1998 1999 2000 2001 2002 2003 2004 Total
CHORDATA REPTILIA TESTUDINES Testudinidae Redfooted Tortoise Geochelone carbonaria W 2 15 1 18
Yellowfooted Tortoise Geochelone denticulate W 15 1 16
Star Tortoise Geochelone elegans C 320 183 503
C 50 28 78 Aldabra Giant Tortoise Geochelone gigantean F 5 5 Grooved Tortoise Geochelone sulcata C 7 7
Home’s Hinged Tortoise Kinixys homeana
R 1 1
Spider Tortoise Pyxis arachnoids W 100 100
Steppe Tortoise Testudo horsfieldii W 2,000 2,000
Total 327 52 318 2,028 3 2,728

Analysis of the European Community and Candidate Countries Annual Report to CITES
52
Redfooted Tortoise
Geochelone carbonaria EC imports of captivebred specimens of Redfooted Tortoise G. carbonaria remained low during the second half of the 1990s, after which there was a steady increase until 2004 (Fig. 5.2)
The vast majority of this trade was for commercial purposes.
Chaco Tortoise Geochelone chilensis Imports from all sources were very low level until 2001, at which time imports of captivebred specimens were reported, increasing steadily until 2004. Trade in captivebred specimens from Uruguay was reported in 2001 and from Argentina
in 2002 onwards, increasing to 100 from Argentina in 2004 with a further 22 from Uruguay. The vast majority of this trade was for commercial purposes.
Yellowfooted Tortoise
Geochelone denticulata Imports of wild specimens of Yellowfooted Tortoise were relatively high until 1998, but they subsequently declined sharply from 1999 and no trade in wild specimens was reported in 2004. A notable increase in the import of captivebred specimens can be seen as trade in wild specimens declined (Fig. 5.3).
Figure 5.2. Imports of Redfooted Tortoise 19952004
0
500
1000
1500
2000
2500
3000
1995 1996 1997 1998 1999 2000 2001 2002 2003 2004
No.
C
F
W
Imports of wild specimens were mostly from Guyana and Suriname, whereas subsequent imports of captivebred specimens were mainly from Peru and, to a lesser extent, Brazil.
Leopard Tortoise Geochelone pardalis Imports of wild specimens of Leopard Tortoise increased steadily from 881 specimens in 1995 to 5,986 specimens in 1999 but declined sharply to three specimens in 2000. In 2001, trade resumed but included significant numbers of captivebred and first generation specimens and much lower numbers of wild specimens than had previously
been reported (Fig. 5.4). The vast majority of this trade both into the EC and elsewhere was for commercial purposes.
Zambia and Mozambique were the two main exporters to the EC up until the year 2000 (Fig. 5.5). The majority of these specimens were from wild sources. Imports from these countries plummeted in 2000, after which time EC trade comprised mostly captivebred specimens from El Salvador, first generation and ranched specimens from Tanzania, and wild specimens from Uganda. Some ranched specimens were imported from Zambia in 2003

Analysis of the European Community and Candidate Countries Annual Report to CITES
53
Figure 5.3 Imports of Yellowfooted Tortoise 19952004
0
50
100
150
200
250
300
350
400
450
1995 1996 1997 1998 1999 2000 2001 2002 2003 2004
No.
C
F
W
Figure 5.4 Imports of Leopard Tortoise 19952004
0
1000
2000
3000
4000
5000
6000
7000
1995 1996 1997 1998 1999 2000 2001 2002 2003 2004
No.
C
F
R
W

Analysis of the European Community and Candidate Countries Annual Report to CITES
54
Figure 5.5. Imports of Leopard Tortoise from the main exporting countries 19952004
0
1000
2000
3000
4000
5000
6000
7000
1995 1997 1999 2001 2003
No.
Zambia
Uganda
Tanzania
Sudan
South Africa
Mozambique
El Salvador
Grooved Tortoise Geochelone sulcata Imports of wild specimens decreased from 651 in 1995, to 41 in 1999 and then to zero in 2000 (Fig. 5.6) following a zero quota for wild specimens that was established by the CITES Conference of the Parties (CoP11, April 2000). A marked increase in imports of captivebred specimens occurred from 1998 until 2003, although imports decreased in 2004.
Imports of wild specimens were primarily from Mali (both direct and via Ghana and Togo), and to a lesser extent Sudan. Imports of ranched specimens were low level and mostly from Benin, Ghana and Togo.
Captivebred specimens were mostly imported from El Salvador, Mali, Ghana and Togo and the USA, while first generation specimens were mostly from the USA. The vast majority of this trade both into the EC and elsewhere was for commercial purposes.
Elongated Tortoise Indotestudo elongata Virtually all trade was in wild specimens, although this trade decreased from 1,370 specimens in 1997 to
284 specimens in 2004 (Fig. 5.7). The vast majority of this trade was for commercial purposes.
Bell’s Hinged Tortoise Kinixys belliana Togo and Benin were the main exporters of Bell’s Hinged Tortoise, accounting for 53% and 27% of EC imports respectively between 19952004. Subsequently in 2000, imports of ranched specimens in Togo increased noticeably (Fig.5.8).
Forest Hinged Tortoise Kinixys erosa Togo and Ghana were the main exporters of Forest Hinged Tortoise, both into the EC and globally, accounting for 67% and 27% of EC imports respectively between 19952004.
Specimens from Togo were mostly from ranching operations whereas the majority of imports from Ghana were from wild sources. Imports of wild specimens ceased in 2000 (Fig. 5.9).

Analysis of the European Community and Candidate Countries Annual Report to CITES
55
Figure 5.6. Imports of Grooved Tortoise 19952004
0
500
1000
1500
2000
2500
3000
1995 1996 1997 1998 1999 2000 2001 2002 2003
No.
C F R W
Figure 5.7. Imports of wildsourced Elongated Tortoise 19952004
0
200
400
600
800
1000
1200
1996 1997 1998 1999 2000 2001 2002 2003 2004
No.
China
Indonesia
Malaysia
Viet Nam
Steppe Tortoise Testudo horsfieldii The majority of trade in wild specimens of Steppe Tortoise was from the Russian Federation (originating in Kazakhstan, the Russian Federation, Tajikistan and Uzbekistan) and Uzbekistan.
Captivebred and firstgeneration specimens were mostly from Ukraine.
Trade in wild specimens ceased in 1999 (Fig. 5.10), following an import suspension for live specimens
from wild sources from all countries of origin. Around this time trade from sources other than wild, namely ‘R’, ‘C’ and ‘F’ was reported for the first time. Trade in ranched specimens in particular has increased steadily since then, with 6,000 specimens imported into the EC in 2004, all from Uzbekistan.
The candidate countries reported the import of 2,000 wild specimens in 2000

Analysis of the European Community and Candidate Countries Annual Report to CITES
56
Figure 5.8. Imports of Bell’s Hinged Tortoise from main countries of import 19952004
0
500
1000
1500
2000
2500
3000
3500
1995 1996 1997 1998 1999 2000 2001 2002 2003 2004
No.
W Togo
W Benin
R Togo
R Benin
C Togo
Figure 5.9. Imports of Forest Hinged Tortoise from main countries of export (Togo and Ghana) 19952004
0
50
100
150
200
250
300
1995 1996 1997 1998 1999 2000 2001 2002 2003 2004
No.
R
W
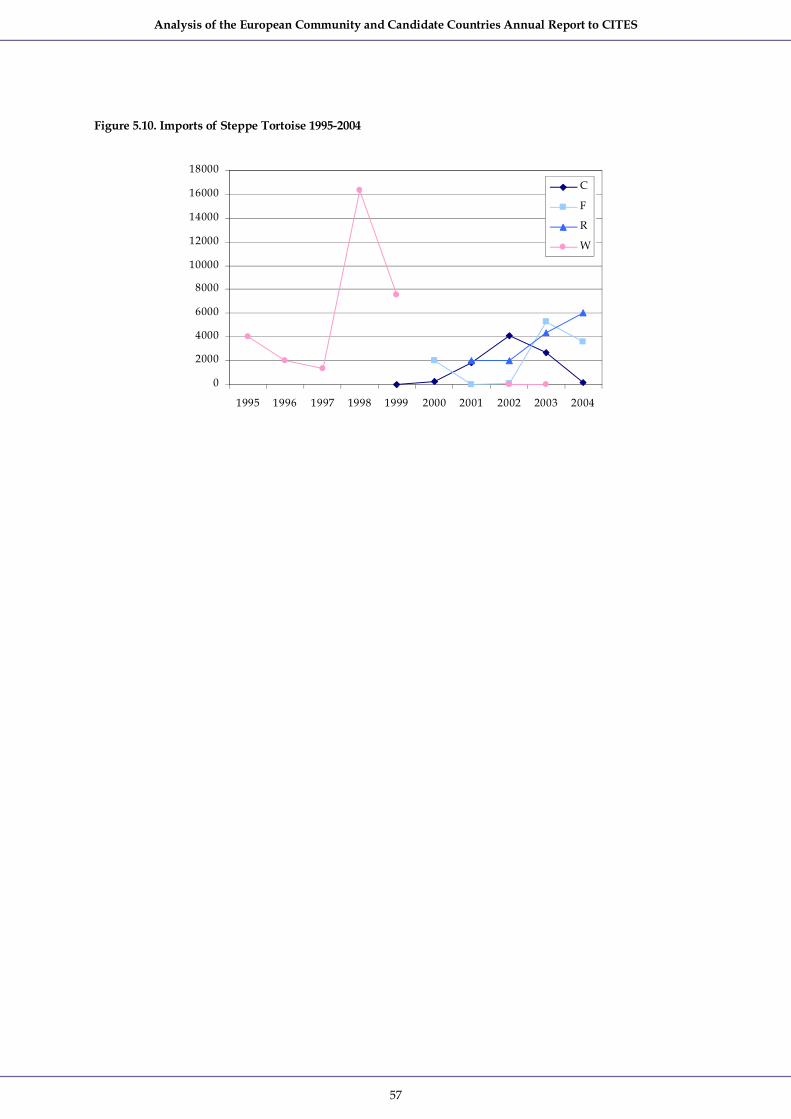
Analysis of the European Community and Candidate Countries Annual Report to CITES
57
Figure 5.10. Imports of Steppe Tortoise 19952004
0
2000
4000
6000
8000
10000
12000
14000
16000
18000
1995 1996 1997 1998 1999 2000 2001 2002 2003 2004
C
F
R
W

Analysis of the European Community and Candidate Countries Annual Report to CITES
58
6. Exports and reexports The EC exports captivebred specimens of many CITESlisted species, and acts as an entrepôt for nonmanufactured parts, products and live specimens imported from producer nations, often former colonies. A small number of EC species are also exported.
A large proportion of EC Member States’ and candidate countries’ exports and reexports of CITESlisted species consisted of articles manufactured from reptile skins. Full global records of this trade are not maintained in the UNEP WCMC CITES database, nor are they required by the CITES Secretariat, as the conservation impact of
this trade is more easily measured through transactions involving the trade in the original skins before the manufacturing process. Trade in reptile skins is therefore not analysed in this document.
The candidate countries export many native species, hunting trophies of Brown Bear Ursus arctos and Grey Wolf Canis lupus, captivebred specimens of many CITESlisted species, and act as entrepôts for parts and products of several species imported from producer nations. The candidate countries also export caviar from species of Acipenseriformes, and Turkey, Medicinal Leech Hirudo medicinalis, Galanthus bulbs and Cyclamen corms.
6.1 Export of wildcollected species In 2004, 195 export transactions involving wild collected species were reported by Member States (43.6%) and the candidate countries (56.4%) (Table 6.1). Trade was reported for the purposes of: ‘breeding in captivity or artificial propagation’, ‘educational’, ‘hunting trophies’, ‘personal’, ‘scientific’ and ‘commercial’ purposes. Trade transactions for scientific, hunting, and commercial purposes were most numerous.
Tables 6.2, 6.3, 6.4 and 6.5 list the Member States’ and candidate countries’ exports of wildcollected native species reported either by the importer or by the exporter.
All exports of wild specimens traded for captive breeding, artificial propagation operations or for educational purposes were reported by the EC.
The largest proportion of EC exports involved ‘scientific’ specimens though the quantities involved were small in terms of global trade in CITESlisted species (Table 6.2).
Brown Bear (© Olivier Peresse)
For candidate countries, the majority of wild collected species exported were for ‘hunting’ or ‘commercial’ purposes. A large proportion of transactions involved hunting trophies, caviar from Acipenseriformes species, and Snowdrop Galanthus bulbs (Table 6.3).
Table 6.1. Summary of the number and purpose of export transactions from Member States and candidate countries
Purpose of trade Exporter Captive breeding
or Art. Prop. Educational Hunting trophies Personal Scientific Commercial
Total
European Community 1 8 5 7 55 9 85
Candidate country 0 0 56 5 7 42 110 Total 1 8 61 12 62 52 195 % total trade 0.5% 4.1% 31.3% 6.2% 31.8% 26.7%

Analysis of the European Community and Candidate Countries Annual Report to CITES
59
Table 6.2. EC direct exports of wildcollected species as reported by the EC
Taxon App. Destination Description Purpose
CHORDATA MAMMALIA CETACEA Ziphiidae Beaked Whales Ziphiidae spp. I/II Canada 3 specimens S Sowerby’s Beaked Whale Mesoplodon bidens II Canada 1 specimen S
Physeteridae Sperm Whale Physeter catodon I USA 100 specimens S Delphinidae Shortbeaked Common Dolphin Delphinus delphis II USA 164 specimens S
Bottlenose Dolphin Tursiops truncates II USA 7 specimens S
Phocoenidae 48 specimens S 987 specimens S Harbour Porpoise
Phocoena phocoena II USA 4 specimens S
Balaenopteridae Fin Whale Balaenoptera physalus I USA 1 specimen S
1 specimen S Humpback Whale Megaptera novaeangliae I USA
1 specimen S CARNIVORA
Mexico 1 skin T 15 teeth S 1 trophy H
Grey Wolf Canis lupus II USA
9 teeth S Ursidae
56 teeth S 2 teeth S 2 teeth S 450 specimens S
USA
140 teeth S
Brown Bear Ursus arctos II
Switzerland 1 trophy H Felidae Wild Cat Felis silvestris II USA 42 specimens S
USA 44 teeth S Norway 1 skin E USA 122 teeth S
Eurasian Lynx Lynx lynx II
Switzerland 7 specimens S Iberian Lynx Lynx pardinus I Switzerland 16 specimens S ARTIODACTYLA Bovidae
Canada 1 trophy H Aoudad Ammotragus lervia II USA 3 trophies H
AVES CICONIIFORMES Threskiornithidae Eurasian Spoonbill Platalea leucorodia II Unknown 1 live B

Analysis of the European Community and Candidate Countries Annual Report to CITES
60
Taxon App. Destination Description Purpose
ANSERIFORMES Anatidae Common Pintail Anas acuta III Norway 50 feathers T Eurasian Wigeon Anas penelope III Norway 100 feathers T FALCONIFORMES Acciptridae
Canada 1 body P Northern Goshawk Accipiter gentiles II
USA 1 live E USA 2 skins S New Zealand 1 body P Eurasian Sparrowhawk
Accipiter nisus II USA 1 body E
Eurasian Buzzard Buteo buteo II USA 1 body S Canada 1 body P Roughlegged Buzzard
Buteo lagopus II USA 1 body S
Red Kite Milvus milvus II USA 37 specimens S Falconidae Merlin Falco columbarius II USA 1 body E
1 body E Eurasian Kestrel Falco tinnunculus II USA 1 live E
STRIGIFORMES Tytonidae Barn Owl Tyto alba II USA 48 specimens S Strigidae Snowy Owl Nyctea scandiaca II USA 1 body T
Rep. of Korea 1 body T Tawny Owl Strix aluco II USA 1 body E
REPTILIA TESTUDINES Cheloniidae
Switzerland 807 specimens S 268 specimens S Loggerhead Turtle
Caretta caretta I Croatia 44 specimens T
ACTINOPTERYGII SYNGNATHIFORMES Syngnathidae Longsnouted Seahorse Hippocampus guttulatus II Canada 1,700 live S
FLORA Orchidaceae Orchis papilionacea II Switzerland 1 flower S Barlia robertiana II Switzerland 1 flower S Ophrys iricolor II Switzerland 1 flower S Aceras anthropophorum II Switzerland 1 flower S Orchis italica II Switzerland 1 flower S Orchis quadripunctata II Switzerland 1 flower S Orchis simia II Switzerland 1 flower S
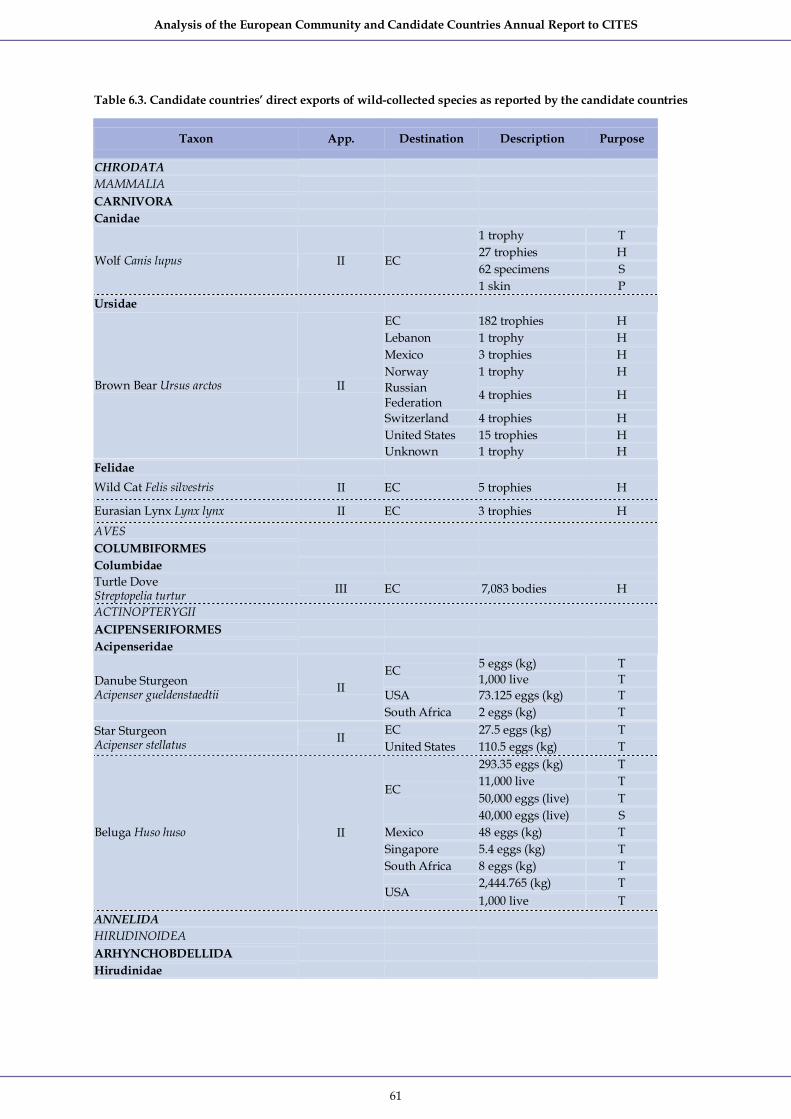
Analysis of the European Community and Candidate Countries Annual Report to CITES
61
Table 6.3. Candidate countries’ direct exports of wildcollected species as reported by the candidate countries
Taxon App. Destination Description Purpose
CHRODATA MAMMALIA CARNIVORA Canidae
1 trophy T 27 trophies H 62 specimens S
Wolf Canis lupus II EC
1 skin P Ursidae
EC 182 trophies H Lebanon 1 trophy H Mexico 3 trophies H Norway 1 trophy H Russian Federation 4 trophies H
Switzerland 4 trophies H United States 15 trophies H
Brown Bear Ursus arctos II
Unknown 1 trophy H Felidae Wild Cat Felis silvestris II EC 5 trophies H
Eurasian Lynx Lynx lynx II EC 3 trophies H AVES COLUMBIFORMES Columbidae Turtle Dove Streptopelia turtur III EC 7,083 bodies H
ACTINOPTERYGII ACIPENSERIFORMES Acipenseridae
5 eggs (kg) T EC 1,000 live T
USA 73.125 eggs (kg) T Danube Sturgeon Acipenser gueldenstaedtii II
South Africa 2 eggs (kg) T EC 27.5 eggs (kg) T Star Sturgeon
Acipenser stellatus II United States 110.5 eggs (kg) T
293.35 eggs (kg) T 11,000 live T 50,000 eggs (live) T
EC
40,000 eggs (live) S Mexico 48 eggs (kg) T Singapore 5.4 eggs (kg) T South Africa 8 eggs (kg) T
2,444.765 (kg) T
Beluga Huso huso II
USA 1,000 live T
ANNELIDA HIRUDINOIDEA ARHYNCHOBDELLIDA Hirudinidae

Analysis of the European Community and Candidate Countries Annual Report to CITES
62
Taxon App. Destination Description Purpose
2,792 live (kg) T EC
2,508 bodies (kg) T Medicinal Leech Hirudo medicinalis II
Israel 1 live (kg) T FLORA Amaryllidaceae
EC 5,134,600 live T Snowdrop Galanthus elwesii II Switzerland 95,000 live T EC 1,975,000live T Snowdrop Galanthus woronowii II Switzerland 25,000 live T
Primulaceae Cyclamen Cyclamen cilicium II EC 250,000 live T
EC 296,000 live T Cyclamen Cyclamen coum II Switzerland 4,000 live T EC 996,500live T Cyclamen
Cyclamen hederifolium II Switzerland 3,500 live T EC 100 dried plants S Cyclamen
Cyclamen intaminatum II EC 75 live S EC 100 dried plants S Cyclamen
Cyclamen mirabile II EC 75 live S
Ranunculaceae Pheasant’s Eye Adonis vernalis II EC 5,440 roots (kg) T
Table 6.4. EC exports of wildcollected range State species as reported by the importing country only
Taxon App. Destination Description Purpose CHORDATA MAMMALIA CETACEA Delphinidae Bottlenose Dolphin Tursiops truncates II USA 1 specimen S Phocoenidae Harbour Porpoise Phocoena phocoena II Australia 10 specimens (kg) S AVES ANSERIFORMES Anatidae Common Teal Anas crecca III USA 1 trophy H Garganey Anas querquedula III USA 1 specimen S FALCONIFORMES Pandionidae Osprey Pandion haliaetus II USA 0.001 specimen (kg) S Accipitridae Golden Eagle Aquila chrysaetos II USA 3 specimens S Eurasian Buzzard Buteo buteo II USA 1 specimen S Roughlegged Buzzard Buteo lagopus II USA 1 specimen S Whitetailed Eagle Haliaeetus albicilla I USA 1 specimen S Falconidae Peregrine Falcon Falco peregrinus I USA 1 specimen S COLUMBIFORMES Columbidae

Analysis of the European Community and Candidate Countries Annual Report to CITES
63
Taxon App. Destination Description Purpose USA 10 bodies T Rock Pigeon Columba livia III USA 5 extract S
STRIGIFORMES Strigidae Eurasian Scopsowl Otus scops II USA 1 specimen P Tawny Owl Strix aluco II USA 1 specimen S ACIPENSERIFORMES Sturgeon Acipenseriformes spp. II USA 4.087 eggs (kg) P
Acipenseridae Sturgeon Acipenser spp. II USA 0.226 eggs (kg) P CNIDARIA ANTHOZOA SCLERACTINIA Scleractinia spp. II New Zealand 14 raw corals T Oculinidae Madrepora oculata II USA 4 specimens S Caryophyllidae Lophelia pertusa II USA 4 specimens S
Table 6.5. Candidate countries’ exports of wildcollected species as reported by the importing country only
Taxon App. Destination Description Purpose CHORDATA MAMMALIA CARNIVORA Canidae Wolf Canis lupus II EC 1 trophy H Ursidae
8 skins P 3 skins H 8 skulls P
EC
3 skulls H Brown Bear Ursus arctos II
USA 1 skull H AVES FALCONIFORMES Falconidae Saker Falcon Falco cherrug II Saudi Arabia 22 live P COLUMBIFORMES Columbidae Turtle Dove Streptopelia turtur III EC 806 bodies P
ANNELIDA HIRUDINOIDEA ARHYNCHOBDELLIDA Hirudinidae Medicinal Leech Hirudo medicinalis II EC 5,000 live S
FLORA Ranunculaceae Pheasant’s Eye Adonis vernalis II EC 5,384 dried plants (kg) T

Analysis of the European Community and Candidate Countries Annual Report to CITES
64
6.2 High Volume net exports and reexports An overview of net exports arranged by group categories is given for the Member States (Table 6.6) and candidate countries (Table 6.8).
Table 6.7 and Table 6.9 list species for which the Member States and candidate countries reported net exports were in excess of 1,000 units, together with the corresponding net exports reported in 2002 and 2003 (the trade has been calculated using net export figures, which take into account trade reported by both Parties to any given trading relationship, using the larger figure where the quantities do not agree).
Positive net exports for some species, when exporters’ reported numbers are greater than importer’s ones, may be due to corresponding import records being listed under similar species or different source, purpose or term codes. Where possible corresponding records can be identified, the record is discussed below.
Within the EC, transactions that exceeded 1,000 units were recorded for 16 mammal, 25 bird, 16 reptile, one amphibian, nine fish, seven invertebrate, 24 plant and four timber taxa. Many of these were in effect reexports of nonnative species.
Table 6.6. Summary of net exports (exceeding 1,000 units) from the EC
Group Term Units Net exports
cloth (m) 2,102 hair 38,003 hair products 103,638 ivory carvings 5,913 skins 30,513
Mammals
specimens 187,114 feathers 6,922 feathers (kg) 556,793 Birds live 77,832 live 19,075 meat (kg) 2,930 skin pieces 624,106 skins 374,226 small leather products 3,273 specimens 1,139
Reptiles
tails 12,393 Amphibians live 1,310
bodies 1,700 bodies (kg) 10,103 egg (live) 6,678,000 eggs 1,132,000 eggs (kg) 40,761 live 83,995
Fish
meat (kg) 13,105 live 163,038 raw corals 9,944 raw corals (kg) 4,361
Invertebrates
shells 14,351 dried plants (kg) 2,516 extract (kg) 37,173 extract (l) 9,260 live 2,584,503 roots (kg) 2,326 seeds 14,430
Plants (not timber)
timber (kg) 2,457
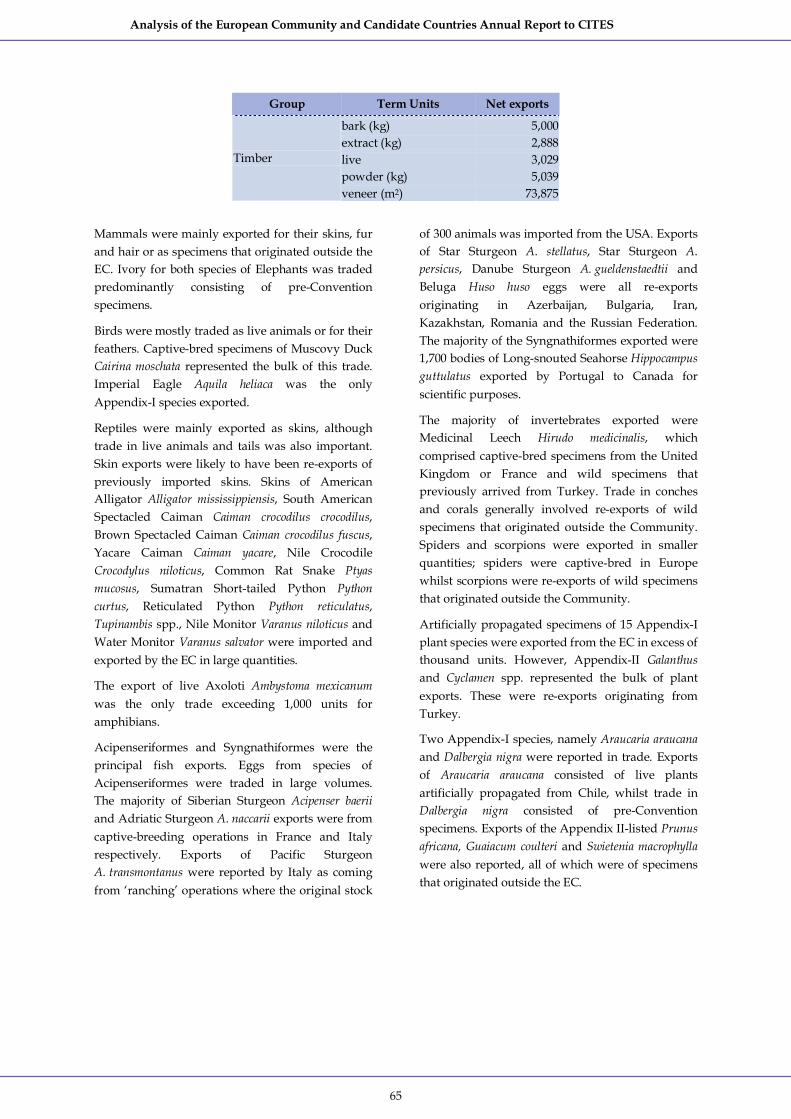
Analysis of the European Community and Candidate Countries Annual Report to CITES
65
Group Term Units Net exports
bark (kg) 5,000 extract (kg) 2,888 live 3,029 powder (kg) 5,039
Timber
veneer (m 2 ) 73,875
Mammals were mainly exported for their skins, fur and hair or as specimens that originated outside the EC. Ivory for both species of Elephants was traded predominantly consisting of preConvention specimens.
Birds were mostly traded as live animals or for their feathers. Captivebred specimens of Muscovy Duck Cairina moschata represented the bulk of this trade. Imperial Eagle Aquila heliaca was the only AppendixI species exported.
Reptiles were mainly exported as skins, although trade in live animals and tails was also important. Skin exports were likely to have been reexports of previously imported skins. Skins of American Alligator Alligator mississippiensis, South American Spectacled Caiman Caiman crocodilus crocodilus, Brown Spectacled Caiman Caiman crocodilus fuscus, Yacare Caiman Caiman yacare, Nile Crocodile Crocodylus niloticus, Common Rat Snake Ptyas mucosus, Sumatran Shorttailed Python Python curtus, Reticulated Python Python reticulatus, Tupinambis spp., Nile Monitor Varanus niloticus and Water Monitor Varanus salvator were imported and exported by the EC in large quantities.
The export of live Axoloti Ambystoma mexicanum was the only trade exceeding 1,000 units for amphibians.
Acipenseriformes and Syngnathiformes were the principal fish exports. Eggs from species of Acipenseriformes were traded in large volumes. The majority of Siberian Sturgeon Acipenser baerii and Adriatic Sturgeon A. naccarii exports were from captivebreeding operations in France and Italy respectively. Exports of Pacific Sturgeon A. transmontanus were reported by Italy as coming from ‘ranching’ operations where the original stock
of 300 animals was imported from the USA. Exports of Star Sturgeon A. stellatus, Star Sturgeon A. persicus, Danube Sturgeon A. gueldenstaedtii and Beluga Huso huso eggs were all reexports originating in Azerbaijan, Bulgaria, Iran, Kazakhstan, Romania and the Russian Federation. The majority of the Syngnathiformes exported were 1,700 bodies of Longsnouted Seahorse Hippocampus guttulatus exported by Portugal to Canada for scientific purposes.
The majority of invertebrates exported were Medicinal Leech Hirudo medicinalis, which comprised captivebred specimens from the United Kingdom or France and wild specimens that previously arrived from Turkey. Trade in conches and corals generally involved reexports of wild specimens that originated outside the Community. Spiders and scorpions were exported in smaller quantities; spiders were captivebred in Europe whilst scorpions were reexports of wild specimens that originated outside the Community.
Artificially propagated specimens of 15 AppendixI plant species were exported from the EC in excess of thousand units. However, AppendixII Galanthus and Cyclamen spp. represented the bulk of plant exports. These were reexports originating from Turkey.
Two AppendixI species, namely Araucaria araucana and Dalbergia nigra were reported in trade. Exports of Araucaria araucana consisted of live plants artificially propagated from Chile, whilst trade in Dalbergia nigra consisted of preConvention specimens. Exports of the Appendix IIlisted Prunus africana, Guaiacum coulteri and Swietenia macrophylla were also reported, all of which were of specimens that originated outside the EC.

Analysis of the European Community and Candidate Countries Annual Report to CITES
66
Table 6.7. Species for which EC net exports exceed 1,000 units
Taxon App. Term Units 2002 2003 2004 CHORDATA MAMMALIA PRIMATES Callitrichidae Common Marmoset Callithrix jacchus II specimens 5,840 4,012 21,064 Cercopithecidae Vervet Monkey Chlorocebus aethiops II specimens 8,882 33,380 58,271 Crabeating Macaque Macaca fascicularis II specimens 82,151 85,129 101,640 Rhesus Macaque Macaca mulatta II specimens 12,358 5,732 5,100 CETACEA Phocidae Harbour Porpoise Phocoena phocoena II specimens 1,039 CARNIVORA Canidae Argentine Grey Fox Pseudalopex griseus II skins 4,403 22,967 6,374 Mustelidae
hair 636,075 81,585 26,146 hair (kg) 3,288 28,121 10,295 Siberian Weasel Mustela sibirica II hair products 129,177 144,595 103,638
Felidae Bobcat Lynx rufus II skins 3,691 8,105 3,354 Leopard Cat Prionailurus bengalensis I/II skins 2,947 3,619 2,171 Otariidae Cape Fur Seal Arctocephalus pusillus II skins 16,346 2,196 5,964 PROBOSCIDAE Elephantidae Indian Elephant Elephas maximus I ivory carvings 403 380 1,541 African Elephant Loxodonta africana I ivory carvings 3,258 3,972 4,372 PERISSODACTYLA Tapiridae Collared Peccary Pecari tajacu II skins 14,573 14,819 8,217 Whitelipped Peccary Tayassu pecari II skins 476 960 4,433 ARTIODACTYLA Camelidae Guanaco Lama guanicoe II hair (kg) 465 67 1,562 Vicugna Vicugna vicugna I/II cloth (m) 872 1,546 2,102 AVES ANSERIFORMES Anatidae Muscovy Duck Cairina moschata III feathers (kg) 1,181,582 789,739 556,793 FALCONIFORMES Accipitridae Imperial Eagle Aquila heliaca I feathers 50 3,321 Falconidae Falco hybrid I live 1,243 2,070 2,556 GALLIFORMES Phasianidae Grey Junglefowl Gallus sonneratii II feathers 9,306 38,473 3,601 COLUMBIFORMES Columbidae Rock Pigeon Columba livia III live 73 7,981 8,318

Analysis of the European Community and Candidate Countries Annual Report to CITES
67
Taxon App. Term Units 2002 2003 2004
PSITTACIFORMES Psittacidae Fischer’s Lovebird Agapornis fischeri II live 7,166 4,694 2,544 Masked Lovebird Agapornis personatus II live 10,047 5,048 2,392 Peachedfaced Lovebird Agapornis roseicollis II live 12,120 9,780 5,910
Barred Parakeet Bolborhynchus lineola II live 2,020 3,414 3,762 Yellowcrowned Parakeet Cyanoramphus auriceps II live 1,585 987 2,196
Celestial Parakeet Forpus coelestis II live 3,377 5,298 5,059 Greybreasted Parakeet Myiopsitta monachus II live 547 852 1,473
Turquoise Parrot Neophema pulchella II live 1,616 1,649 1,664 Bourke’s Parrot Neopsephotus bourkii II live 2,259 1,904 2,086 Crimson Rosella Platycercus elegans II live 3,602 4,385 3,925 Goldenmantled Rosella Platycercus eximius II live 10,666 13,982 9,839
Redrumped Parrot Psephotus haematonotus II live 9,805 12,795 9,400 Ringednecked Parakeet Psittacula krameri III live 5,570 4,411 2,210 Grey Parrot Psittacus erithacus II live 2,213 1,829 1,528 Fringillidae Grey Singing Finch Serinus leucopygius III live 2,920 104 2,548 Green Singing Finch Serinus mozambicus III live 8,449 2,070 5,201 Estrildidae Goldenbreasted Waxbill Amandava subflava III live 1,490 774 1,220
Orangecheeked Waxbill Estrilda melpoda III live 1,984 570 1,411 Redbilled Firefinch Lagonosticta senegala III live 930 120 1,404 Java Sparrow Padda oryzivora II live 1,992 2,377 1,186 REPTILIA TESTUDINES Testudinidae Hermann’s Tortoise Testudo hermanni II live 12,015 11,184 5,889 Cheloniidae Loggerhead Turtle Caretta caretta I specimens 444 520 1,139 CROCODYLIA Alligatoridae
skin pieces 112,778 158,341 287,942 skins 44,021 50,802 81,284 small leather products 2,091
American Alligator Alligator mississippiensis II
tails 1,234 1,457 3,133 skin pieces 7,221 8,806 42,292 skins 862 4,879 31,360 South American Spectacled Caiman
Caiman crocodilus crocodilus II tails 7,760 skin pieces 168,549 189,952 158,138 Brown Spectacled Caiman
Caiman crocodilus fuscus II skins 9,787 6,168 6,943 skin pieces 1,117 2,681 3,995 skins 117 1,824 3,626 Yacare Caiman Caiman yacare II tails 1,500
Crocodylidae meat (kg) 600 510 2,930 skin pieces 15,368 10,463 4,419
Nile Crocodile Crocodylus niloticus I/II
skins 4,732 5,285 3,343

Analysis of the European Community and Candidate Countries Annual Report to CITES
68
Taxon App. Term Units 2002 2003 2004 small leather products 151 533 1,182
SAURIA Chamaeleonidae Veiled Chameleon Chamaeleo calyptratus II live 11,492 14,295 10,534 Iguanidae Green Iguana Iguana iguana II live 2,329 1,986 1,651 Teiidae
skin pieces 2,223 8,095 21,498 Argentine Black and White Tegu Tupinambis merianae II
skins 11,395 11,587 23,816 skin pieces 9,188 12,423 13,445 Red Tegu Tupinambis rufescens II skins 6,445 4,349 1,779
Banded Tegu Tupinambis teguixin II skin pieces 10,421 8,231 5,549 Varanidae
live 1,001 skin pieces 146,058 70,435 45,801 Nile Monitor Varanus niloticus II Skins 56,734 58,695 47,212
skin pieces 951 4,488 7,631 Water Monitor Varanus salvator II skins 3,613 2,447 9,718
SERPENTES Pythonidae
skin pieces 576 1,159 1,254 Sumatran Shorttailed Python Python curtus II
skins 1,878 4,747 9,248 Indian Python Python molurus bivittatus II skins 828 3,003 1,949
skin pieces 6,635 5,734 25,953 Reticulated Python Python reticulatus II skins 21,802 13,515 31,921
Boidae Yellow Anaconda Eunectes notaeus II skin pieces 2,966 Colubridae
skin pieces 3,223 Common Rat Snake Ptyas mucosus II skins 57,116 3,912 122,028
AMPHIBIA CAUDATA Ambystomidae Axoloti Ambystoma mexicanum II live 2,158 5,175 1,310 ACIPENSERIFORMES Acipenseridae Acipenser hybrid II egg (live) 400,000
bodies (kg) 10,103 egg (live) 2,520,000 1,389,000 6,118,000 eggs 60,075 289,060 1,132,000 eggs (kg) 1,015 1,251 6,436 live 1,725,460 2,588,811 19,350
Siberian Sturgeon Acipenser baerii II
meat (kg) 965 1,871 10,934 egg (live) 35,000 eggs (kg) 2,315 3,672 3,940 Danube Sturgeon Acipenser gueldenstaedtii II live 12,106
Persian Sturgeon Acipenser persicus II eggs (kg) 10,266 11,579 19,334 egg (live) 125,000 Sterlet Sturgeon Acipenser ruthenus II live 58,650 16,158 49,399 eggs (kg) 4,003 4,602 5,937 Star Sturgeon Acipenser stellatus II live 1,440

Analysis of the European Community and Candidate Countries Annual Report to CITES
69
Taxon App. Term Units 2002 2003 2004
eggs (kg) 667 1,580 3,666 Pacific Sturgeon icipenser transmontanus II meat (kg) 1,983 2,700 2,171
Beluga Huso huso II eggs (kg) 1,923 1,372 1,448 ACTINOPTERYGII SYNGNATHIFORMES Syngnathidae
bodies 1,700 Longsnouted Seahorse Hippocampus guttulatus II
live 1,700 ARTHROPODA ARACHNIDA ARANEAE Theraphosidae Mexican Redlegged Tarantula Brachypelma emilia II live 460 41 1,560
Mexican Redknee Tarantula Brachypelma smithi II live 542 6,614 1,611
SCORPIONES Scorpionidae Emperor Scorpion Pandinus imperator II live 50 165 1,078 ANNELIDA HIRUDINOIDEA ARHYNCHOBDELLIDA Hirudinidae Medicinal Leech Hirudo medicinalis II live 249,976 123,137 158,789 GASTROPODA NEOTAENIOGLOSSA Strombidae Pink Conch Strombus gigas II shells 1,686 400 14,351 CNIDARIA ANTHOZOA ANTIPATHARIA Antipathidae Cirrhipathes anguina II raw corals 2,938 SCLERACTINIA
raw corals 245 243 7,006 Scleractinia spp. II
raw corals (kg) 12,201 5,740 4,362 FLORA Amaryllidaceae Galanthus elwesii II live 1,294,405 1,545,886 1,675,775 Galanthus nivalis II live 108,664 Galanthus woronowii II live 237,940 411,120 515,879 Araucariaceae Araucaria araucana I live 3,029 Cactaceae Ariocarpus agavoides I seeds 1,000 1,840 1,140 Discocactus horstii I seeds 270 145 1,130 Pelecyphora aselliformis I seeds 20 1,100 Pelecyphora strobiliformis I seeds 1,020 1,870 2,000 Strombocactus disciformis I seeds 70 120 1,050 Turbinicarpus spp. I seeds 530 1,015 1,800 Turbinicarpus bonatzii I seeds 130 1,000 Turbinicarpus lophophoroides I seeds 1,000 150 1,010 Turbinicarpus schmiedickeanus ssp. I seeds 1,000 1,000

Analysis of the European Community and Candidate Countries Annual Report to CITES
70
Taxon App. Term Units 2002 2003 2004 klinkerianus Turbinicarpus schmiedickeanus ssp. schwarzii I seeds 1,100 2,200 Turbinicarpus subterraneus I seeds 90 1,000 Compositae Saussurea costus I roots (kg) 1,624 1,564 2,327 Cyatheaceae Cyathea cooperi II live 12,900 Euphorbiaceae Euphorbia cremersii I live 3,061 Leguminosae Dalbergia nigra I veneer (m 2 ) 44,644 Liliaceae
dried plants (kg) 3,191 6,021 2,516 extract (kg) 56,997 36,711 37,173 Aloe ferox II extract (l) 9,260
Aloe haworthioides I live 11 39 1,206 Meliaceae Swietenia macrophylla II veneer (m 2 ) 30,032 33,616 29,231 Orchidaceae Paphiopedilum spp. I live 19,701 20,876 14,049 Primulaceae Cyclamen cilicium II live 47,425 38,677 42,333 Cyclamen coum II live 18,805 35,292 27,190 Cyclamen hederifolium II live 196,610 185,712 183,446 Rosaceae
bark (kg) 5,000 extract (kg) 2,693 2,787 2,889 Prunus africana II powder (kg) 5,039
Zygophyllaceae Guaiacum coulteri II timber (kg) 2,457
Export transactions from candidate countries that exceeded 1,000 units were recorded for one bird, two reptile, four fish, one invertebrate and six plant
taxa. A summary of these exports is provided in Table 6.8.
Table 6.8. Summary of net export (exceeding 1,000 units) for candidate countries for the different groups
Group Term Units Net exports Birds bodies 7,083
live 2,050 Reptiles skin pieces 3,035 egg (live) 90,000 eggs (kg) 3,920 Fish live 39,185 bodies (kg) 2,902 live 10,000 Invertebrates live (kg) 2,793 dried plants (kg) 5,384 live 23,350,000 Plants roots (kg) 5,440

Analysis of the European Community and Candidate Countries Annual Report to CITES
71
Specimens of the Appendix IIIlisted bird Turtle Dove Streptopelia turtur were exported as hunting trophies.
Exports of Greek Tortoise Testudo graeca involved captivebred specimens, whilst exports of Python skin pieces were mostly reexports of wild snakes originating in Indonesia. Exports of three species of sturgeon were reported, either as eggs or live fishes. These species are native to candidate countries, and some of the specimens in trade were wildtaken
while others were bred in captivity. Specimens of Paddlefish Polyodon spathula were bred in captivity.
Turkey exported wildsourced Medicinal Leech Hirudo medicinalis.
There were two species of wildsourced Galanthus and three species of Cyclamen exported by Turkey. Exports of wild source Pheasant’s Eye Adonis vernalis from Romania were reported, with no trade in this species from that country previously reported.
Table 6.9. Species for which candidate countries’ net export exceeded 1,000 units
Taxon App. Term Units 2002 2003 2004 CHORDATA AVES COLUMBIFORMES Columbidae Turtle Dove Streptopelia turtur III bodies 2,450 6,833 7,083 REPTILIA TESTUDINES Testudinidae Greek Tortoise Testudo graeca II live 52 651 2,050 SERPENTES Pythonidae Reticulated Python Python reticulatus II skin pieces 3,035 ACTINOPTERYGII ACIPENSERIFORMES Acipenseridae Danube Sturgeon Acipenser gueldenstaedtii II live 11,085 Persian Sturgeon Acipenser persicus II eggs (kg) 0 1,008
egg (live) 90,000 eggs (kg) 4,832 3,718 2,913 Beluga Huso huso II live 13,100
Polyodontidae Paddlefish Polyodon spathula II live 290,000 400,000 15,000 ANNELIDA HIRUDINOIDEA ARHYNCHOBDELLIDA Hirudinidae
bodies (kg) 1,550 4,927 2,902 live 4,500 8,240 10,000 Medicinal Leech Hirudo medicinalis II live (kg) 2,275 1,713 2,793
FLORA Amaryllidaceae Galanthus elwesii II live 5,976,530 5,650,000 5,700,000 Galanthus woronowii II live 10,090,000 16,092,000 16,100,000 Primulaceae Cyclamen cilicium II live 239,500 250,000 250,000 Cyclamen coum II live 300,000 300,000 300,000 Cyclamen hederifolium II live 1,275,000 1,250,050 1,000,000 Ranunculaceae
dried plants (kg) 5,384 Pheasant’s Eye Adonis vernalis II roots (kg) 5,440

Analysis of the European Community and Candidate Countries Annual Report to CITES
72
7. Trade in nonCITES species The Wildlife Trade Regulations (Article 3) provide for the control of trade in CITESlisted species and some additional species. Such species may be listed in Annexes A, B and D. Annex D listing simply allows trade to be monitored.
EC trading partners are under no obligation to report trade in these species, hence monitoring of this trade is dependent on reporting by Member States.
7.1 Annex A species NonCITESlisted species may be included in Annex A if it is determined that any level of trade would imperil the survival of the species. They may also be listed if most species in a genus are listed in Annex A, and listing of the remaining species and subspecies in the genus is considered essential for the effective protection of the endangered taxa.
The EC did not report any trade in the 11 animal nonCITES species listed in Annex A. In fact, the EC has not reported any trade of nonCITES species listed in Annex A to date.
7.2 Annex B species Species may be listed in Annex B if they are not listed in the CITES Appendices for several reasons:
• if it is determined that levels of international trade may not be compatible with the survival of the species or its populations in specific countries or with the maintenance of the population at a level consistent with its role in the relevant ecosystem;
• where listing is essential for effective control of species already listed in Annex A or B due to similarities in appearance; or
• where it has been established that introduction of live specimens into the natural habitat of the Community constitutes an ecological threat.
Over the period 19992004, imports of Annex B non CITES species decreased noticeably, mainly due to a decrease in trade in live specimens of Redeared Slider Trachemys scripta elegans. As well as trade in live specimens, imports of eggs were also reported for the first time for this species. The main exporter
of Redeared Sliders remained the USA. Imports of Common Sliders Trachemys scripta were mainly captivebred specimens from Canada that were imported for scientific purposes.
All trade in American Bullfrog Rana catesbeiana was of skins, a term not previously reported. The source of these specimens was either unknown or from ranching activities and imports were for commercial trade. No live specimens or bodies of this species were imported.
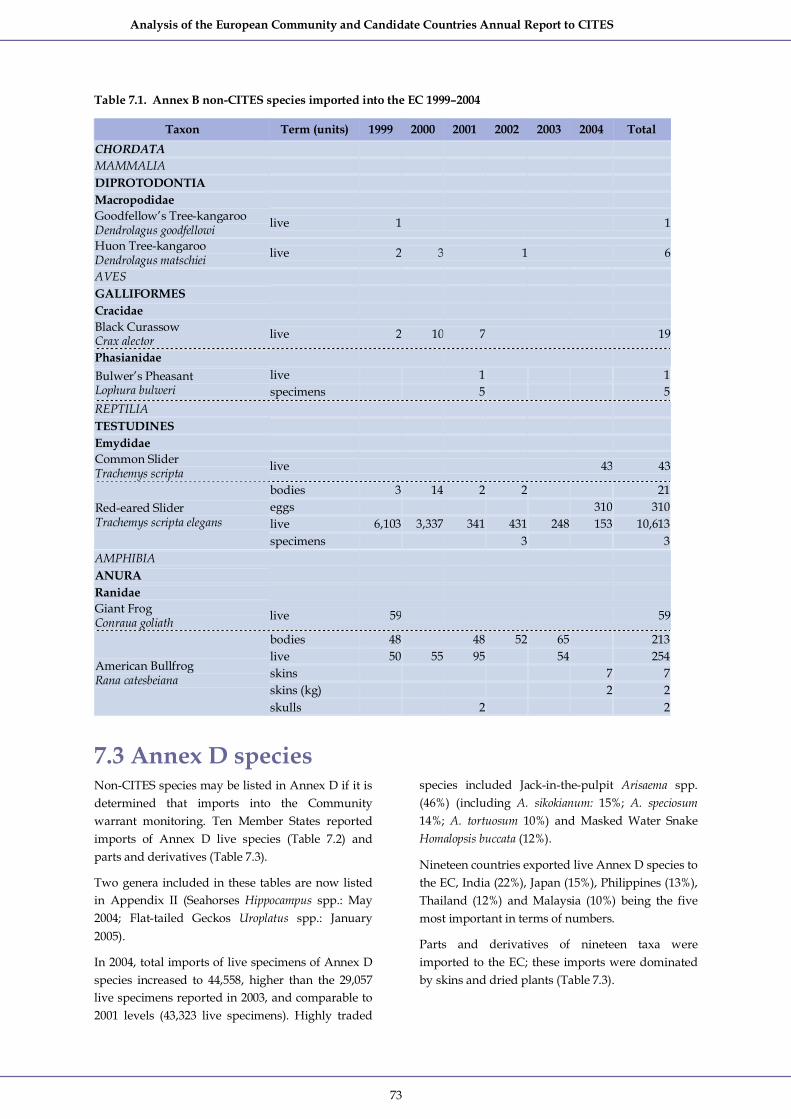
Analysis of the European Community and Candidate Countries Annual Report to CITES
73
Table 7.1. Annex B nonCITES species imported into the EC 1999–2004
Taxon Term (units) 1999 2000 2001 2002 2003 2004 Total CHORDATA MAMMALIA DIPROTODONTIA Macropodidae Goodfellow’s Treekangaroo Dendrolagus goodfellowi live 1 1
Huon Treekangaroo Dendrolagus matschiei live 2 3 1 6
AVES GALLIFORMES Cracidae Black Curassow Crax alector live 2 10 7 19
Phasianidae live 1 1 Bulwer’s Pheasant
Lophura bulweri specimens 5 5 REPTILIA TESTUDINES Emydidae Common Slider Trachemys scripta live 43 43
bodies 3 14 2 2 21 eggs 310 310 live 6,103 3,337 341 431 248 153 10,613
Redeared Slider Trachemys scripta elegans
specimens 3 3 AMPHIBIA ANURA Ranidae Giant Frog Conraua goliath live 59 59
bodies 48 48 52 65 213 live 50 55 95 54 254 skins 7 7 skins (kg) 2 2
American Bullfrog Rana catesbeiana
skulls 2 2
7.3 Annex D species NonCITES species may be listed in Annex D if it is determined that imports into the Community warrant monitoring. Ten Member States reported imports of Annex D live species (Table 7.2) and parts and derivatives (Table 7.3).
Two genera included in these tables are now listed in Appendix II (Seahorses Hippocampus spp.: May 2004; Flattailed Geckos Uroplatus spp.: January 2005).
In 2004, total imports of live specimens of Annex D species increased to 44,558, higher than the 29,057 live specimens reported in 2003, and comparable to 2001 levels (43,323 live specimens). Highly traded
species included Jackinthepulpit Arisaema spp. (46%) (including A. sikokianum: 15%; A. speciosum 14%; A. tortuosum 10%) and Masked Water Snake Homalopsis buccata (12%).
Nineteen countries exported live Annex D species to the EC, India (22%), Japan (15%), Philippines (13%), Thailand (12%) and Malaysia (10%) being the five most important in terms of numbers.
Parts and derivatives of nineteen taxa were imported to the EC; these imports were dominated by skins and dried plants (Table 7.3).

Analysis of the European Community and Candidate Countries Annual Report to CITES
74
Skins of seven species of reptile were imported. Javan File Snake Acrochordus javanicus and Masked Water Snake Homalopsis buccata were traded in large quantities originating mainly in Singapore (Javan File Snake) and Singapore, Indonesia, Thailand and Viet Nam (Masked Water Snake). Several thousand skins of Taiwan Stink Snake Elaphe carinata, Copperhead Racer Elaphe radiata and Shaw’s Sea Snake Lapemis curtus and a few hundred skins of E. taeniura were imported from China, including
Hong Kong SAR. Several thousand skins of Shaw’s Sea Snake Lapemis curtus were also imported from Thailand.
Trade in plant parts and derivatives of six species was reported. This trade was mostly from eastern European countries and China. Although numbers decreased slightly compared with 2003, the overall increase during the period 19982004 was maintained (Fig. 7.1).
Figure 7.1. Imports of Annex D medicinal plants (dried plants, roots & extracts) 19982004
0
50000
100000
150000
200000
250000
1998 1999 2000 2001 2002 2003 2004
Impo
rted
(kg
)

Analysis of the European Community and Candidate Countries Annual Report to CITES
75
Table 7.2. Imports of live specimens of Annex D nonCITES species 2004
Exporters Taxon
BR CN CU HK IN ID JP MG MY PK PE PH SG ZA CH TZ TH US VN Total
CHORDATA AVES PASSERIFORMES Muscicapidae Whiterumped Shama Copsychus malabaricus 30 30
Blackbreated Thrush Turdus dissimilis 32 32
Fringillidae Blackheaded Greenfinch Carduelis ambigua 60 60
Black Siskin Carduelis atrata 310 310
Greyheaded Bullfinch Pyrrhula erythaca 150 150
Cape Canary Serinus canicollis 260 260
East African Citril Serinus hypostictus 150 150
Estrildidae Avadavat Amandava amandava 2,400 2,400
Redfaced Crimsonwing Cryptospiza reichenovii 200 200
Yellowbellied Waxbill Estrilda quartinia 200 200
Peters’s Twinspot Hypargos niveoguttatus 1,131 1,131
Greyheaded Silverbill Lonchura griseicapilla 250 250
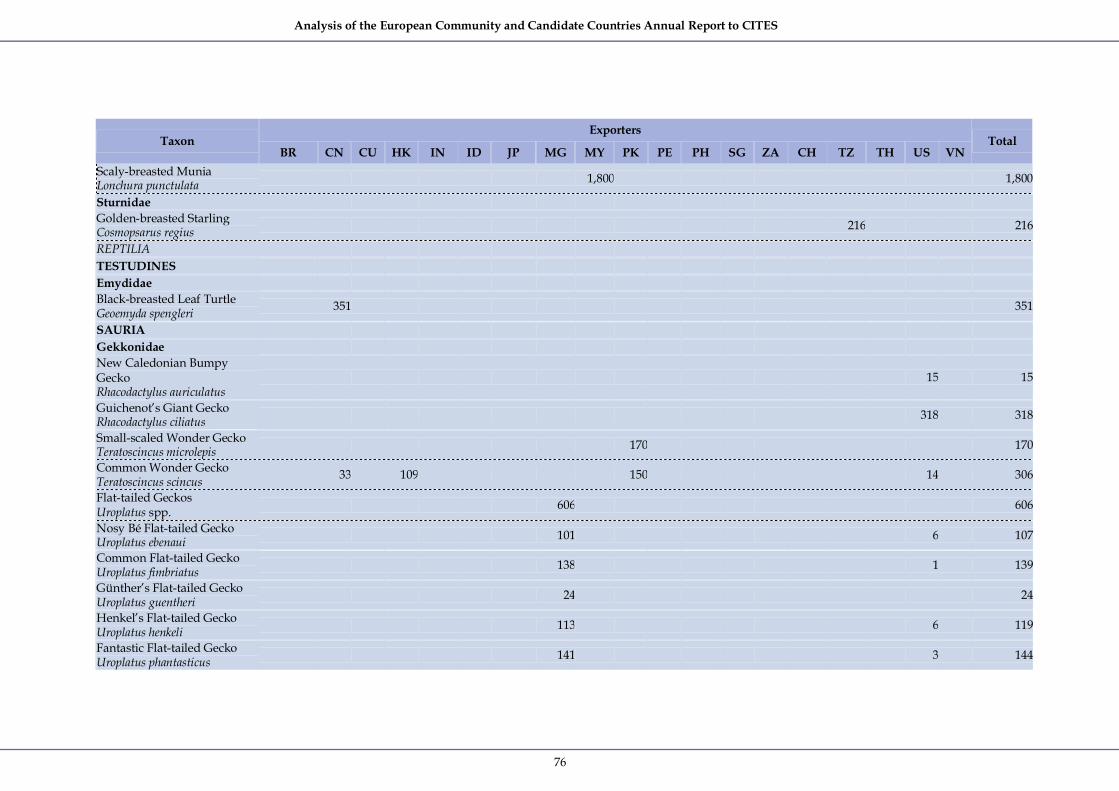
Analysis of the European Community and Candidate Countries Annual Report to CITES
76
Exporters Taxon
BR CN CU HK IN ID JP MG MY PK PE PH SG ZA CH TZ TH US VN Total
Scalybreasted Munia Lonchura punctulata 1,800 1,800
Sturnidae Goldenbreasted Starling Cosmopsarus regius 216 216
REPTILIA TESTUDINES Emydidae Blackbreasted Leaf Turtle Geoemyda spengleri 351 351
SAURIA Gekkonidae New Caledonian Bumpy Gecko Rhacodactylus auriculatus
15 15
Guichenot’s Giant Gecko Rhacodactylus ciliatus 318 318
Smallscaled Wonder Gecko Teratoscincus microlepis 170 170
Common Wonder Gecko Teratoscincus scincus 33 109 150 14 306
Flattailed Geckos Uroplatus spp. 606 606
Nosy Bé Flattailed Gecko Uroplatus ebenaui 101 6 107
Common Flattailed Gecko Uroplatus fimbriatus 138 1 139
Günther’s Flattailed Gecko Uroplatus guentheri 24 24
Henkel’s Flattailed Gecko Uroplatus henkeli 113 6 119
Fantastic Flattailed Gecko Uroplatus phantasticus 141 3 144
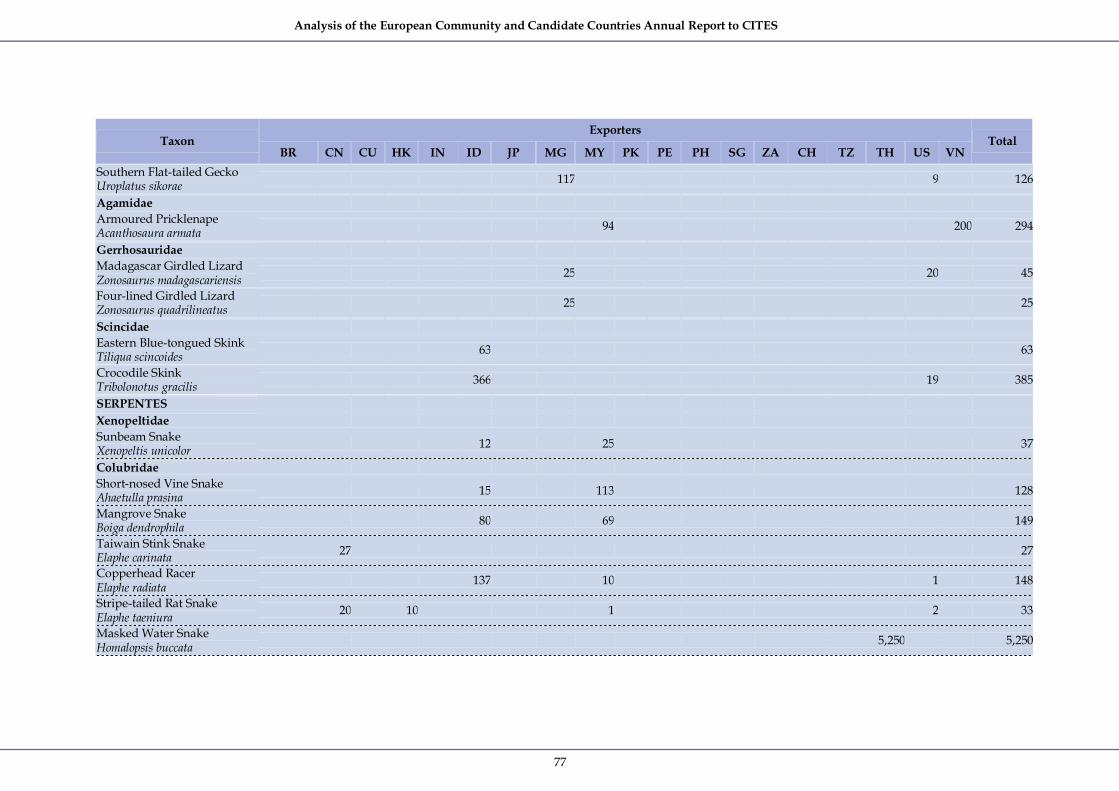
Analysis of the European Community and Candidate Countries Annual Report to CITES
77
Exporters Taxon
BR CN CU HK IN ID JP MG MY PK PE PH SG ZA CH TZ TH US VN Total
Southern Flattailed Gecko Uroplatus sikorae 117 9 126
Agamidae Armoured Pricklenape Acanthosaura armata 94 200 294
Gerrhosauridae Madagascar Girdled Lizard Zonosaurus madagascariensis 25 20 45
Fourlined Girdled Lizard Zonosaurus quadrilineatus 25 25
Scincidae Eastern Bluetongued Skink Tiliqua scincoides 63 63
Crocodile Skink Tribolonotus gracilis 366 19 385
SERPENTES Xenopeltidae Sunbeam Snake Xenopeltis unicolor 12 25 37
Colubridae Shortnosed Vine Snake Ahaetulla prasina 15 113 128
Mangrove Snake Boiga dendrophila 80 69 149
Taiwain Stink Snake Elaphe carinata 27 27
Copperhead Racer Elaphe radiata 137 10 1 148
Stripetailed Rat Snake Elaphe taeniura 20 10 1 2 33
Masked Water Snake Homalopsis buccata 5,250 5,250

Analysis of the European Community and Candidate Countries Annual Report to CITES
78
Exporters Taxon
BR CN CU HK IN ID JP MG MY PK PE PH SG ZA CH TZ TH US VN Total
Hydrophiidae Shaw’s Sea Snake Lapemis curtus 77 77
ACTINOPTERYGII SYNGNATHIFORMES Syngnathidae Seahorses Hippocampus spp. 10 1,018 193 10 1,231
Bigbellied Seahorse Hippocampus abdominalis 96 96
Tigertailed Seahorse Hippocampus comes 101 261 362
Crowned Seahorse Hippocampus coronatus 115 115
Black Seahorse Hippocampus erectus 126 132 232 73 26 27 616
Shortsnouted Seahorse Hippocampus hippocampus 52 10 62
Spiny Seahorse Hippocampus histrix 217 26 243
Yellow Seahorse Hippocampus kuda 97 884 1086 250 2,317
Longsnouted Seahorse Hippocampus reidi 252 4 256
Zebra Seahorse Hippocampus zebra 1 71 72
Dwarf Seahorse Hippocampus zosterae 215 215
FLORA Araceae Jackinthepulpit Arisaema spp. 100 100

Analysis of the European Community and Candidate Countries Annual Report to CITES
79
Exporters Taxon
BR CN CU HK IN ID JP MG MY PK PE PH SG ZA CH TZ TH US VN Total
Arisaema galeatum 680 420 1,100 Arisaema jacquemontii 400 200 600 Arisaema nepenthoides 820 560 1,380 Arisaema sikokianum 6,500 6,500 Arisaema speciosum 5,060 1,000 6,060 Arisaema tortuosum 2,780 1,780 4,560 Compositae Mountain Arnica Arnica montana 2,000 2,000
Passifloraceae Adenia Adenia fruticosa 168 168 Adenia Adenia spinosa 190 190 Note: countries exporting fewer than 100 specimens and species in which trade did not exceed 10 specimens are not included.
Table 7.3. Imports of parts and derivatives of Annex D nonCITES species in 2004
Exporters Taxon Terms (units)
AL BA CN HR HK ID MK RO RU CS SG TH US VN Total
CHORDATA REPTILIA SERPENTES Acrochordidae
plates 12 12 skins 2,148 36,922 20 45 39,135 Javan File Snake
Acrochordus javanicus small leather products 13 13
Colubridae skins 2,381 1,488 3,869 Taiwain Stink Snake
Elaphe carinata small leather products 5,403 2,541 7,944

Analysis of the European Community and Candidate Countries Annual Report to CITES
80
Exporters Taxon Terms (units)
AL BA CN HR HK ID MK RO RU CS SG TH US VN Total
plates 83 83 skins 270 532 2,000 119 2,921 Copperhead Racer
Elaphe radiata small leather products 6,845 114 6,959
Stripetailed Rat Snake Elaphe taeniura skins 246 246
plates 4 4 plates (m 2 ) 10 10 skin pieces 10 10
Bocourt’s Water Snake Enhydris bocourti
skins 585 585 plates 4 4 plates (m 2 ) 170 170 skin pieces 250 250 skins 31,482 70,429 25,975 12 10,546 138,444
Masked Water Snake Homalopsis buccata
small leather products 231 150 381 Hydrophiidae
plates 2,089 2,089 plates (m 2 ) 444 444 skin pieces 114 114
Shaw’s Sea Snake Lapemis curtus
skins 5,476 5,476 FLORA Compositae
derivatives (kg) 6 6 Mountain Arnica Arnica montana dried plants (kg) 8,000 8,000 Eriaceae
dried plants 4,384 4,384 Bearberry Arctostaphylos uvaursi dried plants (kg) 14,245 3,009 1,000 43,000 61,254 Gentianaceae
roots 4,400 4,400 Yellow Gentian Gentiana lutea roots (kg) 10,325 67,056 2,281 4,657 84,319
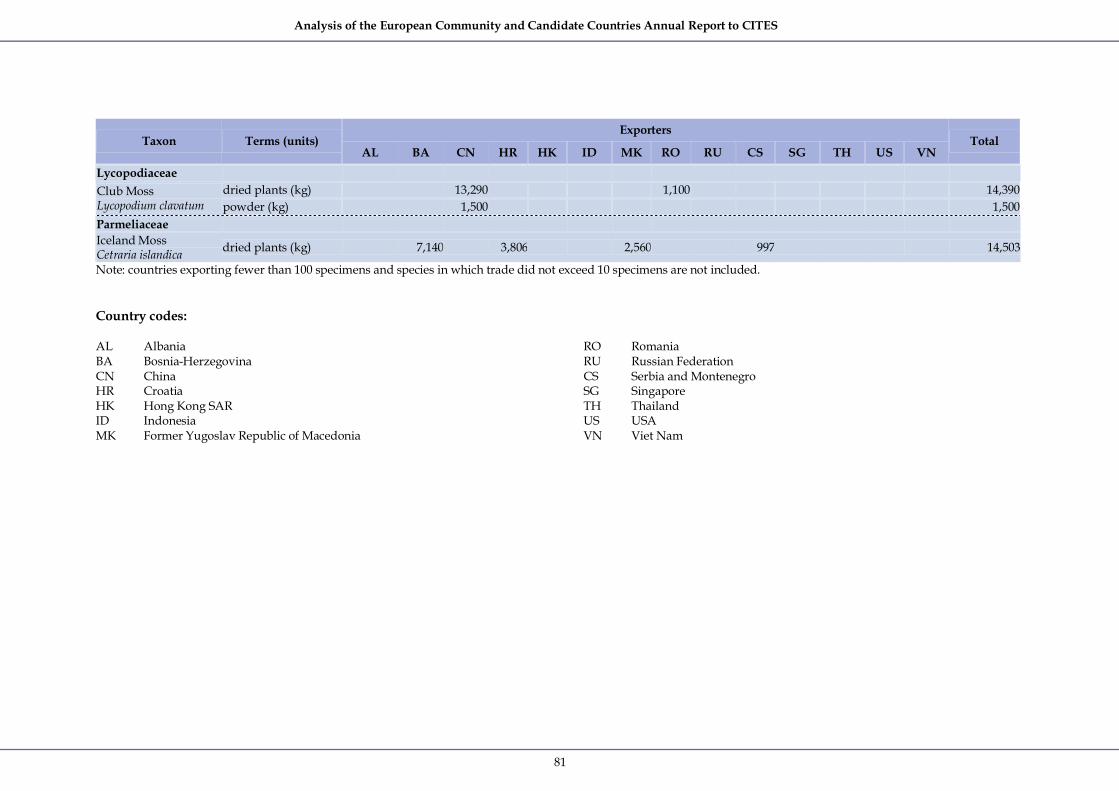
Analysis of the European Community and Candidate Countries Annual Report to CITES
81
Exporters Taxon Terms (units)
AL BA CN HR HK ID MK RO RU CS SG TH US VN Total
Lycopodiaceae dried plants (kg) 13,290 1,100 14,390 Club Moss
Lycopodium clavatum powder (kg) 1,500 1,500 Parmeliaceae Iceland Moss Cetraria islandica dried plants (kg) 7,140 3,806 2,560 997 14,503
Note: countries exporting fewer than 100 specimens and species in which trade did not exceed 10 specimens are not included.
Country codes:
AL Albania BA BosniaHerzegovina CN China HR Croatia HK Hong Kong SAR ID Indonesia MK Former Yugoslav Republic of Macedonia
RO Romania RU Russian Federation CS Serbia and Montenegro SG Singapore TH Thailand US USA VN Viet Nam
Analysis of the European Community and Candidate Countries Annual Report to CITES
82
References CITES (Convention on International Trade in Endangered Species of Wild Fauna and Flora),
2006. What is CITES? URL: http://www.cites.org/eng/disc/what.shtml. Accessed: February 2007.
Green, E. and Shirley, F., 1999. The Global trade in coral. WCMC Biodiversity Series no. 9.
IUCN, 2006. The 2006 IUCN Red List of Threatened Species. URL: http://www.iucnredlist.org. Accessed: February 2007.
Parker, I. S. C. and Martin, E. B., 1982. How many elephants are killed for the ivory trade? Oryx 16(3): 235239.
Servheen, C., Herrero, S. and Peyton, B., 1999. Bears: Status Survey and Conservation Action Plan. IUCN/SSC Bear Specialist Group, Gland, Switzerland & Cambridge, U.K.
Vales, M. A., Clemente, M. and García Esteban, L., 1999. Timber identification. In: CITES Identification Manual: Flora. CITES Secretariat, Switzerland.