Wild psychometrics: evidence for `general' cognitive ...
11
Wild psychometrics: evidence for ‘general’ cognitive performance in wild New Zealand robins, Petroica longipes Rachael C. Shaw a, * , Neeltje J. Boogert b, c , Nicola S. Clayton d , Kevin C. Burns a a School of Biological Sciences, Victoria University of Wellington, Wellington, New Zealand b School of Psychology and Neuroscience, University of St Andrews, St Andrews, U.K. c Department of Zoology, University of Cambridge, Cambridge, U.K. d Department of Experimental Psychology, University of Cambridge, Cambridge, U.K. article info Article history: Received 19 February 2015 Initial acceptance 1 May 2015 Final acceptance 16 July 2015 Available online 14 September 2015 MS. number: 15-00131 Keywords: cognitive test battery g general intelligence factor individual variation Petroica longipes In human psychometric testing, individuals' scores in tests of diverse cognitive processes are positively correlated, with a ‘general intelligence’ factor (g) typically accounting for at least 40% of total variance. Individual differences in cognitive ability have been extensively studied in humans, yet they have received far less attention in nonhuman animals. In particular, the development of a test battery suitable for quantifying individual cognitive performance in birds remains in its infancy. Additionally, imple- menting this approach in the wild, where the ecological significance of cognition can also be explored, presents considerable logistical challenges for most species. We developed a cognitive test battery for wild New Zealand North Island robins. Our battery comprised six tasks based on established measures of avian cognitive performance: a motor task, colour and shape discrimination, reversal learning, spatial memory and inhibitory control. Robins varied greatly in their ability to solve these tasks and we found weakly positive, nonsignificant correlations between most tasks. A principal components analysis of task performances yielded two factors with eigenvalues >1. The first component extracted explained over 34% of the variance in cognitive performance and all six tasks loaded positively on this first component. We show, using randomization tests, that these results are robust. Our results thus suggest that a general cognitive factor, analogous to human g, underpins cognitive performance in wild North Island robins tested in their natural habitat. © 2015 The Association for the Study of Animal Behaviour. Published by Elsevier Ltd. All rights reserved. Research interest in animal cognition, the mechanisms by which individuals acquire, process, store and act on information in their environment (Shettleworth, 2010), has grown substantially in recent years. Interindividual variation in cognitive performance was previously perceived as uninteresting ‘noise’ around the mean. However, researchers are increasingly recognizing that such indi- vidual differences can have important consequences for survival and reproductive success (e.g. Cauchard, Boogert, Lefebvre, Dubois, & Doligez, 2013; Cole, Morand-Ferron, Hinks, & Quinn, 2012; Isden, Panayi, Dingle, & Madden, 2013; Keagy, Savard, & Borgia, 2009, 2011). If we are to assess the fitness consequences of cognitive ability, we first need robust and ecologically relevant measures of individual cognitive variation (Rowe & Healy, 2014). Recent research has largely focused on ‘novel problem-solving perfor- mance’ (reviewed in Thornton, Isden, & Madden, 2014). In this approach, animals are presented with a single task, such as pulling a lever to release a food reward (Cole et al., 2012), removing an obstruction from their nestbox entrance (Cauchard et al., 2013), or removing undesirable objects from a display bower (Keagy et al., 2009, 2011). Those individuals that manage to solve the task, or solve the task faster than others, are deemed to have ‘better’ cognitive ability (Rowe & Healy, 2014; Thornton et al., 2014). However, it remains unclear exactly which cognitive abilities such tasks are actually measuring. Furthermore, these tasks are often presented only once to each test subject. A one-off task solve may be due to chance or a combination of noncognitive factors, such as persistence, motivation or dexterity (Thornton et al., 2014). Instead, the use of test batteries that target defined cognitive processes has recently been advocated (Isden et al., 2013; Thornton, 2014; Thornton et al., 2014). In human psychometric studies, individuals' scores in test bat- teries assessing diverse cognitive processes, such as processing speed, working memory and verbal comprehension, are positively correlated, with a single factor, termed g (for ‘general intelligence’), * Correspondence: R. C. Shaw, School of Biological Sciences, Victoria University of Wellington, PO Box 600, Wellington 6140, New Zealand. E-mail address: [email protected] (R. C. Shaw). Contents lists available at ScienceDirect Animal Behaviour journal homepage: www.elsevier.com/locate/anbehav http://dx.doi.org/10.1016/j.anbehav.2015.08.001 0003-3472/© 2015 The Association for the Study of Animal Behaviour. Published by Elsevier Ltd. All rights reserved. Animal Behaviour 109 (2015) 101e111
Transcript of Wild psychometrics: evidence for `general' cognitive ...

lable at ScienceDirect
Animal Behaviour 109 (2015) 101e111
Contents lists avai
Animal Behaviour
journal homepage: www.elsevier .com/locate/anbehav
Wild psychometrics: evidence for ‘general’ cognitive performancein wild New Zealand robins, Petroica longipes
Rachael C. Shaw a, *, Neeltje J. Boogert b, c, Nicola S. Clayton d, Kevin C. Burns a
a School of Biological Sciences, Victoria University of Wellington, Wellington, New Zealandb School of Psychology and Neuroscience, University of St Andrews, St Andrews, U.K.c Department of Zoology, University of Cambridge, Cambridge, U.K.d Department of Experimental Psychology, University of Cambridge, Cambridge, U.K.
a r t i c l e i n f o
Article history:Received 19 February 2015Initial acceptance 1 May 2015Final acceptance 16 July 2015Available online 14 September 2015MS. number: 15-00131
Keywords:cognitive test batteryggeneral intelligence factorindividual variationPetroica longipes
* Correspondence: R. C. Shaw, School of Biological SWellington, PO Box 600, Wellington 6140, New Zeala
E-mail address: [email protected] (R. C.
http://dx.doi.org/10.1016/j.anbehav.2015.08.0010003-3472/© 2015 The Association for the Study of A
In human psychometric testing, individuals' scores in tests of diverse cognitive processes are positivelycorrelated, with a ‘general intelligence’ factor (g) typically accounting for at least 40% of total variance.Individual differences in cognitive ability have been extensively studied in humans, yet they havereceived far less attention in nonhuman animals. In particular, the development of a test battery suitablefor quantifying individual cognitive performance in birds remains in its infancy. Additionally, imple-menting this approach in the wild, where the ecological significance of cognition can also be explored,presents considerable logistical challenges for most species. We developed a cognitive test battery forwild New Zealand North Island robins. Our battery comprised six tasks based on established measures ofavian cognitive performance: a motor task, colour and shape discrimination, reversal learning, spatialmemory and inhibitory control. Robins varied greatly in their ability to solve these tasks and we foundweakly positive, nonsignificant correlations between most tasks. A principal components analysis of taskperformances yielded two factors with eigenvalues >1. The first component extracted explained over 34%of the variance in cognitive performance and all six tasks loaded positively on this first component. Weshow, using randomization tests, that these results are robust. Our results thus suggest that a generalcognitive factor, analogous to human g, underpins cognitive performance in wild North Island robinstested in their natural habitat.© 2015 The Association for the Study of Animal Behaviour. Published by Elsevier Ltd. All rights reserved.
Research interest in animal cognition, themechanisms bywhichindividuals acquire, process, store and act on information in theirenvironment (Shettleworth, 2010), has grown substantially inrecent years. Interindividual variation in cognitive performancewas previously perceived as uninteresting ‘noise’ around the mean.However, researchers are increasingly recognizing that such indi-vidual differences can have important consequences for survivaland reproductive success (e.g. Cauchard, Boogert, Lefebvre, Dubois,& Doligez, 2013; Cole, Morand-Ferron, Hinks,& Quinn, 2012; Isden,Panayi, Dingle, & Madden, 2013; Keagy, Savard, & Borgia, 2009,2011). If we are to assess the fitness consequences of cognitiveability, we first need robust and ecologically relevant measures ofindividual cognitive variation (Rowe & Healy, 2014). Recentresearch has largely focused on ‘novel problem-solving perfor-mance’ (reviewed in Thornton, Isden, & Madden, 2014). In this
ciences, Victoria University ofnd.Shaw).
nimal Behaviour. Published by Els
approach, animals are presented with a single task, such as pullinga lever to release a food reward (Cole et al., 2012), removing anobstruction from their nestbox entrance (Cauchard et al., 2013), orremoving undesirable objects from a display bower (Keagy et al.,2009, 2011). Those individuals that manage to solve the task, orsolve the task faster than others, are deemed to have ‘better’cognitive ability (Rowe & Healy, 2014; Thornton et al., 2014).However, it remains unclear exactly which cognitive abilities suchtasks are actually measuring. Furthermore, these tasks are oftenpresented only once to each test subject. A one-off task solve maybe due to chance or a combination of noncognitive factors, such aspersistence, motivation or dexterity (Thornton et al., 2014). Instead,the use of test batteries that target defined cognitive processes hasrecently been advocated (Isden et al., 2013; Thornton, 2014;Thornton et al., 2014).
In human psychometric studies, individuals' scores in test bat-teries assessing diverse cognitive processes, such as processingspeed, working memory and verbal comprehension, are positivelycorrelated, with a single factor, termed g (for ‘general intelligence’),
evier Ltd. All rights reserved.

R. C. Shaw et al. / Animal Behaviour 109 (2015) 101e111102
typically accounting for at least 40% of the total variance (Deary,Penke, & Johnson, 2010; Deary, Spinath, & Bates, 2006; Plomin,2001; Plomin & Spinath, 2002). In nonhuman animals, positivecorrelations between performance scores on tasks assessingdifferent types of learning have been documented in honeybees,Apis mellifera (Chandra, Hosler, & Smith, 2000) and feral pigeons,Columba livia (Bouchard, Goodyer, & Lefebvre, 2007), while cogni-tive test batteries have been developed to test for g in several pri-mate species (Amici, Barney, Johnson, Call, & Aureli, 2012; Banerjeeet al., 2009; Herrmann, Call, Hern�andez-Lloreda, Hare,& Tomasello,2007; Schmitt, Pankau, & Fischer, 2012) and in mice, Mus musculus(Galsworthy et al., 2005; Locurto, Fortin, & Sullivan, 2003; Matzelet al., 2003). However, the specific tasks used in a test batterymay have implications for interpreting correlations between per-formance scores. For example, the mouse test batteries typicallycontain a predominance of spatial tasks. Positive correlations maythus arise because most tests are tapping into the same cognitiveprocess (e.g. spatial learning/memory; Amici et al., 2012). Reliablyestimating g therefore requires choosing tasks that span differentcognitive domains (Amici et al., 2012; Thornton et al., 2014).
To date there have been few attempts to develop avian cognitivetest batteries. Boogert, Anderson, Peters, Searcy, and Nowicki(2011) tested wild-caught song sparrows, Melospiza melodia, inthe laboratory using four tasks (a motor task, colour discrimination,colour reversal and a detour-reaching task). Isden et al. (2013) gavemale spotted bowerbirds, Ptilonorhynchus maculatus, a test batteryconsisting of six tasks (a problem-solving task, a motor task, colourdiscrimination, colour reversal, shape discrimination and spatialmemory) and a general factor was found to account for over 44% ofthe variance in task performance (Isden et al., 2013). These pio-neering avian test batteries did not contain as many tasks as thoseused for primates (e.g. Amici et al., 2012; Banerjee et al., 2009;Herrmann et al., 2007; Schmitt et al., 2012) and mice (Galsworthyet al., 2005; Locurto et al., 2003; Matzel et al., 2003). However,the tasks that they incorporated were based on established, psy-chologically grounded experimental methods for assessing definedcognitive traits (Boogert, Anderson, et al., 2011; Isden et al., 2013), acharacteristic that is critical in the design of cognitive test batteries(Thornton et al., 2014).
Most animal cognition studies to date have tested small groupsof individuals in captivity. However, this approach overlooks theecological and evolutionary significance of cognition (Thornton &Lukas, 2012) and may generate data that are confounded by inter-individual differences in response to captivity. Unfortunately, get-ting wild birds to participate in a series of cognitive tasks in thefield is prohibitively challenging in most species (Boogert, Fawcett,et al., 2011; Boogert, Monceau, & Lefebvre, 2010). Implementing abattery of tasks in the field requires that an animal can be locatedover multiple test sessions and is willing to approach and interactwith novel objects, without interference from conspecifics. As yet,few species have been identified that fulfil all these requirements(Isden et al., 2013; Keagy et al., 2011).
The North Island robin, a small insectivorous passerine that isendemic to New Zealand, is an ideal species for implementing acognitive test battery in the field. North Island robins lack neo-phobia and have few antipredator behaviours (Maloney &Mclean,1995). They readily participate in cognition experiments requiringthem to interact with humans and novel objects, including tests ofquantity discrimination (Garland, Low, & Burns, 2012; Hunt, Low,& Burns, 2008) and human gaze avoidance (Garland, Low,Armstrong, & Burns, 2014). Moreover, robins are territorial year-round, meaning that individuals can be reliably located forparticipation in multiple test sessions. North Island robins are alsoa food-caching species that will dismember large insect prey andstore them in branchetrunk axils in the forest canopy (Steer &
Burns, 2008; Van Horik & Burns, 2007). The spatial cognitionunderpinning food-caching behaviour has been investigated inseveral species (e.g. reviewed in Smulders, Gould, & Leaver, 2010)and many other cognitive domains have also been tested incaching species. For example, Eurasian jays, Garrulus glandarius,which cache thousands of acorns each year as a staple foodresource (Bossema, 1979), have been given problem-solving tasksthat involve the interplay between instrumental learning andcognition (Cheke, Bird, & Clayton, 2011), as well as tasks that relyon a contribution from other cognitive skills including inference(Shaw, Plotnik, & Clayton, 2013), social cognition (Ostoji�c, Shaw,Cheke, & Clayton, 2013; Shaw & Clayton, 2013), future planning(Cheke & Clayton, 2012) and inhibitory control (MacLean et al.,2014). However, a cognitive test battery has not yet been con-ducted to explicitly test for g in any caching species. The NorthIsland robin therefore provides the opportunity to test for thepresence of a factor analogous to human g in a species that ishighly likely to have undergone selection to specialize in thespatial cognitive domain.
The aim of this study was to quantify individual cognitivevariation of wild North Island robins and determine whether thisvariation could be described with a single general cognition factor(i.e. g). In contrast to previous nonhuman studies, we also tested,using randomization tests, whether our results were robust. Ourtest battery comprised six psychologically grounded tasks: a motortask, colour discrimination and reversal learning, shape discrimi-nation, spatial memory and inhibitory control.
METHODS
Study Site and Subjects
We conducted the experiments between 3 April and 25September 2014 at Zealandia Wildlife Sanctuary, a 225 ha wildlifesanctuary in Central Wellington (41�180S, 174�440E) that is sur-rounded by a predator exclusion fence. Since 2000 all mammalianpredators have been removed from the reserve (with the exceptionof mice) and many rare forest-dwelling endemic birds have beenreintroduced to the site. In 2001 and 2002, a total of 76 North Islandrobins were translocated from Kapiti Island to Zealandia and thepopulation has since been breeding successfully, with robin densityestimated to be between 2.3 and 3.4 individuals/ha in 2008 (i.e.between 500 and 765 birds in total; McGavin, 2009).
Male robins are typically dominant to their mates and willdisplace females from food sources (Burns & Steer, 2006). Themajority of our 20 adult subjects were therefore male (males ¼ 14,females ¼ 4, sex unknown ¼ 2). Our research was conductedwithin a 25 ha area of the sanctuary. We individually banded robinswith three plastic coloured bands and a metal band (two bands perleg, bands supplied by the Department of Conservation's NationalBanding Office). We caught robins using a drop trap. We removedindividuals from the trap immediately, banded them and recordedtheir weight as well as the length of their tarsus and wing chord.We released them as soon as these measures were taken. To ensurethere were no adverse effects of the banding procedures robinswere fed two mealworms immediately after release and werefrequently monitored. There was no evidence of capture- orbanding-related injuries during the experiment. The exact age ofthe test subjects was unknown.
Ethical Note
The research was approved by the Victoria University ofWellington Animal Ethics Committee and conducted under permit

R. C. Shaw et al. / Animal Behaviour 109 (2015) 101e111 103
from the Department of Conservation (Authorisation number:38497-FAU).
Cognitive Test Battery
We ran experiments between 0830 and 1430 hours. All robinsparticipated voluntarily in the cognitive experiments. The cognitivetest battery consisted of six tasks with a consistent task order tostandardize carryover effects: (1) motor task, (2) colour discrimi-nation, (3) colour reversal, (4) spatial memory, (5) inhibitory con-trol and (6) symbol discrimination. Three subjects disappearedbefore completing the final symbol discrimination task (one wasdisplaced from her winter territory mid-way through the task andtwo were either predated or displaced before beginning the task).
A wooden board (25 � 35 cm) served as a test platform for alltasks (Fig. 1). We placed the platform on the ground under a sectionof closed canopy within a bird's territory, at least 8 m from a ter-ritory boundary. We identified boundaries during territorial dis-plays between the territory holder and any neighbouring robins.The location and orientation of the platform, as well as the place-ment of any apparatus on it, were consistent across all trials. Alltrials were observed and scored live by the experimenter (R.C.S.)who stood at least 1.5 m from the platform. Trials were also filmedwith a Sony HDR-AS30V camera to check scores later. To avoidterritorial disputes and the possibility of social learning, a trialbegan when the robin was in view of the experimenter and noconspecifics could be seen or heard in the area.
Tasks 1e4 and 6 used foraging grids consisting of a woodenblock (13.5 � 9 � 2.5 cm) containing six wells (1.3 cm diameter,0.8 cm deep; Fig. 1aec). The wells could be covered with circularremovable PVC lids (2.2 cm diameter, 0.05 cm high). A vinylbumper (1.3 cm diameter, 0.3 cm high) was glued to the bottom ofeach lid and fitted exactly into the well (as in Boogert, Anderson,et al., 2011).
Figure 1. The test apparatuses, with a robin for scale: (a) the foraging grid and white lids usand reversal tasks, (c) the two grids and lids used for the spatial memory task, (d) the opaquthe transparent cylinder (both ends open, the white substrate is the base on which the transcheck motivation.
Motor taskTo assess motor skill learning we adapted protocols that have
been used with captive, domesticated zebra finches, Taeniopygiaguttata (Boogert, Giraldeau, & Lefebvre, 2008) and wild-caughtsong sparrows (Boogert, Anderson, et al., 2011). We trainedrobins to flip white PVC lids on the foraging grid using a systematicshaping procedure with four training stages (Table 1), followingBoogert et al. (2008). In each trial, we placed one foraging grid onthe test platform and baited four of its six wells with a freshly killedmealworm (Tenebrio molitor larvae; Fig. 1a). We allowed robins upto 3 min to retrieve mealworms before removing the grid, as thiswas the maximum amount of time birds needed to retrieve at leastthree of the four mealworms during level 1. Between trials therewas a delay of 1e3 min during whichwe recorded the previous trialoutcome and reset the apparatus. We kept the intertrial interval toa minimum to ensure that a robin did not leave the immediate areaduring a test session. We randomized the location of the baitedwells between trials. Robins were presented with one test session,consisting of five trials, per day.
We considered a robin to have solved the task once it retrievedat least three mealworms in six of seven consecutive trials (acrosssessions) when the lids were fully inserted into the wells (level 4pass criterion, Table 1). If a robin retrieved no mealworms in threeconsecutive trials, it regressed to the previous level. The motor taskperformance measure that we used in the analyses was the sum-med number of trials the robin took to pass both levels 3 and 4 ofthe task, when the reward was not visible (following Boogert,Anderson, et al., 2011).
Colour preference and colour discriminationAfter a robin had completed level 4 of the motor task, we gave it
a colour preference test on the following test day (which did notalways fall on the following calendar day). We presented the robinwith a single foraging grid containing two wells side by side that
ed for the motor task, (b) the grid and coloured lids used for the colour discriminatione cylinder (both ends open) used in the training phase of the detour-reaching task, (e)parent cylinder rests) used in the detour-reaching test phase (f) and the scales used to

Table 1The four stages of the motor task that were used to train robins to flip the lids off the foraging grid (following Boogert et al., 2008)
Level Description Pass criteria
1 Lids positioned next to the wells 3e4 mealworms retrieved in 3 consecutive trials2 Half of each well covered by a lid 3e4 mealworms retrieved in 3 consecutive trials3 Mealworms hidden from view by lids propped up on one side 3e4 mealworms retrieved in 3 consecutive trials4 Lids' vinyl bumpers fitted into the wells 3e4 mealworms retrieved in 6 of 7 consecutive trials
For images matching the descriptions of the lid positions, see Fig. A1.
R. C. Shaw et al. / Animal Behaviour 109 (2015) 101e111104
were baited with a freshly killed mealworm and were covered withdifferently coloured lids (Fig. 1b). We allowed the robin to flip onelid only and this was taken to be their preferred colour.
Of the 20 test subjects, 12 were presented with one red lid andone blue lid for the preference test. However, eight other robins hadpreviously participated in a pilot test of a different colour associa-tion task using red and blue lids. Although none of the robins ful-filled the learning criteria in that pilot test, we presented theseeight robins with green and yellow lids to minimize any carryovereffects from the pilot test.
Immediately after the colour preference test we gave a robintheir first session of the colour association task. For this, we pre-sented the robinwith a single foraging gridwith one red lid and oneblue lid (or one yellow and one green for the previously testedgroup) covering twowells that were side by side. Whichever colourwas not flipped first by the robin in the preference test now covereda well baited with one freshly killed mealworm. The preferredcoloured lid covered a well that was empty. The first trial was aprobe trial in which we allowed robins to flip both lids, so that theydiscovered that only one of the wells contained a mealworm. In allremaining test trials we allowed a robin to flip only one lid beforethe experimenter removed the apparatus, so that removing theunrewarded lid came at the cost of a missed mealworm reward.Robins had 2 min to complete a trial, with a 1e3 min delay betweentrials.
We pseudorandomized the side of the apparatus containing thebaited well between test trials, such that one side of the grid wasnever baited in more than three consecutive trials. Additionally, wenever used the same pair of wells between consecutive trials, tominimize the possibility of robins experiencing interference fromspatial cues remembered from the preceding trial. If a robin failedto retrieve any worms in five consecutive trials, we gave it a singleworm to prevent it from becoming so hungry that it began foragingfor naturally occurring foods.
We gave robins one session per day, consisting of 15 test trials.A robin solved the task if it flipped the rewarded colour in 10 of 12consecutive trials, either within a single session or across two testsessions (as this exceeds the chance expectation of six of 12 trialscorrect: two-tailed binomial test P ¼ 0.039). Unless the weatherwas too inclement for testing to be carried out safely, we con-ducted sessions on consecutive days until the robin solved thetask.
Colour reversalReversal learning tasks have been used to measure behavioural
flexibility in many avian species (e.g. corvids: Bond, Kamil, & Balda,2007; Zenaida doves, Zenaida aurita: Boogert et al., 2010; Darwin'sfinches: Tebbich, Sterelny, & Teschke, 2010). The day after a robinsolved the colour discrimination task, we presented the same taskbut reversed the colour of lid that hid the mealworm (e.g. blue nowhid the mealworm if red had covered it in the colour discriminationtask). The procedure was otherwise identical to the colour associ-ation task, with the pass criterion being to flip the rewarded colourin 10 of 12 consecutive trials.
Spatial memoryAvian spatial memory studies typically investigate how quickly
a bird learns to use spatial cues to accurately locate food in aforaging grid (e.g. western scrub-jays, Aphelocoma californica:Pravosudov, Lavenex, & Omanska, 2005; zebra finches: Sanford &Clayton, 2008; song sparrows: Sewall, Soha, Peters, & Nowicki,2013). Our spatial memory task was a simplified and shortenedversion of a protocol previously used to test spatial memory inwild-caught song sparrows (Sewall et al., 2013). We gave robinstwo foraging grids placed side by side to create a 3 � 4 grid(Fig. 1c). Eight of the 12 wells were covered with grey lids(avoiding the corner wells). Only one of the eight wells containeda freshly killed mealworm. The exact location of the reward wasrandomized between birds.
On the first day of testing we gave robins a baseline trial inwhich they could flip all lids to locate the single food reward. Weremoved the grids and lids from the test platform after all lids wereflipped. The birds had a training trial after a 5 min delay. We placedthe two grids on the test platform in the same orientation with thesame well containing the mealworm and allowed the robin to flipall lids to search for the food reward. The following day, after a 24 hdelay, we presented the apparatus in the same location andorientation, with the same well baited. We repeated the procedureagain the following day, 48 h after the first trial. In every trial, weonly removed the grid once the robin had flipped all eight lids(following the procedures of Sewall et al., 2013).
We used the total number of lids that a robin flipped during thetwo test trials (24 h and 48 h delay) before flipping the rewarded lidas a measure of its spatial memory performance (following Sewallet al., 2013). To ascertain whether the robins could use odour cues,we conducted a final probe trial 5 min after the 48 h spatialmemory test. In this probe, none of the wells were baited. We alsorotated the grid, so that its appearance did not change, but the wellthat had contained food in the preceding trial was now on theopposite side of the grid. This ensured that there were no residualodour cues at the correct spatial location.
Inhibitory controlInhibitory control (characterized as the ability to inhibit a pre-
potent response) is a crucial component of executive function anddecision making in humans and nonhuman animals (Hauser, 1999;MacLean et al., 2014). It has been measured in several bird specieswith a detour-reaching task in which an animal must learn toretrieve a reward from behind a transparent barrier without firstattempting to reach through this barrier (Boogert, Anderson, et al.,2011; MacLean et al., 2014). For our detour-reaching task theapparatus was a transparent plastic cylinder (5 cm length, 4 cmdiameter, 0.1 cm thickness), open at both ends and glued to awooden base (5 � 4 cm and 0.6 cm high; for a detailed picture ofthe apparatus see Fig. 1 in Boogert, Anderson, et al., 2011).
The task consisted of habituation, training and test phases.During the habituation and training phases, the cylinder was opa-que (wrapped in black electrical tape with both ends remainingopen, Fig. 1d). For habituation trials, we gave the robin the opaque
R. C. Shaw et al. / Animal Behaviour 109 (2015) 101e111 105
tube with a single, freshly killed mealworm placed in the centre.Habituation was complete when the robin consumed the meal-worm within 2 min in three consecutive trials. Training was iden-tical to habituation, and was completed when the robin removedthe worm from one of the open ends of the tube without pecking atthe tube first in four consecutive trials. The opaque tube trainingphase ensured that the robin had learned to move to one of theopen ends of the tube to retrieve the worm, so that the test phaseonly tested the robin's inhibitory control performance. Birds'approach direction to the test platform could bias performance:approaching the open end of the tube would allow individuals toreach themealworm reward directly without having to inhibit theirimpulses to peck at the side of the tube. To prevent such biases, weoriented the tube so that the long, closed plastic side was parallelwith the platform side that the robin was most likely to approachfirst. We defined this as the side of the platform that a robinapproached first most frequently during all trials of the spatialmemory task.
During the test phase the tube was transparent and open atboth ends (Fig. 1e). To pass, the robin had to successfully detour toone of the open ends of the tube to retrieve the worm, withoutpecking at the transparent wall of the tube first, in six of sevenconsecutive trials. The performance measure was howmany trialsthe robin took to reach this criterion. There was an interval of1 min between trials and we gave robins no more than 20 trials ina day.
Symbol discriminationThe symbol discrimination task protocol was identical to the
colour discrimination task. We initially tested a robin's preferencefor two symbols (a cross and a square) that were matched in termsof the area they covered on a white background and the amount ofblack line they contained. We then used the symbol that was notflipped during the preference test to cover the well containing thefood reward in the test trials. The first 10 robins that we tested onthis task received up to eight 15-trial sessions (i.e. a total of 120trials). However, to ensure that we completed all cognitive testingbefore the onset of nesting, we gave the remaining seven birdsthree sessions (45 trials) only.
Motivation and Neophobia
To ensure that robins were motivated for food rewardsthroughout cognitive test sessions, they had been trained beforethe cognitive tests commenced to hop on an electronic scale(Fig. 1f) for a single mealworm reward, and were weighed beforeand after every test session. Such motivation checks are critical tointerpret cognitive measures; motivational factors may not neces-sarily relate to the cognitive abilities required to solve a task, butmay greatly affect test performance (Rowe & Healy, 2014; Sanford& Clayton, 2008). To characterize a robin's neophobia, when wegave a robin a new apparatus (or a new lid colour) we recorded howlong it took for the robin to touch the item.
Statistical Analyses
Statistical analyses were conducted in R version 3.1.1 (The RFoundation for Statistical Computing, Vienna, Austria, http://www.r-project.org). For all our performance measures, a lower score in-dicates that a robin required fewer test trials to reach the task's passcriterion. In the spatial memory task we also calculated how manylids the robins were expected to flip if searching randomly during atrial. For this we used an equation derived from the negative hy-pergeometric distribution (assuming sampling without replace-ment; equation 8 in Till�e, Newman, & Healy, 1996). We used two-
tailed, one-sample t tests to compare this random search expec-tation to the observed number of lids flipped by robins in the 24 hand 48 h test trials.
To explore how task performances in the cognitive test batterywere related to each other we used Spearman rank correlations totest for pairwise correlations. A Bonferroni correction for multiplecomparisons was applied to the alpha level of significance. Toinvestigate whether interindividual variation in performanceacross cognitive tasks could be explained by a single factorextracted from the data (i.e. g) we performed a principal compo-nents analysis (PCA) with an unrotated factor solution using theprincomp function in R. The scores from the first unrotated prin-cipal component are widely used as a measure of g in both humansand nonhuman animals (e.g. Isden et al., 2013; Locurto et al., 2003;Plomin, 2001; Plomin & Spinath, 2002). Previous nonhumanstudies of the structure of cognitive performance have inferred theexistence of g when all task performances load positively onto thefirst unrotated component extracted that also explains 30e45% ofthe variance in test performance (e.g. Galsworthy et al., 2005;Isden et al., 2013; Matzel et al., 2003). To assess the likelihoodthat all tasks would load positively on the first unrotatedcomponent extracted by chance, we compared the mean andstandard deviation for our first component factor loadings to themean and standard deviation of first component factor loadingsobtained in 10 000 simulations. For each simulation we random-ized the test battery scores between birds (using the random-izeMatrix function in the R package picante: Kembel et al., 2014),performed an unrotated PCA and obtained the mean and standarddeviation of the factor loadings for the first unrotated componentextracted.
RESULTS
Robins (N ¼ 20) required a mean ± SD of 17.20 ± 2.29 days(range 14e22) to complete the first five tasks of the test battery.
Motor Task
Four robins passed the final two levels of the task, in which thereward was completely covered by the lid, in the minimum numberof trials possible (10 trials). The slowest individual required 18 trialsto pass the final two stages of the motor task (mean ± SD trials topass levels 3 and 4 ¼ 13.00 ± 2.36, N ¼ 20).
Colour Preference and Colour Discrimination
Of the 12 robins that were presented with one red and one bluelid, eight chose the blue lid first in the preference test. Of the eightbirds that were presented with green and yellow lids, four chosethe green lid first in the preference test. The number of trials thatrobins required to solve the colour discrimination task ranged be-tween 12 and 80 (mean ± SD ¼ 40.05 ± 19.33, N ¼ 20).
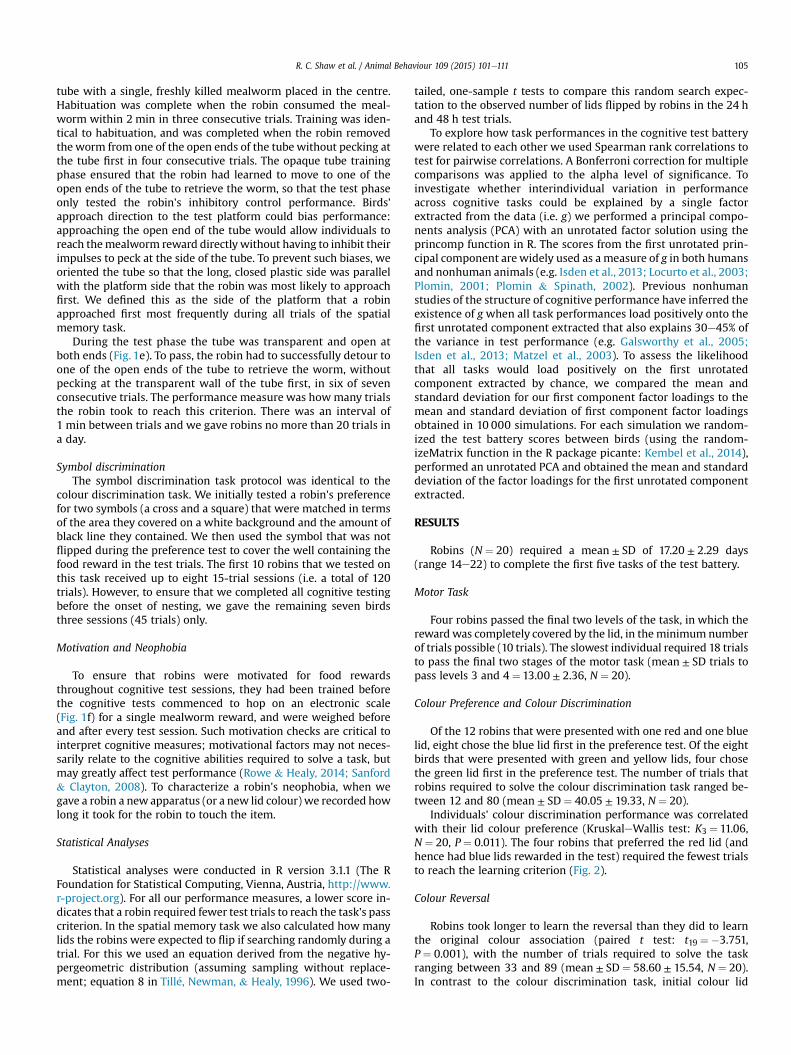
Individuals' colour discrimination performance was correlatedwith their lid colour preference (KruskaleWallis test: K3 ¼ 11.06,N ¼ 20, P ¼ 0.011). The four robins that preferred the red lid (andhence had blue lids rewarded in the test) required the fewest trialsto reach the learning criterion (Fig. 2).
Colour Reversal
Robins took longer to learn the reversal than they did to learnthe original colour association (paired t test: t19 ¼ �3.751,P ¼ 0.001), with the number of trials required to solve the taskranging between 33 and 89 (mean ± SD ¼ 58.60 ± 15.54, N ¼ 20).In contrast to the colour discrimination task, initial colour lid
Blue Yellow Green10
20
30
40
50
60
80
70
Col
our
dis
crim
inat
ion
per
form
ance
Red
Initial colour preference
Figure 2. The number of trials that robins required to solve the colour discriminationtask, grouped by their initial lid colour preference (red: N ¼ 4; blue: N ¼ 8; yellow:N ¼ 4; green: N ¼ 4; whiskers indicate the range and boxes the upper quartile, medianand lower quartile).
R. C. Shaw et al. / Animal Behaviour 109 (2015) 101e111106
preference did not affect how long it took a robin to learn thereversal (KruskaleWallis test: K3 ¼ 0.754, N ¼ 20, P ¼ 0.861).
Spatial Memory
Robins made between 0 and 13 errors (i.e. incorrect lids flippedbefore finding the mealworm) in total across the 24 h and 48 hmemory tests (mean ± SD ¼ 7.32 ± 3.25, N ¼ 19). One robincached several lids during the first presentation of the task. As aresult, there were insufficient lids remaining to run his 5 mintraining trial and he was subsequently excluded from theexperiment.
The random search expectation per test trial was 4.5 lids flippedbefore locating the reward (calculated following the methods ofTill�e et al., 1996). Overall the robins' search behaviour did not differfrom the random search expectation in either the 24 h test(mean ± SD ¼ 4.58 ± 2.14; one-sample t test: t18 ¼ 0.161, P ¼ 0.874)or the 48 h test (mean ± SD ¼ 4.74 ± 1.97; one-sample t test:t18 ¼ 0.525, P ¼ 0.606).
Six robins (three male, two female, one sex unknown) improvedover time, making at least one less error during the 48 h test thanduring their initial baseline trial. Five birds (two male, two female,one sex unknown) showed no improvement and eight birds (allmale) performed worse in the 48 h test than in the initial baselinetrial.
Robins did not rely on odour cues to solve the spatial memorytask, as the number of errors made by individuals did not differbetween the 48 h test (mean ± SD ¼ 4.74 ± 1.97, N ¼ 19) and thefinal probe trial (mean ± SD ¼ 3.89 ± 2.36, N ¼ 19; paired t test:t18 ¼ 1.619, P ¼ 0.123).
Inhibitory Control
All 20 robins completed the habituation and training stages(when the cylinder was opaque) in the minimum number of trialsrequired (seven). Individuals required between seven and 59 trials
to pass the detour-reaching test when the cylinder was transparent(mean ± SD ¼ 23.45 ± 15.76, N ¼ 20).
Symbol Discrimination
During the initial preference test, 11 birds chose to remove thelid with the cross symbol first and six chose to remove the square.Two of the initial 10 robins that were tested did not pass the symboltask within eight sessions (120 trials). In total, 10 of the 17 robinstested passed the symbol discrimination task. These robinsrequired between 13 and 86 trials to reach the learning criterion of10 of 12 consecutive trials correct (mean ± SD ¼ 55.00 ± 24.29,N ¼ 10). For the 10 robins that passed the task, there was a strongcorrelation between the number of times that they flipped theincorrect lid during their first three sessions (45 test trials) and thenumber of trials that they required to pass the task (Spearman rankcorrelation: rS ¼ 0.832, N ¼ 10, P ¼ 0.003). This relationship alsoheld when the two birds that completed 120 trials without passingthe task were included in the analysis (Spearman rank correlation:rS ¼ 0.676, N ¼ 12, P ¼ 0.016).
To enable us to include all 17 robins in subsequent analyses, weused the number of errors made during the first 45 trials of the taskas a performance measure. During the initial 45 trials, the numberof trials inwhich robins flipped the incorrect lid ranged between 13and 25 (mean ± SD ¼ 19.41 ± 3.71, N ¼ 17).
Motivation and Neophobia
All robins took a mealworm from the scale both before and afterevery test session, suggesting that they remained motivated forfood rewards throughout all test sessions. For each robin wecalculated a mean weight from all weight measurements takenduring the experiment. This mean weight ± SD ranged between25.5 ± 1.2 g for the lightest bird and 30.9 ± 0.7 g for the heaviest(mean ± SD ¼ 29.0 ± 1.2 g, N ¼ 19; one bird never learned to hopslowly enough onto the scale to record his weight). There were nosignificant correlations between the robins' meanweights and theirperformances in any of the tasks (0.216 > P < 0.909; Bonferronicorrected a ¼ 0.008 for the six comparisons). We also had tarsusmeasurements for 11 robins; we found no significant correlationsbetween body condition (defined as the ratio of the body mass totarsus length; Cauchard et al., 2013) and performances in any of thetasks except colour discrimination (Spearman rank correlation:rS ¼ �0.770, N ¼ 11, P ¼ 0.006; for the other correlations0.316 > P < 0.935). However, when we removed one bird with acolour preference for red from this analysis (see Fig. 2; these birdsoutperformed all others), the correlation was no longer significant(Spearman rank correlation: rS ¼ �0.693, N ¼ 10, P ¼ 0.026; Bon-ferroni corrected a ¼ 0.008).
When approaching a novel apparatus for the first time, thequickest robin took a mean ± SD of 3.2 ± 1.9 s while the slowestrobin took 21.4 ± 17.6 s. Heavier robins were on average slower toapproach novel objects (Spearman rank correlation: rS ¼ 0.518,N ¼ 19, P ¼ 0.023), but this correlation did not hold for body con-dition (Spearman rank correlation: rS ¼ 0.495, N ¼ 11, P ¼ 0.122).The robins' mean latency to approach new apparatuses was notsignificantly correlated with performance measures for any of thetasks (0.186 > P < 0.977; Bonferroni corrected a ¼ 0.008 for the sixcomparisons).
Relationships Between Individual Performances Across Tasks
Individual performances were positively correlated in the ma-jority (11/15) of pairwise comparisons (Table 2). However, none ofthese correlations were significant (Bonferroni corrected

Table 2Spearman rank correlation matrix of all cognitive task performances
Motor task Colour discrimination Colour reversal Symbol discrimination Spatial memory
Colour discrimination rS 0.016P 0.948N 20
Colour reversal rS �0.032 0.294P 0.895 0.208N 20 20
Symbol discrimination rS 0.412 0.124 0.130P 0.101 0.635 0.618N 17 17 17
Spatial memory rS �0.178 0.273 0.314 �0.034P 0.465 0.258 0.190 0.902N 19 19 19 16
Inhibitory control rS �0.008 0.253 0.380 0.106 0.314P 0.972 0.282 0.099 0.685 0.190N 20 20 20 17 19
R. C. Shaw et al. / Animal Behaviour 109 (2015) 101e111 107
a ¼ 0.003). The directional pattern of correlations remained largelyconsistent when only the performances of the 16 robins thatcompleted all tasks were analysed (Appendix Table A1).
Variance in Cognitive Test Battery Performance
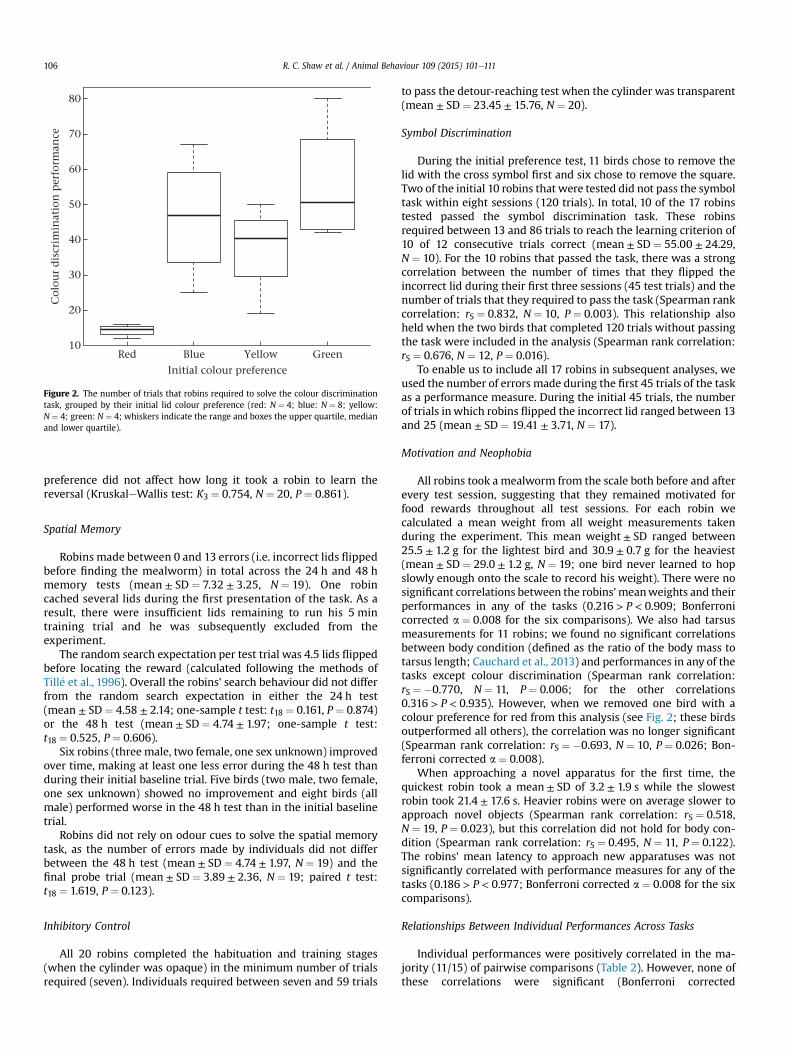
For the PCA of the performances of the 16 robins that partici-pated in all tasks, two components were extractedwith eigenvalues>1. All task performances loaded positively onto the first compo-nent, albeit weakly for the motor task and symbol discriminationtask (Table 3). This pattern of factor loadings was highly unlikely tooccur at random. In 10 000 random simulations, only 0.0048% had alarger mean loading on the first component extracted in the PCA(Fig. 3a) and only 0.0056% had a smaller standard deviation for thefirst component loadings (Fig. 3b). The first component extractedfrom the PCA explained 34.46% of the total variance in the taskperformances of the 16 robins. Performances in the motor task andsymbol discrimination loaded positively on the second component,which captured a further 24.44% of the variance.
In the spatial memory task there was no clear evidence thatrobins learned the relevant spatial cue (see Spatial Memory resultsabove). This does not preclude the possibility that robins utilizedspatial memory in the task, but it remains unclear whether the taskprovides an informative cognitive measure. We therefore ran anadditional PCA from which we excluded the spatial memory task.The results were consistent with the PCA including all tasks(Table 3).
In the colour discrimination task, robins that initially preferredthe red lid (and hence had the blue lid rewarded in the test) were by
Table 3Results of the unrotated principal components analysis for the robins that completed alltasks but excluding the robins with a red preference in the colour preference test (N ¼ 1(N ¼ 13)
Task All tasks Excluding the spmemory task
PC1 PC2 PC1
Motor task 0.231 0.887 0.435Colour discrimination 0.660 0.084 0.632Colour reversal 0.631 �0.274 0.569Symbol discrimination 0.411 0.673 0.648Spatial memory 0.727 �0.184 e
Inhibitory control 0.695 �0.333 0.612Eigenvalue 2.067 1.466 1.723% Variance explained 34.46 24.44 34.47
The loadings and percentage of variance explained for each principal component (PC) w
far the fastest to solve the task (Fig. 2). This result suggests thatrewarding blue lids may have biased these birds' performances inthe colour discrimination task. We therefore ran an additional PCAfrom which we excluded those birds that chose the red lid in thecolour preference test (N ¼ 13). This produced results that wereconsistent with the PCA including all 16 individuals (Table 3).
Finally, motor task performancemay have been influenced by anindividual's prior experience, as robins typically turn over leaves asthey forage for invertebrate prey in leaf litter (Hunt et al., 2008). Wetherefore conducted a PCA on a more conservative data set ofcognitive performances, which excluded birdswith a preference forred, as well as the performance scores from the motor task. Twoeigenvalues >1 were extracted and the factor loadings of the taskswere consistent with the other PCA analyses. However, the firstcomponent now explained 45.69% of the data (Table 3).
DISCUSSION
We investigated individual variation in the cognitive perfor-mances of 20 wild North Island robins. Robins voluntarily partici-pated in a test battery comprising six tasks: a motor task, colourdiscrimination and reversal learning, symbol discrimination,spatial memory and inhibitory control. Individuals differed greatlyin their ability to solve these tasks. For the 16 robins that completedall tasks, we found weak, nonsignificant positive correlations be-tween most task performances. In human psychometric testing,individuals' test scores are positively correlated across tasksassessing several cognitive domains, with a general factor typicallyaccounting for 40% of total variance (Deary et al., 2006; Plomin,
tasks (N ¼ 16), for all robins but excluding the spatial memory task (N ¼ 16), for all3) and excluding the motor task performances and robins with a preference for red
atial Excluding robins withred preference
Excludingmotor task andred preference
PC2 PC1 PC2 PC1 PC2
0.804 0.199 0.879 e e
�0.082 0.735 0.367 0.690 0.427�0.487 0.682 �0.344 0.713 �0.3090.471 0.426 0.590 0.362 0.795
e 0.749 �0.139 0.759 �0.147�0.556 0.717 �0.497 0.770 �0.3251.421 2.302 1.641 2.284 1.038
28.42 38.36 27.35 45.69 20.77
ith an eigenvalue >1 are shown. Loadings >0.6 are in bold.
0
500
1000
1500
2000
2500
3000
0.2 0.6 0.8
(a)
(b)
0−0.4 −0.2 0 0.2 0.4 0.6
500
1000
1500
Freq
uen
cy −0.6
Mean loading on PC1
0.4
Standard deviation of the loadings on PC1
Figure 3. Histograms of (a) the mean factor loadings and (b) the standard deviation ofthe factor loadings for the first unrotated component extracted in the 10 000 randomPCA simulations. The observed (a) mean and (b) standard deviation for the firstcomponent loadings for our data are indicated by the arrows.
R. C. Shaw et al. / Animal Behaviour 109 (2015) 101e111108
2001). In the PCA of 16 robins' performances, all tasks loadedpositively on the first component extracted with an eigenvalue >1and this component captured over 34% of the total variance in taskperformance. Our results are consistent with those of previousstudies that have been claimed as evidence for g in nonhumananimals (e.g. Galsworthy et al., 2005; Isden et al., 2013; Matzel et al.,2003). However, in contrast to these previous nonhuman studies,we provided additional support for our conclusions by testing ourPCA results against 10 000 random simulations. The resultsdemonstrated that it is highly unlikely that our finding of all tasksuniformly and positively loading on the first component extractedis a randomoccurrence. Thuswe provide the first evidence for g in afood-caching species.
It has been suggested that g loadings are higher for those tasksthat are more ‘cognitively complex’ (Plomin, 2001). Interestingly,the task with the lowest loading on the first component extractedwas the motor task in our test battery. A low g loading is consis-tent with the suggestion that the motor task is unlikely to be a
good measure of cognitive ability for an insectivorous litter-foraging species (Boogert, Anderson, et al., 2011), as priorforaging experience may have influenced robins' learning per-formance in this task. Indeed, removing the performance scoresfor the motor task from the PCA increased the amount of varianceexplained by the first component extracted to almost 46%. Addi-tionally, the lack of positive correlations with other task perfor-mances could be further evidence that motor task performance isstrongly influenced by prior experience in wild birds (Boogert,Anderson, et al., 2011).
Our finding that robins presented with rewarded blue lids in thecolour discrimination task outperformed all other robins validatesexisting concerns regarding the use of colour cues in cognitive testsof animals whose prior experience of particular colours is unknown(see Rowe & Healy, 2014 for a detailed critique). Blue is not acommonly occurring colour in New Zealand forest flora and fauna,while red, green and yellow are much more prevalent. Blue mightthus bemore salient in the natural setting wherewe carried out ourtests and robins have neophilic tendencies which may attract themto this novel colour cue. For any future colour discrimination taskson robins we would advocate the use of greyscale cues, as this mayhelp to reduce such confounding effects on learning performance(Rowe & Healy, 2014).
Reversal learning tasks require an animal to stop respondingto a previously rewarded stimulus and switch its responses to apreviously unrewarded stimulus (Bond et al., 2007). By contrast,in discrimination tasks there is no (known) previous history ofreinforcement that the animal must overcome to learn thereward contingencies. It is therefore unsurprising that the robinsrequired more trials to learn the colour reversal than they did forthe original colour discrimination task. This pattern has also beenfound for song sparrows (Boogert, Anderson, et al., 2011), corvids(Bond et al., 2007), Darwin's finches (Tebbich et al., 2010) andspotted bowerbirds (Isden et al., 2013). Reversal learning hasbeen argued to provide a measure of inhibitory control (Bondet al., 2007), as animals are required to inhibit a previouslyrewarded response to learn the reversed contingency. Indeed,our results provide evidence that inhibitory control may be animportant component of reversal learning in robins, as therobins' performance in the reversal task was positively correlatedwith performance in the detour-reaching task (although notsignificantly so).
The symbol discrimination took longer for the robins to learnthan the colour discrimination. The symbol stimuli that we usedwere matched in all aspects except the arrangement of the lines.Thus the birds may have been slower to learn the reward con-tingency because there were perceptual or attentional con-straints related to the symbol design (e.g. some robins may nothave perceived the symbols as being markedly different, or thedifferences were insufficiently salient to capture robins' atten-tion). However, Isden et al. (2013) used block symbols (ratherthan lines) and also found that spotted bowerbirds took longer tolearn the symbol discrimination than a colour discriminationtask. Additionally, in a previous study of avoidance learning inchicks, Gallus gallus domesticus, birds attended to the coloration,rather than the black pattern, of an aposematic stimulus thatcontained both colour and pattern (Aronsson & Gamberale-Stille,2008), while a study of ‘sameedifferent’ conditional discrimi-nation in pigeons found that birds performed worse in transfertests that used shape stimuli than in those that used colourstimuli (Cook, Cavoto, & Cavoto, 1995). Taken together with ourown results, these studies suggest that avian symbol discrimi-nation task performances may be strongly affected by factorssuch as perception and attention. It is particularly interestingthat the robins' symbol task performance in our study was

R. C. Shaw et al. / Animal Behaviour 109 (2015) 101e111 109
loaded on the second component extracted. This is potentiallyfurther evidence that symbol discrimination performance wasinfluenced by cognitive factors different from those that affectedperformance on the four tasks that loaded heavily on the firstprincipal component extracted. These additional cognitive pro-cesses may have been attentional, perceptual, or a combinationof both.
Robin caching behaviour peaks outside the breeding season(Steer & Burns, 2008). As we ran our test battery outside thebreeding season, our expectation was that robins would performwell at memorizing spatial locations. Six robins made fewer errorsover time in the spatial memory test, suggesting they may havememorized the spatial location. However, at the group level therewas no evidence that the robins' search behaviour deviated from arandom search expectation. In a previous study of avian spatialmemory, song sparrows made fewer errors over time as theysearched for a single reward in one of six possible locations over 8consecutive days, suggesting that they had learned the spatial cue(Sewall et al., 2013). It is unclear whether our protocol, which ranfor only 3 days, allowed sufficient trials for the robins to memorizethe spatial location of the reward. Additionally, the size of thespatial grid may have been a factor in the robins' poor performancein this task, as robins typically cache in branchetrunk axils andprevious experiments have shown that these caches are spacedapproximately 6 m apart on average (Van Horik & Burns, 2007).Thus the foraging grid may have been at a scale that was inap-propriate if robins' spatial memory is optimized to recall widelyspaced cache sites. For future studies of robin spatial memory wewould advocate running the task over additional days andincreasing the distance between spatial locations.
A previous study of food-storing birds found that spatialmemory, which is reliant on hippocampal function, was impairedby developmental nutritional deficits, while associative learningfor colour cues was not, suggesting that these are distinct cogni-tive processes (Pravosudov et al., 2005). By contrast, in our studywe found that spatial memory performance loaded on the samecomponent as colour discrimination performance, rather than adifferent component as might be expected if the cognitive pro-cesses required for these tasks differed. It is possible that ourprotocol did not enable robins to utilize spatial memory for thereasons described above. Conceivably robins may have reliedsolely on very subtle visual cues to solve the task, which wouldexplain why their performance on this task did not load on aseparate principal component in our analyses. This issue thusrequires further study.
Motivational factors have the potential to greatly influence in-dividual performance in a cognitive task (Rowe& Healy, 2014). Thisis particularly problematic in the wild, where it is exceedinglydifficult to standardize levels of motivation between individualsparticipating in cognitive experiments (Boogert et al., 2010; Isdenet al., 2013). The authors of the bowerbird study suggested thatlack of motivation may have played a role in the poor performanceof males in some tasks (Isden et al., 2013). However, in our studymotivational differences may account for less of the interindividualvariation in task performances. As a caching species (Steer& Burns,2008; Van Horik & Burns, 2007), robins may remain consistentlymotivated for food rewards even when satiated. Indeed, manyrobins switched from eating to storing food for later consumptionduring test sessions. Moreover, all robins always took food duringour motivation checks at the end of each test session. However, wecannot conclude from this that other noncognitive factors, such asprevious experience or hormonal status, had little or no influenceon a robin's task performances.
In common with previous avian test batteries (Boogert,Anderson, et al., 2011; Isden et al., 2013), our study included tests
of various types of learning, as well as inhibitory control. In futuretest batteries it would be worth testing additional cognitive do-mains (e.g. social cognition) and incorporating additional types oftask. A recent meta-analysis of test battery data from captive apesfound no evidence of a general intelligence factor (Herrmann &Call, 2012). Instead, tasks requiring inferential reasoning clusteredtogether, while those that were learning based formed a distinctcluster (Herrmann & Call, 2012). Tasks requiring inference havepreviously been implemented for captive caching birds (e.g. Shawet al., 2013). Adapting such protocols for use with wild birdswould allow for the inclusion of inference-based tasks in future testbatteries, thereby adding to our current understanding of thestructure of avian intelligence. The development of an aviancognitive test battery is still in its early stages and our study buildson pioneering work (e.g. Boogert, Anderson, et al., 2011; Isden et al.,2013). As we have highlighted, there is still ample scope for fine-tuning field-based avian cognitive test methodologies. None theless, our results provide some of the first evidence that a factoranalogous to human g may underpin cognitive performance in afood-caching bird.
Acknowledgments
This research was funded by a Fast-Start grant from theMarsden Fund of the Royal Society of New Zealand (VUW1304)and a Rutherford Foundation New Zealand Postdoctoral Fellow-ship to R.C.S. We thank Raewyn Empson and the Karori WildlifeSanctuary Trust for permission to work at Zealandia WildlifeSanctuary. We thank Annette Harvey and Matu Booth for adviceand assistance with banding robins, Neville Higgison and ShaunGraham for apparatus construction, Edith Woischin for assistancewith Fig. 1 and Michael Corballis for discussion and statisticaladvice.
References
Amici, F., Barney, B., Johnson, V. E., Call, J., & Aureli, F. (2012). A modular mind? Atest using individual data from seven primate species. PLoS One, 7, e51918.
Aronsson, M., & Gamberale-Stille, G. (2008). Domestic chicks primarily attend tocolour, not pattern, when learning an aposematic coloration. Animal Behaviour,75, 417e423.
Banerjee, K., Chabris, C. F., Johnson, V. E., Lee, J. J., Tsao, F., & Hauser, M. D. (2009).General intelligence in another primate: individual differences across cognitivetask performance in a New World monkey (Saguinus oedipus). PLoS One, 4,e5883.
Bond, A. B., Kamil, A. C., & Balda, R. P. (2007). Serial reversal learning and theevolution of behavioral flexibility in three species of North American corvids(Gymnorhinus cyanocephalus, Nucifraga columbiana, Aphelocoma californica).Journal of Comparative Psychology, 121, 372e379.
Boogert, N. J., Anderson, R. C., Peters, S., Searcy, W. A., & Nowicki, S. (2011). Songrepertoire size in male song sparrows correlates with detour reaching, but notwith other cognitive measures. Animal Behaviour, 81, 1209e1216.
Boogert, N. J., Fawcett, T. W., & Lefebvre, L. (2011). Mate choice for cognitive traits: areview of the evidence in nonhuman vertebrates. Behavioral Ecology, 22,447e459.
Boogert, N. J., Giraldeau, L.-A., & Lefebvre, L. (2008). Song complexity correlates withlearning ability in zebra finch males. Animal Behaviour, 76, 1735e1741.
Boogert, N. J., Monceau, K., & Lefebvre, L. (2010). A field test of behavioural flexibilityin Zenaida doves (Zenaida aurita). Behavioural Processes, 85, 135e141.
Bossema, I. (1979). Jays and oaks: an eco-ethological study of a symbiosis. Behav-iour, 70, 1e117.
Bouchard, J., Goodyer, W., & Lefebvre, L. (2007). Social learning and innovation arepositively correlated in pigeons (Columba livia). Animal Cognition, 10,259e266.
Burns, K. C., & Steer, J. (2006). Dominance rank influences food hoarding in NewZealand Robins Petroica australis. Ibis, 148, 266e272.
Cauchard, L., Boogert, N. J., Lefebvre, L., Dubois, F., & Doligez, B. (2013). Problem-solving performance is correlated with reproductive success in a wild birdpopulation. Animal Behaviour, 85, 19e26.
Chandra, S. B., Hosler, J. S., & Smith, B. H. (2000). Heritable variation for latent in-hibition and its correlation with reversal learning in honeybees (Apis mellifera).Journal of Comparative Psychology, 114, 86e97.

R. C. Shaw et al. / Animal Behaviour 109 (2015) 101e111110
Cheke, L. G., Bird, C. D., & Clayton, N. S. (2011). Tool-use and instrumentallearning in the Eurasian jay (Garrulus glandarius). Animal Cognition, 14,441e455.
Cheke, L. G., & Clayton, N. S. (2012). Eurasian jays (Garrulus glandarius) overcometheir current desires to anticipate two distinct future needs and plan for themappropriately. Biology Letters, 8, 171e175.
Cole, E. F., Morand-Ferron, J., Hinks, A. E., & Quinn, J. L. (2012). Cognitive abilityinfluences reproductive life history variation in the wild. Current Biology, 22,1808e1812.
Cook, R., Cavoto, K., & Cavoto, B. (1995). Same-different texture discrimination andconcept learning by pigeons. Journal of Experimental Psychology: AnimalBehavior Processes, 21, 253e260.
Deary, I. J., Penke, L., & Johnson, W. (2010). The neuroscience of human intelligencedifferences. Nature Reviews Neuroscience, 11, 201e211.
Deary, I. J., Spinath, F. M., & Bates, T. C. (2006). Genetics of intelligence. EuropeanJournal of Human Genetics, 14, 690e700.
Galsworthy, M. J., Paya-Cano, J. L., Liu, L., Monle�on, S., Gregoryan, G.,Fernandes, C., et al. (2005). Assessing reliability, heritability and generalcognitive ability in a battery of cognitive tasks for laboratory mice. BehaviorGenetics, 35, 675e692.
Garland, A., Low, J., Armstrong, N., & Burns, K. C. (2014). Wild robins (Petroicalongipes) respond to human gaze. Animal Cognition, 17, 1149e1156.
Garland, A., Low, J., & Burns, K. C. (2012). Large quantity discrimination by NorthIsland robins (Petroica longipes). Animal Cognition, 15, 1129e1140.
Hauser, M. D. (1999). Perseveration, inhibition and the prefrontal cortex: a newlook. Current Opinion in Neurobiology, 9, 214e222.
Herrmann, E., & Call, J. (2012). Are there geniuses among the apes? PhilosophicalTransactions of the Royal Society B: Biological Sciences, 367, 2753e2761.
Herrmann, E., Call, J., Hern�andez-Lloreda, M. V., Hare, B., & Tomasello, M. (2007).Humans have evolved specialized skills of social cognition: the cultural intel-ligence hypothesis. Science, 317, 1360e1366.
Hunt, S., Low, J., & Burns, K. C. (2008). Adaptive numerical competency in a food-hoarding songbird. Proceedings of the Royal Society B: Biological Sciences, 275,2373e2379.
Isden, J., Panayi, C., Dingle, C., & Madden, J. (2013). Performance in cognitive andproblem-solving tasks in male spotted bowerbirds does not correlate withmating success. Animal Behaviour, 86, 829e838.
Keagy, J., Savard, J.-F., & Borgia, G. (2009). Male satin bowerbird problem-solvingability predicts mating success. Animal Behaviour, 78, 809e817.
Keagy, J., Savard, J.-F., & Borgia, G. (2011). Complex relationship between multiplemeasures of cognitive ability and male mating success in satin bowerbirds,Ptilonorhynchus violaceus. Animal Behaviour, 81, 1063e1070.
Kembel, S., Ackerly, D., Blomberg, S., Cornwell, W., Cowan, P., Helmus, M., et al.(2014). Picante: R tools for integrating phylogenies and ecology. Retrieved fromhttp://www.proesa.org.co/CRAN/web/packages/picante/picante.pdf.
Locurto, C., Fortin, E., & Sullivan, R. (2003). The structure of individual differences inheterogeneous stock mice across problem types and motivational systems.Genes, Brain and Behavior, 2, 40e55.
MacLean, E. L., Hare, B., Nunn, C. L., Addessi, E., Amici, F., Anderson, R. C., et al.(2014). The evolution of self-control. Proceedings of the National Academy ofSciences of the United States of America, 111, E2140eE2148.
Maloney, R. F., & Mclean, I. G. (1995). Historical and experimental learnedpredator recognition in free-living New Zealand robins. Animal Behaviour, 50,1193e1201.
Matzel, L. D., Han, Y. R., Grossman, H., Karnik, M. S., Patel, D., Scott, N., et al. (2003).Individual differences in the expression of a ‘general’ learning ability in mice.The Journal of Neuroscience, 23, 6423e6433.
Table A1Spearman rank correlation matrices of cognitive task performances for the 16 robins tha
Motor task Colour discrimination
Colour discrimination rS 0.237P 0.377N 16
Colour reversal rS �0.073 0.396P 0.788 0.129N 16 16
Symbol discrimination rS 0.502 0.059P 0.048 0.829N 16 16
Spatial memory rS 0.064 0.371P 0.812 0.157N 16 16
Inhibitory control rS �0.089 0.302P 0.744 0.255N 16 16
McGavin, S. (2009). Density and pair fidelity in a translocated population of NorthIsland robin (Petroica longipes). Notornis, 56, 206e212.
Ostoji�c, L., Shaw, R. C., Cheke, L. G., & Clayton, N. S. (2013). Evidence suggestingthat desire-state attribution may govern food sharing in Eurasian jays. Pro-ceedings of the National Academy of Sciences of the United States of America,110, 4123e4128.
Plomin, R. (2001). The genetics of g in human and mouse. Nature Reviews Neuro-science, 2, 136e141.
Plomin, R., & Spinath, F. M. (2002). Genetics and general cognitive ability (g). Trendsin Cognitive Sciences, 6, 169e176.
Pravosudov, V. V., Lavenex, P., & Omanska, A. (2005). Nutritional deficits duringearly development affect hippocampal structure and spatial memory later inlife. Behavioral Neuroscience, 119, 1368e1374.
Rowe, C., & Healy, S. D. (2014). Measuring variation in cognition. Behavioral Ecology,25, 1287e1292.
Sanford, K., & Clayton, N. S. (2008). Motivation and memory in zebra finch (Tae-niopygia guttata) foraging behavior. Animal Cognition, 11, 189e198.
Schmitt, V., Pankau, B., & Fischer, J. (2012). Old world monkeys compare to apes inthe primate cognition test battery. PLoS One, 7, e32024.
Sewall, K. B., Soha, J., Peters, S., & Nowicki, S. (2013). Potential trade-off betweenvocal ornamentation and spatial ability in a songbird. Biology Letters, 9,20130344.
Shaw, R. C., & Clayton, N. S. (2013). Careful cachers and prying pilferers: Eurasianjays (Garrulus glandarius) limit auditory information available to competitors.Proceedings of the Royal Society B: Biological Sciences, 280, 20122238.
Shaw, R. C., Plotnik, J. M., & Clayton, N. S. (2013). Exclusion in corvids: the perfor-mance of food-caching Eurasian jays (Garrulus glandarius). Journal of Compar-ative Psychology, 127, 428e435.
Shettleworth, S. J. (2010). Cognition, evolution, and behaviour (2nd ed.). Oxford, U.K.:Oxford University Press.
Smulders, T. V., Gould, K. L., & Leaver, L. A. (2010). Using ecology to guide the studyof cognitive and neural mechanisms of different aspects of spatial memory infood-hoarding animals. Philosophical Transactions of the Royal Society of London.Series B, Biological Sciences, 365, 883e900.
Steer, J., & Burns, K. C. (2008). Seasonal variation in male-female competition,cooperation and selfish hoarding in a monogamous songbird. Behavioral Ecol-ogy and Sociobiology, 62, 1175e1183.
Tebbich, S., Sterelny, K., & Teschke, I. (2010). The tale of the finch: adaptive radiationand behavioural flexibility. Philosophical Transactions of the Royal Society ofLondon. Series B, Biological Sciences, 365, 1099e1109.
Thornton, A. (2014). How and why are some species so smart? A comment on Roweand Healy. Behavioral Ecology, 25, 1294e1295.
Thornton, A., Isden, J., & Madden, J. R. (2014). Toward wild psychometrics:linking individual cognitive differences to fitness. Behavioral Ecology, 25,1299e1301.
Thornton, A., & Lukas, D. (2012). Individual variation in cognitive performance:developmental and evolutionary perspectives. Philosophical Transactions of theRoyal Society of London. Series B, Biological Sciences, 367, 2773e2783.
Till�e, Y., Newman, J. A., & Healy, S. D. (1996). New tests for departures from randombehavior in spatial memory experiments. Animal Learning & Behavior, 24,327e340.
Van Horik, J., & Burns, K. C. (2007). Cache spacing patterns and reciprocal cachetheft in New Zealand robins. Animal Behaviour, 73, 1043e1049.
Appendix
t completed all tasks
Colour reversal Symbol discrimination Spatial memory
0.1650.541
160.456 �0.0340.076 0.902
16 160.411 0.079 0.4620.114 0.771 0.072
16 16 16

Figure A1. The position of the lid relative to the well in levels 1e4 of the novel motor task.
R. C. Shaw et al. / Animal Behaviour 109 (2015) 101e111 111