WIDER Working Paper 2020/101
41
WIDER Working Paper 2020/101 Transitions between informal and formal jobs in India Patterns, correlates, and consequences Rajesh Raj Natarajan, 1* Simone Schotte, 2 and Kunal Sen 2,3 August 2020
Transcript of WIDER Working Paper 2020/101

WIDER Working Paper 2020/101
Transitions between informal and formal jobs in India
Patterns, correlates, and consequences
Rajesh Raj Natarajan,1* Simone Schotte,2 and Kunal Sen2,3
August 2020

1 Sikkim University, Gangtok, Sikkim, India; 2 UNU-WIDER, Helsinki, Finland; 3 The University of Manchester, Manchester, UK. * Corresponding author: [email protected].
This study has been prepared within the UNU-WIDER project Transforming informal work and livelihoods.
Copyright © UNU-WIDER 2020
Information and requests: [email protected]
ISSN 1798-7237 ISBN 978-92-9256-858-0
https://doi.org/10.35188/UNU-WIDER/2020/858-0
Typescript prepared by Ayesha Chari.
The United Nations University World Institute for Development Economics Research provides economic analysis and policy advice with the aim of promoting sustainable and equitable development. The Institute began operations in 1985 in Helsinki, Finland, as the first research and training centre of the United Nations University. Today it is a unique blend of think tank, research institute, and UN agency—providing a range of services from policy advice to governments as well as freely available original research.
The Institute is funded through income from an endowment fund with additional contributions to its work programme from Finland, Sweden, and the United Kingdom as well as earmarked contributions for specific projects from a variety of donors.
Katajanokanlaituri 6 B, 00160 Helsinki, Finland
The views expressed in this paper are those of the author(s), and do not necessarily reflect the views of the Institute or the United Nations University, nor the programme/project donors.
Abstract: The Indian labour market is characterized by a high level of informality, with large numbers of workers in poorly paid ‘lower-tier’ informal jobs, and somewhat better paid ‘upper-tier’ informal jobs, which do not have the same benefits and security of tenure as formal jobs. We examine the likelihood of individuals moving up from informal jobs to formal jobs (and vice versa) and from lower-tier to upper-tier informal jobs using a longitudinal dataset for India. We find that self-employed workers exhibit relatively more mobility than wage workers. Among wage workers, we find high persistence rates for formal wage employed and lower-tier informal wage employed. As expected, our results suggest substantial income gains for workers experiencing upward transition. Our results also suggest that lower-tier informal workers, whether in self-employment or wage employment, have limited upward transition possibilities, and are in a ‘dead-end’ work status.
Key words: informal, formal, lower tier, upper tier, work status, India
JEL classification: J21, J62, O17
Acknowledgements: An earlier version of this paper was presented at an internal seminar of UNU-WIDER held on 28 May 2020. The authors are grateful to the participants at the seminar for their constructive comments on the paper. This paper was prepared when the first author was a Visiting Scholar at UNU-WIDER during March–May 2020. He is grateful to all UNU-WIDER colleagues for their assistance and hospitality in making his stay in Helsinki a pleasant one.

1
1 Introduction
One of the most salient features of the economies of developing countries is the existence of a large informal sector. In the classical accounts of development, the resilience of the informal economy in developing economies was attributed to insufficient levels of growth (Loayza et al. 2006), and the informal economy would vanish when economic growth prevailed (Chen 2012). Yet, the informal economy continues to be a highly persistent and ubiquitous phenomenon in many developing countries despite high growth (Stuart et al. 2018). Recent estimates suggest that informal economy in emerging and developing countries accounts for more than 93 per cent of total global informal employment and more than 82 per cent of economic units, with Sub-Saharan Africa and South Asia being the largest contributors (ILO 2018). The trend towards informalization is only expected to escalate in the future thanks to premature deindustrialization and the rise of activities of the informal service sector in these developing regions, especially South Asia.1
The earlier literature on the subject viewed the informal economy as a ‘monolithic’ bloc where all those without access to the formal sector find themselves in (Ranis and Stewart 1999; La Porta and Shleifer 2014). More recent studies have highlighted the heterogeneous nature of the informal economy, recognizing the inherent duality in both self-employment and wage employment (Chaudhuri and Mukhopadhyay 2010; Günther and Launov 2012; Harati 2013; Kanbur 2017; Canelas 2019). In informal self-employment, a distinction can be made between employers: that is, enterprises that employ hired workers and are relatively productive and own-account enterprises that use family labour and are involved in subsistence activities (Chen 2006). In informal wage employment, there may be workers with better paid jobs with some de facto benefits, although not with the same security of tenure and social security benefits as formal wage jobs, co-existing with those with poorly paid jobs in manual work such as in farms and construction sites, where informal employment is a last resort job to avoid unemployment (Fields 2014). Thus, empirical studies of informal labour markets in developing countries characterize them as two-tiered, with informal workers being in ‘lower-tier’ or ‘upper-tier’ self-/wage employment (Fields 2005, 2019).
Among developing countries, India has the largest number of informal workers and a very high proportion of informal workers in the total workforce, at 83.5 per cent in 2017–18 (NSSO 2019). The persistence of informality in India has been a puzzling feature of India’s economic development pathway, given the rapid growth of the Indian economy since the early 1990s (Raj and Sen 2016; Bardhan 2018). Further, the persistence of informality in India makes the country ‘atypical’ among fast-growing Asian economies, most of which have seen a decline in the size of the informal sector in recent decades (McCaig and Pavcnik 2018). In addition, several studies have documented the heterogeneous nature of India’s labour market and that both the self-employed and the wage employed in informal work have upper-tier and lower-tier segments in India (see, in particular, NCEUS 2007; Kannan and Papola 2007). In this paper, we ask: how likely is it for informal workers to transition to formal jobs, and are reverse transitions possible? Do mobility patterns differ between self-employed and wage workers? Does lower-tier informal work provide a pathway for a better paid job? Or is it a dead-end activity, with very limited possibility for upward mobility? How are education, caste, gender, and location of workers associated with mobility? And what are the implications of transitions in informal and formal work status for income gains or losses? We examine the patterns, correlates, and consequences of worker transition, both from
1 The estimates by Charmes (2016) shows that the share of informal workforce (as share of non-agricultural workforce) in Southern and South-East Asia has increased from 53 per cent in the late 1980s to 70 per cent in the late 2000s.

2
informal to formal jobs and from lower-tier to upper-tier informal jobs, using a unique longitudinal dataset for over 37,000 workers drawn from the India Human Development Survey (IHDS) of 2004–05 and 2011–12 (IHDS-1 and IHDS-2, respectively) conducted by National Council of Applied Economic Research and University of Maryland (see IHDS 2020).
There is a large existing scholarship on the informal sector in India, which has looked at both self-employment and wage employment. Studies focusing on self-employment have examined the productivity implications of household and non-household enterprises (Marjit and Kar 2011; Kathuria et al. 2013; Mazumdar and Sarkar 2013; Raj and Sen 2016; Banerji et al. 2016; Raj and Sen 2020). Studies focusing on wage employment have tried to understand whether government regulations (such as labour laws) can explain why a formal firm may use informal workers instead of formal workers, the relationship between wage employment and poverty, and the conditions of work among informal wage workers (Unni 1998; Unni and Rani 2003; Besley and Burgess 2004; NCEUS 2009; Saha et al. 2013; Barnes 2015; Kathuria and Raj 2016). However, these studies do not examine the likelihood that workers can transition from one work status to another, as they mostly use repeated cross-sectional surveys of the National Sample Survey Office, in New Delhi, India.2 By using a nationally representative panel of workers, in both formal and informal jobs, over the period 2002–05 to 2011–12, and by implementing a classification of the work status of these workers (discussed in Section 2), we are able to provide a rich characterization of the trajectories of workers across different tiers of the Indian labour market. The period of our analysis also coincides with the high growth episode of the Indian economy, when the average annual growth in gross domestic product was 8.4 per cent, the highest in the post-independence period, which allows us to examine whether India’s rapid growth led to more informal workers moving to the formal sector as well as to increases in their earnings.
In the empirical analysis, we first document the transition probabilities of individuals across different work status. We then estimate multinomial logit models to examine the extent to which status choices and transition rates are correlated with individual and household level characteristics, such as gender, age, education, geographic location, and social group. Finally, we estimate earnings equations to provide a quantitative assessment of the change in earnings that may occur when a worker moves from one work status to another.
Our results based on transition analysis suggest that self-employed workers exhibit relatively more mobility than wage workers. The movement out of existing status is more pronounced among formal self-employed workers and a majority of them transition downward into the lower-tier of the informal sector. Among the wage workers, we find high persistence rates for formal wage employed and lower-tier informal wage employed. The higher churn rate among the upper-tier informal wage employed does offer some evidence towards upward mobility, with workers transitioning into formal wage employment. However, we also find significant risk of downward mobility, with upper-tier informal salaried workers going into lower-tier informal employment. We also find that women, lower castes, less educated, and rural workers are less likely to move upwards in work status. As expected, our results do suggest substantial income gains for workers experiencing upward transition. Overall, our results suggest that lower-tier informal workers, whether in self- or wage employment, have limited upward transition possibilities and are in a ‘dead-end’ work status.
The rest of the paper is divided into five sections. Section 2 presents a framework of analysis for the Indian labour market, considering the two-tiered nature of informal work. Section 3 presents
2 These are the Employment and Unemployment Survey and the Unincorporated Non-Agricultural Enterprises Survey.

3
the data and definitions of various employment status identified in the study, and discusses the methods used to analyse employment and income dynamics. In Section 4, we first look at the composition of employment by work status and worker characteristics. We then investigate the flow of workers between different work status using transition matrices. The results we obtain from our econometric analysis are presented and discussed in Section 5. Section 6 concludes.
2 Multi-tiered labour markets in India
In this section, we propose a simple schema that takes into account the multi-tiered nature of labour markets in developing countries. We then apply it to the Indian context.
2.1 Work status definition
The early literature on modelling labour markets in developing countries characterized the dualism inherent in these labour markets in terms of two sectors or ‘work status’: a formal sector, which offers relatively attractive wages and other terms and conditions of employment, and an informal sector, which offers relatively unattractive pay and conditions of employment (Fields 2007).3 More recent literature has pointed out the multi-sectoral nature of labour markets in developing countries, with two important dimensions. First, workers can be in either wage employment or self-employment, which exist in both the formal and the informal sector.4 Second, the informal sector is characterized by its own internal duality, where both wage employed and self-employed workers can be in upper-tier or lower-tier work status.
Our first task is to classify the workers into formal and informal work. There is a lack of consensus in the literature on how informality should be defined and measured empirically. This has led to scholars using a host of approaches ranging from definitions based on firm attributes to ones based on job characteristics to define informality (see Fields 2019). As our focus is on jobs, we rely on the definition adopted by the 17th International Conference of Labour Statisticians (ILO 2003), which examined informality from the perspective of ‘jobs’. According to this definition, informal workers lack any type of legal recognition or protection, and do not have secure employment contracts, workers’ benefits, social protection, or workers’ representation. This implies that within self-employment, formal self-employed are those enterprises that are registered with state authorities and contributing to social security. Within wage employment, formal wage employed are workers who contribute to social security and who may also have security of tenure.
To operationalize the two-tier schema of informal labour markets, we follow Danquah et al. (2019).5 Upper-tier informal work status consists of informal employers (i.e. unregistered
3 Here, informal employment is defined as ‘all remunerative work (i.e. both self-employment and wage employment), that is not registered, regulated or protected by existing legal or regulatory frameworks, as well as non-remunerative work undertaken in an income-producing enterprise’ (see ILO 2020). 4 The informal self-employed include employers, own-account workers, and contributing family workers (Chen 2006). Own-account workers are self-employed individuals who do not employ others. Contributing family workers are those workers who hold self-employment jobs as own-account workers in a market-oriented establishment operated by a related person living in the same household. 5 The approach used in Danquah et al. (2019) takes the observable characteristics of jobs as the criteria for classifying informal jobs as upper-tier or lower-tier jobs. However, other approaches have been used in the literature such as classifying upper-tier informal jobs as those jobs that workers choose of their own accord, and lower-tier informal jobs as jobs that workers end up doing as they are rationed out of formal and upper-tier jobs (for a review, see Fields 2005).
4
enterprises that use hired workers) and individuals who have technical and vocational training (such as plumbers and electricians). These activities may sometimes be preferred to formal employment (such as a car mechanic who leaves his job in a formal firm manufacturing automobiles to start his own business). Lower-tier informal work status, on the other hand, is ‘free-entry’ employment, accommodating the poorest and least-skilled workers who would be barred from entry into high-paying self-employment because of a lack of capital and skills (Fields 1990; Bandiera et al. 2013; Basu et al. 2019); these are own-account workers and contributing family workers, examples of which are street venders and waste pickers.
In the case of wage employment, upper-tier informal work status consists of wage work that provides some de facto benefits (though not as generous as those provided to formal wage workers) or occupations that need some prior training or skills. Lower-tier informal work status consists of low-paid casual wage work that may or may not be paid at government stipulated minimum wages.
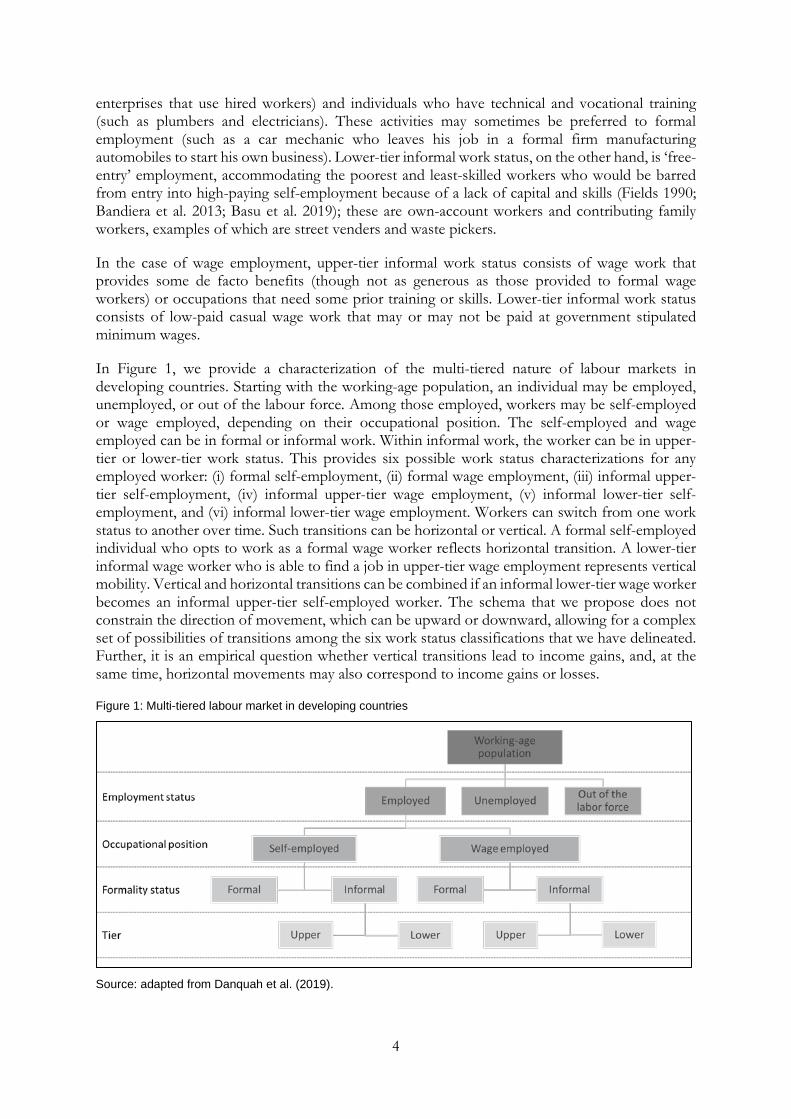
In Figure 1, we provide a characterization of the multi-tiered nature of labour markets in developing countries. Starting with the working-age population, an individual may be employed, unemployed, or out of the labour force. Among those employed, workers may be self-employed or wage employed, depending on their occupational position. The self-employed and wage employed can be in formal or informal work. Within informal work, the worker can be in upper-tier or lower-tier work status. This provides six possible work status characterizations for any employed worker: (i) formal self-employment, (ii) formal wage employment, (iii) informal upper-tier self-employment, (iv) informal upper-tier wage employment, (v) informal lower-tier self-employment, and (vi) informal lower-tier wage employment. Workers can switch from one work status to another over time. Such transitions can be horizontal or vertical. A formal self-employed individual who opts to work as a formal wage worker reflects horizontal transition. A lower-tier informal wage worker who is able to find a job in upper-tier wage employment represents vertical mobility. Vertical and horizontal transitions can be combined if an informal lower-tier wage worker becomes an informal upper-tier self-employed worker. The schema that we propose does not constrain the direction of movement, which can be upward or downward, allowing for a complex set of possibilities of transitions among the six work status classifications that we have delineated. Further, it is an empirical question whether vertical transitions lead to income gains, and, at the same time, horizontal movements may also correspond to income gains or losses.
Figure 1: Multi-tiered labour market in developing countries
Source: adapted from Danquah et al. (2019).
5
2.2 Application to the Indian context
We now apply the schema to the Indian context. The social and economic structure of labour markets in India makes the schema particularly applicable to the Indian case. First, consider self-employment. In India, formal manufacturing firms need to register with the Indian Factories Act of 1948, which applies to manufacturing and requires registration of all enterprises with 10 or more workers if they use electricity and 20 or more workers if they do not (in effect, the latter requirement has become irrelevant as most firms in India use electricity; see Chatterjee and Kanbur 2014). Informal firms (i.e. firms that do not register with the Factories Act) can be of two types: enterprises that use hired labour (non-household enterprises) and enterprises that use only family labour (i.e. household enterprises). For the larger of the unregistered non-household enterprises, the decision not to formalize may be because these enterprises choose to avoid the occupational and health regulations that every formal firm needs to follow under the Indian Factories Act of 1948 (Kanbur 2017). For the smaller of the unregistered non-household enterprises, constraints to growth may be due to lack of availability of credit and skilled labour (Raj and Sen 2015). Unregistered non-household enterprises are significantly more productive than household enterprises in India and can be classified as upper-tier informal self-employed, while household enterprises can be classified as lower-tier informal self-employed (Raj and Sen 2016).
In the case of wage employment, formal wage workers in India have permanent job contracts and are typically protected from job dismissal, especially in larger firms, under the Industrial Disputes Act, and have access to social security benefits (Saha et al. 2013). Upper-tier informal wage workers do not have the same job security as formal wage workers, and can be employed in either formal or informal firms. However, they may enjoy de facto benefits such as subsidized meals and housing. They may also be workers in skilled jobs, which require some type of vocational training (such as those with degrees from national or regional vocational training institutes). Lower-tier informal wage workers, on the other hand, are free-entry occupations and are in unskilled work. In rural areas, these are mainly agricultural wage workers; in urban areas, these are mainly casual workers and day labourers, often in the construction sector. There is a wealth of anthropological and economic evidence that these occupations are at the bottom of the heap in India (see Harriss-White 2010). Agricultural labour in India has the highest poverty rates among all occupational groups (Gang et al. 2008) and lower castes in India’s social hierarchy of labour are over-represented in this occupational group (Vaid 2012). This relationship between castes and specific occupations can be traced back to the jajmani system: a system of hereditary patron–client relationships between landed proprietors from the upper and middle castes and the bonded agricultural labourers from lower castes (Gang et al. 2016; Dumont 1970; Bayly 1999). Despite the reduction in the incidence of the worst forms of bonded labour and other coercive practices, the hereditary nature of the link between caste and occupation, especially in the lower rungs of the caste system, still persists in Indian society. In the case of construction labourers, these are workers who are often paid a daily wage below the minimum wage and who move from city to city searching for manual work in construction sites as ‘footloose labour’, as India’s rapid growth led to a real estate boom (Breman 2012; Shah et al. 2018).
We now turn to a discussion of the data we use to study worker transition in India, and how we operationalize the classification, as described in Figure 1, in the Indian case.

6
3 Data source and work status classification
3.1 Data
The data for this study are drawn from IHDS, conducted in 2004–05 and again in 2011–12 (henceforth referred to as 2005 and 2012, respectively; see IHDS 2020). This nationally representative, multi-topic survey collected information at both household and individual levels. In its first round in 2005, the survey covered 215,574 individuals from 41,554 households in 1,503 villages and 971 urban neighbourhoods across all states and union territories of India (with the exception of Andaman and Nicobar and Lakshadweep islands). In the second round, 83 per cent of the original households were traced and resurveyed. Households were selected using stratified random sampling and the data relating to the household and the individuals in the household were collected from a knowledgeable member—in most cases, the male head of the household. For this study, we restrict our analysis to individuals in a balanced panel, which consists of 150,983 individuals from a total of 215,574 individuals surveyed in both rounds. This panel dataset helps us to follow the same individuals and households through time and examine labour force flows across different types and sectors of employment.
The sample is restricted further as follows. First, as the study focuses on labour market transitions, we confined our sample to individuals in the prime working age (15–65 years), who make up 62.17 per cent of the sub-sample. Second, our analysis here focused on the employment dynamics of individuals who are active in the labour market, and we do not cover entry or exit dynamics. Our main focus is on workers engaged in non-farm activities and agricultural wage workers in the initial wave of the survey panel as against farmers or those unemployed. More specifically, in most part, the emphasis is on transitions of workers in these categories between the six mutually exclusive work status discussed earlier.6 Third, we eliminated individuals with income above the 99th percentile to reduce the measurement error. Fourth, we dropped individuals with missing values in our variables of interest. For instance, for some individuals, information on years of schooling was missing; for others, the gender was coded wrongly across the two rounds. Similarly, for many individuals, income figures were missing in either the first or the second round or in both the rounds. These adjustments leave us with a balanced panel of 37,356 individuals.
The key to this study is to accurately define the work status of the worker. We base our definition of a worker on the minimum number of hours they have worked in a year. Following Lei et al. (2019) and Dhanaraj and Mahambare (2019), we fix this threshold at 240 hours,7 and those individuals who have reported to have put in at least 240 hours in a particular activity are counted as being in the workforce. Activities in this case constitute wage or salary work, animal care, or working on the household farm or business. Those who have worked for fewer than 240 hours are treated as unemployed. As mentioned earlier, we concentrate on workers engaged in non-farm activities and agricultural wage workers, although we also include farmers and the unemployed in robustness checks of our main findings.
6 An expansion of this analysis, including farmers (under lower-tier informal self-employment) and unemployment as additional destination states, is provided in Appendix A. 7 Many studies have argued that using 240 hours as the cut-off helps in differentiating between individuals who have spent considerable time doing paid work and those who have not (Lei et al. 2019). Further, this definition also maintains comparability with the definition used in employment surveys of the National Sample Survey Office of India, which consider subsidiary work status (worked more than 30 days) to compute employment rates.

7
In defining the ‘activity status’ of a worker, our study considers their main job: that is, the job where the worker has spent the maximum hours in the last year out of all the jobs they have worked on. As discussed in Section 2, the transitional analysis in this paper focuses on six mutually exclusive work status and does not consider unemployment. However, we do a robustness check of the transition analysis including unemployment as an additional status. The results of this additional exercise are not discussed in the paper but are presented in Appendix A.
3.2 Work status classification
Based on the strategy discussed in Section 2, we classify the workers into six mutually exclusive work status categories as explained in Table 1. We start with wage workers. Among the wage workers, those with permanent job contracts are classified as formal wage employees. As mentioned in Section 2, these workers enjoy labour law protection and are also entitled to social security benefits. Within the informal sector, the upper-tier wage employment consists of workers in occupations that require some type of training and skills. As an approximation, we include workers who are employed in one of the following four occupations: professional, technical, and related workers [Division 0-1, Indian National Classification of Occupations (INCO) 1968]; administrative, executive, and managerial workers (Division 2, INCO); clerical and related workers (Division 3, INCO); sales and service workers (Division 4-5, INCO); and production and related workers (Division 7-9, INCO).8 Additionally, we also check whether these workers are entitled to de facto benefits such as meals or housing. All remaining workers, mainly agricultural, construction, and other manual laborers, are classified as ‘lower-tier informal’.
In the case of self-employed workers, we implement the formal–informal categorization of workers using the size of the businesses they own. Accordingly, all self-employed workers in non-farm businesses employing ten or more workers are classified as formal self-employed. This definition is broadly in line with the official criterion used to classify firms in India. This criterion was laid down by the Factories Act of 1948, which demarcates all manufacturing firms employing ten or more employees and using electric power as formal, and those that fall below these cut-offs as informal sector firms (Besley and Burgess 2004).9 Besides, we also treat all self-employed workers who are in professions that require a high level of skills as formal (Division 0-1, INCO). This category of occupations include physicists, architects, engineers, technologists, physicians and surgeons, mathematicians, statisticians, economists, auditors, jurists, and teachers. Among the informal self-employed, all those who own businesses that employ fewer than ten workers but at least one hired worker are classified as ‘upper-tier informal’. These also include workers who are in businesses that employ hired workers but operate from home or from a mobile location. Self-employed workers who are in activities that employ only household workers are treated as lower-tier informal.10 All contributing family workers are also included in this category. This is in line with the classification adopted by the surveys of the National Sample Survey Office in India, where
8 All these occupations require some prior skill, and are therefore not ‘free-entry’ occupations (Howard and Prakash 2012). 9 One drawback of the India Human Development Survey (IHDS) dataset is that it does not provide information on the number of workers employed by firms. Hence, using the information on the total wages paid to hired workers, we arrive at the number of hired workers. We first compute the average wage in each National Industrial Classification group from the total wage bill for each round of IHDS. We then estimate the number of hired workers by dividing the total wages paid to hired workers by the average wage. Using the number of hired workers, we then separate the formal businesses from the upper-tier informal ones. Accordingly, all workers who are part of the businesses that employ ten or more workers are classified as formal and those who are employed in businesses with fewer than ten workers are counted as upper-tier informal. 10 We include workers in family firms under lower-tier informal, but they are excluded from most of our analysis.

8
they regard enterprises that employ household workers as own-account enterprises. These are the enterprises that form the bottom part of the manufacturing segment in the informal sector (Raj and Sen 2016).11
We summarize the criteria adopted to classify the workers into six mutually exclusive work status in Table 1.
Table 1: Work status classification
Category Description Formal wage employees
All wage workers with permanent job contracts are classified as formal wage employees. All permanent workers in India are offered labour law protection and are also entitled to social security benefits.
Upper-tier informal wage employees
Informal wage workers are classified as upper-tier informal either if they work in occupations that require some type of training or if they receive some type of de facto benefits (such as meals or housing) from the employers.
Lower-tier informal wage employees
All remaining informal workers are classified as lower-tier informal.
Formal self-employed All self-employed workers who are in professions that require a high level of skills (Division 0-1, INCO), or employ ten or more workers are classified as formal self-employed.
Upper-tier informal self-employed
All informal self-employed workers who employ fewer than ten but at least one hired worker are classified as upper-tier informal. These also include workers who employ more than ten workers but operate from home or from a mobile location.
Lower-tier informal self-employed
All informal self-employed workers who employ only household workers are classified as lower-tier informal self-employed. All contributing family workers are also included in this category.
Source: authors’ compilation.
Our income estimates are derived from the main occupation, even though many individuals may have engaged in multiple jobs. We use the reported annual earnings, which are then converted to real values using consumer price index at 2004–05 prices. Only individuals who are working and have reported positive cash income are considered for the analysis. Following Danquah et al. (2019), we do not consider in-kind income and agricultural income generated by family farms for computing annual earnings.
4 Estimating labour mobility and its impact on earnings
The focus of this study is on worker transition characterized by movement of workers between various work status as defined earlier. The study uses a set of tools to understand the direction and volume of various labour market flows and to investigate how such mobility is associated with
11 After the classification, we noticed several overlaps between the work categories. This is to be expected as some self-employed individuals are likely to maximize their income by taking up additional jobs, or casual workers by engaging in self-employment activities. We address this issue as follows. Wherever the overlap is observed between a lower work status and a higher work status, we assign the individual to the higher category. In the case of overlap between similar work status, we used the median of the number of work hours to assign individuals to a particular category. We first look at the distribution of number of hours worked by workers in both categories. We then locate the midpoint of the distribution and use it to classify the workers. For example, in the case of the overlap between the upper-tiers of wage employment and self-employment, we assign the individuals into wage employment if they are over the threshold of 2,000 hours, which is the mid-point of work hours in this case, and to self-employment if below this threshold. Besides this case, we also observed overlaps between lower-tier wage employment and lower-tier self-employment.
9
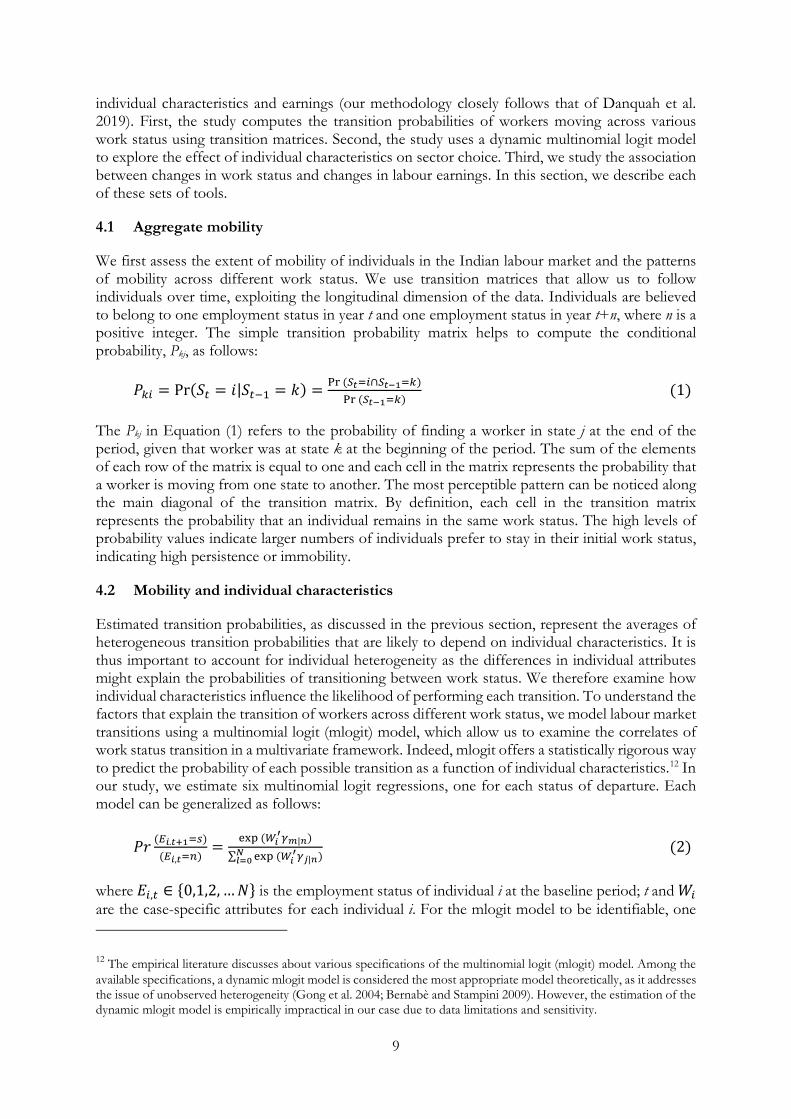
individual characteristics and earnings (our methodology closely follows that of Danquah et al. 2019). First, the study computes the transition probabilities of workers moving across various work status using transition matrices. Second, the study uses a dynamic multinomial logit model to explore the effect of individual characteristics on sector choice. Third, we study the association between changes in work status and changes in labour earnings. In this section, we describe each of these sets of tools.
4.1 Aggregate mobility
We first assess the extent of mobility of individuals in the Indian labour market and the patterns of mobility across different work status. We use transition matrices that allow us to follow individuals over time, exploiting the longitudinal dimension of the data. Individuals are believed to belong to one employment status in year t and one employment status in year t+n, where n is a positive integer. The simple transition probability matrix helps to compute the conditional probability, Pkj, as follows:
𝑃𝑃𝑘𝑘𝑘𝑘 = Pr(𝑆𝑆𝑡𝑡 = 𝑖𝑖|𝑆𝑆𝑡𝑡−1 = 𝑘𝑘) = Pr (𝑆𝑆𝑡𝑡=𝑘𝑘∩𝑆𝑆𝑡𝑡−1=𝑘𝑘)Pr (𝑆𝑆𝑡𝑡−1=𝑘𝑘)
(1)
The Pkj in Equation (1) refers to the probability of finding a worker in state j at the end of the period, given that worker was at state k at the beginning of the period. The sum of the elements of each row of the matrix is equal to one and each cell in the matrix represents the probability that a worker is moving from one state to another. The most perceptible pattern can be noticed along the main diagonal of the transition matrix. By definition, each cell in the transition matrix represents the probability that an individual remains in the same work status. The high levels of probability values indicate larger numbers of individuals prefer to stay in their initial work status, indicating high persistence or immobility.
4.2 Mobility and individual characteristics
Estimated transition probabilities, as discussed in the previous section, represent the averages of heterogeneous transition probabilities that are likely to depend on individual characteristics. It is thus important to account for individual heterogeneity as the differences in individual attributes might explain the probabilities of transitioning between work status. We therefore examine how individual characteristics influence the likelihood of performing each transition. To understand the factors that explain the transition of workers across different work status, we model labour market transitions using a multinomial logit (mlogit) model, which allow us to examine the correlates of work status transition in a multivariate framework. Indeed, mlogit offers a statistically rigorous way to predict the probability of each possible transition as a function of individual characteristics.12 In our study, we estimate six multinomial logit regressions, one for each status of departure. Each model can be generalized as follows:
𝑃𝑃𝑃𝑃 (𝐸𝐸𝑖𝑖.𝑡𝑡+1=𝑠𝑠)(𝐸𝐸𝑖𝑖,𝑡𝑡=𝑛𝑛)
= exp (𝑊𝑊𝑖𝑖′𝛾𝛾𝑚𝑚|𝑛𝑛)
∑ exp (𝑊𝑊𝑖𝑖′𝛾𝛾𝑗𝑗|𝑛𝑛)𝑁𝑁
𝑙𝑙=0 (2)
where 𝐸𝐸𝑘𝑘,𝑡𝑡 ∈ {0,1,2, …𝑁𝑁} is the employment status of individual i at the baseline period; t and 𝑊𝑊𝑘𝑘 are the case-specific attributes for each individual i. For the mlogit model to be identifiable, one
12 The empirical literature discusses about various specifications of the multinomial logit (mlogit) model. Among the available specifications, a dynamic mlogit model is considered the most appropriate model theoretically, as it addresses the issue of unobserved heterogeneity (Gong et al. 2004; Bernabè and Stampini 2009). However, the estimation of the dynamic mlogit model is empirically impractical in our case due to data limitations and sensitivity.
10
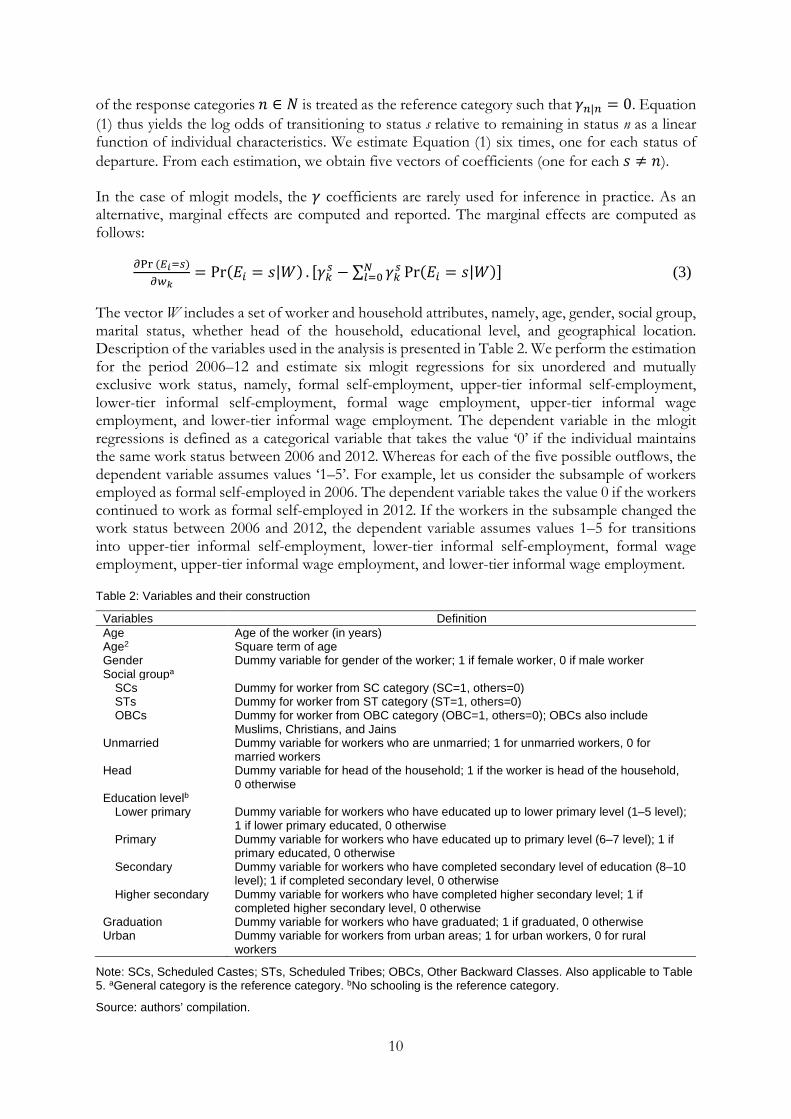
of the response categories 𝑛𝑛 ∈ 𝑁𝑁 is treated as the reference category such that 𝛾𝛾𝑛𝑛|𝑛𝑛 = 0. Equation (1) thus yields the log odds of transitioning to status s relative to remaining in status n as a linear function of individual characteristics. We estimate Equation (1) six times, one for each status of departure. From each estimation, we obtain five vectors of coefficients (one for each 𝑠𝑠 ≠ 𝑛𝑛).
In the case of mlogit models, the 𝛾𝛾 coefficients are rarely used for inference in practice. As an alternative, marginal effects are computed and reported. The marginal effects are computed as follows:
𝜕𝜕Pr (𝐸𝐸𝑖𝑖=𝑠𝑠)𝜕𝜕𝑤𝑤𝑘𝑘
= Pr(𝐸𝐸𝑘𝑘 = 𝑠𝑠|𝑊𝑊) . [𝛾𝛾𝑘𝑘𝑠𝑠 − ∑ 𝛾𝛾𝑘𝑘𝑠𝑠 Pr(𝐸𝐸𝑘𝑘 = 𝑠𝑠|𝑊𝑊)𝑁𝑁𝑙𝑙=0 ] (3)
The vector W includes a set of worker and household attributes, namely, age, gender, social group, marital status, whether head of the household, educational level, and geographical location. Description of the variables used in the analysis is presented in Table 2. We perform the estimation for the period 2006–12 and estimate six mlogit regressions for six unordered and mutually exclusive work status, namely, formal self-employment, upper-tier informal self-employment, lower-tier informal self-employment, formal wage employment, upper-tier informal wage employment, and lower-tier informal wage employment. The dependent variable in the mlogit regressions is defined as a categorical variable that takes the value ‘0’ if the individual maintains the same work status between 2006 and 2012. Whereas for each of the five possible outflows, the dependent variable assumes values ‘1–5’. For example, let us consider the subsample of workers employed as formal self-employed in 2006. The dependent variable takes the value 0 if the workers continued to work as formal self-employed in 2012. If the workers in the subsample changed the work status between 2006 and 2012, the dependent variable assumes values 1–5 for transitions into upper-tier informal self-employment, lower-tier informal self-employment, formal wage employment, upper-tier informal wage employment, and lower-tier informal wage employment.
Table 2: Variables and their construction
Variables Definition Age Age of the worker (in years) Age2 Square term of age Gender Dummy variable for gender of the worker; 1 if female worker, 0 if male worker Social groupa SCs Dummy for worker from SC category (SC=1, others=0) STs Dummy for worker from ST category (ST=1, others=0) OBCs Dummy for worker from OBC category (OBC=1, others=0); OBCs also include
Muslims, Christians, and Jains Unmarried Dummy variable for workers who are unmarried; 1 for unmarried workers, 0 for
married workers Head Dummy variable for head of the household; 1 if the worker is head of the household,
0 otherwise Education levelb Lower primary Dummy variable for workers who have educated up to lower primary level (1–5 level);
1 if lower primary educated, 0 otherwise Primary Dummy variable for workers who have educated up to primary level (6–7 level); 1 if
primary educated, 0 otherwise Secondary Dummy variable for workers who have completed secondary level of education (8–10
level); 1 if completed secondary level, 0 otherwise Higher secondary Dummy variable for workers who have completed higher secondary level; 1 if
completed higher secondary level, 0 otherwise Graduation Dummy variable for workers who have graduated; 1 if graduated, 0 otherwise Urban Dummy variable for workers from urban areas; 1 for urban workers, 0 for rural
workers
Note: SCs, Scheduled Castes; STs, Scheduled Tribes; OBCs, Other Backward Classes. Also applicable to Table 5. aGeneral category is the reference category. bNo schooling is the reference category.
Source: authors’ compilation.

11
We estimate the model parameters using the maximum likelihood method. The marginal effects are computed as the means of the explanatory variables. We also test the joint significance of explanatory variables using a likelihood ratio test, which would help us to check the correct specification of the model. The potential attrition bias is likely to influence our transition estimates. Two potential types of attrition are possible. First, 17 per cent of the households who were part of the first wave may not be surveyed in the second wave. Second, individuals who were in the 83 per cent households, where we have panel data, might have left the household as migrants. In the first attrition type, since we are not including this 17 per cent, there may be some attrition bias, but we cannot say in which direction [it should be noted that the attrition rate in the IHDS is among the lowest for panel data for developing countries, especially given the seven-year interval between the first and second waves—see Wang et al. (2014) for a comparison of the IHDS with other panel datasets available for developing countries]. In the second, if the migrants entered better work status than those who stayed behind, then there is bias in transition downwards. But this is difficult to assess, as we do not know the work status of migrants.
4.3 Income dynamics
Another important objective of the paper is to examine the welfare implication of transitioning from one status to another status. To be specific, we investigate how the transition across different work status affects the earnings levels of workers. We employ a dynamic income model to probe the association between worker transition and changes in earnings. The model that we estimate takes the following form:
∆𝑙𝑙𝑛𝑛𝑊𝑊𝑘𝑘𝑡𝑡 = 𝛼𝛼0 + 𝛼𝛼1𝑙𝑙𝑛𝑛𝑊𝑊𝑘𝑘𝑡𝑡−1 + 𝛼𝛼2𝐸𝐸𝑘𝑘𝑡𝑡−1 + 𝛼𝛼3(𝐸𝐸𝑘𝑘𝑡𝑡 ∗ 𝐸𝐸𝑘𝑘𝑡𝑡−1) + ∑ 𝛾𝛾𝑘𝑘𝑘𝑘>1 𝑋𝑋𝑘𝑘𝑡𝑡−1 + 𝜖𝜖𝑘𝑘 (4)
where ∆𝑙𝑙𝑛𝑛𝑊𝑊𝑘𝑘𝑡𝑡 is the changes in earnings, 𝑙𝑙𝑛𝑛𝑊𝑊𝑘𝑘𝑡𝑡−1 represents the individual’s initial log earnings, 𝐸𝐸𝑘𝑘𝑡𝑡−1 stands for individual’s work status at the baseline, and the vector 𝑋𝑋𝑘𝑘𝑡𝑡−1 contains variables representing worker-specific attributes. These worker characteristics include age, gender, social group, educational level, and geographical location. These variables are defined in Table 2. In Equation (4), we also introduce an interaction term between initial and final work status (𝐸𝐸𝑘𝑘𝑡𝑡 × 𝐸𝐸𝑘𝑘𝑡𝑡−1) to understand the income implications of worker mobility. The estimates of 𝛼𝛼2 and 𝛼𝛼3 together represents the penalty/premium associated with staying in or transitioning to a different work status.
5 Characteristics of workers in India’s multi-tiered labour market
The shares of each labour work status for all individuals of working age (15–64 years) for 2005 and 2012 are presented in Table 3. The shares look similar between 2005 and 2012 except for notable changes in wage employment. Table 3 shows that although informal employment makes up the major chunk of the total sample, it saw a slide from 90 per cent in 2005 to 85 per cent in 2012. The decline in the share of upper-tier informal employment contributed to the overall drop in the contribution of the informal sector. The upper-tier of the informal sector reported a decline of about 8 per cent during this period. Although the upper-tier declined in importance in both wage and self-employment, it reported a steep fall of about 12 per cent in wage employment. On the other hand, the significant gains in wage employment led to formal-status employment increasing its contribution during this period.

12
Table 3: Distribution of workers by work status (per cent)
2005 2012 (a) Proportion of employment by work status Self-employed Formal 1.29 1.56
Informal Upper 7.72 6.50 Lower 20.80 18.88
Wage employed Formal 9.24 13.81 Informal Upper 29.33 21.70
Lower 31.62 37.55 Total number of observations 37,356 37,356 (b) Proportion of formal vs. informal employment Formal 10.53 15.37 Informal Upper 37.05 28.20
Lower 52.42 56.43 Total 100 100 (c) Proportion of upper-tier informality in informal employment Upper informal in total informal employment 41.41 33.32 Upper informal in informal self-employment 27.08 25.60 Upper informal in informal wage employment 48.12 36.63
Note: we omit own farm work and animal care work and those who are unemployed from the final estimation. However, our lower-tier informal workers include agricultural wage labour. We used sample weights to arrive at these estimates.
Source: authors’ estimates.
When we look at each work status separately, we find that formal self-employment remains stable at around 1.5 per cent. Despite the fall in its share over the 2005–12 period, lower-tier informal self-employment remains a substantially large segment in the self-employment category. The upper-tier—the second largest segment in the self-employment category—too finds its share declining marginally during this period. As is evident from Table 3, formal wage employment reported substantial gains, as the share of workers increased from 9.3 per cent to nearly 14 per cent during the study period. A similar increase in share is also noticed for lower-tier informal wage employment. Maintaining its position as the single largest employer, this segment accommodates about 38 per cent of the workforce in the non-farm sector in 2012. Upper-tier informal wage employment retains its position as the second largest work status but has registered an 8 per cent decline in its share over the 2005–12 period. In summary, we observe significant increase in the share of workers in the formal status, and more evidently in the wage employment category. Evidence also points to the declining importance of upper-tier informal sector in both wage employment and self-employment categories.
Table 4 provides a detailed analysis of the characteristics of the working-age population in each work status. To be specific, the table shows major differences in the characteristics of individuals of different status in the labour market. We consider three important individual attributes in Table 4, namely, age, gender, and geographical location. We also consider social group and level of education in Tables 5 and 6, respectively. In general, self-employed workers are older than other workers in the non-farm sector (Table 4). The only exception is wage employed in the formal sector who are the oldest workers by average age. As Table 4 illustrates, the participation of workers is more skewed towards men—70 per cent of workers are men, and women are underrepresented in all work status. This finding is consonant with the studies indicating women are increasingly underrepresented in the formal sector in comparison to their presence in the informal sector (Ghani et al. 2014). Our descriptive evidence points to greater preponderance of self-employment and lower-tier informal employment among women. However, we also find a significant decline in the share of women in formal self-employment. This lends credence to the existing evidence that women tend to be more represented in the lower segment of the informal sector (Chen et al. 2006). Table 4 also points to geographic inequalities in the composition of jobs.

13
A majority of about 70 per cent of non-farm workers are of rural origin. We find a significant share of urban workers in self-employment and formal wage employment.
Table 4: Average worker characteristics by work status
Period Self-employed Wage employed Total Formal Informal Formal Informal
Upper Lower Upper Lower (a) Average age (years) 2005 34.33 34.07 33.5 39.79 33.89 34.68 34.62 2012 42.22 42.53 42.27 42.6 40.51 41.83 41.79 (b) Share of female workers (per cent) 2005 40.01 41.4 42.43 14.13 16.46 34.3 29.52 2012 37.99 41.91 43.21 15.59 17.82 32.02 29.52 (c) Share of urban workers (per cent) 2005 39.83 50.08 39.6 54.22 31.81 0.08 29.43 2012 48.31 51.29 42.41 52.69 33.39 0.07 29.43
Note: we omit own farm work and animal care work and those who are unemployed from the final estimation. However, our lower-tier informal workers include agricultural wage labour. We used sample weights to arrive at these estimates.
Source: authors’ estimates.
The caste-wise breakdown for workers in self-employment and wage employment shows interesting patterns (Table 5). There is enough evidence in the literature pointing to the significant role of caste and religious affiliation of workers in sector allocation (Banerjee and Knight 1985; Ito 2009). In line with the available evidence, we also find larger representation of high-caste workers in the formal sector compared with lower social groups. Over time, the number of forward caste individuals engaged in formal jobs, both as wage earners and self-employed, has increased substantially. On the other hand, the number of Other Backward Classes (OBCs), Scheduled Castes (SCs), and Scheduled Tribes (STs) engaged in formal jobs has declined—OBC and ST participation in formal self-employment saw a big decline, and STs also saw a decline in formal wage employment. In general, the changes over the 2005–12 period indicate that workers belonging to forward castes are more likely to be in formal employment, while those belonging to SC and OBC communities are more likely to be engaged in informal jobs, especially in the lower-tier segment of the informal sector.
Table 5: Average worker characteristics by social group
Period Self-employed Wage employed Total Formal Informal Formal Informal
Upper Lower Upper Lower Forward caste 2005 33.14 32.76 21.91 29.67 13.49 7.26 16.50 2012 47.66 31.97 22.36 30.12 13.39 7.85 17.05 OBCs 2005 50.97 55.23 58.69 44.74 49.91 41.60 49.06 2012 36.57 55.60 61.02 42.70 51.70 41.71 48.51 SCs 2005 14.18 9.70 15.03 18.49 29.30 36.07 25.77 2012 12.75 10.66 12.58 20.39 26.83 36.07 25.45 STs 2005 1.71 2.32 4.37 7.11 7.30 15.07 8.67 2012 3.02 1.37 4.04 6.79 8.09 14.37 8.99
Note: we omit agricultural work and animal care work and those who are unemployed from the final estimation. However, our lower-tier informal workers include agricultural wage labour. OBCs also include Muslims, Christians, and Jains. We used sample weights to arrive at these estimates.
Source: authors’ estimates.

14
Education level is a crucial factor in aiding the transition from informal to formal employment (ILO 2014; Benjamin and Mbaye 2014). This is clearly evident from Table 6, which suggests a strong link between education levels and formal sector employment. We find that better educated workers are more represented in the formal sector while the less educated mostly end up in the informal sector. More than 70 per cent of formal sector workers have secondary education or above while a major chunk of informal sector workers have only received primary education or are without any schooling. This finding is perhaps consistent with the existing evidence that more educated workers are less likely to be employed in the informal sector (Shonchoy and Junankar 2014; Sheikh and Gaurav 2020). Sheikh and Gaurav (2020) too found clear differences in education levels between informal and formal sector workers, in favour of the latter. To sum up, our descriptive analysis broadly suggests that informality appears to be mostly evident among workers who are young, female, less educated, live in rural areas, and who hail from the lower strata of the caste hierarchy.
Table 6: Average worker characteristics by education level
Period Self-employed Wage employed Total Formal Informal Formal Informal
Upper Lower Upper Lower No schooling 2005 10.69 15.69 25.37 9.64 33.55 54.74 34.67 2012 12.41 16.13 25.32 9.22 31.28 52.60 33.83 Lower primary 2005 11.54 12.61 17.41 9.84 19.55 19.95 17.69 2012 9.51 13.55 18.33 9.34 21.31 21.24 18.38 Primary 2005 5.90 10.00 9.39 5.83 9.58 7.87 8.64 2012 4.88 8.67 8.42 4.84 9.48 7.62 7.81 Secondary 2005 24.22 33.40 30.95 33.60 25.51 14.12 24.38 2012 24.33 31.54 29.21 32.42 27.04 15.02 23.93 Higher secondary 2005 16.96 15.53 11.21 15.31 7.14 2.86 8.16 2012 15.33 15.43 10.33 16.64 6.94 2.97 8.11 Graduation 2005 30.68 12.76 5.67 25.78 4.68 0.46 6.46 2012 33.54 14.69 8.40 27.55 3.95 0.55 7.93
Note: we omit agricultural work and animal care work and those who are unemployed from the final estimation. However, our lower-tier informal workers include agricultural wage labour. We used sample weights to arrive at these estimates.
Source: authors’ estimates.
6 Transitions in informal and formal employment
In this section, we first discuss the likelihood of workers moving from one work status to another using transition matrices. We then examine the correlates of worker mobility. Finally, we assess the income gains and losses that may take place when workers move from one work status to another.
6.1 Patterns in worker transition
How much movement is there among the work status in the non-farm sector in India? We examine this issue using the methodological tools discussed in Section 4.1. In Table 7, we present probability estimates, defined as the probability of observing workers in a particular status at the end of the period, conditional on their employment status at the beginning of the period. In general, we observe considerable changes in employment status over the period 2004/05–

15
2011/12. Close to half of the workers in our sample (47 per cent) change employment status during this period. Overall, the probabilities show that self-employed workers exhibit relatively more fluidity than wage workers. It is also evident from the table that there is very little movement of workers from wage employment to self-employment. The findings also suggest that, in general, there is more mobility within self-employment and wage employment than between these types of employment.
Job stability varies considerably across work status. For wage employment, there is a lot of stickiness for formal and lower-tier informal work status. As is evident from Table 7, lower-tier informal wage workers report the highest retention rate, followed by formal wage workers. Nearly 73 per cent of the workers who worked in the lower-tier informal wage employment—the largest segment of our sample—retain the same work status in 2012. The finding of high persistence rates for lower-tier informal wage employment perhaps indicates that these workers face significant challenges in changing jobs due to limited human capital and skills and insufficient working capital, especially for those wanting to move to self-employment. Among those who transitioned out, very few ended up (about 17 per cent) obtaining a salaried job in the upper-tier informal sector. The formal salaried workers, who account for 10 per cent of the total workers, too demonstrate higher degree of immobility, with 65 per cent of them preferring to retain the same status. The most visible transition out of formal salaried employment is that into upper-tier informal wage employment. Almost 17 per cent of the formal salaried workers moved into the upper-tier of wage employment. Upper-tier informal wage workers are apparently the most mobile among wage workers, exhibiting a mixed transition pattern. While 38 per cent chose not to transition out, 32 per cent moved out as lower-tier wage workers, 16 per cent as formal salaried workers, and 10 per cent as lower-tier self-employed workers. Indeed, the higher turnover among upper-tier informal salaried workers offers some evidence of upward mobility, showing workers transitioning into formal wage employment. At the same time, evidence also points to the existence of a significant risk of downward mobility, with upper-tier informal salaried workers going into lower-tier informal employment, either as wage earners or self-employed.
Turnover rates are highest among self-employed workers, implying that self-employment activities exhibit a lower degree of persistence than salaried jobs. The mobility out of existing status is more pronounced among formal self-employed workers, who form just 1.3 per cent of the total sample of workers. Nevertheless, they show a rather heterogeneous transition pattern. While those who remain in the status were confined to 29 per cent, 25 per cent experienced a downward transition to lower-tier of the informal self-employed and another 9 per cent to the upper-tier. We do see some mobility out of formal self-employment into formal salaried jobs (14 per cent) and also to the upper-tier and lower-tier of wage employment at 11 and 12 per cent, respectively. Separation rates are also very high among the self-employed in the upper-tier informal sector. The outflows from this segment are mostly to the lower-tier of informal self-employment, indicating a deterioration in their work status. As Table 7 shows, the probability of transitioning from upper-tier to lower-tier stands at 41 per cent. We also find a high churning rate for workers in the lower-tier informal self-employed sector—the largest segment in the self-employed accounting for 21 per cent of the workers in 2005. More than half of the workers (51 per cent) in this status opted to transition out. Of those who chose to move out, 26 per cent saw an upgradation in their status: 14 per cent as upper-tier informal wage employed and 12 per cent as upper-tier informal self-employed. Another 17 per cent ended up as wage employed in the lower-tier of the informal sector.
The worker transition yields more or less a similar pattern when we include family farming under lower-tier informal self-employment activities in the destination state and introduce unemployment as an additional destination state (Appendix Table A1). Although we do see some movement of workers in every status into unemployment, the higher level of persistence of lower-

16
tier informal wage employment and formal sector wage employment is still evident in the overall transition pattern captured using the revised sub-sample of workers.
Our results that are based on an alternative classification, where we group together workers in wage employment and self-employment to form three categories, namely, formal employment, upper-tier informal employment, and lower-tier informal employment, also show higher persistence of formal employment and lower-tier informal employment and lower persistence of upper-tier informal employment (Appendix Table A2).
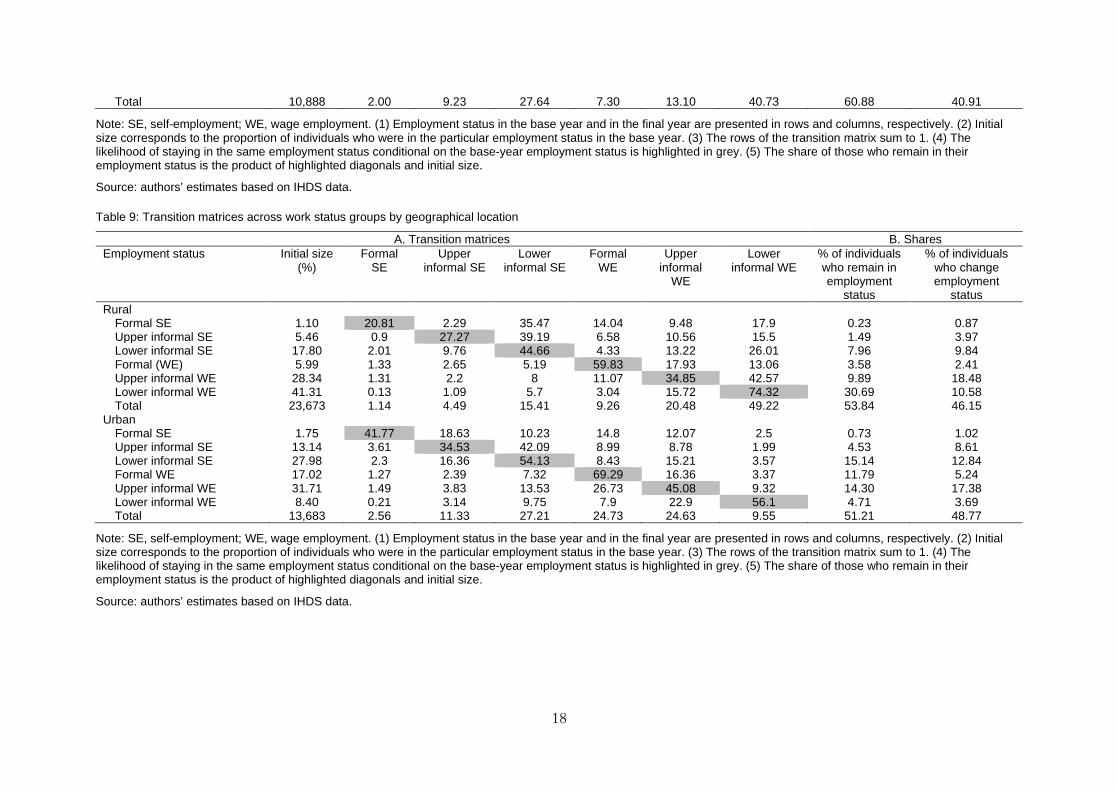
We also find striking gender differences in transition (Table 8). Our results show that the degree of mobility is substantially lower among female workers than among male workers. We also find that mobility patterns for male workers are more or less similar to the transition probabilities for the total sample. As is the case with the total sample, we find higher retention rates among self-employed workers and higher rates of persistence among wage workers in the male sample. In the case of female workers, we find very high persistence rates for lower-tier informal wage employment and formal wage employment, and they are substantially higher than that of male workers. Table 9 shows transition probabilities of rural and urban workers separately. With the exception of lower-tier informal wage employment, turnover rates are much higher in rural areas than in urban areas. This is particularly true for formal self-employment, upper-tier self-employment, and upper-tier wage employment. Although the percentage of people who changed employment status over the 2004/05–2011/12 period is higher among urban workers compared with rural workers, there is a caveat here: the number of workers in rural areas is more than twice that of urban areas.13
13 Our findings also point to marked differences in transition probabilities between workers from metropolitan cities and non-metropolitan cities. We find that metro workers demonstrate high degree of mobility and demonstrate trends closer to the ones observed for the total sample. For brevity and lack of space, we do not report the results here but these are available from the authors upon request.

17
Table 7: Transition matrices across work status groups
A. Transition matrices B. Shares Employment status Initial size
(%) Formal
SE Upper informal
SE Lower informal
SE Formal
WE Upper informal
WE Lower informal
WE % of individuals who remain in employment
status
% of individuals who change employment
status Formal SE 1.29 29.16 8.8 25.42 14.34 10.51 11.77 0.38 0.91 Upper informal SE 7.72 2.26 30.91 40.65 7.79 9.67 8.73 2.39 5.34 Lower informal SE 20.79 2.12 12.37 48.41 5.96 14.01 17.13 10.06 10.73 Formal WE 9.24 1.3 2.51 6.34 64.96 17.08 7.81 6.01 3.23 Upper informal WE 29.33 1.37 2.72 9.76 16.05 38.11 32.00 11.17 18.18 Lower informal WE 31.62 0.14 1.25 6.01 3.42 16.28 72.90 23.05 8.57 Total 37,356 1.56 6.50 18.88 13.81 21.7 37.55 53.06 46.97
Note: SE, self-employment; WE, wage employment. (1) Employment status in the base year and in the final year are presented in rows and columns, respectively. (2) Initial size corresponds to the proportion of individuals who were in the particular employment status in the base year. (3) The rows of the transition matrix sum to 1. (4) The likelihood of staying in the same employment status conditional on the base-year employment status is highlighted in grey. (5) The share of those who remain in their employment status is the product of highlighted diagonals and initial size.
Source: authors’ estimates based on India Human Development Survey (IHDS) data.
Table 8: Transition matrices across work status groups by gender
A. Transition matrices B. Shares Employment status Initial size
(%) Formal
SE Upper
informal SE Lower
informal SE Formal
WE Upper
informal WE
Lower informal WE
% of individuals who remain in employment
status
% of individuals who change employment
status Male Formal SE 1.10 23.87 7.81 20.98 19.6 15.58 12.15 0.26 0.84 Upper informal SE 6.42 2 26.63 36.37 11.33 13.83 9.84 1.71 4.71 Lower informal SE 16.98 1.76 11.08 41.45 7.95 18.59 19.17 7.05 9.97 Formal WE 11.25 1.3 2.8 6.38 64.6 17.39 7.52 7.27 3.98 Upper informal WE 34.77 1.44 2.76 9.26 16.61 38.46 31.47 13.39 21.42 Lower informal WE 29.48 0.11 1.37 5.68 4.09 19.52 69.23 20.40 9.08 Total 26,468 1.37 5.36 15.22 16.54 25.3 36.21 50.07 49.99 Female Formal SE 1.75 37.09 10.28 32.07 6.46 2.91 11.19 0.65 1.10 Upper informal SE 12.58 2.62 36.96 46.7 2.78 3.78 7.17 4.65 7.94 Lower informal SE 29.90 2.62 14.13 57.85 3.26 7.8 14.35 17.31 12.62 Formal WE 4.42 1.31 0.73 6.12 67.12 15.18 9.55 2.97 1.45 Upper informal WE 16.35 0.99 2.52 12.31 13.21 36.3 34.67 5.94 10.41 Lower informal WE 36.75 0.19 1.03 6.66 2.12 10.08 79.93 29.36 7.39
18
Total 10,888 2.00 9.23 27.64 7.30 13.10 40.73 60.88 40.91
Note: SE, self-employment; WE, wage employment. (1) Employment status in the base year and in the final year are presented in rows and columns, respectively. (2) Initial size corresponds to the proportion of individuals who were in the particular employment status in the base year. (3) The rows of the transition matrix sum to 1. (4) The likelihood of staying in the same employment status conditional on the base-year employment status is highlighted in grey. (5) The share of those who remain in their employment status is the product of highlighted diagonals and initial size.
Source: authors’ estimates based on IHDS data.
Table 9: Transition matrices across work status groups by geographical location
A. Transition matrices B. Shares Employment status Initial size
(%) Formal
SE Upper
informal SE Lower
informal SE Formal
WE Upper
informal WE
Lower informal WE
% of individuals who remain in employment
status
% of individuals who change employment
status Rural Formal SE 1.10 20.81 2.29 35.47 14.04 9.48 17.9 0.23 0.87 Upper informal SE 5.46 0.9 27.27 39.19 6.58 10.56 15.5 1.49 3.97 Lower informal SE 17.80 2.01 9.76 44.66 4.33 13.22 26.01 7.96 9.84 Formal (WE) 5.99 1.33 2.65 5.19 59.83 17.93 13.06 3.58 2.41 Upper informal WE 28.34 1.31 2.2 8 11.07 34.85 42.57 9.89 18.48 Lower informal WE 41.31 0.13 1.09 5.7 3.04 15.72 74.32 30.69 10.58 Total 23,673 1.14 4.49 15.41 9.26 20.48 49.22 53.84 46.15 Urban Formal SE 1.75 41.77 18.63 10.23 14.8 12.07 2.5 0.73 1.02 Upper informal SE 13.14 3.61 34.53 42.09 8.99 8.78 1.99 4.53 8.61 Lower informal SE 27.98 2.3 16.36 54.13 8.43 15.21 3.57 15.14 12.84 Formal WE 17.02 1.27 2.39 7.32 69.29 16.36 3.37 11.79 5.24 Upper informal WE 31.71 1.49 3.83 13.53 26.73 45.08 9.32 14.30 17.38 Lower informal WE 8.40 0.21 3.14 9.75 7.9 22.9 56.1 4.71 3.69 Total 13,683 2.56 11.33 27.21 24.73 24.63 9.55 51.21 48.77
Note: SE, self-employment; WE, wage employment. (1) Employment status in the base year and in the final year are presented in rows and columns, respectively. (2) Initial size corresponds to the proportion of individuals who were in the particular employment status in the base year. (3) The rows of the transition matrix sum to 1. (4) The likelihood of staying in the same employment status conditional on the base-year employment status is highlighted in grey. (5) The share of those who remain in their employment status is the product of highlighted diagonals and initial size.
Source: authors’ estimates based on IHDS data.

19
6.2 Correlates of worker transition
Our preceding analysis suggests significant labour mobility across different work status. The next step in our empirical analysis is to locate the factors that might explain the transition between work status in the non-farm sector, using the methodological tools discussed in Section 4.2. In particular, our attempt in this section is to understand how the differences in individual and household attributes influence labour mobility across work status. The marginal effects of the multinomial logit model estimation are presented in Figures 2–7 and Appendix Table A3.14 The marginal effects yield the influence of selected explanatory variables on the probability of leaving the baseline work status for a certain destination status relative to the probability of not leaving the baseline status. We test the robustness of our results by re-estimating the multinomial logit specification by including family firms and unemployment as additional status (Appendix Table A4). We also examine the coefficient estimates of worker characteristics using an ordered logit specification where we group together workers in wage employment and self-employment to form three categories, namely, formal employment, upper-tier informal employment, and lower-tier informal employment (see Appendix Table A5).
Figures 2–7 present the average marginal effects on worker transitions by initial status in employment.15 Our results do suggest a significant role for education, age, gender, social group, and geographical location in shaping mobility patterns. We find that education level plays a powerful role in explaining the mobility of workers from informal to formal status (see Figures 3, 4, 6, and 7). In particular, the likelihood of transition from informal to formal sector increases with the level of education, implying that the more educated the worker the higher the probability of transitioning to a formal job. This finding is evident among both self-employed workers and salaried workers. Based on the magnitude of marginal effects, university graduates exhibit the highest probability of transitioning to formal employment rather than remaining in informal employment relative to the reference group of workers with no schooling. As expected, the results also show that workers become less likely to move from formal to informal status as their level of education increases.
We also see that the education level significantly influences the probability of transition of workers from formal self-employment to formal wage employment (Figure 2); the likelihood of formal self-employed transitioning to formal wage employment increases with the level of education. Higher levels of education also increase the probability that upper-tier informal workers will move into formal employment and lower-tier informal workers will move into upper-tier informal employment. Overall, these findings highlight the importance of having skills, or human capital, which is one way workers can increase their chances of experiencing an upward transition in their work status. Moreover, our finding supports the existing evidence in the literature highlighting the critical role of education and human capital development in aiding the transition of an economy towards formality (Gong et al. 2004; La Porta and Shleifer 2014).
14 Ideally, it is important to address the issue of selectivity bias. Most of the existing studies on worker transitions tried to address this issue by using the standard two-stage method. This method involves including the inverse Mills ratio obtained from the first-stage probit equation as an additional variable in the second-stage regressions. Importantly, this method rests on the premise that the underlying models have precise knowledge of how workers choose among sectors. A poor first-stage selection specification, therefore, is likely to produce an unknown bias rather than improving our original estimates (Maloney 1999). In our case, this is likely to be the situation as we have very little knowledge of the role each sector serves. 15 The regression results are presented in detail in Appendix Table A3.

20
Turning to the age of the worker, estimation results indicate that age plays a very minimal role in influencing worker transitions. However, we do see some role for age in the transition of lower-tier informal workers to formal wage employment (see Figures 4 and 7). That is, as workers age, they show a higher probability of transitioning from the lower-tier informal sector to formal wage employment, indicating the significant role of experience.
In the context of worker transitions, gender of the worker appears to play a significant role. In particular, women exhibit a higher likelihood than men of transitioning from lower-tier informal self-employment to upper-tier informal and formal self-employment (Figure 4). However, a similar upward transition is not visible among women in wage employment. In other words, compared with men, the likelihood of women making a favourable upward transition is less evident among salaried workers. Our results also suggest that the probability of female workers shifting from self-employment to wage employment is low, but the reverse flow is much more common. In essence, our findings on gender corroborate the prevailing notion that women are significantly more likely than men to enter self-employment and less likely to enter wage employment. This is more or less in line with the existing evidence that women are underrepresented in salaried work compared with self-employment in India (Neetha 2010). Given the traditional division of gender roles and family responsibility of women in India, there is an increasing preference for flexible job options or part-time work among the women in India. Further, the costs of searching for jobs in the formal sector are likely to be higher for women than for men. It is argued that access to information about jobs is a constraint and social norms often dictate that women devote most of their time to domestic duties rather than looking for work (Fletcher et al. 2018).
Geographical location plays a fairly significant role in the movement of workers across different work status. Compared with the base category of rural workers, urban workers are more likely to experience upward transition. For instance, the likelihood of outflows from the informal sector, especially from the upper-tier of the informal sector, to the formal sector is significantly higher among urban workers than among rural workers (see Figures 3 and 6). Interestingly, at the same time, we also find a higher likelihood of urban workers in informal wage employment transitioning to informal self-employment relative to rural workers.
Finally, as we would expect in the context of India, the social group to which a worker belongs is found to influence worker mobility. Our results suggest that belonging to a forward caste increases the likelihood of a worker making an upward transition. In particular, the likelihood of transition from any informal job status to formal job status is significantly higher among workers belonging to the forward caste category than among workers from backward caste categories. However, the results are mixed for other transitions.

21
Figure 2: Marginal effects for multinomial logistic regression: transitions from formal self-employment
Note: SE, self-employment; WE, wage employment; OBCs, Other Backward Classes; SCs, Scheduled Castes; STs, Scheduled Tribes. Also applicable to Figures 3–7.
Source: authors’ estimates.
Figure 3: Marginal effects for multinomial logistic regression: transitions from upper informal self-employment
Source: authors’ estimates.
-0.4
-0.3
-0.2
-0.1
0.0
0.1
0.2
0.3
0.4
0.5
0.6Lo
wer
prim
ary
Prim
ary
Seco
ndar
y
Hig
her s
econ
dary
Gra
duat
ion
Age
Age2
Fem
ale
Urb
an
OBC
s
SCs
STs
Unm
arrie
d
Hea
d
Education Age Caste
-0.4
-0.3
-0.2
-0.1
0.0
0.1
0.2
0.3
0.4
0.5
0.6
Low
er p
rimar
y
Prim
ary
Seco
ndar
y
Hig
her s
econ
dary
Gra
duat
ion
Age
Age2
Fem
ale
Urb
an
OBC
s
SCs
STs
Unm
arrie
d
Hea
d
Education Age Caste

22
Figure 4: Marginal effects for multinomial logistic regression: transitions from lower informal self-employment
Source: authors’ estimates.
Figure 5: Marginal effects for multinomial logistic regression: transitions from formal wage employment
Source: authors’ estimates.
-0.4-0.3-0.2-0.10.00.10.20.30.40.50.6
Low
er p
rimar
y
Prim
ary
Seco
ndar
y
Hig
her s
econ
dary
Gra
duat
ion
Age
Age2
Fem
ale
Urb
an
OBC
s
SCs
STs
Unm
arrie
d
Hea
d
Education Age Caste
-0.4-0.3-0.2-0.10.00.10.20.30.40.50.6
Low
er p
rimar
y
Prim
ary
Seco
ndar
y
Hig
her s
econ
dary
Gra
duat
ion
Age
Age2
Fem
ale
Urb
an
OBC
s
SCs
STs
Unm
arrie
d
Hea
d
Education Age Caste

23
Figure 6: Marginal effects for multinomial logistic regression: transitions from upper informal wage employment
Source: authors’ estimates.
Figure 7: Marginal effects for multinomial logistic regression: transitions from lower informal wage employment
Source: authors’ estimates.
-0.4
-0.3
-0.2
-0.1
0.0
0.1
0.2
0.3
0.4
0.5
0.6Lo
wer
prim
ary
Prim
ary
Seco
ndar
y
Hig
her s
econ
dary
Gra
duat
ion
Age
Age2
Fem
ale
Urb
an
OBC
s
SCs
STs
Unm
arrie
d
Hea
d
Education Age Caste
-0.4
-0.3
-0.2
-0.1
0.0
0.1
0.2
0.3
0.4
0.5
0.6
Low
er p
rimar
y
Prim
ary
Seco
ndar
y
Hig
her s
econ
dary
Gra
duat
ion
Age
Age2
Fem
ale
Urb
an
OBC
s
SCs
STs
Unm
arrie
d
Hea
d
Education Age Caste

24
6.3 Consequences of worker transition: Income gains and losses
Our findings unambiguously point to substantial labour mobility across various work status in the non-farm sector in India. Does this labour mobility result in income gains? In other words, do workers experience significant wage gains as they transit across work status. In this section, we make an attempt to find an answer to this question, with the important caveat that earnings among self-employed are likely to be measured with error, compared with earnings among wage employed. We do this using the methodological tools discussed in Section 4.3.
Before we discuss the regression results, we look at the differences in mean earnings across different work status and over time. Figure 8 reports the coefficient estimates of the fitted one-way analysis of variance model, regressing log earnings on the work status dummies with formal self-employment being the base category. The figure presents an interesting pattern with respect to labour incomes. The disparity in labour incomes between wage employment and self-employment is clearly visible, with incomes for wage workers on average substantially higher than the self-employed. As expected, within wage employment, formal salaried workers earn significantly more than their counterparts in the informal sector. Surprisingly, within self-employment, the average income for the upper-tier informal self-employed is marginally higher than the self-employed workers in the formal segment. Interestingly, the pattern looks similar in 2005 as well as in 2012.
Figure 8: Analysis of variance of log mean labour income across work status groups, 2005 and 2012
Source: authors’ estimates.
Now, we discuss the main results where we investigate the effect of the transitions on worker’s earnings. Following Danquah et al. (2019), we separately control for formality status and employment status. We present the results in Table 10. Our results are more or less as expected. The gains in earnings over the period 2004/05–2011/12 are substantially higher for those who changed the status from lower-tier to upper-tier or formal status than for those who did not change the status. We estimate that workers who transition from lower-tier informal employment to upper-tier informal employment and formal employment, on average experience a 33.1 and 63.9 per cent rise in earnings relative to those who stay in the same category.
-1.0
-0.2
0.6
1.4
2.2
3.0
3.8
Upper Lower Upper Lower
Formal Informal Formal Informal
Self-employed Wage employed
India (2005)
-1.0
-0.2
0.6
1.4
2.2
3.0
3.8
Upper Lower Upper Lower
Formal Informal Formal Informal
Self-employed Wage employed
India (2012)

25
Table 10: Changes in labour earnings
Variables (1) (2) Log labour earnings −0.656*** −0.625***
(0.006) (0.006) Work status in t=0 (Base: lower informal in t=0)
Formal (t=0) −0.158*** 0.014 (0.041) (0.038)
Upper Informal in t=0 −0.054*** 0.035** (0.016) (0.015)
Work status in t=0 and t=1 (base: lower informal in t=0 and t=1)
Formal (t=0)×Formal (t=1) 1.479*** 1.055*** (0.043) (0.041)
Formal (t=0)×Upper informal (t=1) 0.593*** 0.319*** (0.051) (0.047)
Upper informal (t=0)×Formal (t=1) 0.873*** 0.608*** (0.023) (0.022)
Upper informal (t=0)×Upper informal (t=1) 0.513*** 0.349*** (0.017) (0.017)
Lower informal (t=0)×Formal (t=1) 0.872*** 0.639*** (0.033) (0.031)
Lower informal (t=0)×Upper informal (t=1) 0.430*** 0.331*** (0.016) (0.016)
Employment status in t=0 (base: wage employed in t=0)
Self-employed −0.599*** (0.025)
Employment status in t=0 and t=1 (base: wage employed in t=0 and t=1)
Self-employed in t=0×Self-employed in t=1 0.947*** (0.023)
Wage employed in t=0×Self-employed in t=1 0.647*** (0.020)
Individual characteristics in t=0 Level of education (base: no schooling) Lower primary 0.036** 0.068***
(0.015) (0.014) Primary 0.065*** 0.113***
(0.018) (0.018) Secondary 0.104*** 0.187***
(0.014) (0.014) Higher secondary 0.113*** 0.223***
(0.020) (0.020) Graduation 0.182*** 0.306***
(0.023) (0.022) Age 0.016*** 0.013***
(0.003) (0.003) Age2 −0.000*** −0.000***
(0.000) (0.000) Female −0.421*** −0.343***
(0.015) (0.015) Urban 0.230*** 0.307***
(0.011) (0.011) Unmarried 0.068*** 0.067*** (0.018) (0.017) Head −0.040*** −0.047*** (0.015) (0.014) Constant 5.591*** 5.001***
(0.082) (0.080) Observations 35,658 35,658 Adjusted R2 0.347 0.409
Note: robust standard errors in parentheses. ***p<0.01, **p<0.05, *p<0.1.
Source: authors’ estimates.
Thus, as one would expect, the rise in earnings is substantially higher for those who have made the transition to formal status (see Figure 9). In other words, workers who made the transition to

26
formal sector from upper-tier and lower-tier informal status derived gains in earnings of similar magnitude. Further, positive income gains are also observed for those who transitioned from lower-tier to upper-tier informality compared with those who failed to make the transition. Expectedly, the largest inter-temporal change in earnings is reported by workers who continued to be in the formal sector.
Figure 9: Labour income dynamics
Source: authors’ estimates.
7 Conclusions
This paper examines the nature, magnitude, direction, and implications of employment transition patterns in India, the largest country in South Asia and the country with highest levels of informality. We find significant worker mobility across different work status, although with limited entry into formal versus informal employment. Overall, the transition probabilities suggest relatively more fluidity among self-employed workers than among wage workers. The findings also point to relatively strong segmentation between wage employment and self-employment. Our transition probabilities suggest that workers in formal self-employment are more likely to remain in that state or move into lower-tier self-employment than to move into wage employment. Regarding the mobility pattern of informal self-employed workers, we do not find significant movement of workers from informal self-employment to formal self-employment.
The formal wage workers turned out to be the most reluctant to leave their state, endorsing the prevailing argument that workers regard formal wage employment as the most desirable work status as they are intrinsically more secure and stable than those in the informal sector. There is also a relative absence of evidence supporting the possibility of reverse transition from formal wage employment to formal or upper-tier informal self-employment, as evident in some Latin
-0.4
-0.2
0.0
0.2
0.4
0.6
0.8
1.0
1.2
1.4
1.6
t=1:
For
mal
t=1:
Info
rmal
upp
er
t=1:
Info
rmal
low
er
t=1:
For
mal
t=1:
Info
rmal
upp
er
t=1:
Info
rmal
low
er
t=1:
For
mal
t=1:
Info
rmal
upp
er
t=1:
Info
rmal
low
er
t=0: Formal t=0: Informal upper t=0: Informal lower

27
American countries (Maloney 1999). Our findings thus refute the hypothesis that workers use formal wage employment as an opportunity to upgrade the skill-sets and generate savings so as to set up their own businesses in the upper-tier of the informal sector. Upper-informal wage workers, on the other hand, exhibit a higher likelihood of moving into formal salaried jobs. This perhaps points to the possibility of formal employers using an informal employment relationship as a screening device to overcome information asymmetries and test workers’ abilities before providing formal contracts, as some of the studies on Sub-Saharan Africa suggest (Danquah et al. 2019).
Another noteworthy finding is the high persistence within the lower-tier of informal wage employment, with about three-fourths of workers in this segment not making the transition upwards. The higher retention rate of workers in this segment possibly shows that these workers face significant challenges in changing jobs due to limited human capital and skills and insufficient working capital, especially for those desiring to move to self-employment. Therefore, they are most likely to remain locked in a situation of inferior pay and conditions.
Our analysis on the correlates of labour market transitions suggests a significant role for age, gender, social group, and geographical location in shaping mobility patterns. In line with conventional wisdom, we find that the probability of transitioning into formal employment increases with years of schooling, implying that the more educated the worker the higher the probability of transitioning to a formal job. Confirming the important role of experience, our results also show a higher probability of workers making the transition from the lower-tier of the informal sector to formal wage employment, as they age. We also find a definite gender pattern in transitions as male workers are more likely to move into wage employment while female workers are more likely to stay in self-employment. The findings show that urban workers are more likely to experience upward transition compared with rural workers indicating that geographical location of workers matters a lot in worker transition. Finally, as we would expect in the context of India, the social group to which a worker belongs is found to influence worker mobility. Our results suggest that belonging to a forward caste increases the likelihood of a worker making an upward transition. In particular, the likelihood of transition from any informal job status to a formal job status is significantly higher among workers belonging to a forward caste category compared with workers from backward caste categories.
Our analysis on the implication of transitions on earnings suggests that the rise in earnings is substantially higher for those who have made the transition to formal status. Positive income gains are also observed for those who transitioned from lower-tier to upper-tier informality compared with those who failed to make the transition. Expectedly, the largest inter-temporal change in earnings is reported by workers who continued to be in the formal sector.
Overall, our results suggest that lower-tier informal workers, whether in self-employment or wage employment, have limited upward transition possibilities and are in a dead-end work status. That this has happened in a high-growth phase of the Indian economy, suggests that economic growth by itself may not make material difference to reducing the high rates of informality in India, and that direct state interventions that enhance the livelihoods of lower tier informal workers may be necessary.
In this paper, we have provided a descriptive account of the patterns and likelihood of transition of individual workers across six different work status. A limitation of our study is that we are not able to provide a causal analysis of factors that can explain why some workers are able to move from lower-tier to upper-tier informal work status, and to formal employment, when the majority of workers do not transition. This is an area of future research.

28
References
Bandiera, O., R. Burgess, N. Das, S. Gulesci, I. Rasul, and M. Sulaiman (2013). ‘Can Basic Entrepreneurship Transform the Economic Lives of the Poor?’. IZA Discussion Paper 7386. Bonn: Institute of Labor Economics.
Banerjee, B., and J.B. Knight (1985). ‘Caste Discrimination in the Indian Urban Labour Market’. Journal of Development Economics, 17(3): 277–307. https://doi.org/10.1016/0304-3878(85)90094-X
Banerji, S., R.S.N. Raj, and K. Sen (2016). ‘Monitoring Costs, Credit Constraints and Entrepreneurship’. Manchester School, 84(5): 573–99. https://doi.org/10.1111/manc.12122
Basu, A.K., N.H. Chau, G.S. Fields, and R. Kanbur (2019). ‘Job Creation in a Multi-Sector Labour Market Model for Developing Economies’. Oxford Economic Papers, 71(1): 119–44. https://doi.org/10.1093/oep/gpy029
Bernabè, S., and M. Stampini (2009). ‘Labour Mobility During Transition: Evidence from Georgia’. Economics of Transition, 17(2): 377–409. https://doi.org/10.1111/j.1468-0351.2009.00345.x
Besley, T., and R. Burgess (2004). ‘Can Labour Regulation Hinder Economic Performance? Evidence from India’. The Quarterly Journal of Economics, 119(1): 91–134. https://doi.org/10.1162/003355304772839533
Bardhan, P. (2018). ‘Reflections on Kalyan Sanyal’s Rethinking Capitalist Development’. Economic and Political Weekly, 53(2): 19–22.
Barnes, T. (2015). Informal Labour in Urban India: Three Cities, Three Journeys. London and New York: Routledge. https://doi.org/10.4324/9781315737751
Bayly, S. (1999). Caste, Society and Politics in India: From the Eighteenth Century to the Modern Age. Cambridge: Cambridge University Press. https://doi.org/10.1017/CHOL9780521264341
Benjamin, N., and A.A. Mbaye (2014). ‘Informality, Growth, and Development in Africa’. WIDER Working Paper 2014/52. Helsinki: UNU-WIDER. https://doi.org/10.35188/UNU-WIDER/2014/773-8
Breman, J. (2012). Footloose Labour: Working in India’s Informal Economy. Cambridge: Cambridge University Press.
Canelas, C. (2019). ‘Informality and Poverty in Ecuador’. Small Business Economics, 53: 1097–115. https://doi.org/10.1007/s11187-018-0102-9
Charmes, J. (2016). ‘The Informal Economy: Definitions, Size, Contribution and Main Characteristics’. In E. Kraemer-Mbula and S. Wunsch-Vincent (eds), The Informal Economy in Developing Nations: Hidden Engine of Innovation? (pp. 13–52). Cambridge, UK: Cambridge University Press. https://doi.org/10.1017/CBO9781316662076.006
Chatterjee, U., and R. Kanbur (2014). ‘Regulation and Non-Compliance: Magnitudes and Patterns for India’s Factories Act’. World Bank Other Operational Studies 16717. Washington, DC: The World Bank. https://doi.org/10.1596/1813-9450-6755
Chaudhuri, S., and U. Mukhopadhyay (2010). Revisiting the Informal Sector: A General Equilibrium Approach. New York: Springer-Verlag. https://doi.org/10.1007/978-1-4419-1194-0
Chen, M.A. (2006). ‘Rethinking the Informal Economy: Linkages with the Formal Economy and the Formal Regulatory Environment’. In B. Guha-Khasnobis, R. Kanbur, and E. Ostrom, (eds), Linking the Formal and Informal Economy: Concepts and Policies (pp. 75–92). Oxford: Oxford University Press. https://doi.org/10.1093/0199204764.003.0005
Chen, M.A. (2012). ‘The Informal Economy: Definitions, Theories and Policies’. WIEGO Working Paper 1. Cambridge, MA: Women in Informal Employment: Globalizing and Organizing (WIEGO).
Chen, M., J. Vanek, and J. Heintz (2006). ‘Informality, Gender and Poverty: A Global Picture’. Economic and Political Weekly, 41(21): 2131–39.

29
Danquah, M., S. Schotte, and K. Sen (2019). ‘Informal Work in Sub-Saharan Africa: Dead End or Steppingstone?’. WIDER Working Paper 2019/107. Helsinki: UNU-WIDER. https://doi.org/10.35188/UNU-WIDER/2019/743-9
Dhanaraj, S., and V. Mahambare (2019). ‘Family Structure, Education and Women’s Employment in Rural India’. World Development, 115: 17–29. https://doi.org/10.1016/j.worlddev.2018.11.004
Dumont, L (1970). Homo Hierarchicus. The Caste System and Its Implications. London: Paladin Press.
Fields, G.S. (1990). ‘Labour Market Modelling and the Urban Informal Sector: Theory and Evidence’. In D. Turnham, B. Salomé, and A. Schwarz (eds), The Informal Sector Revisited. Paris: Organisation for Economic Co-operation and Development.
Fields, G.S. (2005). ‘A Guide to Multisector Labor Market Models’. Social Protection Discussion Paper Series 0505. Washington, DC: World Bank.
Fields, G.S. (2007). ‘Labor Market Policy in Developing Countries: A Selective Review of the Literature and Needs for the Future’. Policy Research Working Paper 4362. Washington, DC: The World Bank. https://doi.org/10.1596/1813-9450-4362
Fields, G.S. (2019). Employment and Development: How Work Can Lead from and into Poverty. Oxford: Oxford University Press. https://doi.org/10.1093/oso/9780198815501.001.0001
Fletcher, E., R. Pande, and C. Moore (2018). ‘Women and Work in India: Descriptive Evidence and a Review of Potential Policies’. HKS Working Paper RWP18-004. Cambridge, MA: Harvard Kennedy School.
Gang, I., K. Sen, and M.-S. Yun (2008). ‘Poverty in Rural India: Caste and Tribe’. Review of Income and Wealth, 54(1): 50–70. https://doi.org/10.1111/j.1475-4991.2007.00259.x
Gang, I., K. Sen, and M.S. Yun (2016). ‘Is Caste Destiny? Occupational Diversification among Dalits in Rural India’. European Journal of Development Research, 29(2): 476–92. https://doi.org/10.1057/s41287-016-0011-1
Ghani, E., R. Kanbur, and S.D. O’Connell (2014). ‘Urbanization and Agglomeration Benefits: Gender Differentiated Impacts on Enterprise Creation in India’s Informal Sector’. Working Paper WP2014-04. Ithaca, New York: Charles H. Dyson School of Applied Economics and Management, Cornell University.
Gong, X., A. Van Soest, and E. Villagomez (2004). ’Mobility in the Urban Labor Market: A Panel Data Analysis for Mexico’. Economic Development and Cultural Change, 53(1): 1–36. https://doi.org/10.1086/423251
Günther, I., and A. Launov (2012). ‘Informal Employment in Developing Countries: Opportunity or Last Resort?’. Journal of Development Economics, 97(1): 88–98. https://doi.org/10.1016/j.jdeveco.2011.01.001
Harati, R. (2013). ‘Heterogeneity in the Egyptian Informal Labour Market: Choice or Obligation?’. Revue d’économie politique, 123(4): 623–39. https://doi.org/10.3917/redp.234.0623
Harriss-White, B. (2010). India Working: Essays on Society and Economy. Cambridge: Cambridge University Press.
Howard, L.L., and N. Prakash (2012). ‘Do Employment Quotas Explain the Occupational Choices of Disadvantaged Minorities in India?’. International Review of Applied Economics, 26(4): 489–513. https://doi.org/10.1080/02692171.2011.619969
IHDS (2020). IHDS Data: IHDS-1 and IHDS-2. Available at: https://ihds.umd.edu (accessed November 2019).
ILO (2003). Report of the Conference. Seventeenth International Conference of Labour Statisticians, Geneva, 24 November–3 December. Available at: https://www.ilo.org/public/english/standards/relm/gb/docs/gb289/pdf/icls-17.pdf (accessed August 2020).

30
ILO (2014). ‘Transitioning from the Informal to the Formal Economy’. Report (V) 1. International Labour Conference 103rd Session. Geneva: International Labour Organization (ILO). Available at: https://www.ilo.org/wcmsp5/groups/public/---ed_norm/---relconf/documents/meetingdocument/wcms_218128.pdf (accessed August 2020).
ILO (2018). Women and Men in the Informal Economy: A Statistical Picture (3rd edition). Geneva: International Labour Organization (ILO). Available at: https://www.ilo.org/wcmsp5/groups/public/---dgreports/---dcomm/documents/publication/wcms_626831.pdf (accessed August 2020).
ILO (2020). ‘Informal Employment’. ILO Thesaurus. Available at: https://metadata.ilo.org/thesaurus/936921656.html (accessed August 2020).
Ito, T. (2009). ‘Caste Discrimination and Transaction Costs in the Labor Market: Evidence from Rural North India’. Journal of Development Economics, 88(2): 292–300. https://doi.org/10.1016/j.jdeveco.2008.06.002
Kanbur, R. (2017). ‘Informality: Causes, Consequences and Policy Responses’. Review of Development Economics, 21: 939–61. https://doi.org/10.1111/rode.12321
Kannan, K.P., and T.S. Papola (2007). ‘Workers in the Informal Sector: Initiatives by India’s National Commission for Enterprises in the Unorganized Sector (NCEUS)’. International Labour Review, 146(3-4): 321–29. https://doi.org/10.1111/j.1564-913X.2007.00018.x
Kathuria, V., and R.S.N. Raj (2016). ‘Do Informal Sector Wages Explain Rural Poverty? Evidence from India’. Journal of Poverty, 20(1): 73–101. https://doi.org/10.1080/10875549.2015.1094762
Kathuria, V., R.S.N. Raj, and K. Sen (2013). ‘The Effects of Economic Reforms on Manufacturing Dualism: Evidence from India’. Journal of Comparative Economics, 41: 1240–62. https://doi.org/10.1016/j.jce.2012.10.003
La Porta, R., and A. Shleifer (2014). ‘Informality and Development’. Journal of Economic Perspectives, 28(3): 109–26. https://doi.org/10.1257/jep.28.3.109
Lei, L., S. Desai, and R. Vanneman (2019), ’The Impact of Transportation Infrastructure on Women’s Employment in India’. Feminist Economics, 25(4): 94–125. https://doi.org/10.1080/13545701.2019.1655162
Loayza, N., O.A. Maria, and L. Servén (2006). ‘The Impact of Regulation on Growth and Informality: Cross-Country Evidence’. In B. Guha-Khasnobis, R. Kanbur, and E. Ostrom (eds), Linking the Formal and Informal Economy: Concepts and Policies (pp. 121–44). Oxford: Oxford University Press.
Maloney, W.F. (1999). ‘Does Informality Imply Segmentation in Urban Labor Markets? Evidence from Sectoral Transitions in Mexico’. World Bank Economic Review, 13: 275–302. https://doi.org/10.1093/wber/13.2.275
Mazumdar, D., and S. Sarkar (2013). Manufacturing Enterprise in Asia: Size Structure and Economic Growth. London and New York: Routledge.
Marjit, S., and S. Kar (2011). The Outsiders: Economic Reform and Informal Labour in a Developing Economy. New Delhi: Oxford University Press. https://doi.org/10.1093/acprof:oso/9780198071495.001.0001
McCaig, B., and N. Pavcnik (2018). ‘Export Markets and Labor Allocation in a Low-Income Country’. American Economic Review, 108(7): 1899–941. https://doi.org/10.1257/aer.20141096
NCEUS (2007). Report on Conditions of Work and Promotion of Livelihoods in the Unorganised Sector. New Delhi: National Commission for Enterprises in the Unorganised Sector (NCEUS), Government of India.
NCEUS (2009). The Challenge of Employment in India: An Informal Economy Perspective. New Delhi: National Commission for Enterprises in the Unorganised Sector (NCEUS), Government of India.
Neetha, N. (2010). ‘Self-Employment of Women: Preference or Compulsion?’. Social Change, 40(2): 139–56. https://doi.org/10.1177/004908571004000203
NSSO (2019). Periodic Labour Force Survey 2017–18. New Delhi: Ministry of Statistics and Programme Implementation, Government of India.
https://www.ilo.org/wcmsp5/groups/public/---dgreports/---dcomm/documents/publication/wcms_626831.pdf

31
Raj, R.S.N., and K. Sen (2015). ‘Finance Constraints and Firm Transition in the Informal Sector: Evidence from Indian Manufacturing’. Oxford Development Studies, 43(1):123–43. https://doi.org/10.1080/13600818.2014.972352
Raj, R.S.N., and K. Sen (2016). Out of the Shadows? The Informal Manufacturing in Post-Reform India. Delhi: Oxford University Press. https://doi.org/10.1093/acprof:oso/9780199460847.001.0001
Raj, R.S.N., and K. Sen (2020). ‘The “Missing Middle” Problem in Indian Manufacturing: What Role Do Institutions Play?’. Economic and Political Weekly, 55(16): 51–60.
Ranis, G., and F. Stewart (1999). ‘V-Goods and the Role of the Urban Informal Sector in Development’. Economic Development and Cultural Change, 47(2): 259–88. https://doi.org/10.1086/452401
Saha, B., K. Sen, and D. Maiti (2013). ‘Trade Openness, Labour Institutions and Flexibilisation: Theory and Evidence from India’. Labour Economics, 24: 180–95. https://doi.org/10.1016/j.labeco.2013.08.008
Shah, A., J. Lerche, R. Axelby, D. Benbabaali, B. Donegan, J. Raj, and V. Thakur (2018). Ground Down by Earth: Tribe, Caste, Class and Inequality in Twenty-First Century India. New Delhi: Oxford University Press.
Sheikh, R.A., and S. Gaurav (2020). ‘Informal Work in India: A Tale of Two Definitions’. The European Journal of Development Research, 32: 1105–27. https://doi.org/10.1057/s41287-020-00258-z
Shonchoy, A.S., and P.N.R. Junankar (2014). ‘The Informal Labour Market in India: Transitory or Permanent Employment for Migrants?, IZA Journal of Labor and Development, 3: 9. https://doi.org/10.1186/2193-9020-3-9
Stuart, E., E. Samman, and A. Hunt (2018). ‘Informal Is the New Normal: Improving the Lives of Workers at Risk of Being Left Behind’. Working Paper 530. London: Overseas Development Institute. Available at: https://www.odi.org/publications/11025-informal-new-normal-improving-lives-workers-risk-being-left-behind (accessed August 2020).
Unni, J. (1998). ‘Employment and Wages in the Unorganised Sector: Issues in Wage Policy’. The Indian Journal of Labour Economics, 41(4): 875–92.
Unni, J., and U. Rani (2003). ‘Social Protection for Informal Workers in India: Insecurities, Instruments and Institutional Mechanisms’. Development and Change, 34(1): 127–61. https://doi.org/10.1111/1467-7660.00299
Vaid, D. (2012). ‘The Caste–Class Association in India: An Empirical Analysis’. Asian Survey, 52(2): 395–422. https://doi.org/10.1525/as.2012.52.2.395
Wang, W., G. Xie, and L. Hao (2014). ‘Rural Panel Surveys in Developing Countries: A Selective Review’. Economic and Political Studies, 2(2): 151–77. https://doi.org/10.1080/20954816.2014.11673849

32
Appendix A: Complementary tables
Table A1: Transition matrices across work status groups, including additional destination states (family farms under lower-tier informal self-employment and unemployment)
2012 Total Self-employed Wage employed Unemployment
Formal Informal Formal Informal Upper Lower Upper Lower
2005
Self-employed Formal
163 45 146 73 52 138 162 779
(21.0) (5.7) (18.8) (9.4) (6.7) (17.7) (20.8) 100.0
Informal Upper 83 992 1,403 238 302 572 724 4,316
(1.9) (23.0) (32.5) (5.5) (7.0) (13.2) (16.8) 100.0
Lower 186 1,135 4,795 559 1,219 2,830 2,293 13,017
(1.4) (8.7) (36.8) (4.3) (9.4) (21.7) (17.6) 100.0
Wage employed Formal
54 96 269 2,304 642 471 546 4,381
(1.2) (2.2) (6.1) (52.6) (14.7) (10.7) (12.5) 100.0
Informal Upper 166 326 1,291 1,827 4,264 4,568 1,335 13,778
(1.2) (2.4) (9.4) (13.3) (31.0) (33.2) (9.7) 100.0
Lower 18 159 916 422 1,979 21,595 5,077 33,620
(0.1) (1.0) (5.9) (2.7) (12.8) (64.2) (15.1) 100.0
Total 848 3,199 10,147 5,831 9,556 30,173 10,137 69,892 (1.2) (4.6) (14.5) (8.3) (13.7) (43.2) (14.5) 100.0
Note: we used sample weights to arrive at these estimates. Percentages are reported in parentheses.
Source: authors’ estimates.
Table A2: Transition matrices across aggregate work status groups
2012 Total Formal Upper informal Lower informal
2005 Formal 63.47 19.56 16.98 3,933 Upper informal 15.88 40.77 43.35 13,842 Lower informal 5.35 21.05 73.60 19,581
Total 5,742 10,534 21,080 37,356
Note: we omit agricultural work and animal care work and those who are unemployed from the final estimation. We used sample weights to arrive at these estimates.
Source: authors’ estimates.

33
Table A3: Multinomial logit analysis of worker characteristics influencing transitions, 2005–12
Workers’ transition between sectors
Education level Age Age2 Female Urban
Social group Unmarried Head Lower
primary Primary Secondary Higher secondary Graduation OBCs SCs STs
From formal SE toa Upper informal SE
0.06 (0.08)
0.18* (0.10)
0.05 (0.07)
0.03 (0.06)
0.01 (0.06)
0.02* (0.01)
−0.00* (0.00)
0.04 (0.04)
0.14*** (0.03)
0.08** (0.03)
0.03 (0.04)
−0.06*** (0.02)
−0.01 (0.04)
−0.02 (0.04)
Lower informal SE
0.06 (0.09)
0.00 (0.10)
−0.07 (0.07)
−0.02 (0.08)
−0.02 (0.08)
−0.02 (0.01)
0.00 (0.00)
0.00 (0.05)
−0.18*** (0.04)
−0.02 (0.04)
−0.05 (0.06)
−0.06 (0.13)
−0.20*** (0.04)
−0.06 (0.05)
Formal WE
0.03 (0.03)
0.14** (0.07)
0.11*** (0.03)
0.18*** (0.04)
0.21*** (0.04)
0.01 (0.01)
−0.00 (0.00)
−0.05 (0.04)
−0.03 (0.04)
0.01 (0.04)
0.09 (0.06)
−0.13*** (0.02)
0.00 (0.06)
0.02 (0.05)
Upper informal
0.07 (0.11)
−0.05 (0.10)
0.01 (0.09)
−0.01 (0.09)
−0.05 (0.08)
0.03** (0.01)
−0.00** (0.00)
−0.10*** (0.04)
0.04 (0.03)
0.04 (0.03)
0.10* (0.06)
−0.08*** (0.02)
0.17* (0.09)
0.04 (0.04)
Lower informal
−0.07 (0.08)
−0.07 (0.10)
−0.17** (0.07)
−0.18** (0.08)
−0.24*** (0.07)
−0.02* (0.01)
0.00* (0.00)
−0.04 (0.04)
−0.10*** (0.02)
0.03 (0.03)
0.10** (0.04)
0.31*** (0.10)
−0.06* (0.04)
0.05 (0.05)
From upper informal SE tob Formal SE
0.00 (0.01)
−0.00 (0.01)
0.02* (0.01)
0.01 (0.01)
0.03** (0.01)
−0.00 (0.00)
0.00* (0.00)
0.01 (0.01)
0.01** (0.01)
−0.04*** (0.01)
−0.02 (0.01)
−0.05*** (0.01)
0.02 (0.01)
−0.02** (0.01)
Lower informal SE
0.04 (0.04)
−0.07* (0.04)
−0.08*** (0.03)
−0.11*** (0.03)
−0.15*** (0.03)
−0.01** (0.01)
0.00** (0.00)
0.08*** (0.02)
0.07*** (0.02)
0.05** (0.02)
−0.01 (0.03)
−0.06 (0.06)
−0.03 (0.03)
0.02 (0.03)
Formal WE
−0.03** (0.02)
−0.01 (0.02)
0.04** (0.02)
0.05** (0.02)
0.07*** (0.02)
0.00 (0.00)
−0.00 (0.00)
−0.06*** (0.01)
0.02* (0.01)
−0.00 (0.01)
0.04* (0.02)
0.09 (0.06)
0.02 (0.02)
0.01 (0.01)
Upper informal WE
−0.03 (0.03)
0.01 (0.03)
−0.05** (0.02)
−0.06** (0.02)
−0.08*** (0.02)
0.00 (0.00)
−0.00 (0.00)
−0.08*** (0.01)
−0.01 (0.01)
0.00 (0.01)
0.04* (0.02)
0.03 (0.04)
0.03 (0.02)
0.03 (0.02)
Lower informal WE
−0.03 (0.02)
−0.04* (0.02)
−0.07*** (0.02)
−0.11*** (0.02)
−0.11*** (0.02)
−0.00 (0.00)
−0.00 (0.00)
−0.04*** (0.01)
−0.09*** (0.01)
0.01 (0.01)
0.08*** (0.02)
0.15*** (0.04)
−0.03* (0.01)
−0.00 (0.01)
From lower informal SE toc Formal SE
0.00 (0.00)
0.01 (0.01)
0.01** (0.00)
0.03*** (0.01)
0.05*** (0.01)
0.00 (0.00)
−0.00 (0.00)
0.02*** (0.01)
−0.01* (0.00)
−0.02*** (0.00)
−0.02*** (0.01)
−0.03*** (0.01)
0.01 (0.01)
0.00 (0.01)
Upper informal SE
0.01 (0.01)
0.04** (0.01)
0.06*** (0.01)
0.08*** (0.02)
0.08*** (0.02)
0.00 (0.00)
0.00 (0.00)
0.04*** (0.01)
0.05*** (0.01)
−0.02* (0.01)
−0.03** (0.01)
−0.05** (0.02)
0.01 (0.01)
−0.01 (0.01)
Formal WE
0.02** (0.01)
−0.01 (0.01)
0.05*** (0.01)
0.08*** (0.01)
0.11*** (0.02)
0.00** (0.00)
−0.00*** (0.00)
−0.04*** (0.01)
0.02*** (0.01)
−0.01 (0.01)
0.03*** (0.01)
0.01 (0.02)
0.02** (0.01)
−0.01 (0.01)
Upper informal WE
−0.01 (0.01)
0.01 (0.02)
−0.05*** (0.01)
−0.06*** (0.01)
−0.06*** (0.02)
0.01** (0.00)
−0.00*** (0.00)
−0.12*** (0.01)
0.01* (0.01)
0.03*** (0.01)
0.05*** (0.01)
0.05** (0.02)
0.02 (0.01)
0.00 (0.01)

34
Lower informal WE
−0.06*** (0.01)
−0.09*** (0.01)
−0.12*** (0.01)
−0.16*** (0.01)
−0.19*** (0.01)
0.00 (0.00)
−0.00 (0.00)
−0.09*** (0.01)
−0.17*** (0.01)
0.01 (0.01)
0.08*** (0.01)
0.21*** (0.02)
−0.04*** (0.01)
−0.02** (0.01)
From formal WE tod Formal SE
0.00 (0.01)
0.00 (0.01)
0.00 (0.00)
0.01 (0.01)
0.03*** (0.01)
−0.00** (0.00)
0.00*** (0.00)
−0.00 (0.00)
0.00 (0.00)
−0.00 (0.00)
−0.01 (0.01)
−0.01 (0.01)
−0.01 (0.01)
−0.01 (0.01)
Upper informal SE
0.01 (0.01)
0.00 (0.01)
0.02 (0.01)
0.01 (0.01)
0.00 (0.01)
−0.01*** (0.00)
0.00*** (0.00)
−0.02*** (0.01)
0.00 (0.00)
0.01 (0.01)
−0.01* (0.01)
−0.00 (0.01)
0.00 (0.01)
−0.01 (0.01)
Lower informal SE
−0.03 (0.02)
0.01 (0.02)
−0.02 (0.02)
−0.01 (0.02)
−0.02 (0.02)
−0.02*** (0.00)
0.00*** (0.00)
−0.01 (0.01)
0.02** (0.01)
0.01 (0.01)
−0.03*** (0.01)
−0.04*** (0.01)
−0.04*** (0.01)
−0.01 (0.01)
Upper informal WE
−0.08** (0.04)
−0.12*** (0.04)
−0.167*** (0.03)
−0.22*** (0.03)
−0.25*** (0.03)
−0.01*** (0.01)
0.00* (0.00)
−0.03* (0.02)
0.03** (0.01)
0.02 (0.01)
−0.05*** (0.02)
−0.04* (0.02)
0.02 (0.02)
0.00 (0.02)
Lower informal WE
−0.08*** (0.03)
−0.08** (0.03)
−0.18*** (0.02)
−0.20*** (0.02)
−0.21*** (0.02)
−0.02*** (0.00)
0.00*** (0.00)
−0.02** (0.01)
−0.06*** (0.01)
0.04*** (0.01)
0.03*** (0.01)
0.03* (0.01)
−0.03** (0.01)
−0.01 (0.01)
From upper informal WE toe Formal SE
0.00 (0.00)
0.00 (0.00)
0.01*** (0.00)
0.03*** (0.01)
0.08*** (0.01)
−0.00 (0.00)
0.00 (0.00)
0.00 (0.00)
−0.00 (0.00)
−0.01*** (0.00)
−0.01*** (0.00)
−0.00 (0.01)
0.00 (0.00)
0.00 (0.00)
Upper informal SE
0.01* (0.00)
0.02*** (0.01)
0.02*** (0.00)
0.01 (0.01)
0.02** (0.01)
0.00 (0.00)
−0.00 (0.00)
0.00 (0.01)
0.01** (0.00)
−0.01** (0.01)
−0.03*** (0.01)
−0.03*** (0.01)
0.01 (0.01
−0.00 (0.01)
Lower informal SE
−0.01 (0.01)
−0.01 (0.01)
0.00 (0.01)
0.02 (0.01)
−0.00 (0.01)
0.00 (0.00)
0.00 (0.00)
0.03*** (0.01)
0.05*** (0.01)
0.00 (0.01)
−0.05*** (0.01)
−0.06*** (0.0126)
0.01 (0.01)
0.01 (0.01)
Formal WE
0.04*** (0.01)
0.07*** (0.01)
0.16*** (0.01)
0.27*** (0.02)
0.36*** (0.02)
0.00 (0.00)
−0.00 (0.00)
0.01 (0.01)
0.09*** (0.01)
−0.08*** (0.01)
−0.07*** (0.01)
−0.11*** (0.02)
0.00 (0.01)
0.00 (0.01)
Lower informal WE
−0.04*** (0.01)
−0.11*** (0.02)
−0.16*** (0.01)
−0.22*** (0.02)
−0.29*** (0.02)
−0.01*** (0.00)
0.00** (0.00)
−0.05*** (0.01)
−0.26*** (0.01)
0.01 (0.01)
0.10*** (0.01)
0.10*** (0.02)
−0.06*** (0.01)
−0.01 (0.01)
From lower informal WE tof Formal SE
0.00 (0.00)
−0.00 (0.00)
0.01** (0.00)
0.01 (0.01)
−0.00*** (0.00)
0.00 (0.00)
−0.00 (0.00)
0.01 (0.00)
−0.00 (0.00)
−0.00 (0.00)
−0.00 (0.00)
−0.01** (0.00)
0.00 (0.00)
0.00 (0.00)
Upper informal SE
0.00 (0.00)
0.01 (0.01)
0.00 (0.00)
0.02* (0.01)
0.07* (0.04)
0.00 (0.00)
−0.00 (0.00)
0.00 (0.00)
0.02*** (0.01)
−0.00 (0.01)
−0.01* (0.01)
−0.01* (0.01)
0.01 (0.01)
−0.00 (0.00)
Lower informal SE
0.00 (0.01)
0.01 (0.01)
0.02** (0.01)
0.05** (0.02)
0.05 (0.05)
−0.00 (0.00)
0.00 (0.00)
0.02* (0.01)
0.04*** (0.01)
0.00 (0.01)
−0.05*** (0.01)
−0.03*** (0.01)
−0.02* (0.01)
−0.01 (0.01)
Formal WE
0.00 (0.00)
0.02*** (0.02)
0.05*** (0.01)
0.06*** (0.02)
0.14*** (0.05)
0.00** (0.00)
−0.00* (0.00)
−0.02*** (0.00)
0.05*** (0.01)
−0.03*** (0.01)
−0.02*** (0.01)
−0.02*** (0.01)
0.01 (0.01)
−0.01*** (0.01)
Upper informal WE
0.03** (0.01)
0.00 (0.01)
0.04*** (0.01)
0.02 (0.02)
0.07 (0.06)
0.00 (0.00)
−0.00* (0.00)
−0.09*** (0.01)
0.05*** (0.01)
0.03* (0.01)
0.03* (0.01)
−0.01 (0.02)
0.04** (0.02)
−0.02 (0.01)

35
Note: OBCs, Other Backward Classes; SCs, Scheduled Castes; STs, Scheduled Tribes; SE, self-employment; WE, wage employment. The table reports marginal effects. The marginal effects provide how education, age, gender, location, social group, marital status, and headship affect the probability of an individual to transition out of a sector towards another sector relative to continuing to earn their primary income from the same sector. Robust standard errors are in parentheses. ***p<0.01, **p<0.05, *p<0.1. aNumber of observations is 420, pseudo R2 is 0.215, and log likelihood is −548.7. bNumber of observations is 3,111, pseudo R2 is 0.0938, and log likelihood is −4060. cNumber of observations is 7,756, pseudo R2 is 0.105, and log likelihood is −9,948. dNumber of observations is 3,856, pseudo R2 is 0.135, and log likelihood is −3,526. eNumber of observations is 10,149, pseudo R2 is 0.106, and log likelihood is −12,876. fNumber of observations is 10,366, pseudo R2 is 0.0420, and log likelihood is −9,377.
Source: authors’ estimates based on India Human Development Survey (IHDS) data.

36
Table A4: Correlates of worker transition, 2005–12: multinomial logit analysis including additional destination states
Workers’ transition between sectors
Education level Age Age2 Female Urban Social group Unmarried Head Lower
primary Primary Secondary Higher
secondary Graduation OBCs SCs STs
From formal SE toa Upper informal SE
0.05 0.11* 0.06** 0.04 0.04 0.01 −0.00 0.00 0.08*** 0.03 0.01 −0.05*** −0.01 −0.01
(0.04) (0.06) (0.03) (0.03) (0.02) (0.01) (0.00) (0.03) (0.02) (0.02) (0.03) (0.01) (0.03) (0.03) Lower informal SE
−0.07 −0.11 −0.20*** −0.16** −0.21*** −0.01 0.00 −0.03 −0.19*** −0.00 −0.09* −0.11 −0.14*** −0.06
(0.08) (0.09) (0.06) (0.07) (0.07) (0.01) (0.00) (0.04) (0.04) (0.04) (0.04) (0.13) (0.05) (0.05) Formal WE 0.02 0.10** 0.08*** 0.11*** 0.17*** 0.01* −0.00** −0.05* −0.00 0.02 0.08** −0.08*** 0.00 0.05 (0.02) (0.05) (0.02) (0.03) (0.03) (0.01) (0.00) (0.03) (0.02) (0.02) (0.04) (0.02) (0.04) (0.04) Upper informal WE
0.05 −0.01 0.04 0.02 −0.00 0.02** −0.00** −0.08*** 0.03 0.03 0.07* −0.05*** 0.08 0.05
(0.06) (0.05) (0.05) (0.05) (0.04) (0.01) (0.00) (0.03) (0.02) (0.02) (0.04) (0.01) (0.06) (0.04) Lower informal WE
−0.04 −0.06 −0.12*** −0.13*** −0.17*** −0.00 0.00 −0.05 −0.07*** 0.03* 0.08*** 0.33*** −0.04 0.04
(0.05) (0.06) (0.04) (0.05) (0.04) (0.00) (0.00) (0.03) (0.02) (0.02) (0.03) (0.11) (0.03) (0.04) Unemployment 0.03 0.05 0.04 0.05 −0.01 −0.01 0.00 0.18*** 0.02 −0.01 0.02 −0.18*** 0.07 −0.06
(0.06) (0.07) (0.05) (0.06) (0.05) (0.01) (0.00) (0.04) (0.03) (0.03) (0.05) (0.03) (0.06) (0.05) From upper informal SE tob Formal SE 0.01 −0.00 0.01* 0.01 0.03*** −0.00 0.00 −0.00 0.01*** −0.03*** −0.02** −0.04*** 0.02 −0.01**
(0.01) (0.01) (0.01) (0.01) (0.01) (0.00) (0.00) (0.01) (0.01) (0.01) (0.01) (0.00) (0.01) (0.01) Lower informal SE
−0.02 −0.10*** −0.09*** −0.13*** −0.18*** 0.00 −0.00 −0.03 −0.00 0.05*** −0.03 −0.05 −0.03 −0.01
(0.03) (0.03) (0.03) (0.03) (0.03) (0.00) (0.00) (0.02) (0.02) (0.02) (0.03) (0.05) (0.03) (0.02) Formal WE −0.02** −0.00 0.03*** 0.04*** 0.05*** 0.00* −0.00** −0.05*** 0.02*** 0.00 0.04** 0.07* 0.02 0.01 (0.01) (0.01) (0.01) (0.01) (0.01) (0.00) (0.00) (0.01) (0.01) (0.01) (0.02) (0.04) (0.01) (0.01) Upper informal WE
−0.01 0.02 −0.03** −0.04** −0.05*** 0.00 −0.00* −0.08*** 0.00 0.01 0.03** 0.05 0.02 0.02
(0.02) (0.02) (0.02) (0.02) (0.02) (0.00) (0.00) (0.01) (0.01) (0.01) (0.01) (0.03) (0.01) (0.01) Lower informal WE
−0.01 −0.03 −0.05*** −0.07*** −0.07*** 0.00 −0.00 −0.04*** −0.06*** 0.01 0.05*** 0.11*** −0.01 0.01
(0.01) (0.02) (0.01) (0.01) (0.01) (0.00) (0.00) (0.01) (0.01) (0.01) (0.01) (0.03) (0.01) (0.01)

37
Unemployment 0.02 0.03 0.00 −0.00 0.01 −0.02*** 0.00*** 0.18*** −0.02 −0.02* 0.04* −0.02 −0.00 −0.00 (0.02) (0.02) (0.02) (0.02) (0.02) (0.00) (0.00) (0.02) (0.01) (0.01) (0.02) (0.04) (0.02) (0.02) From lower informal SE toc Formal SE 0.00** 0.00 0.01*** 0.02*** 0.03*** 0.00 −0.00 0.00** 0.00** −0.01*** −0.01*** −0.02*** 0.01* −0.00 (0.00) (0.00) (0.00) (0.00) (0.01) (0.00) (0.00) (0.00) (0.00) (0.00) (0.00) (0.00) (0.00) (0.00) Upper informal SE
0.01 0.01*** 0.03*** 0.05*** 0.05*** 0.00* −0.00 0.00 0.07*** −0.01 −0.02*** −0.03*** 0.01 −0.00
(0.00) (0.01) (0.00) (0.01) (0.01) (0.00) (0.00) (0.00) (0.00) (0.00) (0.00) (0.01) (0.01) (0.00) Formal WE 0.00 −0.00 0.03*** 0.05*** 0.08*** 0.00*** −0.00*** −0.03*** 0.02*** −0.00 0.02*** 0.02*** 0.01*** −0.00 (0.00) (0.00) (0.00) (0.00) (0.01) (0.00) (0.00) (0.00) (0.00) (0.00) (0.01) (0.01) (0.00) (0.00) Upper informal WE
−0.01 −0.00 −0.02*** −0.03*** −0.03*** 0.01*** −0.00*** −0.09*** 0.03*** 0.03*** 0.04*** 0.04*** 0.02*** 0.01
(0.01) (0.01) (0.01) (0.01) (0.01) (0.00) (0.00) (0.00) (0.00) (0.00) (0.01) (0.01) (0.01) (0.01) Lower informal WE
−0.03*** −0.06*** −0.10*** −0.13*** −0.15*** 0.00 −0.00*** −0.10*** −0.12*** 0.02*** 0.12*** 0.14*** −0.03*** 0.01
(0.01) (0.01) (0.01) (0.01) (0.01) (0.00) (0.00) (0.01) (0.00) (0.00) (0.01) (0.01) (0.01) (0.01) Unemployment 0.02*** 0.06*** 0.05*** 0.05*** 0.07*** −0.02*** 0.00*** 0.19*** 0.02*** 0.02*** 0.02*** 0.02* 0.04*** −0.01 (0.01) (0.01) (0.01) (0.01) (0.01) (0.00) (0.00) (0.01) (0.01) (0.01) (0.01) (0.01) (0.01) (0.01) From Formal WE tod Formal SE 0.00 0.01 0.00 0.01* 0.02*** −0.00*** 0.00*** −0.00 0.00 −0.00 −0.01* −0.01 −0.00 −0.01 (0.00) (0.01) (0.00) (0.00) (0.01) (0.00) (0.00) (0.00) (0.00) (0.00) (0.00) (0.01) (0.01) (0.00) Upper informal SE
0.01 0.02 0.02* 0.01 0.01 −0.01*** 0.00*** −0.02*** 0.01 −0.00 −0.01* 0.00 −0.00 −0.02*
(0.01) (0.01) (0.01) (0.01) (0.01) (0.00) (0.00) (0.00) (0.00) (0.01) (0.01) (0.01) (0.01) (0.01) Lower informal SE
−0.03 −0.02 −0.03* −0.03 −0.06*** −0.03*** 0.00*** −0.01 −0.05*** 0.00 −0.05*** −0.02 −0.06*** −0.01
(0.02) (0.03) (0.02) (0.02) (0.02) (0.00) (0.00) (0.01) (0.01) (0.01) (0.01) (0.02) (0.01) (0.01) Upper informal WE
−0.06** −0.10*** −0.14*** −0.17*** −0.19*** −0.01* 0.00 −0.04*** 0.03*** 0.02 −0.03** −0.05*** 0.01 0.01
(0.03) (0.03) (0.02) (0.03) (0.02) (0.00) (0.00) (0.01) (0.01) (0.01) (0.01) (0.02) (0.02) (0.01) Lower informal WE
−0.07*** −0.06** −0.15*** −0.17*** −0.18*** −0.01*** 0.00*** −0.03*** −0.05*** 0.03*** 0.02*** 0.02* −0.03*** −0.01
(0.02) (0.03) (0.02) (0.02) (0.02) (0.00) (0.00) (0.01) (0.01) (0.01) (0.01) (0.01) (0.01) (0.01) Unemployment 0.02 −0.01 0.03** 0.03* 0.03* −0.02*** 0.00*** 0.14*** 0.03*** −0.00 0.00 0.02 0.04 −0.02 (0.02) (0.02) (0.02) (0.02) (0.02) (0.00) (0.00) (0.02) (0.01) (0.01) (0.01) (0.02) (0.03) (0.02) From upper informal WE toe Formal SE 0.00 0.00 0.01*** 0.03*** 0.06*** −0.00 0.00 −0.00 0.00 −0.01*** −0.01** −0.00 0.00 0.00
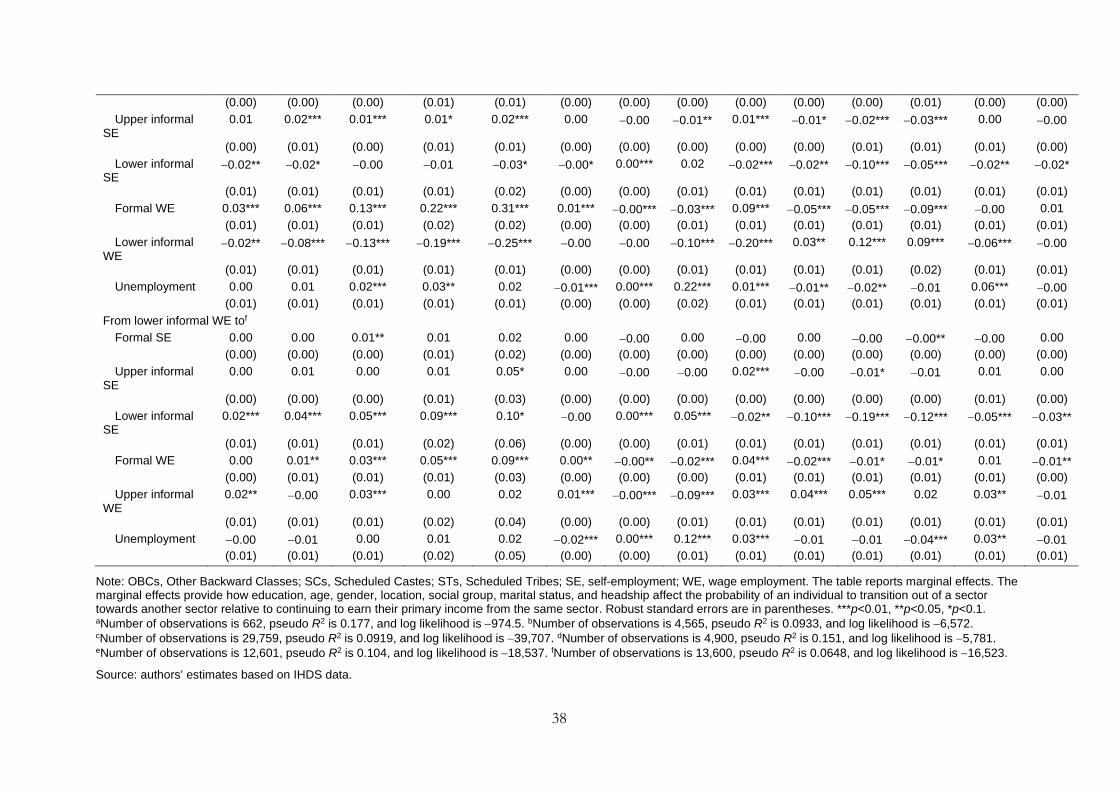
38
(0.00) (0.00) (0.00) (0.01) (0.01) (0.00) (0.00) (0.00) (0.00) (0.00) (0.00) (0.01) (0.00) (0.00) Upper informal SE
0.01 0.02*** 0.01*** 0.01* 0.02*** 0.00 −0.00 −0.01** 0.01*** −0.01* −0.02*** −0.03*** 0.00 −0.00
(0.00) (0.01) (0.00) (0.01) (0.01) (0.00) (0.00) (0.00) (0.00) (0.00) (0.01) (0.01) (0.01) (0.00) Lower informal SE
−0.02** −0.02* −0.00 −0.01 −0.03* −0.00* 0.00*** 0.02 −0.02*** −0.02** −0.10*** −0.05*** −0.02** −0.02*
(0.01) (0.01) (0.01) (0.01) (0.02) (0.00) (0.00) (0.01) (0.01) (0.01) (0.01) (0.01) (0.01) (0.01) Formal WE 0.03*** 0.06*** 0.13*** 0.22*** 0.31*** 0.01*** −0.00*** −0.03*** 0.09*** −0.05*** −0.05*** −0.09*** −0.00 0.01 (0.01) (0.01) (0.01) (0.02) (0.02) (0.00) (0.00) (0.01) (0.01) (0.01) (0.01) (0.01) (0.01) (0.01) Lower informal WE
−0.02** −0.08*** −0.13*** −0.19*** −0.25*** −0.00 −0.00 −0.10*** −0.20*** 0.03** 0.12*** 0.09*** −0.06*** −0.00
(0.01) (0.01) (0.01) (0.01) (0.01) (0.00) (0.00) (0.01) (0.01) (0.01) (0.01) (0.02) (0.01) (0.01) Unemployment 0.00 0.01 0.02*** 0.03** 0.02 −0.01*** 0.00*** 0.22*** 0.01*** −0.01** −0.02** −0.01 0.06*** −0.00 (0.01) (0.01) (0.01) (0.01) (0.01) (0.00) (0.00) (0.02) (0.01) (0.01) (0.01) (0.01) (0.01) (0.01) From lower informal WE tof Formal SE 0.00 0.00 0.01** 0.01 0.02 0.00 −0.00 0.00 −0.00 0.00 −0.00 −0.00** −0.00 0.00 (0.00) (0.00) (0.00) (0.01) (0.02) (0.00) (0.00) (0.00) (0.00) (0.00) (0.00) (0.00) (0.00) (0.00) Upper informal SE
0.00 0.01 0.00 0.01 0.05* 0.00 −0.00 −0.00 0.02*** −0.00 −0.01* −0.01 0.01 0.00
(0.00) (0.00) (0.00) (0.01) (0.03) (0.00) (0.00) (0.00) (0.00) (0.00) (0.00) (0.00) (0.01) (0.00) Lower informal SE
0.02*** 0.04*** 0.05*** 0.09*** 0.10* −0.00 0.00*** 0.05*** −0.02** −0.10*** −0.19*** −0.12*** −0.05*** −0.03**
(0.01) (0.01) (0.01) (0.02) (0.06) (0.00) (0.00) (0.01) (0.01) (0.01) (0.01) (0.01) (0.01) (0.01) Formal WE 0.00 0.01** 0.03*** 0.05*** 0.09*** 0.00** −0.00** −0.02*** 0.04*** −0.02*** −0.01* −0.01* 0.01 −0.01** (0.00) (0.01) (0.01) (0.01) (0.03) (0.00) (0.00) (0.00) (0.01) (0.01) (0.01) (0.01) (0.01) (0.00) Upper informal WE
0.02** −0.00 0.03*** 0.00 0.02 0.01*** −0.00*** −0.09*** 0.03*** 0.04*** 0.05*** 0.02 0.03** −0.01
(0.01) (0.01) (0.01) (0.02) (0.04) (0.00) (0.00) (0.01) (0.01) (0.01) (0.01) (0.01) (0.01) (0.01) Unemployment −0.00 −0.01 0.00 0.01 0.02 −0.02*** 0.00*** 0.12*** 0.03*** −0.01 −0.01 −0.04*** 0.03** −0.01 (0.01) (0.01) (0.01) (0.02) (0.05) (0.00) (0.00) (0.01) (0.01) (0.01) (0.01) (0.01) (0.01) (0.01)
Note: OBCs, Other Backward Classes; SCs, Scheduled Castes; STs, Scheduled Tribes; SE, self-employment; WE, wage employment. The table reports marginal effects. The marginal effects provide how education, age, gender, location, social group, marital status, and headship affect the probability of an individual to transition out of a sector towards another sector relative to continuing to earn their primary income from the same sector. Robust standard errors are in parentheses. ***p<0.01, **p<0.05, *p<0.1. aNumber of observations is 662, pseudo R2 is 0.177, and log likelihood is −974.5. bNumber of observations is 4,565, pseudo R2 is 0.0933, and log likelihood is −6,572. cNumber of observations is 29,759, pseudo R2 is 0.0919, and log likelihood is −39,707. dNumber of observations is 4,900, pseudo R2 is 0.151, and log likelihood is −5,781. eNumber of observations is 12,601, pseudo R2 is 0.104, and log likelihood is −18,537. fNumber of observations is 13,600, pseudo R2 is 0.0648, and log likelihood is −16,523.
Source: authors’ estimates based on IHDS data.

39
Table A5: Correlates of employment transitions, using ordered logistic regression: average marginal effects
(1) (2) (3) (4) (5) (6) Formality status in 2005
Lower informal
Lower informal
Upper informal
Upper informal
Formal Formal
Formality status in 2012
Formal Upper informal
Formal Lower informal
Upper informal
Lower informal
Level of education (base: no schooling) Lower primary 0.010*** 0.030*** 0.014*** −0.033*** −0.021*** −0.130***
(0.002) (0.007) (0.005) (0.012) (0.006) (0.028) Primary 0.012*** 0.036*** 0.047*** −0.100*** −0.020** −0.128***
(0.003) (0.009) (0.007) (0.014) (0.008) (0.032) Secondary 0.029*** 0.078*** 0.082*** −0.157*** −0.090*** −0.247***
(0.003) (0.007) (0.006) (0.011) (0.006) (0.024) Higher secondary 0.049*** 0.119*** 0.123*** −0.210*** −0.120*** −0.277***
(0.006) (0.011) (0.011) (0.015) (0.010) (0.024) Graduation 0.080*** 0.166*** 0.194*** −0.280*** −0.144*** −0.298***
(0.011) (0.014) (0.015) (0.015) (0.009) (0.024) Age 0.002*** 0.006*** 0.008*** −0.013*** −0.025*** −0.035***
(0.001) (0.002) (0.002) (0.003) (0.002) (0.003) Age2 −0.000*** −0.000*** −0.000*** 0.000*** 0.000*** 0.000***
(0.000) (0.000) (0.000) (0.000) (0.000) (0.000) Female −0.026*** −0.068*** −0.041*** 0.072*** −0.025*** −0.033***
(0.003) (0.007) (0.006) (0.012) (0.009) (0.012) Urban 0.032*** 0.074*** 0.079*** −0.131*** −0.022*** −0.032***
(0.003) (0.006) (0.005) (0.008) (0.005) (0.008) Social group (base: general) OBCs −0.007** −0.016** −0.023*** 0.036*** 0.025*** 0.038*** (0.003) (0.007) (0.007) (0.010) (0.006) (0.009) SCs −0.005 −0.011 −0.028*** 0.046*** −0.015* −0.020* (0.003) (0.008) (0.008) (0.013) (0.008) (0.011) STs −0.020*** −0.050*** −0.040*** 0.067*** −0.019 −0.023* (0.004) (0.010) (0.010) (0.018) (0.012) (0.014) Unmarried 0.020*** 0.046*** 0.033*** −0.052*** −0.041*** −0.053*** (0.004) (0.009) (0.009) (0.013) (0.011) (0.013) Head −0.009*** −0.023*** 0.000 −0.000 −0.018** −0.026** (0.003) (0.007) (0.007) (0.011) (0.008) (0.012) Number of observations
18,122 13,260 4,276
Log likelihood −13,031 −12,971 −3,323 Pseudo R2 0.0468 0.0501 0.0937
Note: OBCs, Other Backward Classes; SCs, Scheduled Castes; STs, Scheduled Tribes. Standard errors are in parentheses. ***p<0.01, **p<0.05, *p<0.1
Source: authors’ estimates.