Wider 2005-annual-lecture-slides
54
1 2005 WIDER Annual Lecture Why Inequality Matters in a Globalizing World Helsinki, October 26 Nancy Birdsall President Center for Global Development Washington, D.C.
-
Upload
united-nations-university-world-institute-for-development-economics-research -
Category
Economy & Finance
-
view
118 -
download
0
Transcript of Wider 2005-annual-lecture-slides
1
2005 WIDER Annual LectureWhy Inequality Matters in a Globalizing WorldHelsinki, October 26
Nancy BirdsallPresidentCenter for Global DevelopmentWashington, D.C.
2
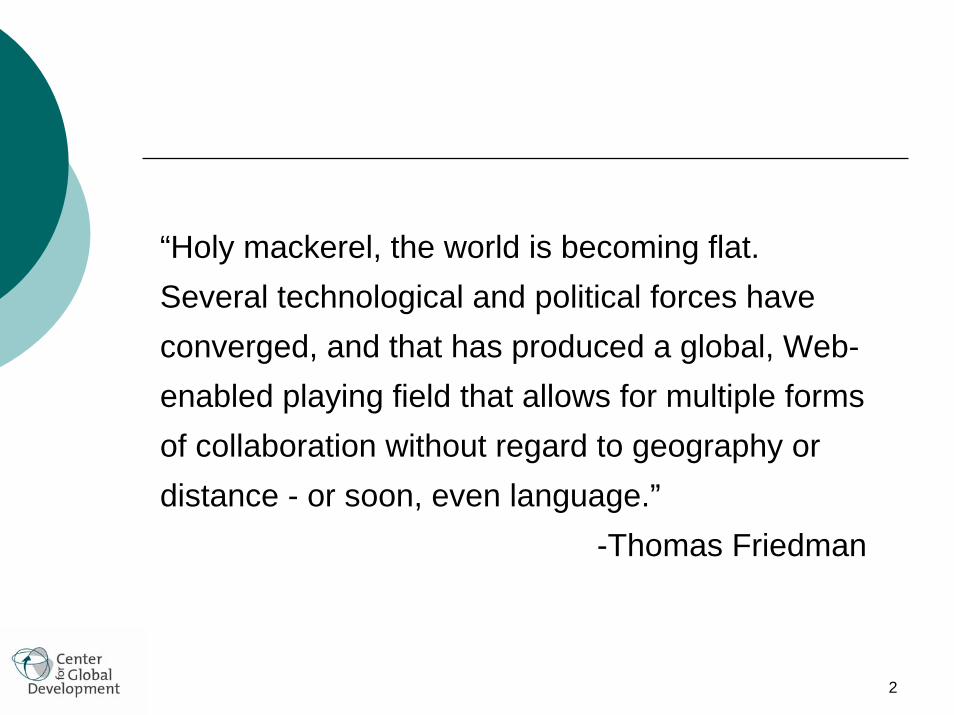
“Holy mackerel, the world is becoming flat. Several technological and political forces have converged, and that has produced a global, Web-enabled playing field that allows for multiple forms of collaboration without regard to geography or distance - or soon, even language.”
-Thomas Friedman
3
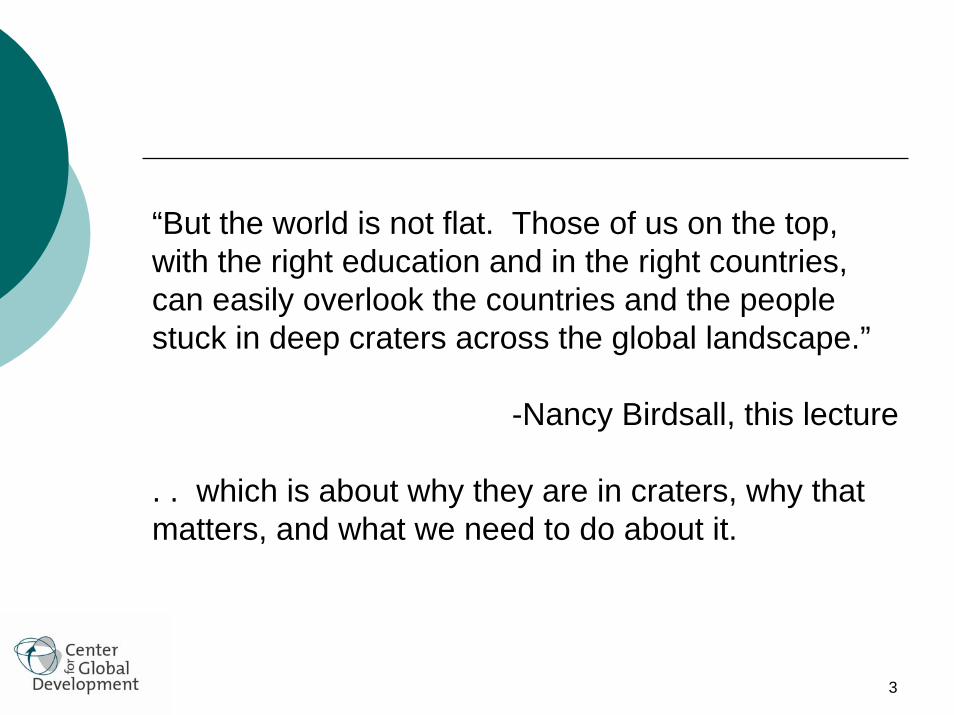
“But the world is not flat. Those of us on the top, with the right education and in the right countries, can easily overlook the countries and the people stuck in deep craters across the global landscape.”
-Nancy Birdsall, this lecture
. . which is about why they are in craters, why that matters, and what we need to do about it.

4
The message
Inequality matters to people. It is often a sign of injustice.
Global markets by their nature generate inequality.
We need to manage the downside of globalization if we are to sustain its upside. We need a global polity to complement our global economy.
Constructing that global polity is a key challenge of this 21st century.
5
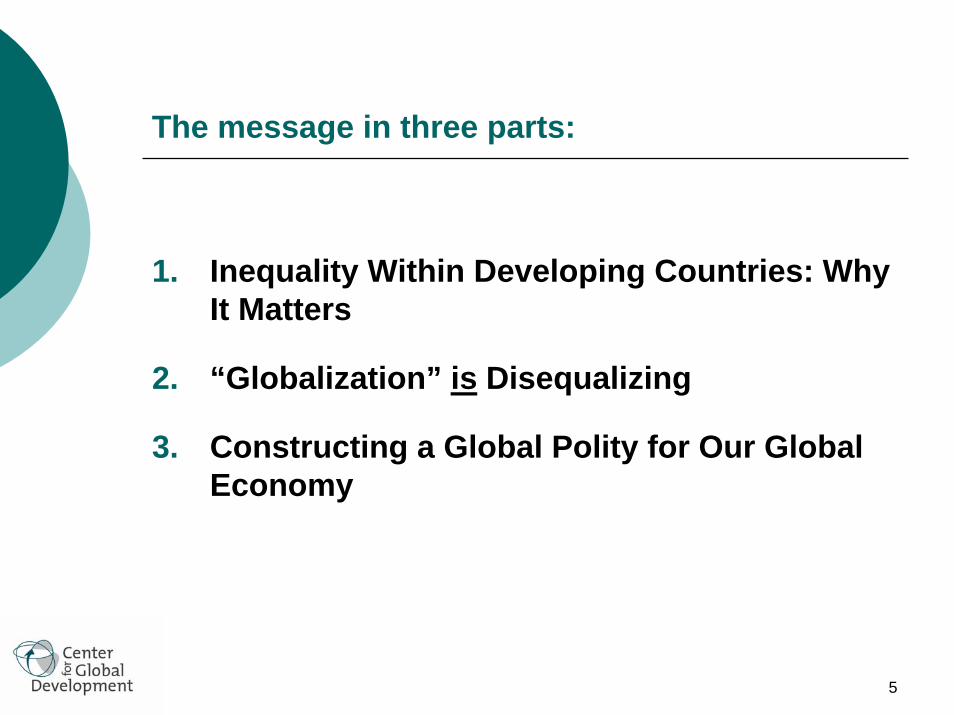
The message in three parts:
1. Inequality Within Developing Countries: Why It Matters
2. “Globalization” is Disequalizing
3. Constructing a Global Polity for Our Global Economy

6
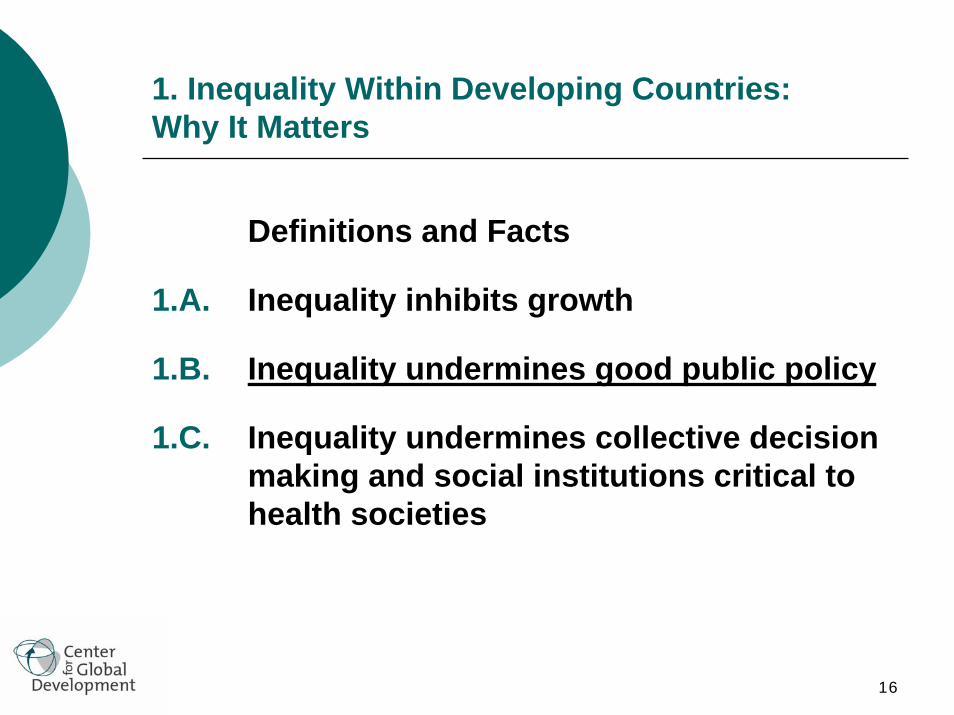
1. Inequality Within Developing Countries: Why It Matters
Definitions and facts
1.A. Inequality inhibits growth
1.B. Inequality undermines good public policy
1.C. Inequality undermines collective decision making and social institutions critical to health societies
7
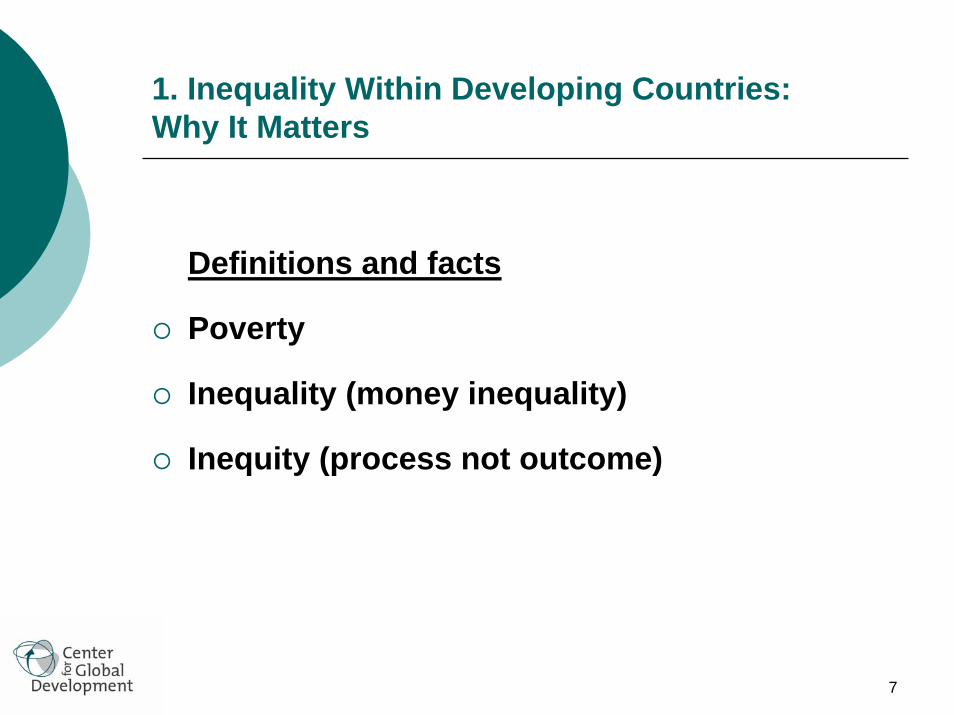
1. Inequality Within Developing Countries:Why It Matters
Definitions and facts
Poverty
Inequality (money inequality)
Inequity (process not outcome)
8
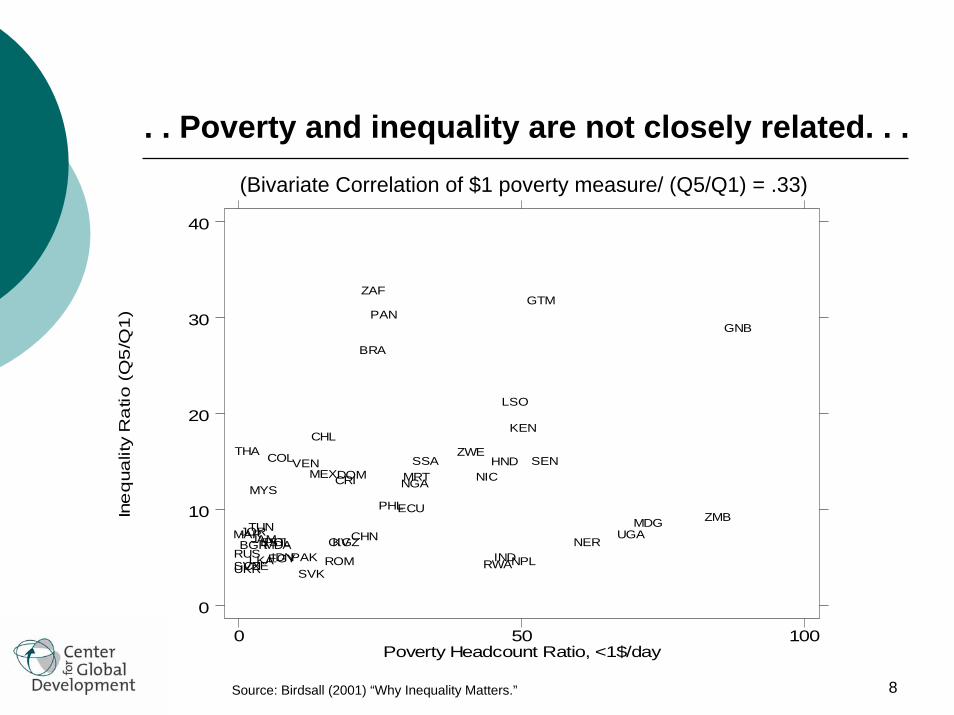
. . Poverty and inequality are not closely related. . .In
eq
ualit
y R
atio
(Q
5/Q
1)
Poverty Headcount Ratio, <1$/day0 50 100
0
10
20
30
40
SSA
BRA
BGR
CHL
CHN
COL
CRI
CIV
CZE
DOM
ECU
EGYEST
GTM
GNB
HND
INDIDNJAMJOR
KEN
KGZ
LSO
MDG
MYSMRTMEX
MDAMAR
NPL
NIC
NER
NGA
PAK
PAN
PHL
POL
ROMRUSRWA
SEN
SVKSVN
ZAF
LKA
THA
TUN UGA
UKR
VEN
ZMB
ZWE
(Bivariate Correlation of $1 poverty measure/ (Q5/Q1) = .33)
Source: Birdsall (2001) “Why Inequality Matters.”
9
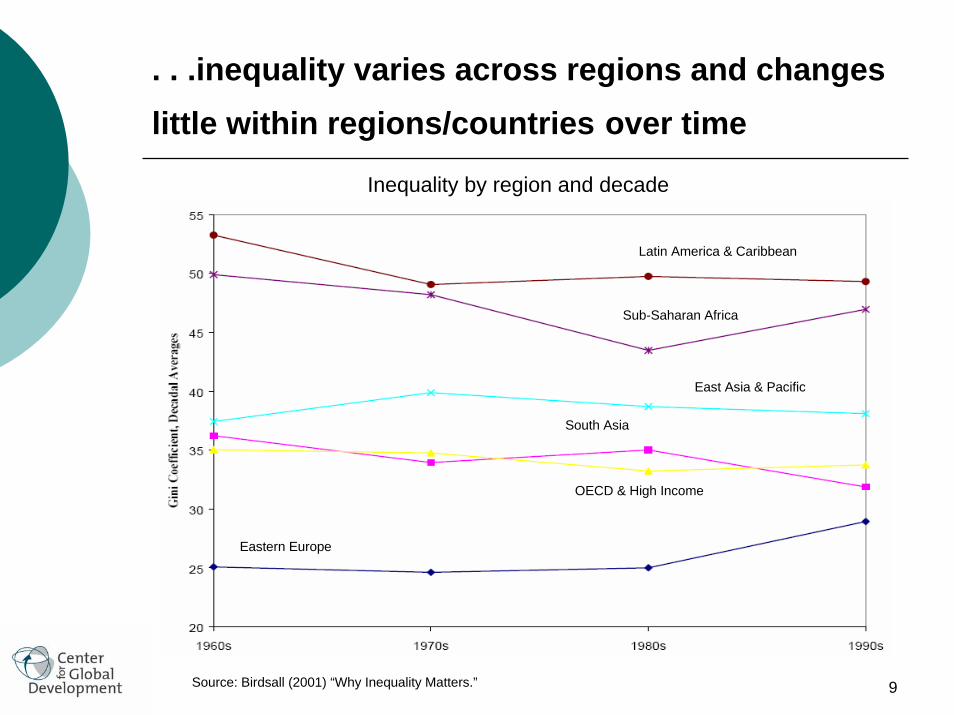
. . .inequality varies across regions and changes little within regions/countries over time
Inequality by region and decade
Eastern Europe
Latin America & Caribbean
Sub-Saharan Africa
East Asia & Pacific
South Asia
OECD & High Income
Source: Birdsall (2001) “Why Inequality Matters.”
10
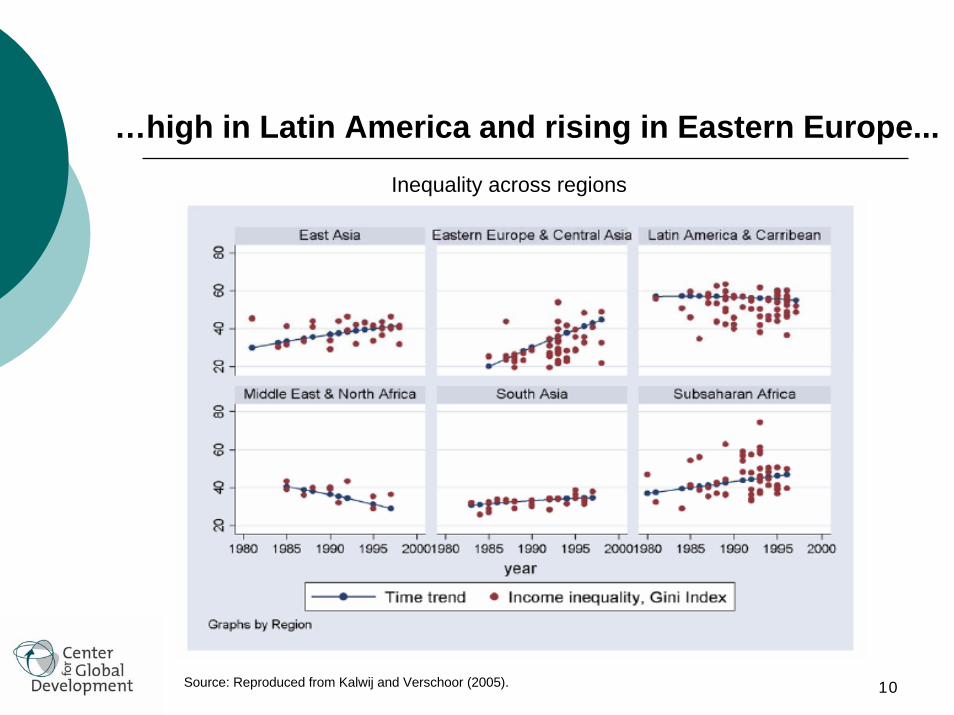
…high in Latin America and rising in Eastern Europe...Inequality across regions
Source: Reproduced from Kalwij and Verschoor (2005).

11
1. Inequality Within Developing Countries: Why It Matters
Definitions and Facts
1.A. Inequality inhibits growth
1.B. Inequality undermines good public policy
1.C. Inequality undermines collective decision making and social institutions critical to health societies
12
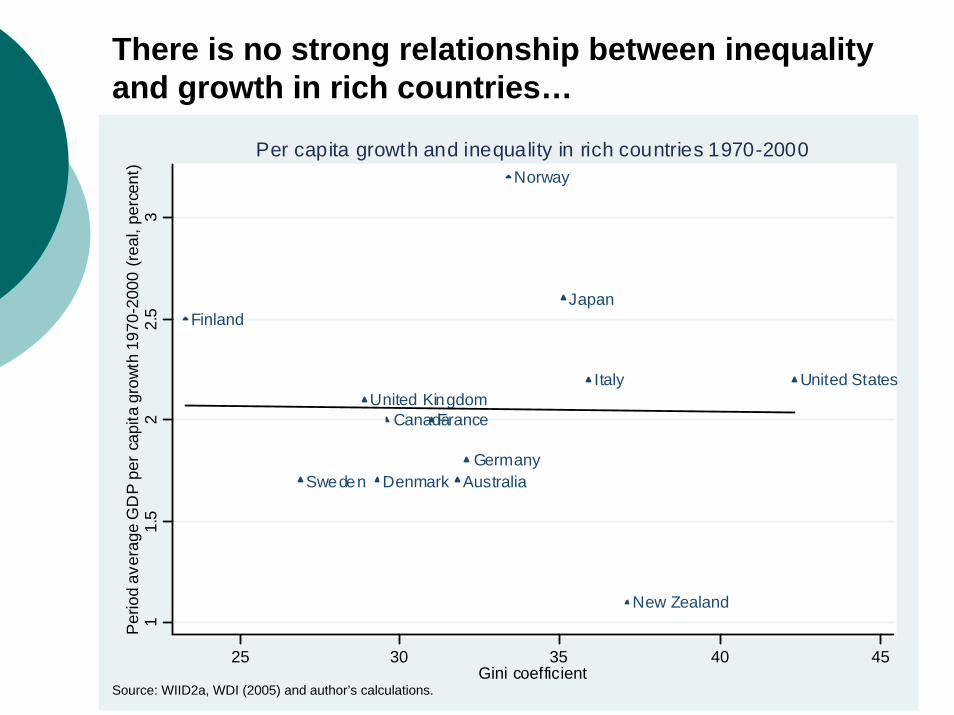
There is no strong relationship between inequality and growth in rich countries…
Australia
Canada
Denmark
Finland
France
Germany
Italy
Japan
New Zealand
Norway
Sweden
United KingdomUnited States
11.
52
2.5
3P
erio
d av
erag
e G
DP
per
cap
ita g
row
th 1
970-
2000
(rea
l, pe
rcen
t)
25 30 35 40 45Gini coefficient
Per capita growth and inequality in rich countries 1970-2000
Source: WIID2a, WDI (2005) and author’s calculations.
13
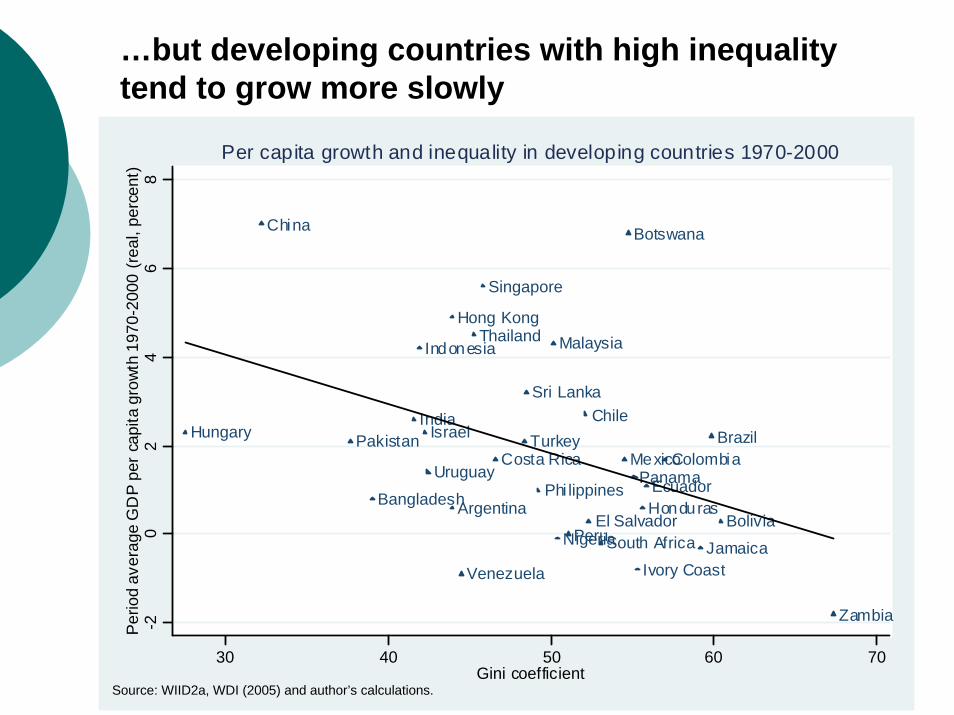
…but developing countries with high inequality tend to grow more slowly
ArgentinaBangladeshBolivia
Botswana
BrazilChile
China
ColombiaCosta Rica
Ivory Coast
Ecuador
El SalvadorHonduras
Hong Kong
HungaryIndia
Indonesia
Israel
Jamaica
Malaysia
Mexico
Nigeria
Pakistan
Panama
Peru
Phi lippines
Singapore
South Africa
Sri Lanka
Thailand
Turkey
Uruguay
Venezuela
Zambia-20
24
68
Per
iod
aver
age
GD
P p
er c
apita
gro
wth
197
0-20
00 (
real
, per
cent
)
30 40 50 60 70Gini coefficient
Per capita growth and inequality in developing countries 1970-2000
Source: WIID2a, WDI (2005) and author’s calculations.
14
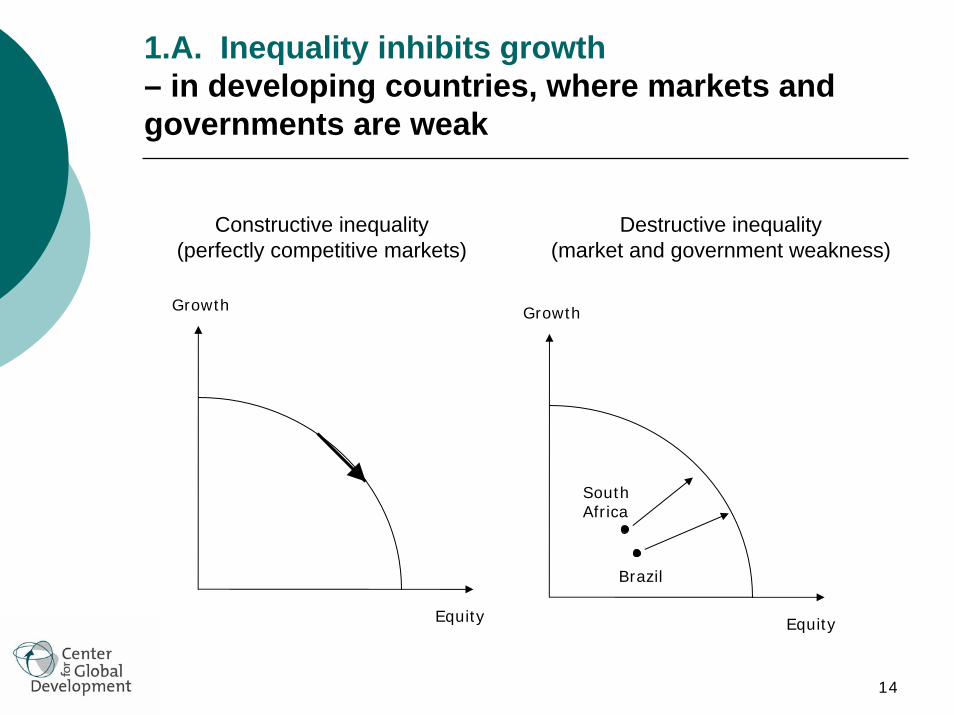
1.A. Inequality inhibits growth – in developing countries, where markets and governments are weak
Growth
Equity
Growth
Equity
Brazil
South Africa
Constructive inequality (perfectly competitive markets)
Destructive inequality (market and government weakness)
15
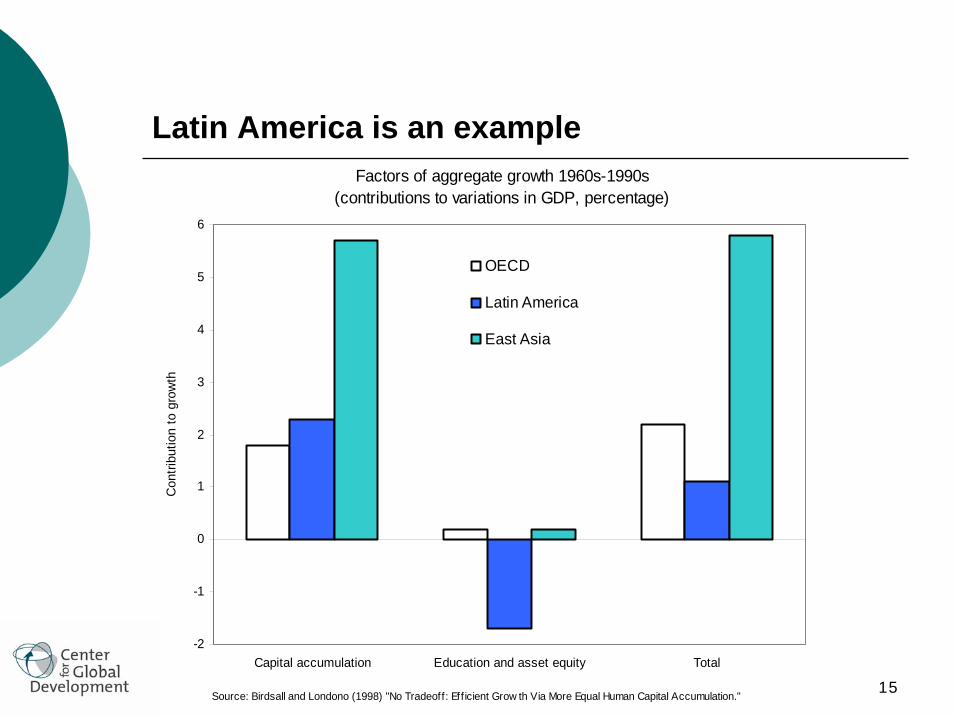
Latin America is an exampleFactors of aggregate growth 1960s-1990s
(contributions to variations in GDP, percentage)
-2
-1
0
1
2
3
4
5
6
Capital accumulation Education and asset equity Total
Con
tribu
tion
to g
row
th
OECD
Latin America
East Asia
Source: Birdsall and Londono (1998) "No Tradeoff: Eff icient Grow th Via More Equal Human Capital Accumulation."
16
1. Inequality Within Developing Countries: Why It Matters
Definitions and Facts
1.A. Inequality inhibits growth
1.B. Inequality undermines good public policy
1.C. Inequality undermines collective decision making and social institutions critical to health societies

17
1.B. Inequality undermines good public policy – for example educational opportunities are probably not equal in many developing countries
poorest 20% of households richest 20% of householdsColombia 2.4 9.8
Guatemala 2.0 8.9
Peru 5.0 9.8
Cambodia 2.4 7.4
Philippines 6.2 10.2
Vietnam 5.2 10.3
Ethiopia 0.9 5.2
Kenya 4.9 9.0
Nigeria 3.5 9.9Notes:
Source: World Bank EdStats (2005).
1. Average years of schooling are the years of formal schooling received on average, by adults aged 15-24.
2. Data is for the latest year available during the period 2000-2003, except for Colombia (1995), Guatemala (1995), Peru (1996) and the Philippines (1998).
Average years of schooling (15-24), 2000-20031,2
18
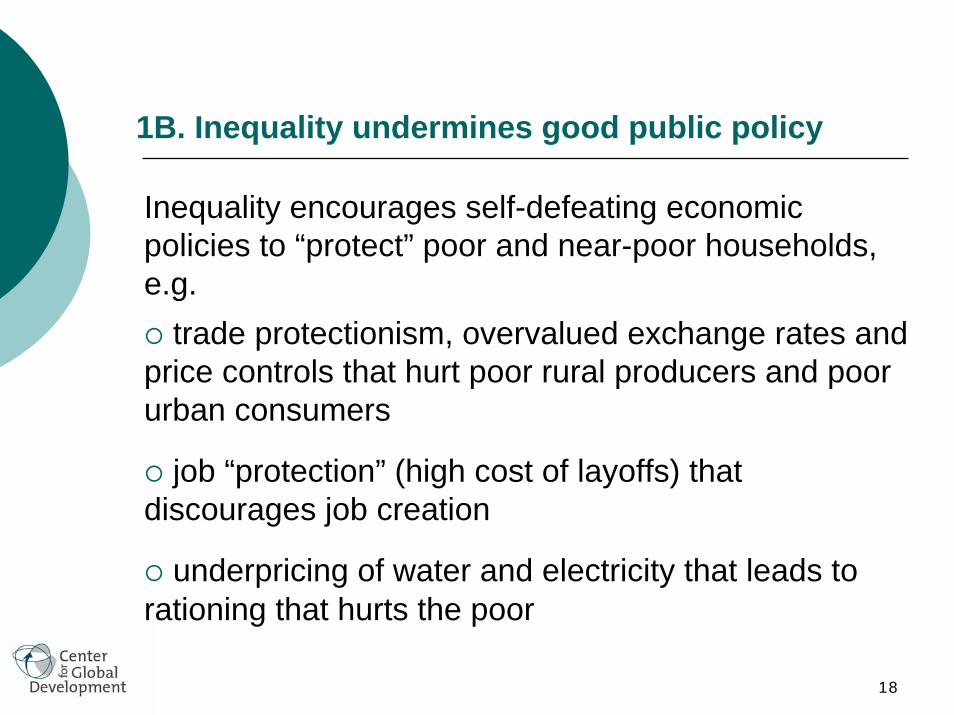
1B. Inequality undermines good public policy
Inequality encourages self-defeating economic policies to “protect” poor and near-poor households, e.g.
trade protectionism, overvalued exchange rates and price controls that hurt poor rural producers and poor urban consumers
job “protection” (high cost of layoffs) that discourages job creation
underpricing of water and electricity that leads to rationing that hurts the poor
19
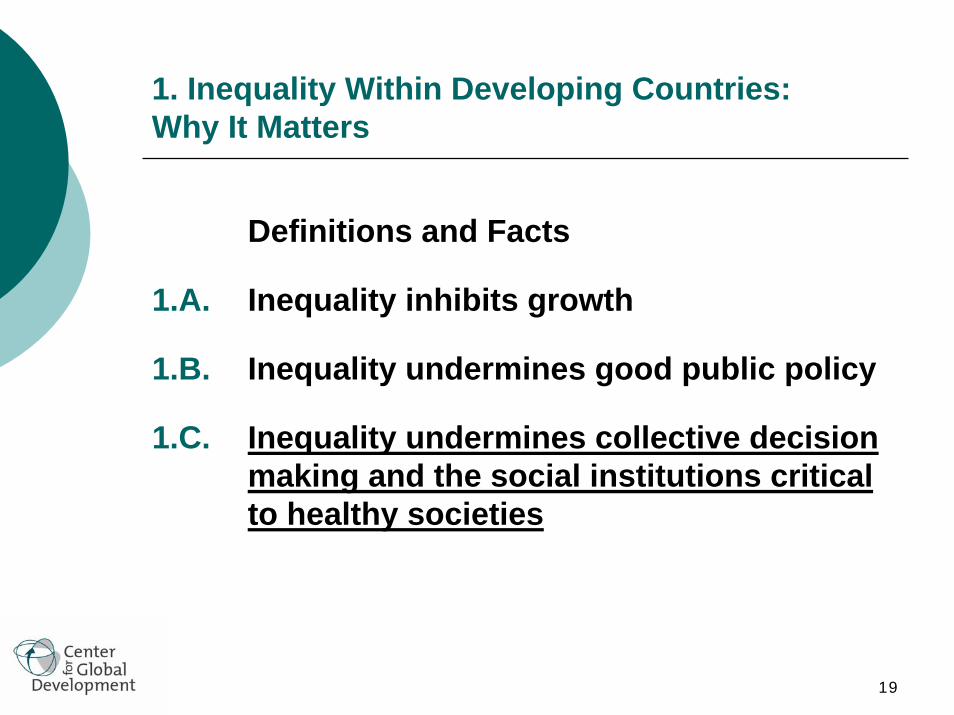
1. Inequality Within Developing Countries: Why It Matters
Definitions and Facts
1.A. Inequality inhibits growth
1.B. Inequality undermines good public policy
1.C. Inequality undermines collective decisionmaking and the social institutions criticalto healthy societies
20
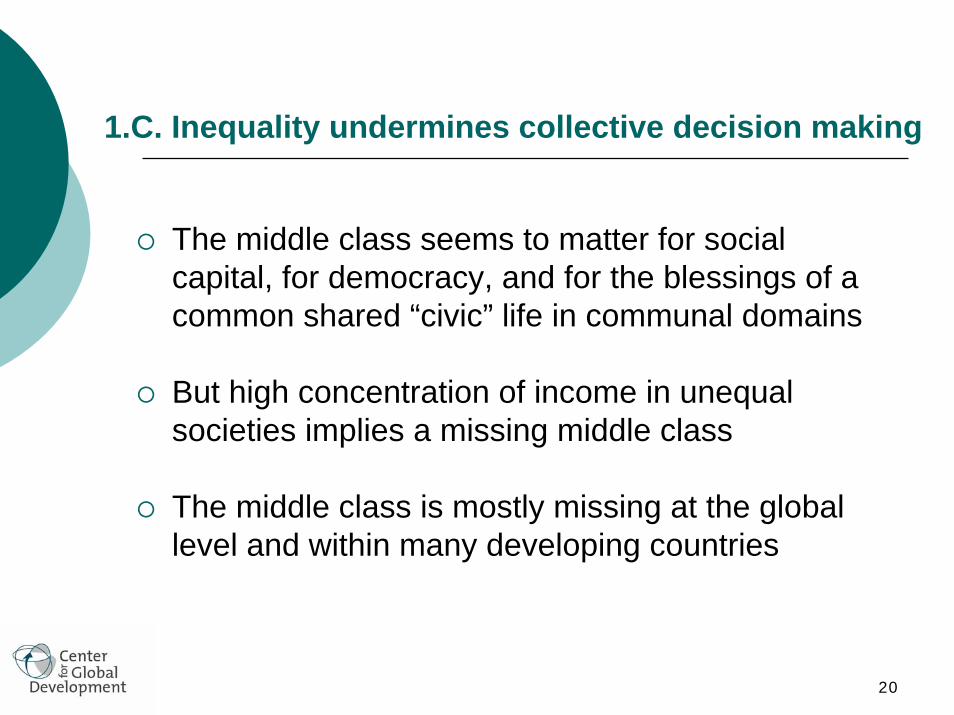
1.C. Inequality undermines collective decision making
The middle class seems to matter for social capital, for democracy, and for the blessings of a common shared “civic” life in communal domains
But high concentration of income in unequal societies implies a missing middle class
The middle class is mostly missing at the global level and within many developing countries

21
The well-off middle class
Joachim Beuckelaer, The Four Elements: Earth, National Gallery London
22
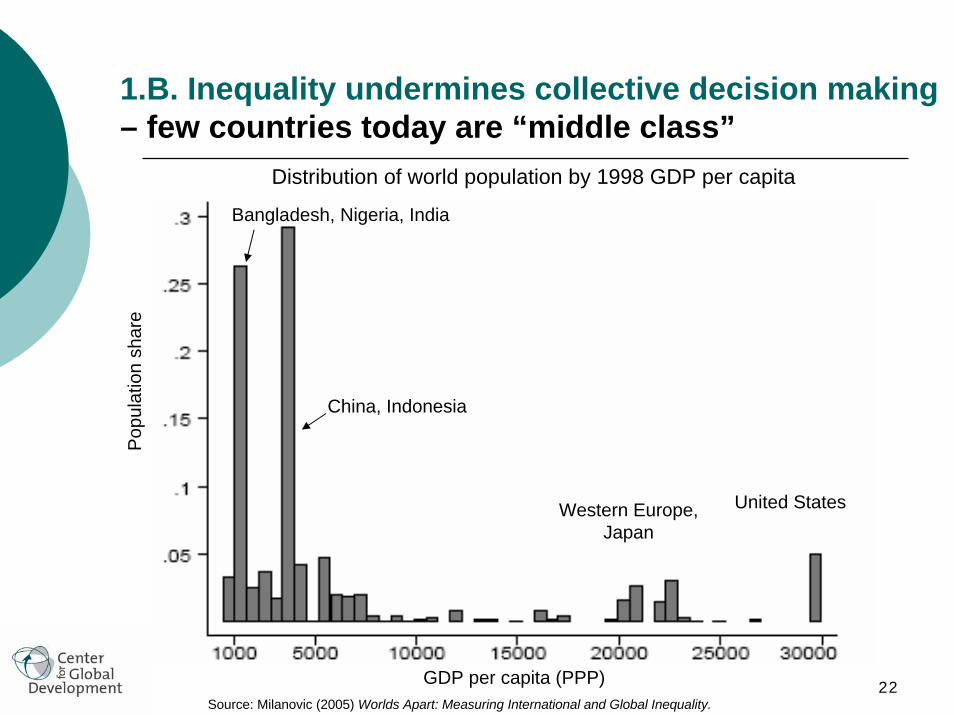
1.B. Inequality undermines collective decision making– few countries today are “middle class”
Distribution of world population by 1998 GDP per capita
Pop
ulat
ion
shar
e
GDP per capita (PPP)
Bangladesh, Nigeria, India
China, Indonesia
United StatesWestern Europe,Japan
Source: Milanovic (2005) Worlds Apart: Measuring International and Global Inequality.
23
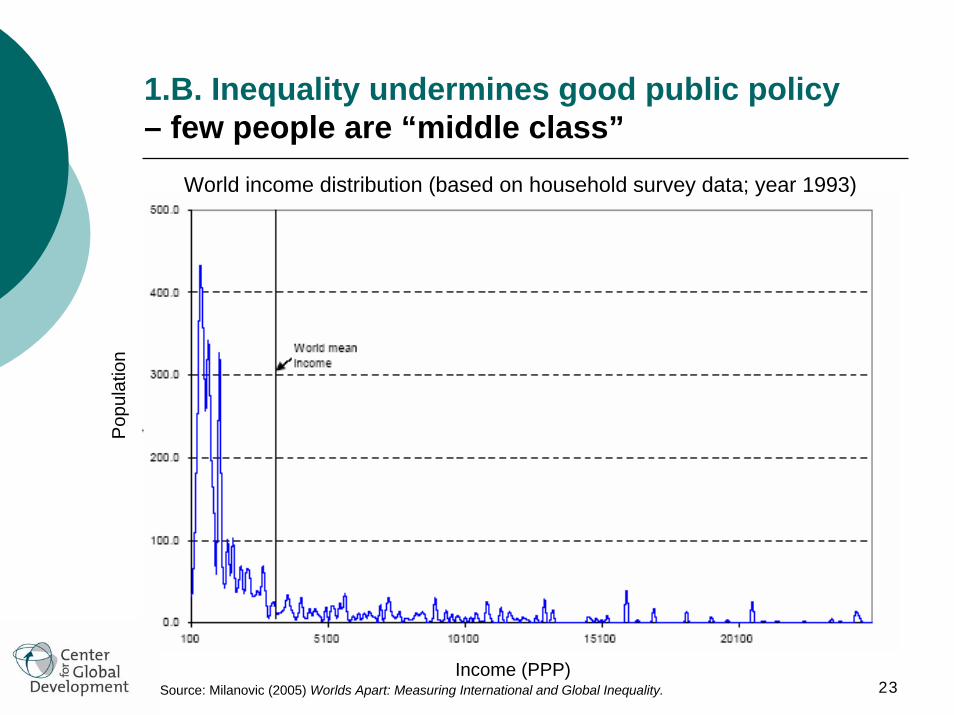
1.B. Inequality undermines good public policy– few people are “middle class”
World income distribution (based on household survey data; year 1993)
Pop
ulat
ion
Source: Milanovic (2005) Worlds Apart: Measuring International and Global Inequality. Income (PPP)
24
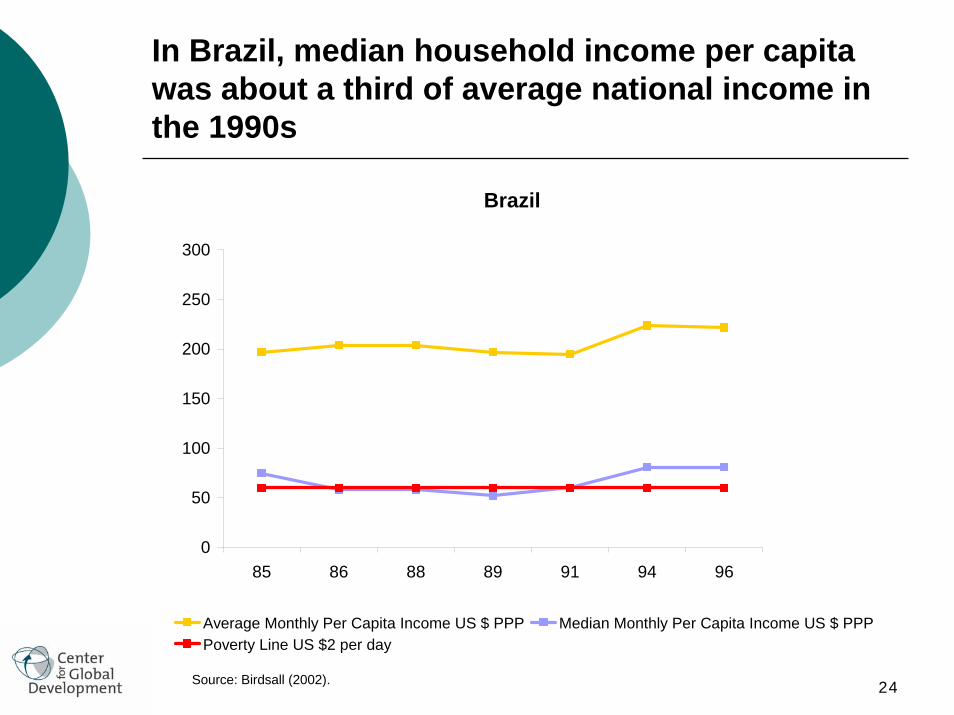
In Brazil, median household income per capita was about a third of average national income in the 1990s
Brazil
0
50
100
150
200
250
300
85 86 88 89 91 94 96
Average Monthly Per Capita Income US $ PPP Median Monthly Per Capita Income US $ PPPPoverty Line US $2 per day
Source: Birdsall (2002).
25
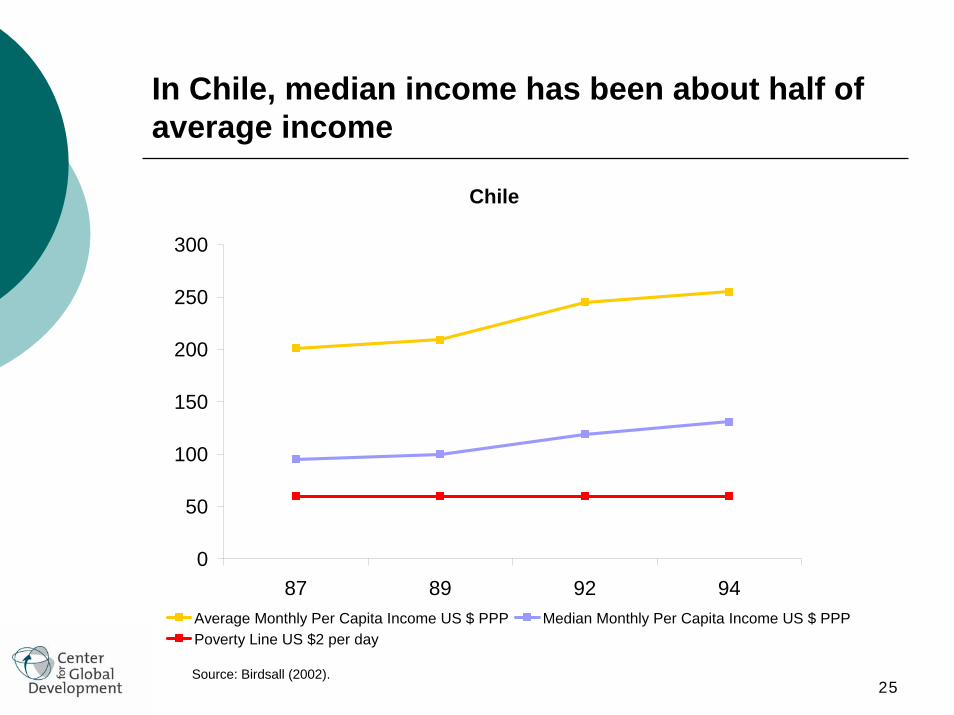
In Chile, median income has been about half of average income
Source: Birdsall (2002).
Chile
0
50
100
150
200
250
300
87 89 92 94Average Monthly Per Capita Income US $ PPP Median Monthly Per Capita Income US $ PPPPoverty Line US $2 per day
26
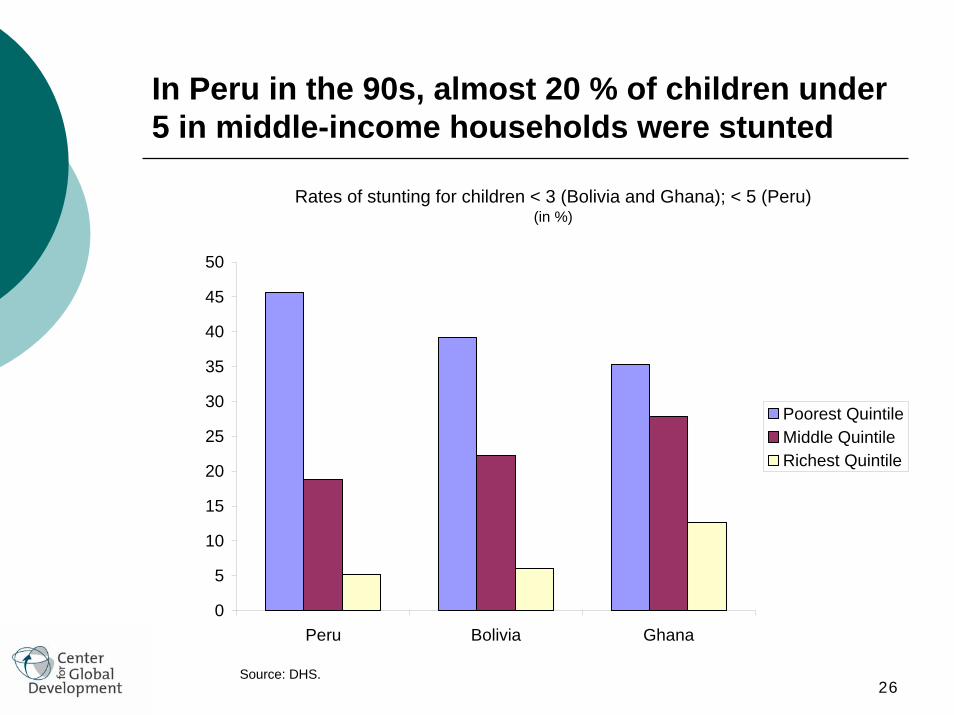
In Peru in the 90s, almost 20 % of children under 5 in middle-income households were stunted
Rates of stunting for children < 3 (Bolivia and Ghana); < 5 (Peru)(in %)
0
5
10
15
20
25
30
35
40
45
50
Peru Bolivia Ghana
Poorest QuintileMiddle QuintileRichest Quintile
Source: DHS.

27
1. Inequality Within Developing Countries: Why It Matters
Definitions and Facts
1.A. Inequality inhibits growth
1.B. Inequality undermines good public policy
1.C. Inequality undermines collective decision making and social institutions critical to health societies
28
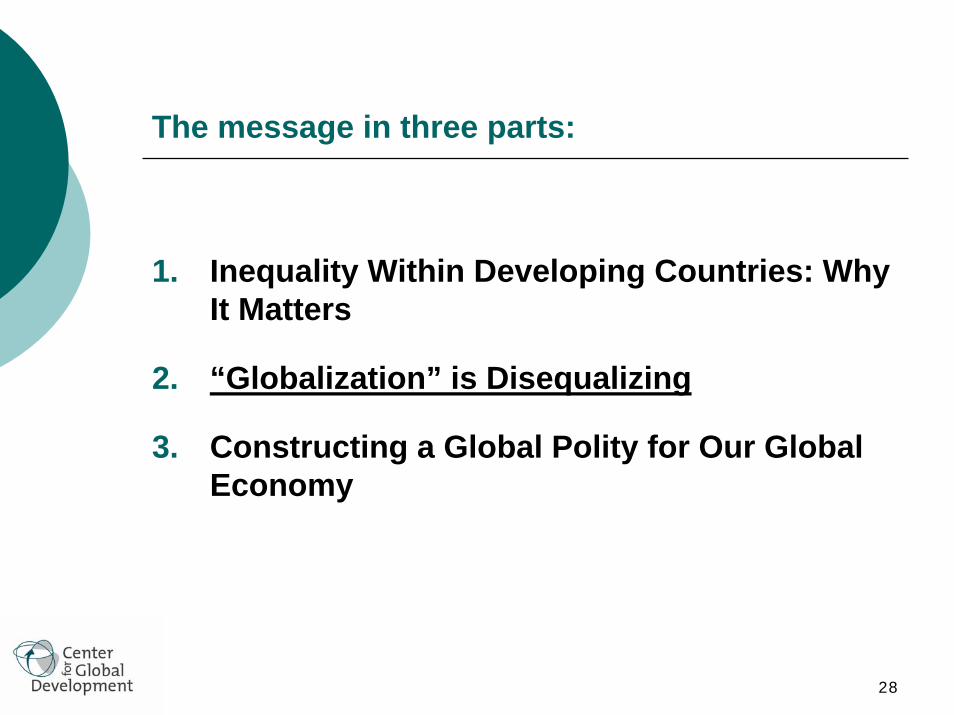
The message in three parts:
1. Inequality Within Developing Countries: Why It Matters
2. “Globalization” is Disequalizing
3. Constructing a Global Polity for Our Global Economy

29
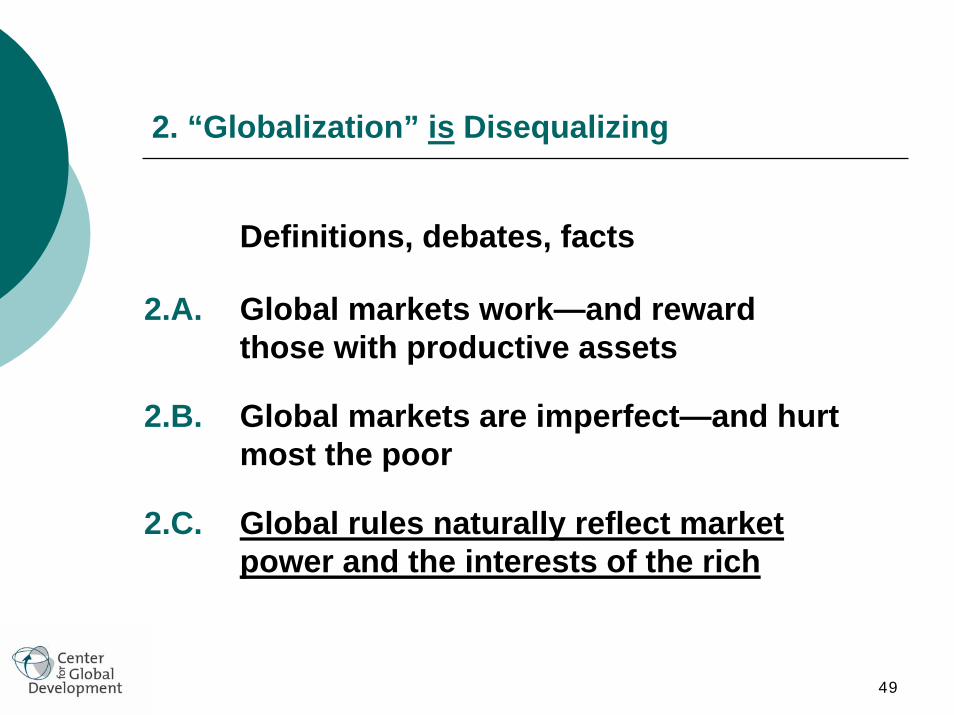
2. “Globalization” is Disequalizing
Definitions, debates, facts
2.A. Global markets work—and reward those with productive assets
2.B. Global markets are imperfect—and hurt most the poor
2.C. Global rules naturally reflect market power and interests of the rich
30
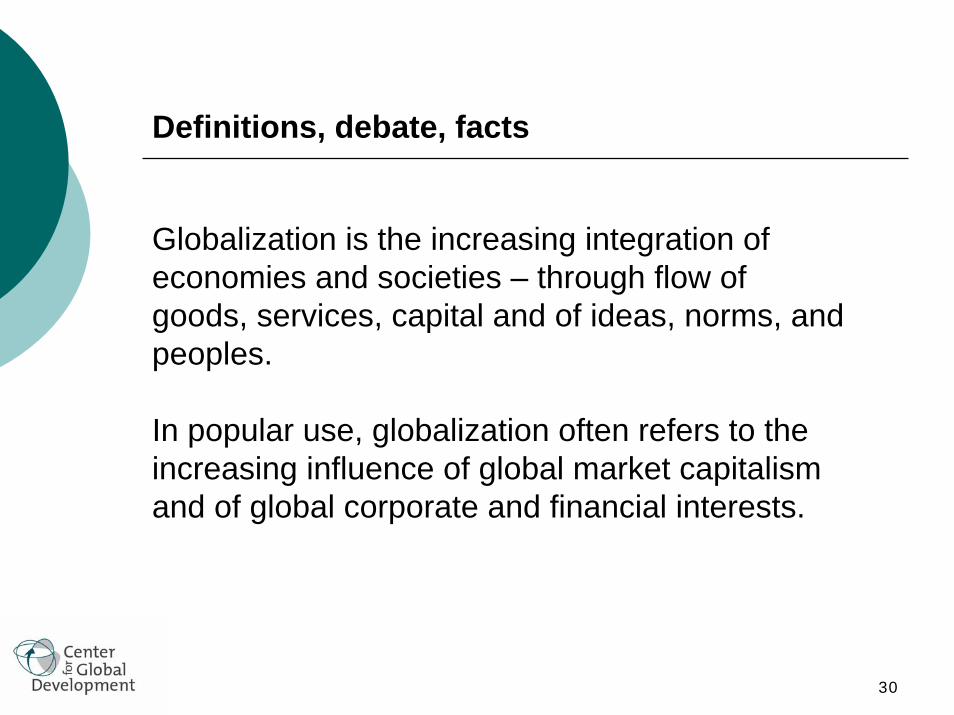
Definitions, debate, facts
Globalization is the increasing integration of economies and societies – through flow of goods, services, capital and of ideas, norms, and peoples.
In popular use, globalization often refers to the increasing influence of global market capitalism and of global corporate and financial interests.
31
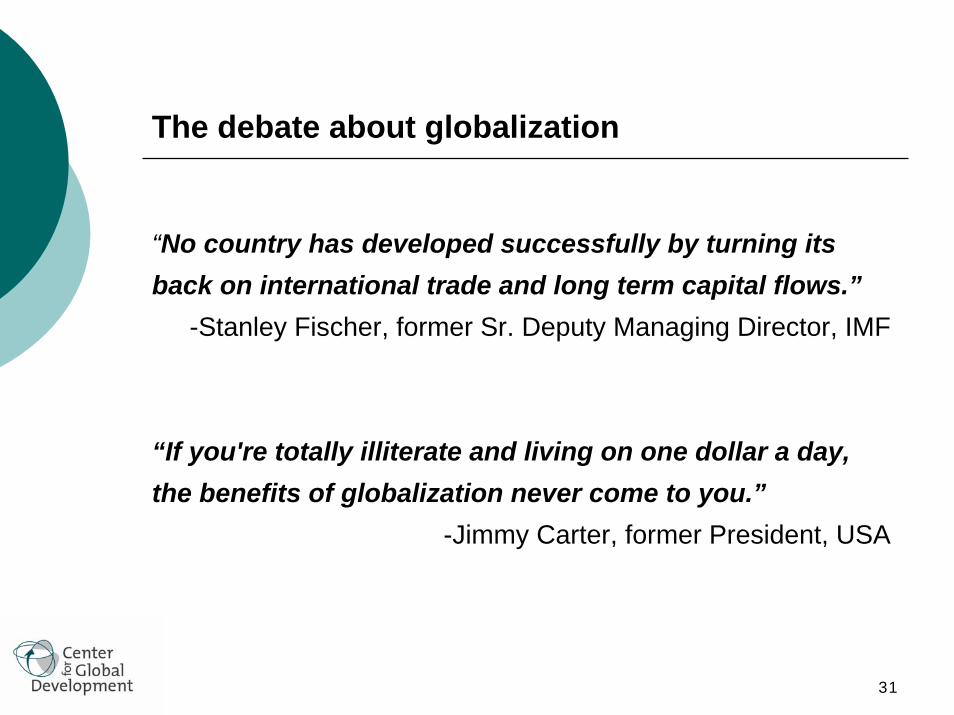
The debate about globalization
“No country has developed successfully by turning its back on international trade and long term capital flows.”
-Stanley Fischer, former Sr. Deputy Managing Director, IMF
“If you're totally illiterate and living on one dollar a day, the benefits of globalization never come to you.”
-Jimmy Carter, former President, USA
32
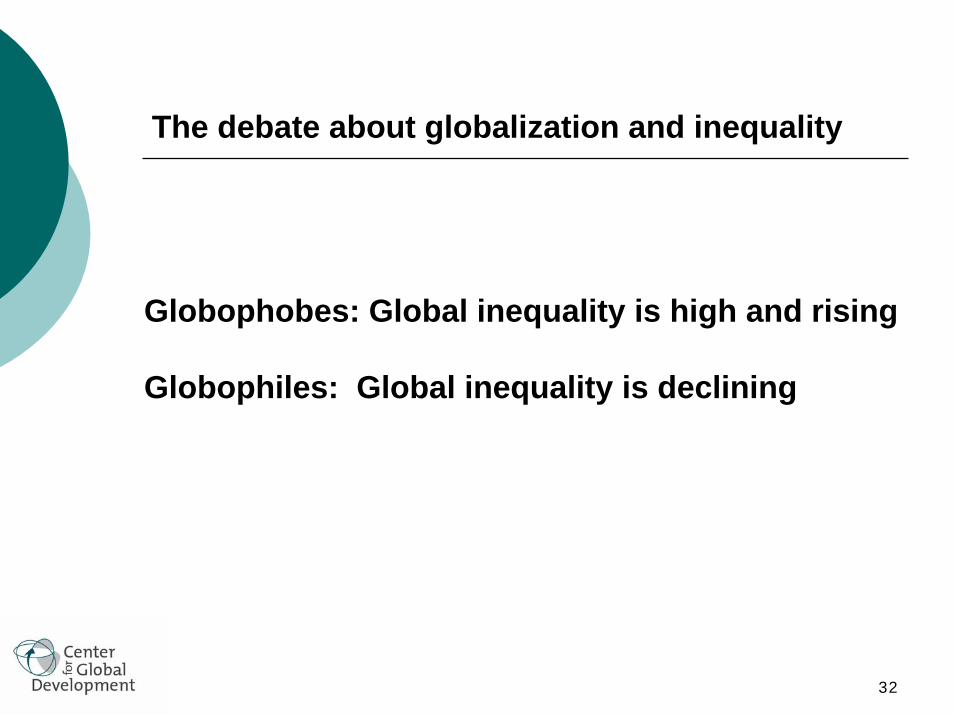
The debate about globalization and inequality
Globophobes: Global inequality is high and rising
Globophiles: Global inequality is declining
33
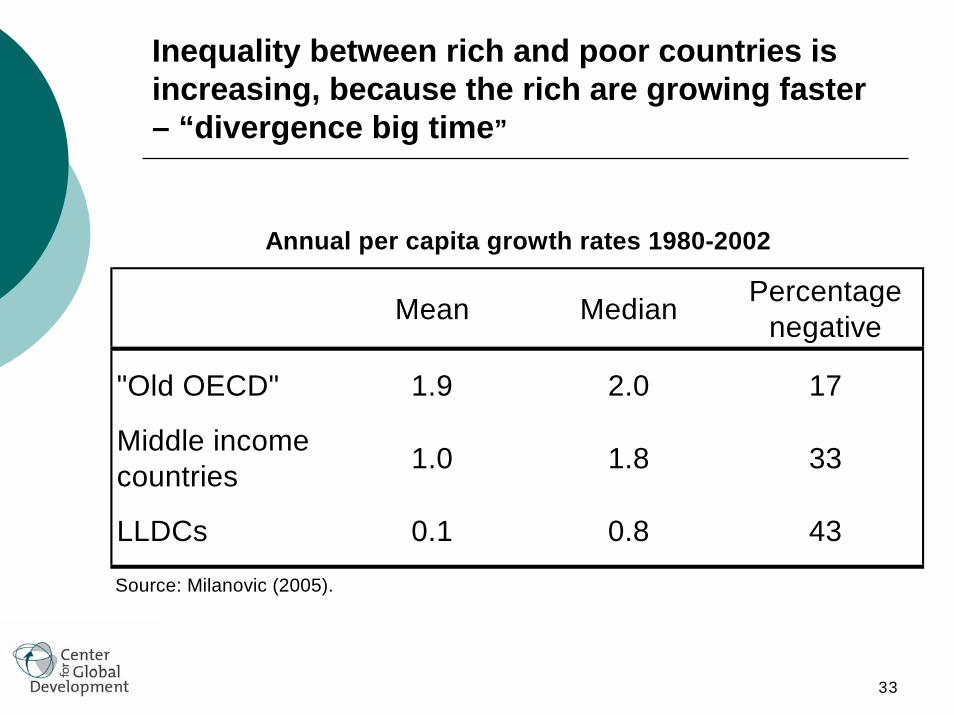
Inequality between rich and poor countries is increasing, because the rich are growing faster – “divergence big time”
Mean Median Percentage negative
"Old OECD" 1.9 2.0 17
Middle income countries 1.0 1.8 33
LLDCs 0.1 0.8 43
Source: Milanovic (2005).
Annual per capita growth rates 1980-2002
34
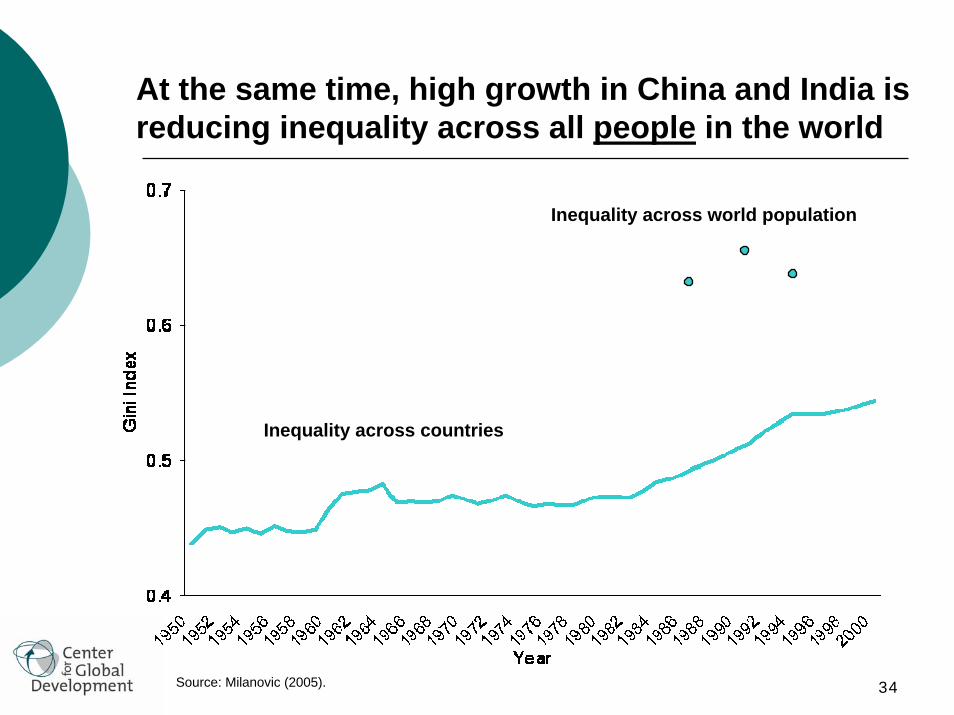
At the same time, high growth in China and India is reducing inequality across all people in the world
Inequality across world population
Inequality across countries
Source: Milanovic (2005).

35
Globophobes and globaphiles are both right
Inequality between the richest and poorest countries is high and continues to grow.
But thanks to rapid growth in China and India, global poverty is declining and so is global inequality across all people.
(Globalization is not the cause of deep poverty and destructive inequality but neither is it the solution. Indeed, where globalization is reducing poverty, e.g. China, it is also associated with rising inequality – planting seeds of future problems.)

36
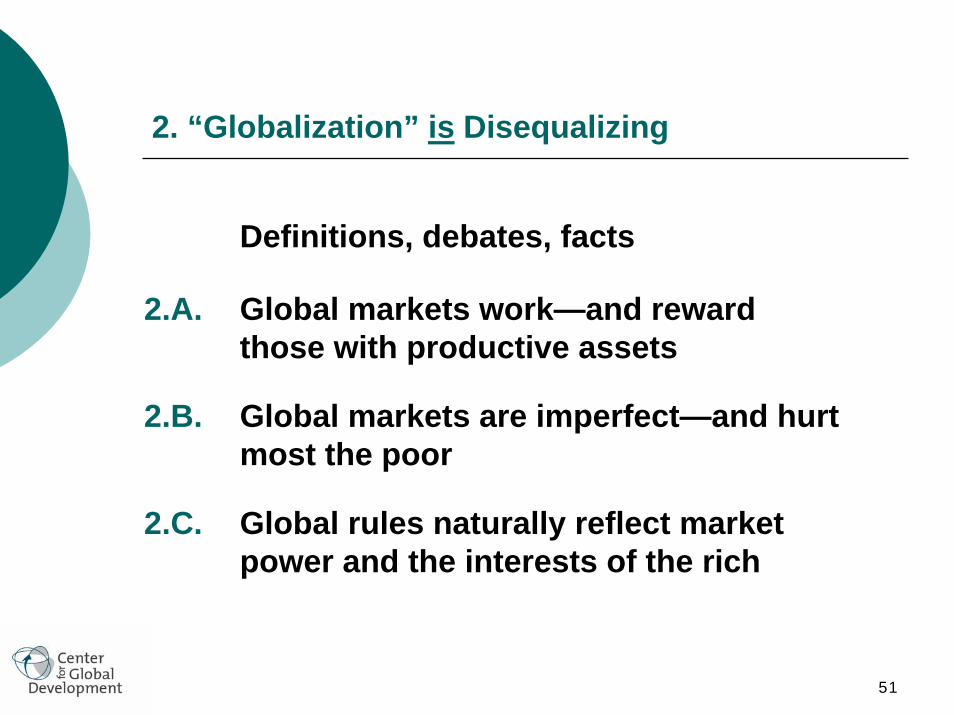
2. “Globalization” is Disequalizing
Definitions, debates, facts
2.A. Global markets work—and reward countries and people with productive assets
2.B. Global markets are imperfect—and hurt most the poor
2.C. Global rules naturally reflect market power and the interests of the rich
37
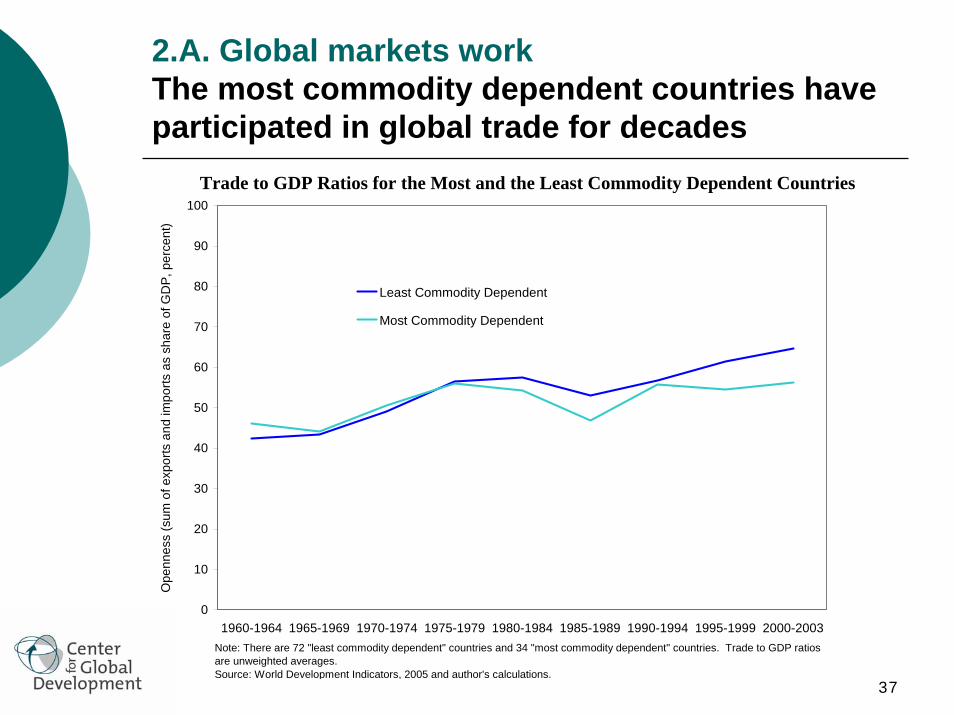
2.A. Global markets workThe most commodity dependent countries have participated in global trade for decades
Trade to GDP Ratios for the Most and the Least Commodity Dependent Countries
0
10
20
30
40
50
60
70
80
90
100
1960-1964 1965-1969 1970-1974 1975-1979 1980-1984 1985-1989 1990-1994 1995-1999 2000-2003
Ope
nnes
s (s
um o
f exp
orts
and
impo
rts a
s sh
are
of G
DP,
per
cent
)
Least Commodity Dependent
Most Commodity Dependent
Note: There are 72 "least commodity dependent" countries and 34 "most commodity dependent" countries. Trade to GDP ratios are unweighted averages. Source: World Development Indicators, 2005 and author's calculations.

38
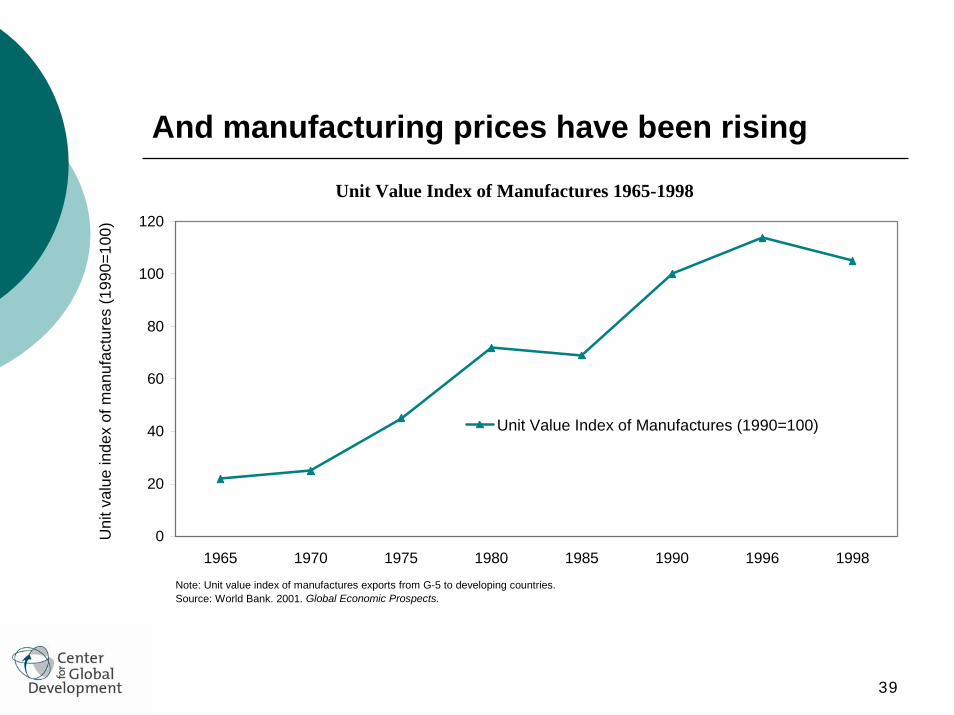
But commodity prices have been falling
Source: UNCTAD. 2005. Commodity Price Bulletin.
39
And manufacturing prices have been rising
Unit Value Index of Manufactures 1965-1998
0
20
40
60
80
100
120
1965 1970 1975 1980 1985 1990 1996 1998
Uni
t val
ue in
dex
of m
anuf
actu
res
(199
0=10
0)
Unit Value Index of Manufactures (1990=100)
Note: Unit value index of manufactures exports from G-5 to developing countries.Source: World Bank. 2001. Global Economic Prospects.
40
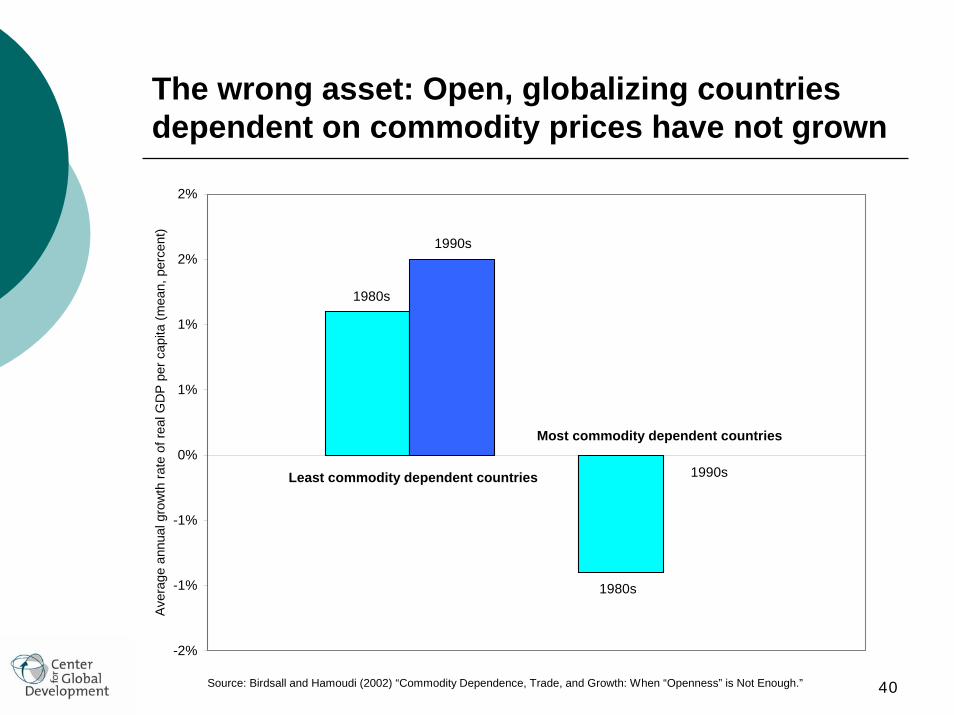
The wrong asset: Open, globalizing countries dependent on commodity prices have not grown
-2%
-1%
-1%
0%
1%
1%
2%
2%
Ave
rage
ann
ual g
row
th ra
te o
f rea
l GD
P p
er c
apita
(mea
n, p
erce
nt)
Least commodity dependent countries
Most commodity dependent countries
1980s
1980s
1990s
1990s
Source: Birdsall and Hamoudi (2002) “Commodity Dependence, Trade, and Growth: When “Openness” is Not Enough.”
41
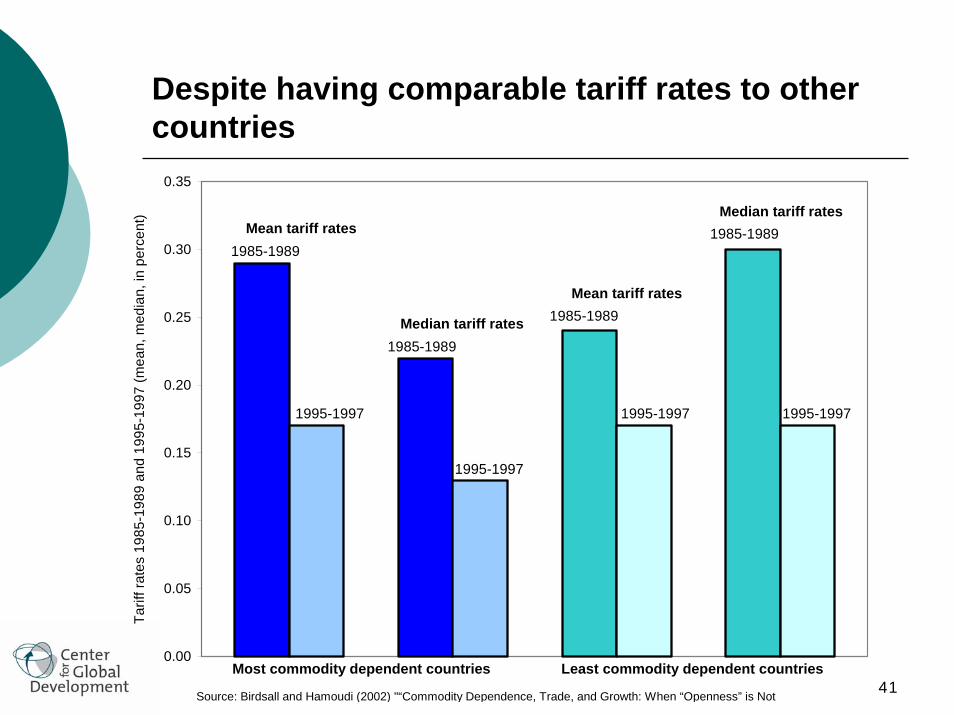
Despite having comparable tariff rates to other countries
0.00
0.05
0.10
0.15
0.20
0.25
0.30
0.35
Tarif
f rat
es 1
985-
1989
and
199
5-19
97 (m
ean,
med
ian,
in p
erce
nt)
Most commodity dependent countries Least commodity dependent countries
Mean tariff rates1985-1989
1985-1989
1985-1989
1985-1989
1995-1997
1995-1997
1995-1997 1995-1997
Mean tariff rates
Median tariff rates
Median tariff rates
Source: Birdsall and Hamoudi (2002) "“Commodity Dependence, Trade, and Growth: When “Openness” is Not
42
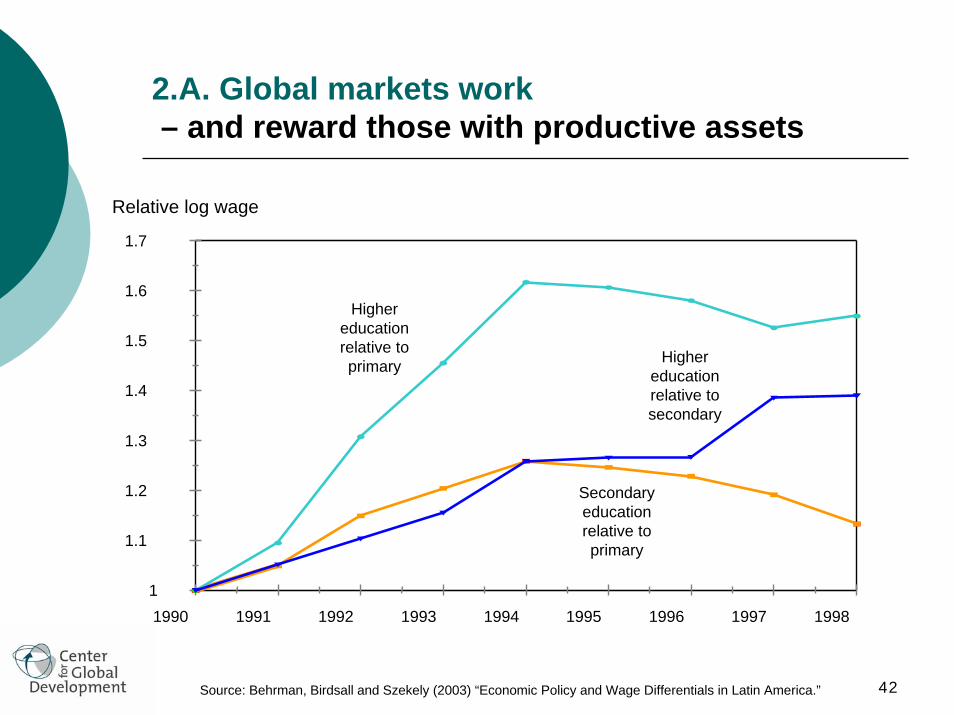
2.A. Global markets work – and reward those with productive assets
1
1.1
1.2
1.3
1.4
1.5
1.6
1.7
1990 1991 1992 1993 1994 1995 1996 1997 1998
Secondary education relative to primary
Relative log wage
Higher education relative to secondary
Higher education relative to primary
Source: Behrman, Birdsall and Szekely (2003) “Economic Policy and Wage Differentials in Latin America.”
43
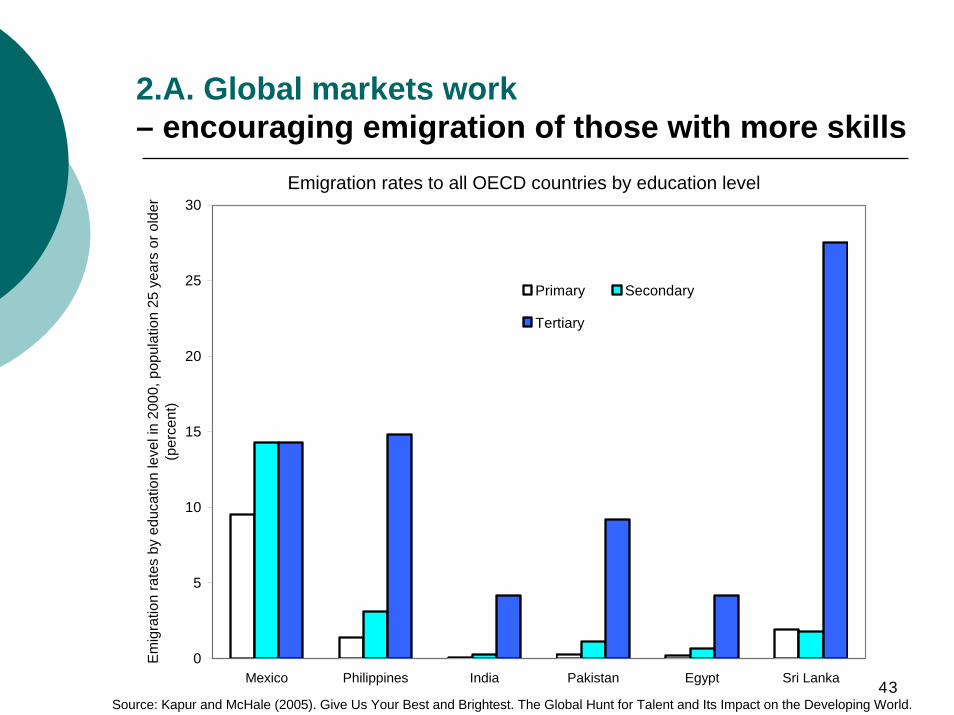
2.A. Global markets work– encouraging emigration of those with more skills
0
5
10
15
20
25
30
Mexico Philippines India Pakistan Egypt Sri Lanka
Em
igra
tion
rate
s by
edu
catio
n le
vel i
n 20
00, p
opul
atio
n 25
yea
rs o
r old
er(p
erce
nt)
Primary Secondary
Tertiary
Source: Kapur and McHale (2005). Give Us Your Best and Brightest. The Global Hunt for Talent and Its Impact on the Developing World.
Emigration rates to all OECD countries by education level

44
Nurse flows from Sub-Saharan Africa to the United Kingdom
0
1,000
2,000
3,000
4,000
5,000
6,000
7,000
8,000
9,000
1996/97 1997/98 1998/99 1999/00 2000/01
Sub
-Sah
aran
Afri
can
nurs
es re
gist
erin
g in
the
Uni
ted
Kin
gdom
ann
ually
Source: UK NMC (2005).
45
2. “Globalization” is Disequalizing
Definitions, debates, facts
2.A. Global markets work—and reward those with productive assets
2.B. Global markets are imperfect—and hurtmost the poor
2.C. Global markets naturally reflect market power and the interests of the rich
46
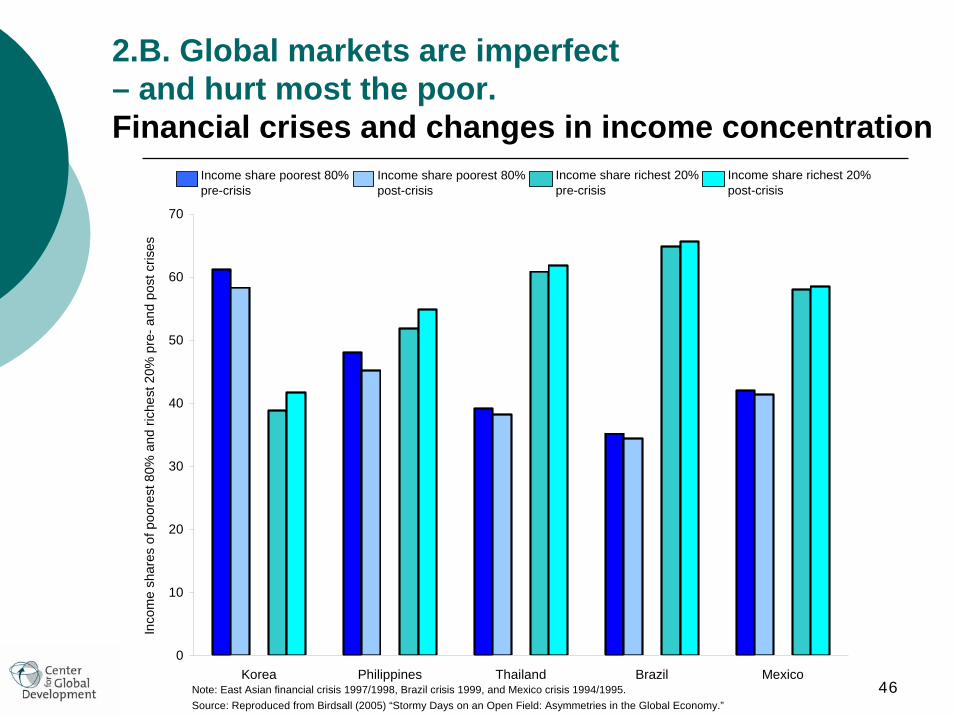
2.B. Global markets are imperfect – and hurt most the poor.Financial crises and changes in income concentration
Note: East Asian financial crisis 1997/1998, Brazil crisis 1999, and Mexico crisis 1994/1995.Source: Reproduced from Birdsall (2005) “Stormy Days on an Open Field: Asymmetries in the Global Economy.”
0
10
20
30
40
50
60
70
Korea Philippines Thailand Brazil Mexico
Inco
me
shar
es o
f poo
rest
80%
and
rich
est 2
0% p
re- a
nd p
ost c
rises
Income share poorest 80% pre-crisis
Income share richest 20%pre-crisis
Income share poorest 80% post-crisis
Income share richest 20%post-crisis
47
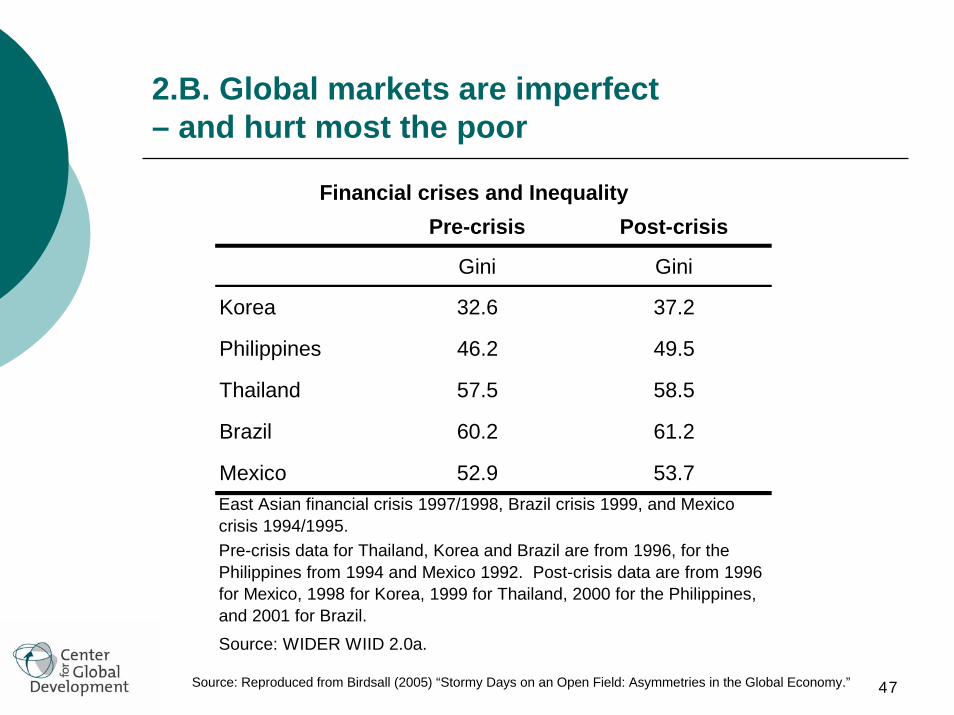
2.B. Global markets are imperfect – and hurt most the poor
Pre-crisis Post-crisis
Gini Gini
Korea 32.6 37.2
Philippines 46.2 49.5
Thailand 57.5 58.5
Brazil 60.2 61.2
Mexico 52.9 53.7
Source: WIDER WIID 2.0a.
East Asian financial crisis 1997/1998, Brazil crisis 1999, and Mexico crisis 1994/1995.Pre-crisis data for Thailand, Korea and Brazil are from 1996, for the Philippines from 1994 and Mexico 1992. Post-crisis data are from 1996 for Mexico, 1998 for Korea, 1999 for Thailand, 2000 for the Philippines, and 2001 for Brazil.
Financial crises and Inequality
Source: Reproduced from Birdsall (2005) “Stormy Days on an Open Field: Asymmetries in the Global Economy.”
48
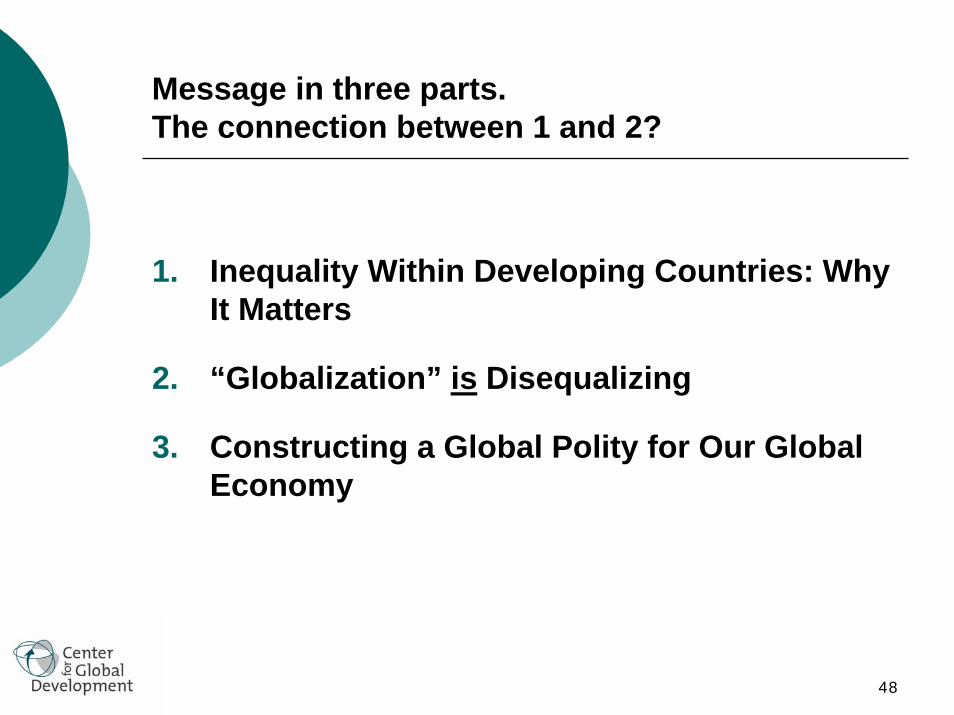
Message in three parts. The connection between 1 and 2?
1. Inequality Within Developing Countries: Why It Matters
2. “Globalization” is Disequalizing
3. Constructing a Global Polity for Our Global Economy
49
2. “Globalization” is Disequalizing
Definitions, debates, facts
2.A. Global markets work—and reward those with productive assets
2.B. Global markets are imperfect—and hurt most the poor
2.C. Global rules naturally reflect market power and the interests of the rich
50
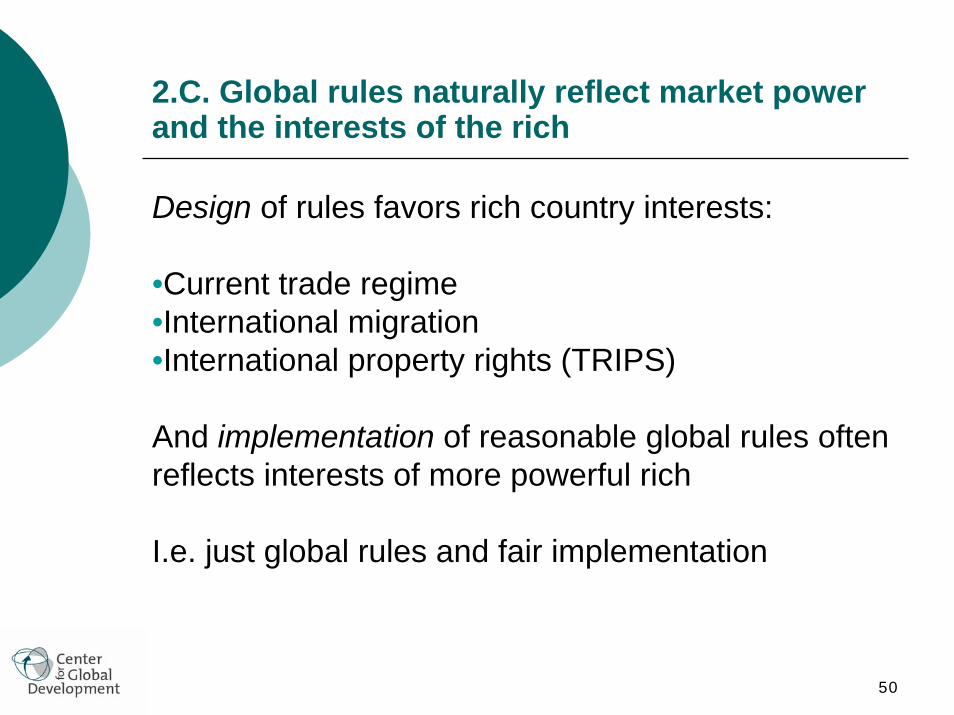
2.C. Global rules naturally reflect market power and the interests of the rich
Design of rules favors rich country interests:
•Current trade regime•International migration •International property rights (TRIPS)
And implementation of reasonable global rules often reflects interests of more powerful rich
I.e. just global rules and fair implementation
51
2. “Globalization” is Disequalizing
Definitions, debates, facts
2.A. Global markets work—and reward those with productive assets
2.B. Global markets are imperfect—and hurt most the poor
2.C. Global rules naturally reflect market power and the interests of the rich
52
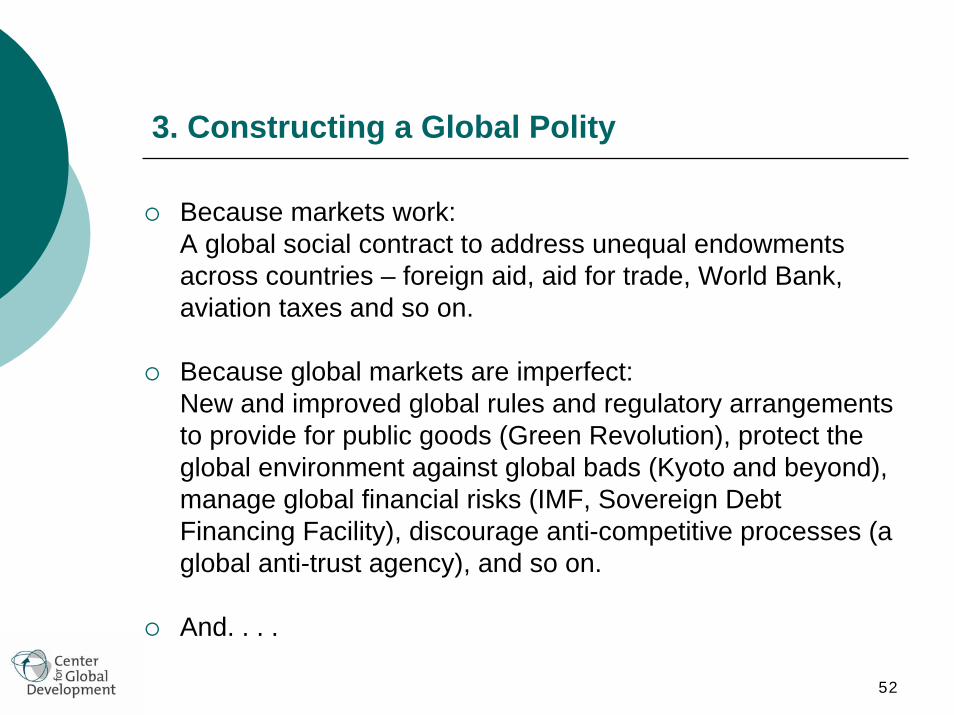
3. Constructing a Global Polity
Because markets work: A global social contract to address unequal endowments across countries – foreign aid, aid for trade, World Bank, aviation taxes and so on.
Because global markets are imperfect: New and improved global rules and regulatory arrangements to provide for public goods (Green Revolution), protect the global environment against global bads (Kyoto and beyond), manage global financial risks (IMF, Sovereign Debt Financing Facility), discourage anti-competitive processes (a global anti-trust agency), and so on.
And. . . .

53
3. Constructing a Global Polity
Because global rules tend to reflect the interests of the rich(With costs for all who seek a more secure, prosperous and
just world):
More voice and more votes for poor countries and poor people in global fora ... in the IMF, the World Bank, the UN Security Council, the Basle Committee for Banking Regulation and Supervision, the G-8, and so on;
and more emphasis on surveillance of rich countries’ commitments and adherence to fair rules; new efforts to complete the Doha as a development round; an International Migration Authority …
54
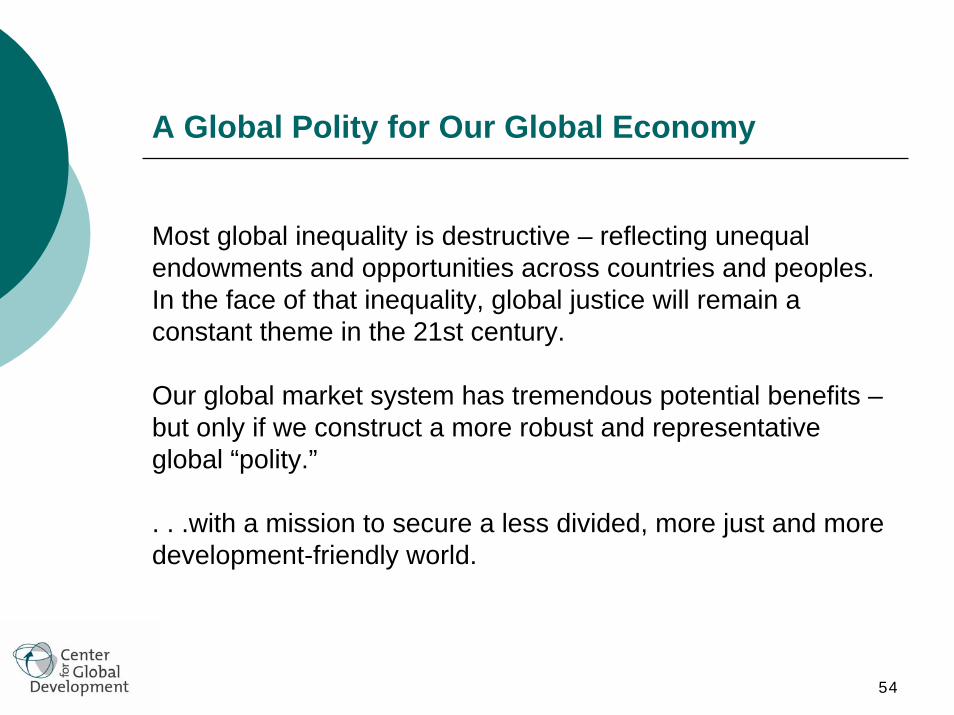
A Global Polity for Our Global Economy
Most global inequality is destructive – reflecting unequal endowments and opportunities across countries and peoples. In the face of that inequality, global justice will remain a constant theme in the 21st century.
Our global market system has tremendous potential benefits –but only if we construct a more robust and representative global “polity.”
. . .with a mission to secure a less divided, more just and moredevelopment-friendly world.


![Classroom Acoustics Slides - 2005 - FEFPA · Classroom Acoustics Slides – 2005 [G – ABP – Sales – Training – CES Presentations – Classroom Acoustics – 2005] Classroom](https://static.fdocuments.in/doc/165x107/5b4ff7de7f8b9a2f6e8d7856/classroom-acoustics-slides-2005-classroom-acoustics-slides-2005-g-.jpg)