Wide spectrum of Against the backdrop of the current weak...
48
abc Global Research Against the backdrop of the current weak macro situation, we believe that responding to climate change presents long-term growth opportunities for investors in India. India has strong potential as a low carbon economy, but it is also highly vulnerable to the projected impacts of climate change. We identify an initial set of 11 climate change themes, with cINR7.6trn (cUSD150bn) expected in investment between 2008 and 2017. Of the 15 beneficiary stocks under HSBC coverage, this report profiles seven current Overweights: BHEL, L&T, ONGC, PSL, RIL, Shree Renuka and Welspun Gujarat. India is the world’s fifth largest emitter of CO 2 , after China, the USA, the EU and Russia. But in relative terms, India is a low carbon economy, with per capita emissions about a quarter of the global average. In spite of projected growth in emissions, these are likely to remain below the developed country average. But India is one of the countries most exposed to the projected impacts of climate change, particularly on food production, water availability and coastal cities. Already 2.6% of GDP is spent each year on adapting to climate change. Compared with the industrialised world, India has a ‘wider spectrum of choices’ as it confronts the global threat of climate change, with a large potential for technological leapfrogging. The Government of India has started to intensify its response to this strategic issue. On the back of its National Action Plan on Climate Change (NAPCC), launched in June, and a range of existing policies to promote low carbon power and energy efficiency, we have identified an initial set of investable themes focusing on the mitigation potential from curbing carbon emissions. These include wind, solar, hydro, bio-power, biofuels, buildings efficiency, industrial efficiency, power efficiency, cleaner coal, fuel switching and nuclear. We estimate that around INR7.6trn (cUSD150bn) in investments will be made in these themes in FY2008-17, yielding annual emission cuts 18% below ‘business as usual’ projections by 2017. We identify a range of corporate beneficiaries from these themes, including 15 currently under equity coverage from HSBC and profile the seven stocks where HSBC currently has an Overweight rating. Climate Change India Wide spectrum of choices India’s climate investment opportunities revealed 27 November 2008 Nick Robins* Analyst HSBC Bank plc +44 20 7991 6778 [email protected] Charanjit Singh* Analyst HSBC Bank plc +91 80 3001 3776 [email protected] Sanjeev Kaushik* Analyst HSBC Securities and Capital Markets (India) Private Limited +91 22 22681271 [email protected] Roshan Padamadan*, CFA Analyst HSBC Bank plc +44 20 7991 6715 [email protected] View HSBC Global Research at: http://www.research.hsbc.com *Employed by a non-US affiliate of HSBC Securities (USA) Inc, and is not registered/qualified pursuant to NYSE and/or NASD regulations Issuer of report: HSBC Bank plc Disclaimer & Disclosures This report must be read with the disclosures and the analyst certifications in the Disclosure appendix, and with the Disclaimer, which forms part of it
-
Upload
nguyenkhue -
Category
Documents
-
view
217 -
download
2
Transcript of Wide spectrum of Against the backdrop of the current weak...

abcGlobal Research
Against the backdrop of the current weak macro situation, we believe that responding to climate change presents long-term growth opportunities for investors in India.
India has strong potential as a low carbon economy, but it is also highly vulnerable to the projected impacts of climate change.
We identify an initial set of 11 climate change themes, with cINR7.6trn (cUSD150bn) expected in investment between 2008 and 2017. Of the 15 beneficiary stocks under HSBC coverage, this report profiles seven current Overweights: BHEL, L&T, ONGC, PSL, RIL, Shree Renuka and Welspun Gujarat.
India is the world’s fifth largest emitter of CO2, after China, the USA, the EU and Russia. But in relative terms, India is a
low carbon economy, with per capita emissions about a quarter of the global average. In spite of projected growth in emissions, these are likely to remain below the developed
country average. But India is one of the countries most exposed to the projected impacts of climate change, particularly on food production, water availability and
coastal cities. Already 2.6% of GDP is spent each year on adapting to climate change.
Compared with the industrialised world, India has a ‘wider spectrum of choices’ as it confronts the global threat of
climate change, with a large potential for technological leapfrogging. The Government of India has started to intensify its response to this strategic issue. On the back of
its National Action Plan on Climate Change (NAPCC), launched in June, and a range of existing policies to promote low carbon power and energy efficiency, we have identified
an initial set of investable themes focusing on the mitigation potential from curbing carbon emissions. These include wind, solar, hydro, bio-power, biofuels, buildings efficiency,
industrial efficiency, power efficiency, cleaner coal, fuel switching and nuclear. We estimate that around INR7.6trn (cUSD150bn) in investments will be made in these themes
in FY2008-17, yielding annual emission cuts 18% below ‘business as usual’ projections by 2017.
We identify a range of corporate beneficiaries from these
themes, including 15 currently under equity coverage from HSBC and profile the seven stocks where HSBC currently has an Overweight rating.
Climate Change India
Wide spectrum of choices India’s climate investment opportunities revealed
27 November 2008 Nick Robins* Analyst HSBC Bank plc +44 20 7991 6778 [email protected]
Charanjit Singh* Analyst HSBC Bank plc +91 80 3001 3776 [email protected]
Sanjeev Kaushik* Analyst HSBC Securities and Capital Markets (India) Private Limited +91 22 22681271 [email protected]
Roshan Padamadan*, CFA Analyst HSBC Bank plc +44 20 7991 6715 [email protected]
View HSBC Global Research at: http://www.research.hsbc.com
*Employed by a non-US affiliate of HSBC Securities (USA) Inc, and is not registered/qualified pursuant to NYSE and/or NASD regulations
Issuer of report: HSBC Bank plc
Disclaimer & Disclosures This report must be read with the disclosures and the analyst certifications in the Disclosure appendix, and with the Disclaimer, which forms part of it

2
Climate Change India 27 November 2008
abc
Summary 3 Awakening to climate change 3
Starting a marathon 4 The investment potential 4
Our methodology 4 Risks to our assumptions 5
Business beneficiaries 6
Note 6
India’s climate profile 7 Many feet, small footprints 7
Powering ahead 8
India No. 4 in world wind 9 Well-placed in carbon markets 9
India’s carbon outlook 10
Vulnerable to change 11
Adaptation – the national priority 12
India’s climate upside 13 Renewable energy 14
Theme 1: Wind energy 14 Theme 2: Solar power 15 Theme 3: Small hydropower 16 Theme 4: Biomass power 16 Theme 5: Bio fuels 17
Lower carbon power 18
Theme 6: Cleaner coal 18 Theme 7: Natural gas fuel switching 19 Theme 8: Nuclear Power 20
Energy efficiency 21
Theme 9: Industrial energy efficiency 22 Theme 10: Buildings efficiency 22 Theme 11: Power supply efficiency 24
Outlook 25
Company section 26
BHEL 27
Larsen & Toubro 29
ONGC 31
PSL Ltd 33
Reliance Industries (RIL) 35
Shree Renuka Sugars 37
Welspun Gujarat 39
Disclosure appendix 44
Disclaimer 47
We gratefully acknowledge the assistance of R Chaturvedi,
S Goel and D Saravanan of the HSBC Climate Change
Centre of Excellence in the preparation of this report.
Contents
3
Climate Change India 27 November 2008
abc
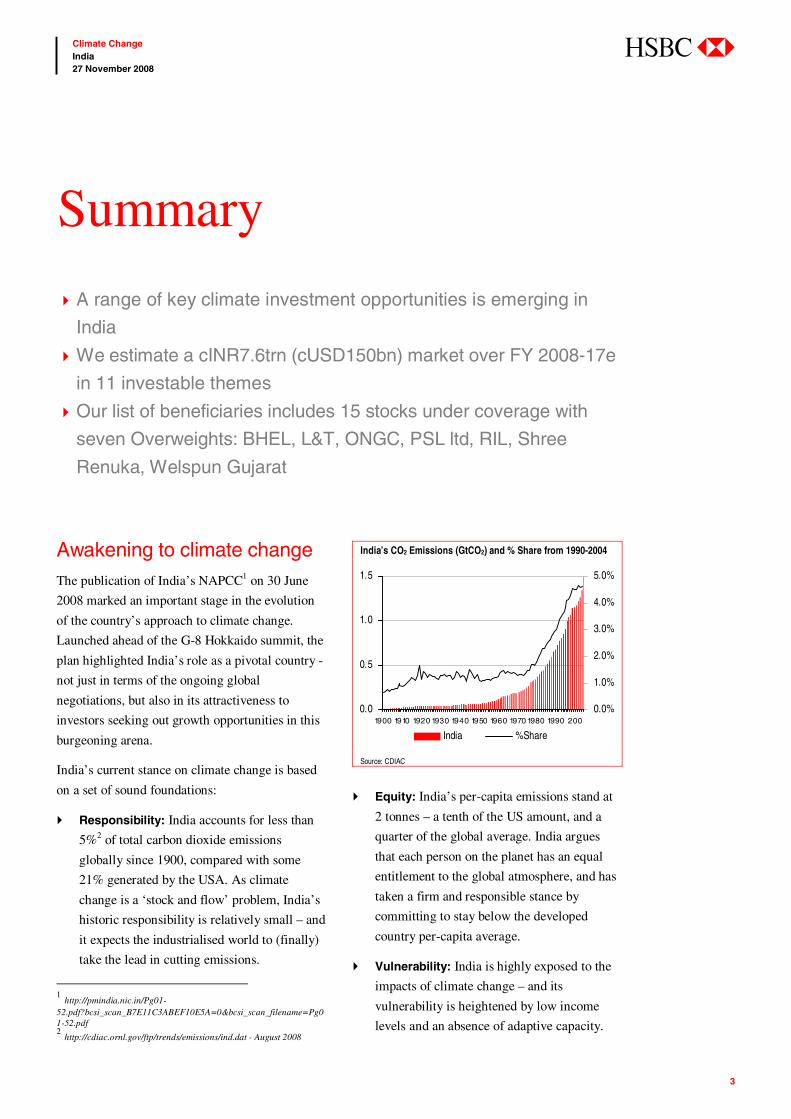
Awakening to climate change The publication of India’s NAPCC1 on 30 June
2008 marked an important stage in the evolution
of the country’s approach to climate change.
Launched ahead of the G-8 Hokkaido summit, the
plan highlighted India’s role as a pivotal country -
not just in terms of the ongoing global
negotiations, but also in its attractiveness to
investors seeking out growth opportunities in this
burgeoning arena.
India’s current stance on climate change is based
on a set of sound foundations:
Responsibility: India accounts for less than
5%2 of total carbon dioxide emissions
globally since 1900, compared with some
21% generated by the USA. As climate
change is a ‘stock and flow’ problem, India’s
historic responsibility is relatively small – and
it expects the industrialised world to (finally)
take the lead in cutting emissions.
1 http://pmindia.nic.in/Pg01-52.pdf?bcsi_scan_B7E11C3ABEF10E5A=0&bcsi_scan_filename=Pg01-52.pdf 2 http://cdiac.ornl.gov/ftp/trends/emissions/ind.dat - August 2008
India’s CO2 Emissions (GtCO2) and % Share from 1990-2004
0.0
0.5
1.0
1.5
1900 1910 1920 1930 1940 1950 1960 1970 1980 1990 2000.0%
1.0%
2.0%
3.0%
4.0%
5.0%
India %Share
Source: CDIAC
Equity: India’s per-capita emissions stand at
2 tonnes – a tenth of the US amount, and a
quarter of the global average. India argues
that each person on the planet has an equal
entitlement to the global atmosphere, and has
taken a firm and responsible stance by
committing to stay below the developed
country per-capita average.
Vulnerability: India is highly exposed to the
impacts of climate change – and its
vulnerability is heightened by low income
levels and an absence of adaptive capacity.
Summary
A range of key climate investment opportunities is emerging in
India
We estimate a cINR7.6trn (cUSD150bn) market over FY 2008-17e
in 11 investable themes
Our list of beneficiaries includes 15 stocks under coverage with
seven Overweights: BHEL, L&T, ONGC, PSL ltd, RIL, Shree
Renuka, Welspun Gujarat

4
Climate Change India 27 November 2008
abc
For this reason, the government has identified
adaptation - protecting its people – as its
primary climate change priority.
Sustainability: Action to curb greenhouse gas
emissions needs to be entirely consistent with
India’s overriding priorities of economic
growth and eradicating poverty – in other
words, emission cuts will be generated only
as co-benefits of its wider strategy for
sustainable development.
Opportunity: India is already the world’s
fourth largest market for wind power, and the
second largest supplier of carbon credits
under the Clean Development Mechanism.
Policymakers and business leaders recognise
that sizeable growth opportunities lie ahead.
Starting a marathon
We see the NAPCC as the starting point of a
marathon which will last many decades. In
essence, it is a ‘plan for a plan’, kick-starting eight
national missions, which will become the pillars
of India’s effort on climate related aspects. The
eight missions are scheduled to report to the
Prime Minister’s Council on Climate Change by
December 2008, recommending the specific
measures needed to accelerate action to boost
solar, energy efficiency and waste management as
well as strengthening the resilience of agriculture,
forests and water resources. Each mission will
also report publicly on its annual performance.
These reports will be critical to enable investors to
judge the scale of incentives that the government
intends to put in place to drive this agenda. The investment potential On the basis of the trajectory laid out by the
NAPCC, India’s existing policies and our own
analysis, we have identified 11 investment themes
that have sizeable market drivers and a range of
companies with material exposure. These themes,
with a total investment potential of INR7.6trn, are
listed in the table below
Our methodology
We estimate the investments over five-year and
10-year time frames, aligned with the Government
of India’s XIth (FY 2008-12) and XIIth five-year
plans (FY 2013-17).
Estimated investments across climate change themes with potential beneficiaries
Sector / Industry FY 2008-2012 FY 2008-2017 Potential beneficiaries (listed companies) INR bn INR bn
Renewable Solar 55 200 Moser Baer, XL Telecom & Energy, Webel Solar Wind 500 1340 Suzlon Energy, Shriram EPC, Indowind Small hydro 65 140 Jai Prakash Associates,BHEL, Maytas Infrastructure, Alstom, HCC, L&T, GMR,
Gammon Biomass power 60 120 Shriram EPC, Gammon, Surya Chakra power, Thermax Ltd, Triveni Engineering and
Industries Biofuels 140 1470 Praj Industries, Alfa Laval (India), Bajaj Hindustan, Shri Renuka Sugars, Balrampur
Chinni Mills Low carbon power Clean coal technologies (Supercritical)
350 1700 BnbHEL, L&T
Fuel switch options (NG) 160 700 ONGC, RIL, Welspun Gujarat Stahl Rohren Ltd, Jindal Saw ,PSL Ltd Nuclear 140 1200 L&T, BHEL Energy efficiency Building efficiency (CFL) 110 200 Asian Electronics, Havells India Ltd , Phoenix Lamps, Surya Roshni ltd Industrial efficiency 25 55 ABB India, Triveni Engineering and Industries, Thermax India ,Alfa Laval, Crompton
Greaves Power supply efficiency 250 500 Bharat Heavy Electrical (BHEL), ABB India, Crompton Greaves, ICSA India ltd, KLG
Systel Total 1855 7625
Source: HSBC, Note: Profiles of beneficiary companies under coverage of HSBC analysts with an Overweight rating are summarised in the company section of note

5
Climate Change India 27 November 2008
abc
In terms of power generation, we have projected
the likely capacity additions in MW terms for
wind, solar, biomass power, small hydro, clean
coal technologies and nuclear, and on the basis of
our benchmark capex rate we have calculated the
investment potential. For the Solar PV theme, we
have calculated the investment required to construct
1,000MW of new manufacturing capacity.
For the energy efficiency theme, we have examined
the targeted savings over the periods in MW and
using our benchmark cost per MW concluded with
the required investment levels. Our estimates of
investment potential in the energy efficient lighting
industry take into consideration a marginal reduction
in the price of compact fluorescent lamps (CFL)
year-on-year.
For the biofuel sector, the investment figure
relates to the revenue potential for bio-fuel
producers based on our assumptions on blending
targets, oil consumption and bio-fuel prices over
the estimate period.
Risks to our assumptions
The sharp weakening of both the national and global
macro-economic environment has thrown into
question the durability of climate change as an
investment theme. Certainly, the prospect of
declining growth and the contraction in credit
availability will be deterrents to our projected
investments in the short term. Set against this, we are
confident that the political momentum behind action
to boost clean energy, energy security and a low
carbon economy remains strong – and has actually
been improved with the recent election of Barack
Obama in the USA. This makes a domestic boost for
clean energy more likely in the USA, and also boosts
the chances of achieving a global deal on climate
change at Copenhagen in December 2009. This is
important, as further action by India on climate
change is dependent on confidence building
measures from the G-8, particularly around
ambitious targets to cut their emissions as well as the
provision of financial assistance and technology
transfer. A failure to reach agreement in Copenhagen
would correspondingly erode political will in India.
Domestically, the major risks to our assumptions
are from: (i) policy slippage in the run-up to the
scheduled general election by May 2009 and loss
of policy priority thereafter (ii) disagreement
between state governments and the central
government on climate policies (iii) a failure to
implement the agreed policies (iv) an absence of
expected improvements in technology cost and
effectiveness (v) a decline in benchmark prices
from the assumed levels.
Estimated emission savings from investments
Making these investments will have a significant
impact on India’s emission profile. The table below
shows the estimated annual emission savings from
FY2013 onwards based on estimated investments in
FY2008-12 and from FY2018 onwards based on
estimated investments made during FY2008-17.
Estimated annual emission savings
FY 2013 onwards FY 2018 onwards mtCO2 mtCO2
Renewables Wind 18.4 49.1 Solar 0.2 1.1 Small hydro 2.5 5.5 Biomass power 6.8 13.7 Biofuels 3.9 32.3 Low carbon power Cleaner coal technologies 5.7 28.1 Natural gas fuel switching 12.3 53.2 Nuclear 11.3 96.4 Energy efficiency Industrial efficiency 14 30.8 Building efficiency 58.5 114.1 Power supply efficiency 23.8 55.7 Total 157 480
Source: HSBC
According to the Pew Centre on Global Climate
Change, India’s projected ‘business as usual’
greenhouse emissions by 2017 will be around 2.7 Gt
CO23. We estimate that the proposed measures can
help to mitigate 0.48 Gt of CO2 emissions by 2017
thus reducing total BAU emissions by 18%.
3 Climate change mitigation measure in India, Sept 2008, Pew Centre of Climate Change

6
Climate Change India 27 November 2008
abc
Business beneficiaries Among the range of potential beneficiaries from
this projected investment shift, we have identified
15 equities under HSBC coverage, listed below.
In our company section of this note, we provide a
brief profile of the seven companies which
currently have an Overweight rating.
Note
In this report, two measures of climate changing
emissions are given: the first relates to emissions
of CO2, the main greenhouse gas, from fossil fuel
use and cement production, and is given in tonnes
of CO2. The second covers all greenhouse gases
(including CO2 from land use change, methane,
nitrous oxide and fluorinated gases) and is given in
tonnes of CO2 equivalent (CO2-e).
Beneficiary companies under HSBC coverage with ratings and target prices
Company Reuters ticker Rating Share price INR Target price (INR) Theme
BHEL BHEL.BO Overweight (V) 1,302.0 1,750 Cleaner coal, Nuclear, Power supply efficiencyLarsen & Toubro LART.BO Overweight (V) 758.7 1250 Cleaner coal, NuclearONGC ONGC.BO Overweight 678.5 1470 Natural gas fuel switchingPSL Ltd PSLH.BO Overweight (V) 89.5 170 Natural gas fuel switching Reliance Industries RELI.BO Overweight (V) 1,144.8 2,160 Natural gas fuel switching Shree Renuka sugars SRES.BO Overweight (V) 51.2 80 BiofuelsWelspun Gujarat WGSR.BO Overweight (V) 93.3 160 Natural gas fuel switching Balrampur Chini BACH.BO Neutral (V) 35.4 BiofuelsGAIL GAIL.BO Neutral (V) 199.4 Natural gas fuel switching Havells India HVEL.BO Neutral (V) 142.6 Building efficiency Thermax THMX.BO Neutral (V) 195.5 Industrial efficiencySuzlon SUZL.NS Neutral (V) 46.8 Wind ABB India ABB.BO Underweight (V) 430.1 Industrial efficiencyBajaj Hindusthan BJHN.BO Underweight (V) 41.6 Bio-fuelsJindal Saw JIND.BO Underweight (V) 270.6 Natural gas fuel switching
Note: Closing price as of 24 Nov 2008 Source: HSBC

7
Climate Change India 27 November 2008
abc
Many feet, small footprints With a population of over 1.1 billion, India has a
relatively small carbon footprint. Since 1900,
India’s contributions to global emissions of
carbon dioxide have amounted to less than 5% of
the total, according to CDIAC. But India’s overall
responsibility is probably much less than this. For
example, if the absorptive capacity of the oceans
is shared equally among the world’s inhabitants
then India’s share falls sharply to just 0.3%4.
India’s CO2 emissions from fossil fuel
combustion are certainly on an upward curve,
almost doubling since 1990. However, these have
stayed relatively flat since 2004. As a result, India
4Muller et al, October 2007
http://www.oxfordclimatepolicy.org/publications/DifferentiatingResponsibility.pdf
is the fifth largest emitter of CO2 in absolute
terms, behind China, the USA, the EU and Russia.
In per-capita terms, taking all greenhouse gases
into account, India’s current per-capita footprint
stands at around 2 tonnes, a third of China’s and a
tenth of the USA’s (illustrated on page 10).
India’s emissions have been curbed by a
combination of poverty and suppressed demand
for power. More than 50% of Indian households
in rural areas still do not have access to electricity,
ensuring that per-capita electricity consumption is
a quarter of the world average.5
India’s relatively small carbon footprint, when
calculated in absolute and per-capita terms, is
5 Woods Hole, 2007 http://www.whrc.org/about_us/PDF/2007_WHRC_AR.pdf
India’s climate profile
India has a relatively small carbon footprint
Wind and carbon markets are generating strong revenue growth
700 million people are vulnerable to a changing climate
Regional sources of emissions of CO2 from fossil fuel use & cement and percentage growth 1970-2007
0.0
1.0
2.0
3.0
4.0
5.0
6.0
7.0
8.0
US China EU - 15 Russia India Japan Canada South East Mex ico
Emis
sion
s (G
tCO
2)
-50.0%
0.0%
50.0%
100.0%
150.0%
200.0%
%C
hang
e
1990 2004 2007 % change 1990 -2007
.Source: Netherlands Environmental Assessment Agency, 2008

8
Climate Change India 27 November 2008
abc
perhaps not a great surprise. What is more
revealing from an economic – and investment –
perspective is its low carbon intensity, in other
words, the amount of emissions per dollar of GDP
adjusted for purchasing power parity. India’s
ability to squeeze extra value out of each kilogram
of carbon started low and has continued to
improve since 1990. In 2004, the country emitted
nearly 300 tonnes of CO2 for each million USD of
GDP, compared with 610t/USDm in China and
701t/USDm in the USA, and a world average of
492t/USDm. By 2030, the US Energy Information
Administration expects India’s carbon intensity to
fall to just 138t/USDm, an annual improvement of
some 2.9%, outstripping the global average
improvement of 2.1%.
Globally and within India, power generation and
industry are the two largest sources of greenhouse
gases. India’s rural base means that agriculture
contributes 28% of national emissions, double the
global proportion. While tropical deforestation
contributes 17% of global emissions, in India,
forests are a minor source of net emissions.
India’s emissions from the transport sector are
half the global level.
Powering ahead With power the primary source of emissions,
understanding India’s expansion plans is essential
to comprehending the country’s carbon trajectory.
Although power capacity increased only 21,180
MW under the last Five Year Plan, this is set to
grow four-fold in the current planning period to
more than 80,000MW.
Growth in primary energy consumption in India (in mtoe)
0
200
400
600
800
1000
1200
1400
1600
1800
Source: Integrated Energy Policy 2005, Planning Commission,
India has the fourth largest coal reserves in the
world - after the US, Russia and China – and coal-
fired power accounts for more than half of the
Carbon Dioxide Intensity – ‘000 tCO2 per Million USD of GDPppp
0.0
0.2
0.4
0.6
0.8
1.0
1.2
1990 1991 1992 1993 1994 1995 1996 1997 1998 1999 2000 2001 2002 2003 2004 2005 2010 2015 2020 2025 2030
India United States China Russia Europe World Total
Source: Energy Information Administration / International Energy Outlook 2007

9
Climate Change India 27 November 2008
abc
energy mix, followed by hydro electricity at 25%,
with renewable contributing 8%, three-quarters of
which is wind.
Power sector emissions have been following a
steady upward trend, rising from 400m tonne in
2000-01 to 500m tonne in 2006-7, and projected
to climb further to 660m tonne by 2012, according
to the Central Electricity Authority (CEA).
Power generation mix in India (31 May 2008)
Hydro25%
Nuclear3%
Oil1%
Gas10%
Coal53%
Renewables8%
Thermal64%
Source: CEA
India No. 4 in world wind
At the end of 2007, India had installed wind
turbine capacity of 7,840MW, making it the
fourth largest wind energy base in the world, after
Germany, the USA and Spain. During 2007, India
added around 1,700MW of wind capacity. HSBC
estimates that new wind installations in the
country will continue to grow at a CAGR of
c.11% between 2007 and 2012. As part of the
current 11th Plan, the Government’s target is to
boost wind capacity to 10,500MW, and total
renewable energy to 14,000 MW.
Cumulative installed capacity of wind turbines globally (MW)
0
5000
10000
15000
20000
25000
Germany US Spain India China Den-mark
Italy France UK Portugal
Source: Make Consulting, HSBC
Well-placed in carbon markets
With the introduction of the Kyoto Protocol, a
burgeoning global carbon market has emerged,
within which India has become a leading player.
As part of the Protocol’s flexible mechanisms,
emission reduction projects can be established in
developing countries under the Clean
Development Mechanism (CDM). The resulting
certified emission reductions (CERs) can be used
by industrialised country governments and
companies to fulfil their commitments under the
Protocol. Currently, India has 31% of total
projects registered with UNFCCC, ahead of China
with 23%. However, China holds a 37% market
share in terms of CDM revenues (by issued
CERs), leaving India behind with 25%. Due to the
larger size of China’s projects, India’s slice of the
market is projected to decline to 15% by 2012,
while China’s share is estimated to increase to
around 54%.

10
Climate Change India 27 November 2008
abc
Projected CDM market share in 2012
China
54%
India
15%
Others
11%
Asia
80%
Latin
America
(Rest)8%
Middle East
1%
Africa
3%Europe
1%
Brazil
7%
Source: CDM Pipeline - 1 October 2008
India has a better balance of projects under the
CDM, however, with nearly two-thirds of projects
in renewables and more than a quarter in energy
efficiency. As of October 2008, renewable energy
projects constituted 648 out of 1,079 projects in
the Indian CDM pipeline6. These projects have a
potential to generate c160m tonnes of CERs by
2012. At a price of EUR20 per tonne, these CERs
will generate revenues in India of INR200bn
(EUR3.2bn). Carbon finance through the CDM
works to raise the project IRRs by 0.5-3.0%,
according to the World Bank. At a global level,
the World Bank estimates that the USD12 billion
CDM market leveraged a further USD33 billion in
additional investment in clean energy, and a
similar ratio is likely to apply in India as well. In
India, the CDM has leveraged 241 wind projects,
equivalent to 4,319 MW, and 106 hydro projects,
equivalent to 2,143 MW6.
6 CDM Pipeline, Oct 2008
CDM projects spread in India
HFCs
PFCs &
N2O
1.9%
Demand
side EE
24.2%
Renew able
60.7%
CH4
Cement
CBM
6.3%
Supply
side EE
1.8%
Fuel sw itch
4.3%
Forestration
0.6%
Transport
0.2%
Source: CDM Pipeline - 1 October 2008
India’s carbon outlook Internationally, a consensus is emerging that global
emission of CO2 need to be halved by 2050 to
prevent dangerous climate change. According to a
recent paper7 by Nicholas Stern, Key Elements of a
Global Deal on Climate Change, average per-capita
CO2 emissions need to fall from around 7 tonnes
today to around 2 tonnes in 2050.
On a business as usual basis, India’s emissions are
projected to rise from 2 tonnes today to some 6
tonnes in 2050. Over the same period, the USA’s
per-capita footprint would grow from 22 to 26
tonnes, and China’s would expand from 6 to 19
tonnes. This would leave India comfortably at the
bottom of the pack of major nations.
It is in this context that Prime Minister
Manmohan Singh’s pledge to keep India’s per-
capita emissions below the developed world
7http://www.lse.ac.uk/collections/granthamInstitute/publications/KeyEl
ementsOfAGlobalDeal_30Apr08.pdf
Current and projected per-capita CO2e emissions
0
5
10
15
20
25
30
C a n ad a U S R u s s ia B ra z il J ap an E U -27 C h ina Ind ia
2 005 20 5 0 B A U
Source: The Climate Group, Breaking the Deadlock, 2008

11
Climate Change India 27 November 2008
abc
average is critical. With leading European
countries, such as France and the UK, also
moving to the per-capita model as the benchmark
for future negotiations, a scenario of ‘contraction
and convergence’ is coming to the fore. In this
scenario, industrialised countries would contract
their emissions by 80-95% by 2050, and converge
with the much lower emission profile of the
developing world. The sobering aspect of Stern’s
latest calculations, however, is that over the long
term, developing countries, such as India, will
also need to bend their projected emissions
trajectory if they are to stay below the 2 tonne
benchmark.
India is a founding signatory to the UN
Framework Convention on Climate Change and
has ratified the 1997 Kyoto Protocol. As a
developing country, it does not have any binding
emission reduction targets – and the government
remains opposed to taking on mandatory carbon
curbs as part of the current negotiations for a
successor to Kyoto. Overall, it remains unlikely
that India will accept emission cuts for at least
another decade.
Vulnerable to change As a result of past emissions, the planet is
committed to a certain degree of warming – and
associated impacts – over the coming decades,
with different impact on countries across the
globe. India is considered highly vulnerable to
climate change. Its 700m strong rural population
is directly dependant on climate sensitive
resources, notably water, biodiversity, mangroves,
coastal zones and grasslands. This exposure is
magnified by relatively low levels of adaptive
capacity in terms of the financial and institutional
resources to prevent and respond to the impacts of
a changing climate.
India’s first National Communication on climate
change (NATCOM), in 2004, warned of the
natural ecosystem coming under intense pressure,
expressed in an increase in the severity of
droughts and floods. It also predicted a decline in
agricultural productivity. The results of the
Intergovernmental Panel on Climate Change
(IPCC) Fourth Assessment Report, published last
year, confirmed that India was particularly
vulnerable to the impacts of climate change. It
highlighted the “extreme” risks faced by mega-
deltas, such as the Ganges-Brahamputra to sea
level rise and coastal flooding, as well as the
“very high” risk of the disappearance of the
Himalayan glaciers by 2035 if the Earth continues
warming at the current rate. A 2007 World Bank
study8 also concluded that India is one of the most
vulnerable countries, behind Bangladesh, China
and Greece.
This year, a Confederation of Indian Industry
(CII) report suggested that the possible climate
change impacts on India could include:
Migration of 20% of the coastal population
due to rising sea levels
Increased exposure to tropical cyclones and
flood risk affecting 25% of the country’s
population
Desertion of around 20,000 villages
Reduced crop yields of up to 10%9
Overall, this year’s NAPCC takes a more cautious
approach to the observed changes in India’s
climate, concluding that records do not yet
suggest “any marked long-term trend in the
frequency of large-scale droughts and floods”.
Equally, in terms of the Himalayan glaciers, the
Plan argues that “it is too early to establish long-
term trends”. Looking ahead, the Plan recognises
the potentially significant implications of
projected temperature increases on the quantity
8 World Bank, Country Stakes in Climate Change Negotiations: Two Dimensions of Vulnerability http://www-wds.worldbank.org/external/default/WDSContentServer/WDSP/IB/2007/08/02/000158349_20070802104550/Rendered/PDF/wps4300.pdf 9 CII, Building a Low-carbon Indian economy, 2008.

12
Climate Change India 27 November 2008
abc
and quality of water, as well as on agriculture and
forests, human health, exposure to extreme
weather events and sea level rise.
India has already warmed by 0.4°C over the past
century. The IPCC projects an annual mean
surface temperature rise of 3.5°C under the A2
scenario and 2.5-4°C under the B2 scenario by the
2100, with warming more pronounced in northern
India. Our overall assessment of India’s projected
climate impacts associated with rising
temperatures is presented in the chart above.
Adaptation – the national priority
India is already spending INR1,030bn, or 2.6% of
GDP, on adaptation to climate vulnerability.
Key initiatives include improving arid-land crops,
minimising the adverse effects of drought,
accelerating afforestation, promoting rain-water
harvesting, introducing planning restrictions in
coastal areas, introducing proactive disaster
management programmes, controlling vector
borne diseases, such as malaria, and providing
crop insurance and credit support for farmers. In
most cases, however, we have not identified clear
investable ideas flowing from the adaptation
agenda, and so the rest of this report focuses on
the investment relevant themes that flow from the
mitigation imperative – curbing carbon emissions.
Projected impacts of climate change in India associated with rising global temperatures
Glaciers
Monsoon
WaterBasins
Forests
Sea level
Extremeevents
Health
Food
Global temperature change (relative to pre-industrial)1º C 2º C 5º C4º C3º CSector
2 to 5% decrease in wheat and maize in India1 May result in total loss up to 70% in productivity8,9
Coastal states of Maharashtra, Karnataka, and Kerala; Himanchal, Arunachal, Nagaland, Mizoram and Manipur will become malaria prone7,8.
Increased cyclonic activity and storm surge in Bay of Bengal6,7
A rise of 10-25 cm predicted for the next 100 years based on current observed trend6,7
Sea – level rise threatens major cities1,7
68% current forested grids will become unsuitable for the current forest types5,7
77% current forested grids will become unsuitable for the current forest types5,7
Krishna, Cauvery, Narmada and Tapi river basins likely to experience severe water stress and Mahanadi, Godavari and Brahmani likely to experience flood4,7
20 % rise in all India summer monsoon rainfall, droughts in Punjab, Tamil Nadu and Rajasthan3,7
Himalayan Glacial ecosystem under severe threat of disappearance95 times reduc. in Himalayan glacial area1
Glaciers
Monsoon
WaterBasins
Forests
Sea level
Extremeevents
Health
Food
Glaciers
Monsoon
WaterBasins
Forests
Sea level
Extremeevents
Health
Food
Global temperature change (relative to pre-industrial)1º C 2º C 5º C4º C3º CSector
2 to 5% decrease in wheat and maize in India1 May result in total loss up to 70% in productivity8,9
Coastal states of Maharashtra, Karnataka, and Kerala; Himanchal, Arunachal, Nagaland, Mizoram and Manipur will become malaria prone7,8.
Increased cyclonic activity and storm surge in Bay of Bengal6,7
A rise of 10-25 cm predicted for the next 100 years based on current observed trend6,7
Sea – level rise threatens major cities1,7
68% current forested grids will become unsuitable for the current forest types5,7
77% current forested grids will become unsuitable for the current forest types5,7
Krishna, Cauvery, Narmada and Tapi river basins likely to experience severe water stress and Mahanadi, Godavari and Brahmani likely to experience flood4,7
20 % rise in all India summer monsoon rainfall, droughts in Punjab, Tamil Nadu and Rajasthan3,7
Himalayan Glacial ecosystem under severe threat of disappearance95 times reduc. in Himalayan glacial area1
Source: 7 NATCOM, 2004; 3 Rupa Kumar et al., 2006; 9 Stern review, 2006; 4 Gosain et al., 2006; 5 Ravindranath et al., 2006; 6 Unnikrishnan et al., 2006; 8 Bhattacharya et al., 2006., 1 IPCC, 2007; 8 Challinor et al. 2006.

13
Climate Change India 27 November 2008
abc
Taking our cue from the Action Plan, we have
reviewed the eight new National Missions. These
are designed to produce “multi-pronged, long-
term and integrated strategies” covering:
Expanding solar energy
Improving energy efficiency
Better management of habitats (cities)
Conserving water resources
Protecting the Himalayan ecosystem
Boosting Green India (forests)
Encouraging more resilient agriculture
Building a climate knowledge platform
The Plan also covers a range of other key areas of
climate change policy, where programmes are
already underway. These include:
Cleaner coal
Fuel switching
Nuclear power
Renewable energy
Disaster Management
Human Health
From these, we have identified what we consider to
be investable themes that have material financial
drivers behind them, and where equity investment
opportunities exist. In this, our first report on climate
change investing in India, we have chosen to focus
on the key mitigation themes.
A more detailed assessment of the global potential
of a range of climate change investment themes is
provided in our September 2008 report, Gathering
Momentum.
India’s climate upside
We have reviewed the National Plan and other government
policies for material investment drivers
As a result, we have identified 11 currently investable themes
related to climate change in India
Over the period FY 2008-17e, we estimate investments of
INR3.2trn in renewables, INR0.75trn in energy efficiency and
INR3.6trn in lower carbon power technologies

14
Climate Change India 27 November 2008
abc
Renewable energy Building on India’s long-standing framework for
promoting renewables, the NAPCC is highly
bullish about renewable energy technologies,
arguing that it has “the potential to replace all
current and foreseeable use of fossil fuels, for
power generation, transportation, and industrial
use, for all time to come”.
Since the 2006 National Tariff Policy, the State
Electricity Regulatory Commissions (SERCs)
have been given the ability to mandate a
minimum percentage electricity purchase from
renewable sources, following which a number of
states have set targets. The Plan proposes to
tighten this by stipulating that from 2009-10, the
renewable energy purchase may be set at 5% of
total grid purchase and increased 1% each year for
10 years. This would exclude hydropower, with
storage capacity in excess of daily peaking
capacity. The Plan also proposes a ‘renewable
energy certificate’ system, under which the
Central Electricity Regulatory Commission
(CERC) would issue certificates to the SERCs for
procuring renewable-based power in excess of the
national standard. Any SERCs that fall short of
their renewable standard obligations would then
be able buy certificates from the SERCs with
surplus renewable energy procurement. In the
event of some SERC still falling short, the CERC
could impose a penalty as allowed under the
Electricity Act of 2003.
We expect the CERC to issue the new regulations
before March 2009, mandating Dynamic
Renewable Portfolio standards, taking into
consideration the current renewable generation
capacity and proposed capacity additions.
Within the renewable energy theme, we believe
that the strongest potential lies in wind, solar,
biomass, small hydro and biofuels.
Theme 1: Wind energy
By 31 March 2008, only 6.2% of India’s gross
wind potential of 45,000MW had been tapped.
This 8,757MW of commercial projects constituted
around 6% of the total generation capacity of
India. Growth has been rapid, with over 5400MW
of wind capacity in the past five years, compared
with just 1,400MW of nuclear energy.
To promote IPP investments in the wind sector,
the Indian Ministry of New and Renewable
Energy (MNRE) in August 2008 announced a
generation based incentive (GBI) of INR0.50 per
unit (USD0.01) of wind-power fed to the grid.
We estimate new capacity additions (both off
shore and on shore) of 10,500MW over FY2008-
12 and 17,500MW during FY 2013-17 .
Assuming a per MW capital cost of INR48m, this
State Power: Wind Power Potential and Capacity in Key Indian States
0.00
2000.00
4000.00
6000.00
8000.00
10000.00
12000.00
Andhra
Pradesh
Gujarat Karnatak a Kerala Madhy a
Pradesh
Maharashtra Rajasthan Tamil Nadu West Bengal Others
Gro ss Poten tial (MW) Total Capacity (MW) March 2008 Technical Po ten tial (MW)
Source: MNES 2008

15
Climate Change India 27 November 2008
abc
results in an investment opportunity of INR 500bn
and INR840bn respectively. Our calculations
suggest that these investments could cut emissions
by 49m tonnes of CO2 p.a.
Wind capacity growth
0
5000
10000
15000
20000
25000
30000
35000
40000
2005 2006 2007 2008 2012 2017
Source: HSBC, IWEA
Wind beneficiaries
The major beneficiaries of wind energy growth
are likely to be wind turbine manufacturers, such
as Shriram EPC and Suzlon, as well as wind farm
developers, such as Indowind.
Theme 2: Solar power
India receives solar energy equivalent to 5,000
trillion kWh per year – and the dedication of just
1% of India’s land area to solar power could meet
the country’s entire electricity requirements up to
203010. The NAPCC seeks to promote two
different types of solar power - photovoltaic (PV)
and solar thermal electricity generation (STEG),
often known as concentrated solar power (CSP).
Concentrated Solar Power
STEG provides baseload electricity and can also
work in hybrid mode, enabling co-firing with
natural gas. Proposed STEG plants are large,
generating at least 10MW and preferably more
than 100MW to benefit from economies of scale
(source: NEF).
10 http://mnre.gov.in/ July 2008
India’s climate action plan sets a goal to establish
1GW of concentrated solar power (CSP)
generation capacity by 2017. This is less than 1%
of proposed capacity additions in the XIth and
XIIth five-year plans. Currently, the generation
cost of STEG, at around INR20/unit for a plant
efficiency of 18%, is much higher than the
generation cost of coal or gas. But it is more in
line with the generation costs of a diesel generator
(DG) set. With current installed capacity of DG
sets in India at 20,000 MW (15% of total grid
capacity) and diesel subsidies in the range of
INR12-23 per litre (for a crude oil price range of
USD114-139 per barrel and diesel price of
INR34.80/litre), we believe it would make
commercial sense to divert the oil subsidy to
incentivise the rapid commercialisation of solar
thermal. We estimate that 1% of the total oil
subsidy in 2007 could fund 3GW of solar thermal
installations, assuming a subsidy of INR10/unit.
We estimate a total solar thermal generating
capacity addition in the range of 200MW by
FY2012 and another 800MW during FY2013-
2017. We expect increasing competition in the
solar thermal industry and technology
improvements to result in capital cost reductions
y-o-y, and have therefore assumed a per MW
capital cost of INR160m for FY2008-12 and
INR112m for FY2013-18. The action plan focuses
on technology transfer and R&D to kick-start this
initiative. This estimated 1,000MW solar capacity
will provide CO2 emission reductions of 1.1m
tonnes per annum by FY 2018.
Photovoltaic
The NAPCC also aims at establishing integrated
PV manufacturing capacity of 1GW per year by
2017 in India. By the end of 2008, we estimate
that the total PV cell manufacturing capacity in
India will stand at around c400MW, and we
expect this to reach 1,250MW by 2010, although
most of this capacity will not be integrated. We

16
Climate Change India 27 November 2008
abc
assume integrated PV capacity installation of
1000MW by 2017, in line with the GoI target.
In 2007, the Government of India released its
semiconductor policy with a special incentive
package for promoting investments in the
manufacture of semiconductors and photovoltaics.
The policy states that “the Central Government or
any of its agencies shall provide incentive of 20%
of the capital expenditure during the first 10 years
for the units in SEZ and 25% of the capital
expenditure for non-SEZ units. Non-SEZ units
shall be exempt from CVD.” This incentive can
be in the form of equity in the project, capital
subsidy in the form of investment grants and
interest subsidies.
Taken together, solar thermal and solar PV will
drive investment of INR200bn for the 10-year
estimate period.
Solar beneficiaries
Today, India is among the top 10 producers of
solar cells and modules in the world, and its solar-
tech industry continues to attract higher
investment. Listed players, such as Moser Baer,
XL Telecom & Energy and Webel Solar, derive
considerable proportions of their revenues from
the solar segment. Large industrial groups, such as
BHEL (Overweight (V), target price INR1,750)
and Reliance Industries (Overweight (V), TP
INR2,160), have also made moves into this arena.
Theme 3: Small hydropower
India is endowed with a rich hydropower
potential, ranking fifth in the world in terms of its
usable potential. The CEA estimates that the
economically exploitable potential of the river
systems in India stands at 148,700MW, while
capacity under operation is 28,000MW and an
additional 14,000MW is under various stages of
development. The CEA has also identified 56
sites for pumped storage schemes, with an
aggregate installed capacity of 94,000MW and
potential of 15,000MW generation from small
hydro projects (SHP) (up to 25MW). The
government’s accelerated hydro development plan
aims to build 50,000 MW of new hydro capacity
by 2025-2611.
A range of sustainability factors constrains the
expansion of large hydro projects, including the
displacement of local populations and loss of
biodiversity. Large hydro also has its own carbon
footprint, and the UNFCCC has excluded it from
the CDM. As a result, we focus our attention on
small hydro.
The installed capacity of SHP in India as of 31
March 2008 was 2181 MW (including 205 MW
added in FY 2007-08). We estimate a capacity
addition of 1,200MW during FY2008-12 and
1,400MW over the next five year plan, thereby
providing an investment opportunity of INR65bn
and INR75bn respectively, assuming a capex cost
of INR55m per MW. Our estimates take into
consideration the initiatives of states, such as
Uttaranchal and Himachal Pradesh, that have
significant hydro potential. The above-mentioned
investments will provide emission savings of
5.5m tonnes per annum by 2018 onwards.
Small hydro-power beneficiaries
Major beneficiaries are likely to include companies
such as BHEL (Overweight (V), target price
INR1,750), GMR, Gammon, HCC, Jaiprakash
Associates, L&T (Overweight (V), target price
INR1,250) and Maytas Infrastructure Ltd.
Theme 4: Biomass power
An estimated 540 million tonnes per year of biomass
is produced each year in India as residues from
agriculture, agro-industrial activities, forestry, and
plantations. The MNES estimates that 70-75% of
this waste is used as fodder, fuel for domestic
cooking and for other economic purposes, leaving
behind 120-150m tonnes of usable agro-industrial
11
Building a low carbon Indian economy, CII, Jan 2008

17
Climate Change India 27 November 2008
abc
and agricultural residues, which can be made
available for power generation. With the available
technologies, this surplus agricultural residue can be
used to generate more than 16,000MW of grid
quality power.
In addition, if all the 550 sugar mills in the
country switch over to modern techniques of co-
generation, over 5,000MW of power can be
produced. Thus, India can be considered to have
biomass power potential of around 21,000MW.
However, we believe it will not be possible to
fully utilise this potential, as the transportation of
biomass over large distances will make the
generating facilities uneconomical.
With current installed capacity at 1407 MW12
(including 223 MW added during the last
financial year), we assume a capacity addition of
1500 MW over the current five-year plan period
and an equivalent amount over the XIIth plan
period. Assuming a capital expenditure of
INR40m/MW, the targets provide an investment
opportunity of INR120bn over the 10-year period,
with corresponding savings of 14m tonnes of CO2
per annum from 2018 onwards.
Bio-power beneficiaries
Biomass power generation is an unorganised sector
with many small players across the country.
Companies like Gammon, Shriram EPC,
Suryachakra Power, along with Thermax and
Triveni Engineering and Industries, are set to benefit.
12 Annual report, Ministry of Power, 2007-08
Theme 5: Bio fuels
Bio-ethanol
Bio-ethanol in India is derived from sugar cane.
Currently, bio-ethanol blending with gasoline
stands at 5% in 9 States and 4 Union Territories.
The government’s target was expected to be
increased to 10% by October 2008, but this has
been deferred to October 2009.
We estimate that the shift from 5% blending to
10% across the country will require an additional
600m litres of ethanol, thus benefiting sugar
companies, as well as biofuel equipment
manufacturers and technology suppliers. In
anticipation of an increase in ethanol demand, the
sugar companies have increased their distillery
capacities to manufacture ethanol from molasses
and sugar cane in some cases.
We assume that the 5% mandate will continue
until FY2009-10 and increase to 10% FY2010-11.
However, from 2012-13 onwards, we assume a
2% increase y-o-y, reaching 20% by FY2017-18.
We estimate ethanol demand will increase from
700m litres in FY 2008-09 to 1,600m litres in
FY2010-11 and to 4,330m litres in FY 2017-18.
This six-fold increase over nine years will only be
possible with further development of second-
generation technologies. Assuming the supply
remains in line with mandate, we estimate the
total revenues of bio-fuel producers at INR19bn in
FY2008-09, increasing to INR112bn in FY2017-
2018. Over the XIth plan period, we project bio-
ethanol sales of INR140bn and aroundINR414bn
during the XIIth plan period. Our estimates
assume an ethanol price of INR26/litre.
Biodiesel
The National Mission on Bio-diesel has spurred
the development of bio-diesel plantations in 26
states. Beyond this, the target is to produce
sufficient biodiesel for 20% blending with vehicle
diesel by 2017.
Biomass Power Projects in India
0
1 0 0
2 0 0
3 0 0
4 0 0
5 0 0
u p to
M a r
2 0 0 2
2 0 0 2 -
0 3
2 0 0 3 -
0 4
2 0 0 4 -
0 5
2 0 05 -
0 6
2 0 0 6 -
0 7
2 0 0 7 -
0 8
Source: MNES

18
Climate Change India 27 November 2008
abc
According to the Ministry of Petroleum and
Natural Gas, diesel consumption in India stood at
42.8m ton in 2006-07, and we estimate that this
will increase to FY59m tonnes by FY2017.
According to India’s 2004 NATCOM, 60%13 of
diesel is used as vehicular fuel and the 20%
blending regulation will create demand for
8,300m litres of bio diesel by FY2017, thereby
avoiding 22.5m tonnes of CO2 emissions.
However we assume that the 20% blending target
by FY 2017 will be achieved gradually, with
diesel blending to start from the XIIth year plan
with 5% in FY2013 onwards. Assuming a bio-
diesel price of INR36/litre, we project a revenue
potential of INR912bn over the five-year period.
However, wider sustainability concerns place a
potential constraint on this growth trajectory in
terms of food security, land availability and
environmental impacts. The low crop yields of
non-food feedstocks, such as jatropha and
pongamia, are also posing a challenge in certain
states. We believe the success of second-
generation bio-fuel technologies is necessary to
achieve the 20% blending target for bio-fuels.
Biofuels beneficiaries
Likely beneficiaries of the programme include
Alfa Laval (India), Bajaj Hindusthan, Balrampur
Chini, Praj Industries and Shree Renuka Sugars
(Overweight (V), target price INR80).
Lower carbon power Coal forms the mainstay of India’s energy matrix
and is set to remain dominant for the foreseeable
future. The Government of India is driving a
process to introduce more efficient coal
generation, notably through Integrated
Gasification Combined Cycle (IGCC),
supercritical and ultra supercritical technologies,
all of which have important side-benefits from a
climate change perspective. It is also set to expand
13 National communication to UFCCC, Govt of India ,2004
nuclear power generation, another low carbon
electricity source, as well as promote fuel
switching to lower carbon natural gas.
Theme 6: Cleaner coal
Supercritical and ultra supercritical technologies
offer thermal efficiency of 40% and 45%,
respectively, compared to 35% offered by sub-
critical plants in India. For every 2% increase in
efficiency, there is a 5% reduction in CO2
emissions. The government has launched an
initiative to utilise this lower carbon technology
by developing coal-based ultra-mega power
projects (UMPP) in India, each with a capacity of
4,000MW or above and involving an estimated
investment of around INR160bn. Nine sites have
been identified by the CEA in nine states for the
proposed UMPPs. Work is in progress on three
sites and another site is likely to be allocated
soon. The share of supercritical power plants in
the XIth and XIIth five-year plans increases
dramatically, from 19% to 72%, showing the
GoI’s commitment to cleaner coal technologies.
Share of supercritical technology in GoI 5-year plans
8.2
31.86
35.8
12.64
0
10
20
30
40
50
XI Plan XII Plan
Supercritical Other
Source: HSBC, 11th 5 year plan
The CDM’s executive board has also approved
supercritical coal combustion plants for CERs in
2007. But this step is not without its critics. Some
argue that deploying supercritical technology is
not strictly additional according to the terms of
the CDM. Others oppose the use of CDM
incentives to expand fossil fuel production.

19
Climate Change India 27 November 2008
abc
Apart from supercritical technology, IGCC
technology can make coal-based power generation
at least 10% more efficient. In addition, for every
1% improvement in efficiency, there is a 2%
decrease in CO2 emissions. BHEL (Overweight
(V), target price INR1,750) has conducted R&D
to scale up this technology to commercial size and
has signed an agreement with Andhra Pradesh
Generation Company (APGENCO) to set up a
125MW IGCC plant at Vijayawada, Andhra
Pradesh, India.
One apparent gap in India’s cleaner coal
programmes is Carbon Capture and Storage. The
IEA projects that CCS will account for 19% of the
required global carbon abatement by 2050. The
G-8 has highlighted the importance of this
initiative, and legislative moves in Australia, the
EU and the USA will shortly define the
framework for a first wave of demonstration
projects. India remains cautious about the
applicability of CCS and is waiting for it to
become proven before considering applications
domestically. A recent World Bank study also
suggests that India has a very low underground
sequestration potential, at only 24 years of current
emissions, compared with 202 years for
Bangladesh and 1,678 for Vietnam.
Assuming a benchmark cost of INR45m per MW,
we estimate a capital investment of INR1700bn in
supercritical technology over FY 2008-17, with
INR350bn in FY 2007-12 and INR1350bn in FY
2013-18. These investments are likely to result in
annual emission savings of 28m tonne from 2017.
CO2 emissions versus plant efficiency
0
5
10
15
20
25
30
36 37 38 39 40 41 42 43 44 45 46 47 48 49 50Net Plant Efficiency (%)
CO
2 R
educ
tion
(%)
Subc
ritic
al P
lant
Ran
ge
Com
mer
cial
Sup
ercr
itica
l
Adv
ance
d Su
perc
ritic
al
Source: Electric Power Research Institute
Cleaner coal beneficiaries
We expect companies such as BHEL (Overweight
(V), target price INR1,750), and L&T
(Overweight (V), target price INR1,250) to be the
key beneficiaries.
Theme 7: Natural gas fuel switching
About 10% of the installed generating capacity in
India is natural-gas based. However, due to a
shortage of natural gas, the entire capacity does
not operate at the required levels, as illustrated in
the following chart.
Trends in natural gas availability to power sector (MMSCMD/BU)
0
20
40
60
80
2001-02 2002-03 2003-04 2004-05 2005-06 2006-07
0
10
20
30
40
Required 90% PLF Gas supplied
Shortfall Est Gen Loss
Source: India budget 2008
It is estimated that natural gas demand in India
stood at 179 metric million standard cubic metres
per day (MMSCMD) in 2007, with domestic
supply of 80MMSCMD and imports of
18MMSCMD, resulting in huge demand

20
Climate Change India 27 November 2008
abc
remaining unmet14. However, with new gas finds,
especially those in the Krishna Godavari basin,
we expect the supply situation to improve.
The demand-supply gap, however, is likely to
remain.
As emissions from natural gas-based generating
stations are 50% less than emissions from coal-
based generating stations, there is substantial
climate upside from fuel switching in India. The
NAPCC also specifies the government’s aim of
shifting to cleaner fuel options, and we feel that
this will give a considerable boost to gas-based
generation, contingent on the availability of gas.
Our forecasts are based on the Planning
Commission estimated capacity addition during
the XIth (4714MW) and XIIth five-year
(15,583MW) plans. Assuming capital expenditure
costs of INR35m/MW, we see an investment
opportunity of INR700bn over FY 2008-17, with
INR160bn in FY 2007-12 and INR540bn in FY
2013-18. These investments are likely to result in
emission savings of 53m tonnes p.a.
Natural gas beneficiaries
We think that likely beneficiaries will include
companies indirectly in the gas business, such as
ONGC (Overweight, target price INR1,470) and
14 http://www.investmentcommission.in/petroleum_&_natural_gas.htm
Reliance Industries (Overweight (V), target price
INR2,160), along with companies manufacturing
pipes and providing gas transport infrastructure,
such as GAIL, Welpsun Gujarat (Overweight (V),
target price INR160), Jindal Saw, and PSL ltd
(Overweight (V), target price INR170).
Theme 8: Nuclear Power
At the end of 2007, India had 4,120MW of
nuclear capacity under operation, contributing
2.5% of total power generation. According to the
CEA update of 31 August 2008, some 3380 MW
is under construction. The Planning Commission
estimates another 12800MW will be added during
the next five-year plan (see figure below).
Nuclear power capacity in India (MW)
2720 2720 2720 2770 3360 3900 4120
7500
20300
0
5000
10000
15000
20000
25000
2001 2002 2003 2004 2005 2006 2007 2012 2017
Source: Ministry of Power, India
Long a controversial energy option from a
security and environmental perspective, nuclear
power is recognised by the IPCC as “an effective
GHG mitigation option” (see Gathering
Momentum, September 2008, for further details).
This is particularly the case in India following the
recent agreement of the nuclear deal with the
USA and the rest of the Nuclear Suppliers Group.
This ends 34 years of nuclear isolation for India
and opens up the way for India to trade in civilian
nuclear technology, not just with the US, but also
with other countries, such as France and Russia.
France has already inked a pact with India, and
Russia too has expressed a keenness to cooperate
on the same.
Sector wise natural gas demand projections
0
50
100
150200
250
300
2007-08 2008-09 2009-10 2010-11 2011-12
0
50
100
150200
250
300
Pow er Fertilizer City Gas Industrial PetroChem OthersProj Supply
Source: Planning Commission

21
Climate Change India 27 November 2008
abc
The Government of India has ambitious plans to
supply 25% (310GW) of electricity from nuclear
power by 205015. Industry associations, such as
FICCI and Assocham, are also bullish. According to
FICCI, India has the potential to generate
60,000MW of nuclear power over the next 25 years,
requiring an investment of over USD100bn;
Assocham quotes a minimum of USD45bn of
investments in the next 15 years. However, serious
concerns remain around nuclear energy – primarily
safety, disposal of long-term radioactive waste and
nuclear proliferation. This is in addition to high
upfront capital costs and the long lead-time for
project completion. Furthermore, local protests
against the location of new nuclear facilities cannot
be discounted, particularly in light of recent
controversies regarding land allotment for Special
Economic Zones (SEZs) in India.
India has a reasonable level of uranium resources,
of 54,000 tonnes. India will have to import
uranium when its nuclear capacity touches 20000
MW. However India has reserves of 290,000
tonnes of thorium – about one quarter of the world
total – and these are intended to fuel India’s
nuclear power programme in the longer term16.
The nuclear generation programme in India is
entirely controlled by government. HSBC
estimates17 that new nuclear capacity of up to
1,900MW will be added during the current five-
year plan and the remaining 1,480MW (already
under construction) will be commissioned during
the XIIth plan.
Assuming a capex cost of INR75m/MW, we
estimate an investment potential of INR250bn
during the XIth plan period. For the XII plan
period, we have used capacity addition estimates
from the Ministry of Power (MOP) to project an
15 Evolving Indian Nuclear Programme, Atomic Energy Commission, July 2008 16 http://www.world-nuclear.org/info/inf53.html 17 Indian Power Utilities’ released 29 September 2008
investment potential of INR950bn. These
investments will provide emission savings of 96m
tonnes p.a. by 2017.
Nuclear beneficiaries
The state-owned NPCIL is the dominant player in
the nuclear sector. Listed beneficiaries are set to
include BHEL (OW (V), TP INR1,750) and L&T
(OW (V), TP INR1,250).
Energy efficiency India’s economy is relatively energy efficient by
international standards, with an intensity level of
0.17 Kg18 of oil equivalent (Kgoe) per unit of
GDP in USD purchasing power parity. This is
better than the global average, as well as China’s
and the USA’s, but lags behind countries such as
Denmark, Japan and Brazil.
Energy intensity comparison (Kgoe/USD GDP PPP)
0
0.05
0.1
0.15
0.2
0.25
DenmarkBrazil Japan India GermanyOECD WorldAverage
US China
Source: BEE
Market incentives for consumers and producers to
adopt efficient practices are, however, blunted in a
number of crucial areas, due to a range of energy
subsidies on oil products, electricity tariffs for
agricultural users and key industries, such as
fertilisers. Indeed, the NAPCC highlights that it is
“imperative that fertiliser subsidies be restructured
to eliminate such absence of incentive” for energy
efficiency investments. The political feasibility of
subsidy reform is, of course, another matter.
18 Energy Conservation and efficiency roadmap, BEE , June 2007

22
Climate Change India 27 November 2008
abc
The new National Mission for Enhanced Energy
Efficiency aims to deliver 10,000MW of power
savings by 2012. It focuses on energy efficiency
across industry, building and electricity
transmission. We believe energy efficiency offers
higher return per unit of investment vis a vis most
of the themes.
Theme 9: Industrial energy efficiency
The Energy Conservation Act, 2001 identifies
nine energy intensive industries – thermal power
stations, fertiliser, cement, iron and steel, chlor-
alkali, aluminium, railways, textile, and pulp and
paper – that consume 65% of total industrial
energy. According to a study by CII, Indian
industry has the potential to reduce its energy
consumption by 20%-30%19. Energy audits have
been made mandatory for these energy-intensive
industries. The potential for energy efficiency is
considerable, as illustrated in the following table
Energy saving potential in some energy intensive industries
Sector Energy cost as % of manufacturing cost
Energy Saving Potential
Caustic Chlor 60-65% 15% Cement 40-45% 15% Aluminium 35-45% 10% Foundry 20-25% 20% Paper 25-30% 25% Chemical 10-30% 15% Engineering 03-15% 10%
Source: CII, http://greenbusinesscentre.com/images/Photos/Ind12.pdf
The National Action Plan estimates that energy
efficiency programmes could cut CO2 emissions
from industrial fuel usage and electricity
consumption by 605m tonnes20 by 2031, a 16%
reduction compared to business as usual. The
national action plan proposes the following
initiatives to enhance industrial energy efficiency:
19 Building a low carbon Indian economy, CII, Jan 2008 20 National action plan on Climate change, Govt of India, June 2008
Mandating specific energy savings in energy
intensive industries and introducing a tradable
certificate system (‘white certificates’) to
enable companies with excess savings to trade
with companies falling below the target, or to
bank the savings for the next cycle.
Tax incentives, such as differential rates for
energy efficient appliances.
Energy efficiency financing platforms for
demand-side management initiatives, such as
ESCOs.
Assumptions: Assuming 25% of total energy
efficiency savings from industry (2,500MW) and
taking energy efficiency investment of INR10m
per MW, we estimate investments of cINR25bn in
the energy efficiency industry. On top of this,
these savings will avoid the need for capital
investment in new power generation capacity of
INR105bn, besides reducing CO2 emissions by
around 14m tonnes per year. Furthermore, we
assume that initiatives will continue in the XIIth
plan with a target to save 3,000MW, thereby
providing an investment opportunity of INR30bn
and an additional emission saving potential of
17m tonnes by 2017, taking the total saving to
31m tonnes p.a. by 2017.
Industrial efficiency beneficiaries
Key beneficiaries are set to include players such
as ABB India, Alfa Laval India, Crompton
Greaves, Triveni Engineering and Industries, and
Thermax.
Theme 10: Buildings efficiency
The annual energy consumption of India’s
commercial buildings has been rising at a
rapid rate.

23
Climate Change India 27 November 2008
abc
Annual electricity consumption in commercial sector in India (GWh)
0
50 0 0
10 0 0 0
150 0 0
2 0 0 0 0
2 50 0 0
3 0 0 0 0
3 50 0 0
4 0 0 0 0
19 9 0 19 9 2 19 9 4 19 9 6 19 9 8 2 0 0 0 2 0 0 2 2 0 0 4 2 0 0 6
Source: BEE
With the objective of controlling the rising trend of
electricity consumption in the commercial sector,
the government launched the Energy Conservation
Building Code (ECBC) in 2007, which sets the
minimum energy consumption standards for
commercial buildings, based on climatic zones.
The ECBC covers only new commercial buildings
with a connected load of 500kW or contract
demand of 600kVA and above.
According to the Ministry of Power, about 306
ECBC compliant buildings are being constructed
currently, which will help save c30-40% more
energy than conventional buildings. The
government plans to make the ECBC mandatory
in future by prescribing standards for:
Building envelopes (walls, roofs, windows)
Lighting (indoor and outdoor)
Heating ventilation and air conditioning
(HVAC) systems
Solar water heating and pumping
Electrical systems (power factor and
transformers)
The following chart compares energy
consumption across different segments in
commercial buildings.
Energy consumption in commercial sector in India (2006)
HV A C32 %
Lig ht ing6 0 %
Ot hers8 %
Source: BEE
The National Mission on Sustainable Habitat
incorporates goals for improving energy efficiency
in the residential and commercial sectors. A
cornerstone is the Bachat Lamp Yojna (BLY),
programme launched in 2007 with the objective of
replacing 400m incandescent bulbs with CFLs in
two years. The BLY will deploy CDM revenues to
subsidise the cost of CFLs at INR15 per lamp,
compared with the current average market price of
INR 80-100. The government estimates that
replacing the lamps will result in a 6,000-
10,000MW reduction in electricity demand, cutting
CO2 emissions by 24m tonnes21 per year.
India’s Bureau of Energy Efficiency (BEE)
launched the star based labelling programme in
2006 for several appliances, including refrigerators,
air conditioners, fluorescent tubular lamps and
distribution transformers. Other appliances,
including TVs and gas geysers, are next in line to
be labelled. According to CII, this program will
help to avoid 3000 MW22 of new capacity by 2012.
In 2007, the market size of the CFL industry was
INR11.6bn, based on a total demand for 165m
CFL units, of which, 65m23 were imported. The
BLY scheme will create additional average
demand of 400m in two years. Over FY2008-12,
we estimate sales of 1430m units, including the
21 Action plan on energy efficiency, BEE, 2007 22 Building a low carbon Indian economy, CII, Jan 2008 23 Electric Lamp & component manufacturers association of India website www.elcomaindia.com as viewed on 15thOct 2008

24
Climate Change India 27 November 2008
abc
400m units under the BLY scheme and another
1360m units in FY2013-17. Assuming a marginal
decline in CFL price y-o-y from the current level
of INR83/unit, we estimate an investment
potential of INR110bn over FY2008-12 and
INR90bn over FY 2013-17. We also estimate
emission savings of 114m tonnes p.a. from
FY2018 onwards.
Building efficiency beneficiaries
Companies with a high exposure to CFLs stand to
gain, including Asian Electronics, Havells India,
Phoenix Lamps, and Surya Roshni Ltd.
Theme 11: Power supply efficiency
The NAPCC calls for reductions in transmission
and distribution (T&D) losses from 16-19% to 6-
8% through the adoption of technologies such as
High Voltage Alternating Current (HVAC) and
High Voltage Direct Current (HVDC). We estimate
that bringing T&D losses to international levels
would enable India to save 70bn units of electricity
annually, thereby reducing 57m tonne of CO2
emissions.
The Government of India has set aside an
investment of INR500bn24 under the APDRP
scheme for system development, strengthening and
AT&C loss reduction during the XIth plan period.
However, the slow progress made in the last five-
year plan means that we assume the INR500bn will
be spent over a 10-year period. The Re-Structured
APDRP scheme during the XI Plan lays out
eligibility criteria for the states/utilities to get the
support under the program. One criterion requires
utilities with AT&C losses above 30% to reduce
these losses by 3% p.a; for utilities with losses
below 30% the reduction benchmark is 1.5% p.a.
On a conservative basis, we assume loss reduction
of 1.5% p.a. and assume that only 50% of the
savings will result in a reduction in electricity
consumption, with the remaining 50% resulting in
incremental revenues. Assuming generation growth
of 7% p.a. over FY 2008-17e, we estimate CO2
reduction potential of 58m tonne.
Power efficiency beneficiaries
A range of electrical equipment companies,
primarily manufacturers of transformers, cables
and switch gear, will benefit, including ABB
India, BHEL (Overweight (V), target price
INR1,750), Crompton Greaves, ICSA India Ltd
and KLG Systel.
24 http://economictimes.indiatimes.com/News/Economy/Finance/Finance_Ministry_approves_new_Rs_50000_cr_APDRP_scheme/rssarticleshow/2935220.cms

25
Climate Change India 27 November 2008
abc
The attractiveness of many of these climate change themes rests on the fact that there are multiple drivers behind their growth – not least,
wider policies to promote energy efficiency, security and diversification. Nonetheless, to mobilise the full quantum of investment we have
projected will require the finalisation and implementation of a number of key policy measures at the national and international levels.
National stepping stones In the immediate future, investors should analyse the initial reports of the eight national missions which are due by December 2008. In terms of the
climate investment themes that we have identified, investors need to monitor:
- Industrial Energy Efficiency and the progress
that the mission has made in terms of designing a tradable certificate scheme.
- Building Efficiency and the latest indications in terms of the timeline for the shift from voluntary
ECBC norms into mandatory standards.
More broadly, two further policy milestones are worth watching
- Renewable energy: We expect CERC to finalise
new regulations for new Dynamic Renewable
Portfolio standards before March 2009.
- Biofuels: We expect the 10% bio-ethanol blending target to be introduced in October 2009.
International stepping stones A number of India’s climate change investment themes are dependent on global climate mechanisms, notably the CFL replacement
programme funded by the CDM, and the roll-out of solar thermal technology, where the NAPCC highlights the importance of technology transfer.
In December 2008, global negotiators will meet in Poznan to take stock of progress to date on agreeing a new global climate change treaty to
succeed the Kyoto Protocol. Critical factors for investors to watch include:
- Finance: In its submission to Poznan, the
Government of India has called for 0.5% of developed world GDP to be deployed to finance a technology acquisition and transfer fund, as well
as a venture capital fund for emerging technologies.
- Carbon markets: The future of India’s current
revenues via the CDM is dependent on a successful conclusion to the Copenhagen process. The NAPCC highlighted that the CDM had not
yet led to much technology transfer. Investors should look both for signs of progress that industrialised nations are willing to take on
ambitious carbon caps, along with indications that the CDM will be reformed to enable both greater volumes, as well as greater credibility.
Outlook
The government’s proposals now need to be implemented The National Missions are scheduled to report by December 2008 The impending general election by May 2009 and the scheduled completion of global climate talks in December 2009 are the main risks to our growth scenario

26
Climate Change India 27 November 2008
abc
Company section

27
Climate Change India 27 November 2008
abc
Snapshot
BHEL has been a key supplier of power equipment
to the utilities, with a 65% market share of the total
installed capacity in India. BHEL’s presence in the
manufacturing of supercritical thermal generating
boilers and turbines (cleaner coal) and gas turbines
makes it a beneficiary of clean climate initiatives.
Foray into supercritical: BHEL has entered into
a collaboration with Siemens and Alstom for
developing 800MW supercritical boilers and
turbines. It has already received orders from
NTPC and APGENCO to set up supercritical
power projects.
Gas turbine manufacturing: BHEL manufactures
advanced gas turbines, with a 2% global market
share. In 1H2008, it had an 85% (vs. 18% in 1H07)
market share in India.
Development of IGCC technology: BHEL also
develops Integrated Gasification Combined Cycle
(IGCC) technology. It has set up Asia's first 6.2 MW
IGCC power plant with an indigenously designed
pressurised fluidised bed gasifier. The company has
also signed an MoU with APGENCO for setting up
a 125 MW IGCC.
Solar Photovoltaic: It has commissioned six stand-
alone Solar Photovoltaic power plants of 3x110
KWp and 3x55 KWp capacities in West Bengal.
Outlook: We think the outlook for BHEL remains
strong due to 1) a strong order backlog of INR1trn, c4.8x trailing 12-month revenue; 2) strong new order pipeline; 3) risk to order cancellation not significant
due to orders from large utilities and customer advances received against these orders; 4) favourable FX rate has reduced overseas competition; 5)
capacity expansion to cater to growth; 6) cost pressure to reduce in FY10e, given lower commodity prices, as well as no wage provision; 7)
new business segments, such as gas turbines, to add to growth; 8) JV with entities to explore opportunities in nuclear power plants, super critical
thermal projects and locomotive business.
Valuation & risks
We have an Overweight (V) rating on the stock, with
a target price of INR1,750 based on MACC
valuation methodology. BHEL is currently trading at
a discount to its global sector median MACC value,
of 16.2%. We expect BHEL to trade at a 12.2%-
16.2% MACC range, a 0-400bps premium to the
16.2% sector median MACC, and at a CROIC range
of 9-10%, given its positive outlook, higher margin,
and higher RoE. We have used the mid-point of this
valuation range to derive our target price, of
INR1750. Risks to our rating include rising interest
rates, execution risks, a slowdown in power reforms,
and shortages of manpower and raw materials.
BHEL
Successful in supercritical segment with technology tie-ups with
Siemens and Alstom
Increasing share in advanced gas turbines with 2% global market
share
Rating Overweight (V); target price INR1,750
Sumeet Agrawal* Analyst HSBC Securities and Capital Markets (India) Private Limited
+91-22-2268 1243 [email protected]
Murtuza Zakiuddin* Associate Bangalore
*Employed by a non-US affiliate of HSBC Securities (USA) Inc, and is not registered/ qualified pursuant to NYSE and/ or NASD regulations

28
Climate Change India 27 November 2008
abc
Financial statements
Year to 03/2007a 03/2008e 03/2009e 03/2010e
Profit & loss summary (INRm)
Revenue 174,203 197,269 275,705 354,159EBITDA 37,770 45,197 57,257 74,707Depreciation & amortisation -2,730 -2,972 -3,324 -4,284Operating profit/EBIT 35,040 42,225 53,933 70,423Net interest 4,035 9,871 8,681 12,115PBT 37,359 44,304 62,615 82,538HSBC PBT 37,359 44,304 62,615 82,538Taxation -13,214 -15,711 -20,976 -27,650Net profit 24,146 28,594 41,639 54,888HSBC net profit 25,861 36,385 41,639 54,888
Cash flow summary (INRm)
Cash flow from operations 37,291 44,939 56,654 26,483Capex -3,974 -6,452 -8,670 -15,000Cash flow from investment -3,974 -6,452 -8,680 -15,010Dividends -6,925 -8,734 -12,600 -14,318Change in net debt -21,427 -25,724 -35,374 2,845FCF equity 35,032 46,278 47,984 11,483
Balance sheet summary (INRm)
Fixed assets 12,913 16,393 21,739 32,455Current assets 210,618 277,047 360,410 424,898Cash & others 58,077 83,860 118,482 115,637Total assets 232,965 306,902 395,621 470,835Operating liabilities 144,189 198,208 258,640 293,285Gross debt 893 952 200 200Net debt -57,184 -82,908 -118,282 -115,437Shareholders funds 87,883 107,742 136,781 177,350Invested capital 21,265 11,372 5,026 48,431
Ratio, growth and per share analysis
Year to 03/2007a 03/2008e 03/2009e 03/2010e
Y-o-y % change
Revenue 29.0 13.2 39.8 28.5EBITDA 31.7 19.7 26.7 30.5Operating profit 33.6 20.5 27.7 30.6PBT 45.7 18.6 41.3 31.8HSBC EPS 32.1 40.7 14.4 31.8
Ratios (%)
Revenue/IC (x) 6.7 12.1 33.6 13.2ROIC 87.6 167.0 437.4 175.2ROE 32.1 37.2 34.1 34.9ROA 11.8 10.7 11.9 12.7EBITDA margin 21.7 22.9 20.8 21.1Operating profit margin 20.1 21.4 19.6 19.9EBITDA/net interest (x) Net debt/equity -65.1 -77.0 -86.5 -65.1Net debt/EBITDA (x) -1.5 -1.8 -2.1 -1.5CF from operations/net debt
Per share data (INR)
EPS Rep (fully diluted) 49.32 58.41 85.06 112.13HSBC EPS (fully diluted) 52.83 74.33 85.06 112.13DPS 12.25 15.25 22.00 25.00Book value 179.53 220.10 279.42 362.29
Valuation data
Year to 03/2007a 03/2008e 03/2009e 03/2010e
EV/sales 3.3 2.8 1.9 1.5EV/EBITDA 15.4 12.3 9.1 7.0EV/IC 27.3 48.8 103.2 10.8PE* 24.6 17.5 15.3 11.6P/Book value 7.3 5.9 4.7 3.6FCF yield (%) 5.5 7.3 7.5 1.8Dividend yield (%) 0.9 1.2 1.7 1.9
Note: * = Based on HSBC EPS (fully diluted)
Issuer information
Share price (INR) 1,302 Target price (INR) 1,750 Potent'l tot rtn (%) 34.4
Reuters (Equity) BHEL.BO Bloomberg (Equity) BHEL INMarket cap (USDm) 12,722 Market cap (INRm) 637,355Free float (%) 32 Enterprise value (INRm) 554,364Country India Sector ELECTRICAL EQUIPMENTAnalyst Sumeet Agrawal Contact 91 22 2268 1243
Price relative
419
919
1419
1919
2419
2919
2006 2007 2008 2009
419
919
1419
1919
2419
2919
BHEL Rel to BOMBAY SE SENSITIVE INDEX
Source: HSBC Note: price at close of 24 Nov 2008
Financials & valuation: BHEL Overweight (V)

29
Climate Change India 27 November 2008
abc
Snapshot
L&T is a diversified engineering and construction
company with presence in various sectors:
infrastructure (34%), process (17%), oil&gas (20%),
and power (20%). L&T is diversifying into sectors
such as power equipment manufacturing, railways,
hydrocarbons, and shipbuilding to offset any near-
term challenges in its existing business. The
company has also increased its focus on international
business (20% revenue in Q209) to offset any
challenges in the domestic market. L&T’s move into
the manufacturing of supercritical thermal
generating boilers and its presence in the nuclear
generation equipment market makes it a beneficiary
of clean climate investments.
Supercritical segment: L&T is building
supercritical power equipment, manufacturing a
plant in Hazira, (50:50 joint venture with
Mitsubishi). The plant is expected to be operational
in FY2011 and will have an initial capacity of
c3.5GW. The company has already bagged a
INR15.6bn order from APGenco for super critical
turbines. The order inflow from the power business
has increased from 10% in FY06 to 26% in 1H09,
mainly on account of the new venture.
Nuclear: L&T manufactures reactor vessels for pressurised heavy water reactors and fast breeder reactors and critical equipment & systems for heavy
water plants, fuel re-processing plants and plasma reactors. It also offers installation and construction services for new nuclear power plants. Though the
revenue from this segment is not significant, the existing experience working with NPCL will allow the company to enter into technological tie-ups in the
future nuclear power programme in India.
L&T’s strong balance sheet and ability to raise funds
overseas are key strengths.
Valuation & risks
We are Overweight (V) on the stock, with a target
price of INR1,250, based on MACC methodology.
We expect L&T to trade at a MACC of 12-14%, a
200-400bps premium to the 16.2% sector median
MACC, and at a CROIC of 8.4-9.5%. We have used
the mid-point of this valuation range to derive the
core value of L&T, at INR987. Adding INR263 per
share as the value of its other subsidiaries, we derive
a target price of INR1,250. At our target price,
L&T’s core business would trade at 15.8x FY10e
earnings. Execution delay is a key risk; any rise in
interest rates will also impact profitability.
Larsen & Toubro
Key beneficiary of infrastructure spending of USD570bn in India
during the XI plan period (FY08-13)
Vertical diversification into power, railways and shipbuilding, along
with international business, to mitigate any near-term challenges
Strong balance sheet and ability to manage interest expense
make it preferred choice; OW (V) rating, target price INR1,250
Sumeet Agrawal* Analyst HSBC Securities and Capital Markets (India) Private Limited
+91-22-2268 1243 [email protected]
Murtuza Zakiuddin* Associate Bangalore
*Employed by a non-US affiliate of HSBC Securities (USA) Inc, and is not registered/ qualified pursuant to NYSE and/ or NASD regulations

30
Climate Change India 27 November 2008
abc
Financials & valuation: Larsen & Toubro Overweight (V) Financial statements
Year to 03/2007a 03/2008e 03/2009e 03/2010e
Profit & loss summary (INRm)
Revenue 174,996 247,865 323,625 426,577EBITDA 16,673 27,464 36,360 49,224Depreciation & amortisation -1,700 -2,116 -2,857 -3,369Operating profit/EBIT 14,973 25,348 33,503 45,855Net interest -339 -382 -593 -595PBT 18,673 29,769 38,672 52,176HSBC PBT 18,673 29,769 38,672 52,176Taxation -6,022 -9,821 -11,602 -15,653Net profit 12,651 19,949 27,071 36,523HSBC net profit 12,651 19,949 27,071 36,523
Cash flow summary (INRm)
Cash flow from operations 19,762 20,017 23,581 35,010Capex -7,915 -16,344 -4,707 -7,500Cash flow from investment -15,583 -26,110 -17,207 -20,000Dividends -4,216 -5,716 -5,701 -7,692Change in net debt -2,818 -12,055 122 -7,319FCF equity 8,178 -1,129 13,111 20,594
Balance sheet summary (INRm)
Fixed assets 21,968 36,195 38,045 42,177Current assets 135,161 207,897 233,717 294,552Cash & others 27,259 54,376 52,254 58,323Total assets 171,854 268,584 308,754 386,220Operating liabilities 93,267 136,838 158,434 208,318Gross debt 20,778 35,840 33,840 32,590Net debt -6,481 -18,536 -18,414 -25,733Shareholders funds 57,405 95,293 115,866 144,699Invested capital 36,603 52,878 61,075 70,088
Ratio, growth and per share analysis
Year to 03/2007a 03/2008e 03/2009e 03/2010e
Y-o-y % change
Revenue 18.6 41.6 30.6 31.8EBITDA 57.4 64.7 32.4 35.4Operating profit 58.7 69.3 32.2 36.9PBT 60.8 59.4 29.9 34.9HSBC EPS 55.4 52.8 35.9 34.8
Ratios (%)
Revenue/IC (x) 4.8 5.5 5.7 6.5ROIC 27.9 38.0 41.2 48.9ROE 24.5 26.1 25.6 28.0ROA 8.8 9.4 10.2 11.2EBITDA margin 9.5 11.1 11.2 11.5Operating profit margin 8.6 10.2 10.4 10.7EBITDA/net interest (x) 49.1 71.9 61.3 82.8Net debt/equity -11.3 -19.5 -15.9 -17.8Net debt/EBITDA (x) -0.4 -0.7 -0.5 -0.5CF from operations/net debt
Per share data (INR)
EPS Rep (fully diluted) 22.67 34.66 46.34 62.54HSBC EPS (fully diluted) 22.33 34.12 46.38 62.51DPS 6.60 8.61 8.34 11.26Book value 101.33 162.98 198.50 247.64
Valuation data
Year to 03/2007a 03/2008e 03/2009e 03/2010e
EV/sales 2.5 1.8 1.3 0.9EV/EBITDA 26.6 15.9 11.6 8.2EV/IC 12.1 8.3 6.9 5.7PE* 34.0 22.2 16.4 12.1P/Book value 7.5 4.7 3.8 3.1FCF yield (%) 1.8 -0.2 3.0 4.8Dividend yield (%) 0.9 1.1 1.1 1.5
Note: * = Based on HSBC EPS (fully diluted)
Issuer information
Share price (INR) 758.70 Target price (INR) 1250.00
Potent'l tot rtn (%) 64.8
Reuters (Equity) LART.BO Bloomberg (Equity) LT INMarket cap (USDm) 8,864 Market cap (INRm) 444,065Free float (%) 96 Enterprise value (INRm) 436878Country India Sector Construction & EngineeringAnalyst Sumeet Agrawal Contact 91 22 2268 1243
Price relative
220
720
1220
1720
2220
2720
2006 2007 2008 2009
220
720
1220
1720
2220
2720
Larsen & Toubro Rel to BOMBAY SE SENSITIVE INDEX
Source: HSBC Note: price at close of 24 Nov 2008

31
Climate Change India 27 November 2008
abc
Snapshot
ONGC could be the biggest beneficiary of any
deregulation in natural gas prices in India. The
case for deregulation could get further support
with the start-up of 80MMcm/d production from
‘KG-D6 block’ gas fields. This is likely to
significantly increase the proportion of gas being
sold at market determined prices, resulting in the
acceptance of higher prices by various classes of
consumers and increasing disparities across
different producers.
ONGC had total domestic proven and probable
reserves of 6.4bn bbls as of end FY2007, with
natural gas forming 43% of the total. Currently,
ONGC is selling the bulk of its domestic gas
production at about USD2/MMBtu, much lower
than prevailing prices realised by private
producers. To highlight the potential benefit of
deregulation, each USD1/MMBtu move in our
Indian gas price assumption changes our target
price by around 6%, or INR88/share.
Valuation and risks
Our valuation of ONGC’s core reserves is based
on a DCF valuation of its proven and probable oil
and gas reserves and development upside from
ONGC’s KG basin assets and the Rajasthan
fields, where it owns a 30% stake. The DCF
analysis is based on a discount rate of 13.5%,
assuming the oil and gas reserves are depleted
over 20-25 years.
We have included development upside from
ONGC’s KG basin assets and the Rajasthan
fields, where it owns 30%.
Valuation of ONGC
Valuation (INR/share)
Core reserves Proven reserves 1,097 Probable reserves 152 Development upside KG gas 61 Contingent resources 6 Investments 61 Net cash 91 1,470
Source: HSBC
The risks to our rating include materially lower
long-term oil and gas prices than our assumptions.
Company-specific risks include an increase in the
share of subsidy-sharing mechanism, royalty and
cess (tax) charges. A poor exploration programme
or underperforming field production could also be
a risk to our rating.
ONGC
The bulk of ONGC’s domestic gas production is priced at about
USD2/MMBtu
It is potentially a major beneficiary of any deregulation of Indian
gas prices
Rating Overweight; target price INR1,470
Kirtan Mehta* Analyst HSBC Bank plc +91 80 3001 3779 [email protected]
Dayanand Mittal* Associate Bangalore
*Employed by a non-US affiliate of HSBC Securities (USA) Inc, and is not registered/ qualified pursuant to NYSE and/ or NASD regulations

32
Climate Change India 27 November 2008
abc
Financial statements
Year to 03/2007a 03/2008e 03/2009e 03/2010e
Profit & loss summary (INRm)
Revenue 822,615 967,822 1,418,535 1,145,980EBITDA 346,893 404,660 513,550 414,015Depreciation & amortisation -119,678 -138,878 -118,234 -123,563Operating profit/EBIT 227,215 265,782 395,315 290,452Net interest 1,058 -2,153 -3,997 -4,034PBT 277,472 309,211 421,768 318,368HSBC PBT 277,472 309,211 421,768 318,368Taxation -98,454 -106,999 -150,437 -113,753Net profit 177,594 198,703 267,258 201,454HSBC net profit 177,594 198,703 267,258 201,454
Cash flow summary (INRm)
Cash flow from operations 373,871 337,227 344,529 366,808Capex -199,026 -192,382 -326,187 -163,400Cash flow from investment -212,793 -196,532 -287,362 -157,880Dividends 66,305 68,444 57,749 59,888Change in net debt -111,268 -42,432 84,190 -125,734FCF equity 117,642 98,334 -15,108 171,458
Balance sheet summary (INRm)
Fixed assets 647,399 700,903 908,855 948,692Current assets 388,405 475,345 565,809 617,730Cash & others 150,653 186,525 213,179 344,913Total assets 1,102,252 1,246,846 1,506,439 1,592,676Operating liabilities 182,956 235,126 226,454 185,269Gross debt 16,005 9,445 120,288 126,288Net debt -134,648 -177,080 -92,891 -218,625Shareholders funds 667,136 780,866 912,836 1,026,922Invested capital 702,194 754,596 1,035,032 1,036,239
Ratio, growth and per share analysis
Year to 03/2007a 03/2008e 03/2009e 03/2010e
Y-o-y % change
Revenue 5.7 17.7 46.6 -19.2EBITDA 13.4 16.7 26.9 -19.4Operating profit 6.1 17.0 48.7 -26.5PBT 15.7 11.4 36.4 -24.5HSBC EPS -7.7 -6.8 34.5 -24.6
Ratios (%)
Revenue/IC (x) 1.2 1.3 1.6 1.1ROIC 21.0 23.9 28.4 18.0ROE 28.8 27.4 31.6 20.8ROA 17.6 17.3 19.9 13.4EBITDA margin 42.2 41.8 36.2 36.1Operating profit margin 27.6 27.5 27.9 25.3EBITDA/net interest (x) 188.0 128.5 102.6Net debt/equity -20.2 -22.7 -10.2 -21.3Net debt/EBITDA (x) -0.4 -0.4 -0.2 -0.5CF from operations/net debt
Per share data (INR)
EPS Rep (fully diluted) 124.55 139.35 187.43 141.28HSBC EPS (fully diluted) 99.64 92.90 124.95 94.19DPS -37.20 -32.00 -27.00 -28.00Book value 374.29 365.08 426.78 480.12
Valuation data
Year to 03/2007a 03/2008e 03/2009e 03/2010e
EV/sales 1.5 1.2 0.9 1.1EV/EBITDA 3.6 3.0 2.6 2.9EV/IC 1.8 1.6 1.3 1.2PE* 6.8 7.3 5.4 7.2P/Book value 1.8 1.9 1.6 1.4FCF yield (%) 8.5 7.1 -1.1 12.0Dividend yield (%) -5.5 -4.7 -4.0 -4.1
Note: * = Based on HSBC EPS (fully diluted)
Issuer information
Share price (INR) 678.50 Target price (INR) 1,470 Potent'l tot rtn (%) 116.7
Reuters (Equity) ONGC.BO Bloomberg (Equity) ONGC INMarket cap (USDm) 28,967 Market cap (INRm) 1,451,225Free float (%) 26 Enterprise value (INRm) 1203546Country India Sector OIL & GASAnalyst Kirtan Mehta Contact +91 80 30013779
Price relative
377
577
777
977
1177
1377
2006 2007 2008 2009
377
577
777
977
1177
1377
Oil & Natural Gas Corp. Rel to BOMBAY SE SENSITIVE INDEX
Source: HSBC Note: price at close of 24 Nov 2008
Financials & valuation: Oil & Natural Gas Corp. Overweight

33
Climate Change India 27 November 2008
abc
Snapshot
PSL Limited is the largest Indian spiral pipe
company in terms of capacity, and manufactures
and supplies spiral weld pipes for oil, gas and
water transmission.
The company has a total capacity of 1,175,000
tonnes for producing line pipes and plans to set up
a new 350,000 tonnes manufacturing facility in
the US.
We believe that the company would benefit from
an increase in natural gas demand (due to fuel
switch) since this would increase the requirement
for infrastructure for the transportation and
distribution of gas.
Gas transportation infrastructure: PSL has an
order backlog of INR60bn, which includes orders
from GAIL and Florida Gas Transmission
Company for laying the infrastructure for gas
distribution.
It has earlier successfully executed pipeline
projects for BPCL, IOCL and Reliance Industries
Ltd in the domestic market.
Valuation & risks
We value PSL Ltd using a PE multiple based
valuation methodology.
Our target PE multiple for PSL Ltd is 5x and
based on our September 09 EPS estimate, we
arrive at fair value of INR170.
We have an Overweight (V) rating based on the
fact that that the company has a strong order book
and we expect the execution to improve in the
second half of the year, with the company’s US
production facility coming on stream.
Risks
The key risks to our rating are: 1) slower
execution of order backlog and depletion of order
backlog, 2) lower than expected EBITDA margin,
and 3) equity dilution, leading to lower than
expected EPS.
PSL Ltd
PSL manufactures and supplies line pipes for oil and gas
companies
INR60bn order backlog, with orders from GAIL and Florida Gas
Transmission Company
We have an Overweight (V) rating with a target price of INR170
Sandeep Somani* Analyst HSBC Securities and Capital Markets (India) Private Limited
+91-22-2268 1245 [email protected]
Shipra Pandey* Associate Bangalore
*Employed by a non-US affiliate of HSBC Securities (USA) Inc, and is not registered/ qualified pursuant to NYSE and/ or NASD regulations

34
Climate Change India 27 November 2008
abc
Financials & valuation: PSL Ltd Overweight (V) Financial statements
Year to 03/2008a 03/2009e 03/2010e 03/2011e
Profit & loss summary (INRm)
Revenue 20,734 37,960 42,983 43,896EBITDA 1,923 3,332 4,016 4,224Depreciation & amortisation -539 -586 -607 -662Operating profit/EBIT 1,383 2,745 3,409 3,562Net interest -579 -958 -1,103 -1,255PBT 1,253 1,937 2,456 2,457HSBC PBT 1,253 1,937 2,456 2,457Taxation -409 -639 -810 -811Net profit 844 1,298 1,646 1,646HSBC net profit 844 1,298 1,646 1,646
Cash flow summary (INRm)
Cash flow from operations 30 -2,396 1,476 4,164Capex -1,799 -250 -250 -750Cash flow from investment -1,799 -250 -250 -750Dividends -121 -236 -260 -260Change in net debt -123 2,882 -967 -3,155FCF equity -806 -2,796 1,076 3,264
Balance sheet summary (INRm)
Fixed assets 6,391 6,055 5,698 5,786Current assets 16,971 25,155 28,834 30,578Cash & others 4,005 1,623 3,090 6,745Total assets 23,572 31,420 34,741 36,574Operating liabilities 7,686 13,860 15,272 15,218Gross debt 9,317 9,817 10,317 10,817Net debt 5,312 8,193 7,227 4,072Shareholders funds 5,697 6,759 8,145 9,531Invested capital 11,671 15,726 16,169 14,401
Ratio, growth and per share analysis
Year to 03/2008a 03/2009e 03/2010e 03/2011e
Y-o-y % change
Revenue 43.7 83.1 13.2 2.1EBITDA 27.0 73.3 20.5 5.2Operating profit 28.8 98.5 24.2 4.5PBT 37.1 54.6 26.8 0.1HSBC EPS 28.2 53.8 26.8 0.1
Ratios (%)
Revenue/IC (x) 2.0 2.8 2.7 2.9ROIC 8.8 13.4 14.3 15.6ROE 18.3 20.8 22.1 18.6ROA 6.2 7.1 7.2 7.0EBITDA margin 9.3 8.8 9.3 9.6Operating profit margin 6.7 7.2 7.9 8.1EBITDA/net interest (x) 3.3 3.5 3.6 3.4Net debt/equity 90.4 118.1 86.8 41.9Net debt/EBITDA (x) 2.8 2.5 1.8 1.0CF from operations/net debt 0.6 20.4 102.3
Per share data (INR)
EPS Rep (fully diluted) 20.39 31.35 39.75 39.77HSBC EPS (fully diluted) 20.39 31.35 39.75 39.77DPS 3.78 5.00 5.50 5.50Book value 177.46 163.25 196.73 230.23
Valuation data
Year to 03/2008a 03/2009e 03/2010e 03/2011e
EV/sales 0.4 0.3 0.3 0.2EV/EBITDA 4.7 3.6 2.7 1.9EV/IC 0.8 0.8 0.7 0.5PE* 4.4 2.9 2.3 2.3P/Book value 0.5 0.5 0.5 0.4FCF yield (%) -21.3 -74.0 28.5 86.4Dividend yield (%) 4.2 5.6 6.1 6.1
Note: * = Based on HSBC EPS (fully diluted)
Issuer information
Share price (INR) 89.50 Target price (INR) 170 Potent'l tot rtn (%) 89.9
Reuters (Equity) PSLH.BO Bloomberg (Equity) PSLL INMarket cap (USDm) 76 Market cap (INRm) 3,823Free float (%) 40 Enterprise value (INRm) 11973Country India Sector ENERGY EQUIPMENTAnalyst Sandeep Somani Contact +9122 2268 1245
Price relative
32
132
232
332
432
532
2006 2007 2008 2009
32
132
232
332
432
532
PSL Ltd Rel to BOMBAY SE SENSITIVE INDEX
Source: HSBC Note: price at close of 24 Nov 2008

35
Climate Change India 27 November 2008
abc
Snapshot
RIL is poised to become the largest domestic
producer of natural gas in India with the start-up
of natural gas production from its D6 field on the
eastern coast of India by Q4 FY2009. As per
guidance, Reliance plans to start gas production in
the KG D6 gas project over 2H FY 2009 and to
ramp-up to peak production of 80MMcm/d within
six quarters. Currently the natural gas produced
from this field is set to be sold at USD4.2/MMBtu
(USD25/bbloe), following a decision by the
Indian government. However, a court ruling is
pending. Further, RIL’s exploration portfolio
provides it an opportunity to benefit from any
growth in gas demand in India, and given the
increasing emphasis on NG based generation
facilities, we see RIL as a beneficiary of clean
energy initiatives.
Valuation and risks
Our target price is based on a sum-of-the-parts
valuation of RIL’s core business. Our valuation
per share for RIL is based on its current
outstanding shares, less treasury shares. To
account for the recent de-rating of the market, we
change our valuation methodology for the
petrochemical and refining business to a
combination of DCF-based valuation (50%) and
relative valuation (50%) based on a EV/EBITDA
multiple of 5.5x. Our DCF valuation for parts of
the business is based on a WACC of 11.2%. We
value RIL’s investments in RPL at our target price
of INR165/share
RIL: Sum-of-the-parts valuation
Business Method Valuation (INR/share)
Petrochem and refining Combination of DCF and relative multiple
1030
E&P 692 PMT block DCF 68 D6 MA crude DCF 57 D6 MA gas At D6 gas valuation 36 D6 gas DCF 403 CBM At USD3.0/boe 40 NEC At USD2.5/boe 87 Retail DCF 56 Investments in RPL, RILL Target price/ market value 382 Total 2160
Source: HSBC
The risks to our rating include materially lower
long-term oil and gas prices; refining and
petrochemical margins; and US dollar exchange
rates than that in our assumptions. Company-
specific risks include the recoverability of
reserves, project ramp-up of oil and gas
production and refinery production, and litigation
over gas pricing (KG D6) in the Mumbai high
court.
Reliance Industries (RIL)
RIL is likely to emerge as one of the largest domestic producers of
gas in India
RIL’s significantly large exploration portfolio provides it an
opportunity to benefit from growth in demand for natural gas
Rating Overweight; target price INR2,160
Kirtan Mehta* Analyst HSBC Bank plc +91 80 3001 3779 [email protected]
Dayanand Mittal* Associate Bangalore
*Employed by a non-US affiliate of HSBC Securities (USA) Inc, and is not registered/ qualified pursuant to NYSE and/ or NASD regulations
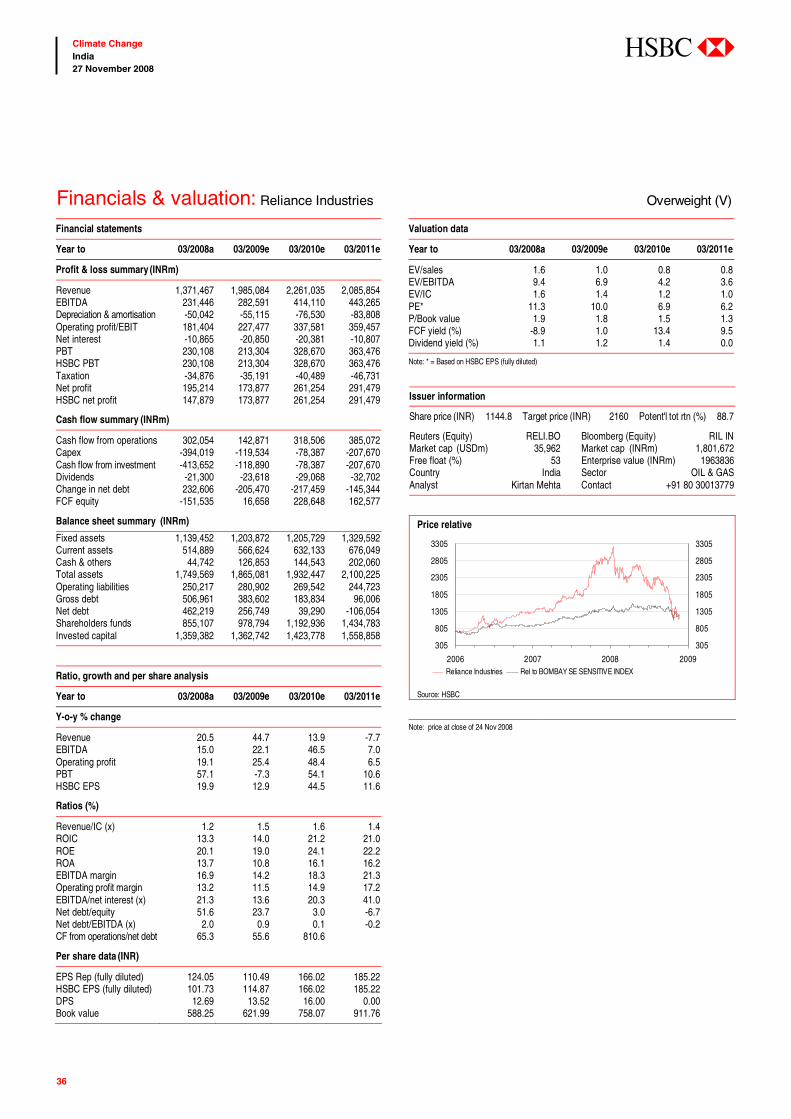
36
Climate Change India 27 November 2008
abc
Financial statements
Year to 03/2008a 03/2009e 03/2010e 03/2011e
Profit & loss summary (INRm)
Revenue 1,371,467 1,985,084 2,261,035 2,085,854EBITDA 231,446 282,591 414,110 443,265Depreciation & amortisation -50,042 -55,115 -76,530 -83,808Operating profit/EBIT 181,404 227,477 337,581 359,457Net interest -10,865 -20,850 -20,381 -10,807PBT 230,108 213,304 328,670 363,476HSBC PBT 230,108 213,304 328,670 363,476Taxation -34,876 -35,191 -40,489 -46,731Net profit 195,214 173,877 261,254 291,479HSBC net profit 147,879 173,877 261,254 291,479
Cash flow summary (INRm)
Cash flow from operations 302,054 142,871 318,506 385,072Capex -394,019 -119,534 -78,387 -207,670Cash flow from investment -413,652 -118,890 -78,387 -207,670Dividends -21,300 -23,618 -29,068 -32,702Change in net debt 232,606 -205,470 -217,459 -145,344FCF equity -151,535 16,658 228,648 162,577
Balance sheet summary (INRm)
Fixed assets 1,139,452 1,203,872 1,205,729 1,329,592Current assets 514,889 566,624 632,133 676,049Cash & others 44,742 126,853 144,543 202,060Total assets 1,749,569 1,865,081 1,932,447 2,100,225Operating liabilities 250,217 280,902 269,542 244,723Gross debt 506,961 383,602 183,834 96,006Net debt 462,219 256,749 39,290 -106,054Shareholders funds 855,107 978,794 1,192,936 1,434,783Invested capital 1,359,382 1,362,742 1,423,778 1,558,858
Ratio, growth and per share analysis
Year to 03/2008a 03/2009e 03/2010e 03/2011e
Y-o-y % change
Revenue 20.5 44.7 13.9 -7.7EBITDA 15.0 22.1 46.5 7.0Operating profit 19.1 25.4 48.4 6.5PBT 57.1 -7.3 54.1 10.6HSBC EPS 19.9 12.9 44.5 11.6
Ratios (%)
Revenue/IC (x) 1.2 1.5 1.6 1.4ROIC 13.3 14.0 21.2 21.0ROE 20.1 19.0 24.1 22.2ROA 13.7 10.8 16.1 16.2EBITDA margin 16.9 14.2 18.3 21.3Operating profit margin 13.2 11.5 14.9 17.2EBITDA/net interest (x) 21.3 13.6 20.3 41.0Net debt/equity 51.6 23.7 3.0 -6.7Net debt/EBITDA (x) 2.0 0.9 0.1 -0.2CF from operations/net debt 65.3 55.6 810.6
Per share data (INR)
EPS Rep (fully diluted) 124.05 110.49 166.02 185.22HSBC EPS (fully diluted) 101.73 114.87 166.02 185.22DPS 12.69 13.52 16.00 0.00Book value 588.25 621.99 758.07 911.76
Valuation data
Year to 03/2008a 03/2009e 03/2010e 03/2011e
EV/sales 1.6 1.0 0.8 0.8EV/EBITDA 9.4 6.9 4.2 3.6EV/IC 1.6 1.4 1.2 1.0PE* 11.3 10.0 6.9 6.2P/Book value 1.9 1.8 1.5 1.3FCF yield (%) -8.9 1.0 13.4 9.5Dividend yield (%) 1.1 1.2 1.4 0.0
Note: * = Based on HSBC EPS (fully diluted)
Issuer information
Share price (INR) 1144.8 Target price (INR) 2160 Potent'l tot rtn (%) 88.7
Reuters (Equity) RELI.BO Bloomberg (Equity) RIL INMarket cap (USDm) 35,962 Market cap (INRm) 1,801,672Free float (%) 53 Enterprise value (INRm) 1963836Country India Sector OIL & GASAnalyst Kirtan Mehta Contact +91 80 30013779
Price relative
305
805
1305
1805
2305
2805
3305
2006 2007 2008 2009
305
805
1305
1805
2305
2805
3305
Reliance Industries Rel to BOMBAY SE SENSITIVE INDEX
Source: HSBC Note: price at close of 24 Nov 2008
Financials & valuation: Reliance Industries Overweight (V)

37
Climate Change India 27 November 2008
abc
Snapshot
Shree Renuka Sugars is the largest ethanol
manufacturing company in terms of production
capacity and distinguishes itself from peers in terms
of the business segments in which it operates and the
sugar business operating model. The company will
be a primary beneficiary of ethanol blending being
made mandatory.
Apart from the manufacturing business, the
company also refines and trades in sugar. It has a
sugar manufacturing capacity of 37,500 tonnes
crushed per day and a refining capacity of 4,000
tonnes per day. The total distillery capacity of the
company would be 1,200 kilo litres per day (KLPD),
and its cogeneration capacity is 143MW.
The company has focussed on developing its
distillery business by investment in Dhanuka
Petrochem (Distillery capacity) and KBK Chemicals
(Ethanol manufacturing technology).
Bio fuel and ethanol: Of the total distillery capacity
of 1,200 KLPD, the company has an ability to
switch between sugarcane and molasses as the feed
stock for 600 KLPD. The distillery division at the
current ethanol price of INR21.5/litre would
contribute c42% to the total earnings of the
company. We estimate that an INR1/litre
increase/decrease in price for the distillery segment
would lead to a 3% increase/decrease in EPS.
Valuation & risks
The stock has been trading within a PB multiple
band of 3-8x, since assets employed by the company
are low as a result of its operating lease business
model. We assign a PB multiple of 3x, and based on
our FY09e BVPS, of INR29, we arrive at a fair
value of INR85.
We have assumed a target EV/EBITDA multiple of
8x, and based on our FY09e EBITDA, of INR3.5bn,
we arrive at a fair value of INR75. Our target price,
of INR80, is the mid-point of our P/B and
EV/EBITDA based valuations.
Risks: The key risks to our rating are: 1) lower
availability of sugarcane, 2) higher sugarcane cost, 3) lower sugar prices, 4) increase in molasses cost, 5) equity dilution, and 6) cogeneration business
realisation.
Shree Renuka Sugars
Its focus on renewable businesses – ethanol and cogeneration –
diversifies earnings from the cyclical sugar business
Margin expansion should lead to EPS CAGR of 91% for FY08-
10e, improving ROE (30%) and ROIC (25%)
We have an Overweight (V) rating, with a target price of INR80;
trigger: inorganic growth; key risk: low ethanol and power sales
Sandeep Somani* Analyst HSBC Securities and Capital Markets (India) Private Limited
+91-22-2268 1245 [email protected]
Shipra Pandey* Associate Bangalore
*Employed by a non-US affiliate of HSBC Securities (USA) Inc, and is not registered/ qualified pursuant to NYSE and/ or NASD regulations
EV/EBITDA calculation
Heads INR
Multiple 8.0 FY09e EBITDA 3,578 EV 28,623 Net Debt 5,971 Equity value 22,651 No. of shares 298 Fair value 75.0
Source: HSBC estimates

38
Climate Change India 27 November 2008
abc
Financials & valuation: Shree Renuka Sugars Overweight (V) Financial statements
Year to 09/2007a 09/2008e 09/2009e 09/2010e
Profit & loss summary (INRm)
Revenue 9,506 18,329 23,388 31,755EBITDA 1,321 2,329 3,578 5,708Depreciation & amortisation -249 -420 -602 -692Operating profit/EBIT 1,072 1,910 2,976 5,016Net interest -134 -647 -855 -918PBT 1,067 1,263 2,121 4,098HSBC PBT 1,067 1,263 2,121 4,098Taxation -236 -417 -530 -1,024Net profit 831 846 1,590 3,074HSBC net profit 831 846 1,590 3,074
Cash flow summary (INRm)
Cash flow from operations 825 1,674 2,875 6,223Capex -3,408 -2,550 -2,600 -3,800Cash flow from investment -3,549 -2,550 -2,600 -3,800Dividends -83 -58 -66 -105Change in net debt 2,624 -602 410 -3,252FCF equity -3,101 -1,523 -580 1,506
Balance sheet summary (INRm)
Fixed assets 7,700 9,831 11,829 14,937Current assets 3,352 4,698 5,631 8,708Cash & others 307 909 1,149 4,401Total assets 11,241 14,718 17,648 23,834Operating liabilities 822 1,320 1,801 3,131Gross debt 6,470 6,470 7,120 7,120Net debt 6,163 5,561 5,971 2,719Shareholders funds 3,357 6,329 8,089 12,909Invested capital 9,924 12,300 14,510 16,113
Ratio, growth and per share analysis
Year to 09/2007a 09/2008e 09/2009e 09/2010e
Y-o-y % change
Revenue -13.9 92.8 27.6 35.8EBITDA -17.4 76.4 53.6 59.5Operating profit -29.1 78.2 55.8 68.6PBT -23.1 18.4 67.9 93.2HSBC EPS -33.8 -15.3 88.0 93.3
Ratios (%)
Revenue/IC (x) 1.2 1.6 1.7 2.1ROIC 10.4 11.5 16.6 24.6ROE 29.8 17.5 22.1 29.3ROA 10.1 9.9 13.8 18.1EBITDA margin 13.9 12.7 15.3 18.0Operating profit margin 11.3 10.4 12.7 15.8EBITDA/net interest (x) 9.9 3.6 4.2 6.2Net debt/equity 183.6 87.9 73.8 21.1Net debt/EBITDA (x) 4.7 2.4 1.7 0.5CF from operations/net debt 13.4 30.1 48.1 228.9
Per share data (INR)
EPS Rep (fully diluted) 3.35 2.84 5.34 10.32HSBC EPS (fully diluted) 3.35 2.84 5.34 10.32DPS 0.34 0.21 0.23 0.35Book value 13.53 22.93 28.89 43.33
Valuation data
Year to 09/2007a 09/2008e 09/2009e 09/2010e
EV/sales 2.1 1.0 0.8 0.5EV/EBITDA 15.0 8.2 5.5 2.9EV/IC 2.0 1.6 1.4 1.0PE* 15.3 18.0 9.6 5.0P/Book value 3.8 2.2 1.8 1.2FCF yield (%) -22.7 -11.2 -4.2 11.0Dividend yield (%) 0.7 0.4 0.5 0.7
Note: * = Based on HSBC EPS (fully diluted)
Issuer information
Share price (INR) 51.20 Target price (INR) 80.00 Potent'l tot rtn (%) 56.2
Reuters (Equity) SRES.BO Bloomberg (Equity) SHRS INMarket cap (USDm) 276 Market cap (INRm) 13,822Free float (%) 62 Enterprise value (INRm) 19216Country India Sector FOOD & STAPLES
RETAILINGAnalyst Sandeep Somani Contact +9122 2268 1245
Price relative
222426282
102122142162182
2006 2007 2008 2009
222426282102122142162182
Shree Renuka Sugars Rel to BOMBAY SE SENSITIVE INDEX
Source: HSBC Note: price at close of 24 Nov 2008

39
Climate Change India 27 November 2008
abc
Snapshot
Welspun is one of the largest pipe manufacturing
companies, with a capacity of 350,000 tonnes per
annum (TPA) for LSAW, 750,000 TPA for
HSAW and 250,000 for ERW pipes. Besides this,
the company has backward integrated into the
manufacturing of steel plate and coil, with an
annual production capacity of 1.5m tonnes.
Welspun is a supplier of pipes for over 50 oil and
gas companies across the world. With the increase
in the demand for natural gas as fuel, the company
should benefit from the increase in the
infrastructure requirement, as more pipeline
projects are announced.
Gas transportation infrastructure The company
has already executed international gas
transmission pipeline projects in Alaska and Trans
Canada. Based on its successful project execution,
the company has received repeat orders from
TransCanada, El Paso and Stroh Gas. The
company‘s order book is INR90bn, with the
majority of orders being for SAW pipes.
Valuation & Risks
We have valued Welspun Gujarat using PE
multiple based valuations. Our target PE multiple
for the stock is 6x, based on its historical PE band
and its future outlook. Using our September 2009
EPS estimate, our PE multiple-based value is
INR160 per share.
We have an Overweight (V) rating on the stock,
based on its strong order backlog, of INR 90bn,
higher than backlogs at peers Jindal SAW and
PSL ltd, its healthy RoE (25%) & RoIC (16%)
and the fact that the stock is currently trading at a
trough PE multiple.
Risks: The key risks to our rating are: 1) lower
sales due to lower-than-expected volumes and/or
prices, 2) an increase in interest cost, and 3) a
delay in capacity expansion and the
commissioning of the plate mill.
Welspun Gujarat
Welspun manufactures line pipes and also has backward
integrated into steel plates/coil
Strong order backlog of INR90bn from Trans Canada/ El Paso
and Stroh Gas
We have an Overweight (V) rating and a target price of INR160
Sandeep Somani* Analyst HSBC Securities and Capital Markets (India) Private Limited
+91-22-2268 1245 [email protected]
Shipra Pandey* Associate Bangalore
*Employed by a non-US affiliate of HSBC Securities (USA) Inc, and is not registered/ qualified pursuant to NYSE and/ or NASD regulations

40
Climate Change India 27 November 2008
abc
Financials & valuation: Welspun Gujarat Stahl Roh Overweight (V) Financial statements
Year to 03/2008a 03/2009e 03/2010e 03/2011e
Profit & loss summary (INRm)
Revenue 39,944 64,446 76,517 88,509EBITDA 6,477 9,252 12,700 13,881Depreciation & amortisation -609 -1,580 -1,820 -1,940Operating profit/EBIT 5,868 7,672 10,880 11,940Net interest -819 -1,754 -2,160 -1,820PBT 5,235 5,918 8,719 10,121HSBC PBT 5,235 5,918 8,719 10,121Taxation -1,828 -2,067 -3,045 -3,535Net profit 3,407 3,851 5,674 6,586HSBC net profit 3,407 3,851 5,674 6,586
Cash flow summary (INRm)
Cash flow from operations -19 14,297 8,402 9,663Capex -12,229 -4,000 -2,000 -2,000Cash flow from investment -12,229 -4,000 -2,000 -2,000Dividends -188 -356 -191 -212Change in net debt 23,384 -20,573 -4,051 -5,631FCF equity -12,660 8,543 4,242 5,843
Balance sheet summary (INRm)
Fixed assets 26,727 29,227 29,407 29,466Current assets 12,251 36,865 46,041 57,210Cash & others -9,683 10,891 14,941 20,572Total assets 39,233 72,909 82,264 93,493Operating liabilities 15,147 26,127 29,999 34,854Gross debt 25,274 25,274 25,274 25,274Net debt 34,957 14,384 10,333 4,702Shareholders funds 12,602 18,281 23,764 30,138Invested capital 33,513 29,074 30,507 31,250
Ratio, growth and per share analysis
Year to 03/2008a 03/2009e 03/2010e 03/2011e
Y-o-y % change
Revenue 49.1 61.3 18.7 15.7EBITDA 94.4 42.8 37.3 9.3Operating profit 105.4 30.7 41.8 9.7PBT 138.9 13.0 47.3 16.1HSBC EPS 111.4 30.0 28.1 16.1
Ratios (%)
Revenue/IC (x) 1.5 2.1 2.6 2.9ROIC 14.5 16.0 23.8 25.2ROE 35.7 24.9 27.0 24.4ROA 10.9 8.9 9.1 8.8EBITDA margin 16.2 14.4 16.6 15.7Operating profit margin 14.7 11.9 14.2 13.5EBITDA/net interest (x) 7.9 5.3 5.9 7.6Net debt/equity 277.4 78.7 43.5 15.6Net debt/EBITDA (x) 5.4 1.6 0.8 0.3CF from operations/net debt 99.4 81.3 205.5
Per share data (INR)
EPS Rep (fully diluted) 18.32 20.70 30.51 35.41HSBC EPS (fully diluted) 18.32 23.81 30.51 35.41DPS 1.01 1.91 1.03 1.14Book value 67.75 98.28 127.76 162.03
Valuation data
Year to 03/2008a 03/2009e 03/2010e 03/2011e
EV/sales 1.3 0.4 0.3 0.2EV/EBITDA 8.0 2.7 1.6 1.1EV/IC 1.6 0.9 0.7 0.5PE* 5.1 3.9 3.1 2.6P/Book value 1.4 0.9 0.7 0.6FCF yield (%) -73.9 80.8 40.1 55.3Dividend yield (%) 1.1 2.1 1.1 1.2
Note: * = Based on HSBC EPS (fully diluted)
Issuer information
Share price (INR) 93.25 Target price (INR) 160 Potent'l tot rtn (%) 71.6
Reuters (Equity) WGSR.BO Bloomberg (Equity) WGS INMarket cap (USDm) 347 Market cap (INRm) 17,390Free float (%) 58 Enterprise value (INRm) 24957Country India Sector ENERGY EQUIPMENTAnalyst Sandeep Somani Contact +9122 2268 1245
Price relative
0
100
200
300
400
500
600
2006 2007 2008 2009
0
100
200
300
400
500
600
Welspun Gujarat Stahl Roh Rel to BOMBAY SE SENSITIVE INDEX
Source: HSBC Note: price at close of 24 Nov 2008

41
Climate Change India 27 November 2008
abc
HSBC Global Research websiteTo maximise your access to HSBC Global Research please visit our website at www.research.hsbc.com where you can:
View the latest research and access archived reports
Visit the dedicated product pages, including Emerging Markets and Climate Change
Filter estimates for more than 1,000 companies under equity coverage
Set up personal filters to put your research interests at your fingertips
Look up HSBC research analyst contact details
E-mail subscriptions You can receive research directly via e-mail as soon as it is published. To set up subscriptions
to research reports, contact your Relationship Manager.
If you are having problems or need assistance with the website service, please contact your
HSBC Relationship Manager or e-mail: [email protected].
http://www.research.hsbc.com

42
Climate Change India 27 November 2008
abc
Notes

43
Climate Change India 27 November 2008
abc
Notes

44
Climate Change India 27 November 2008
abc
Disclosure appendix Analyst certification The following analyst(s), who is(are) primarily responsible for this report, certifies(y) that the opinion(s) on the subject security(ies) or issuer(s) and any other views or forecasts expressed herein accurately reflect their personal view(s) and that no part of their compensation was, is or will be directly or indirectly related to the specific recommendation(s) or views contained in this research report: Nick Robins, Charanjit Singh, Sanjeev Kaushik, Roshan Padamadan, Sumeet Agrawal, Kirtan Mehta and Sandeep Somani
Important disclosures
Stock ratings and basis for financial analysis HSBC believes that investors utilise various disciplines and investment horizons when making investment decisions, which depend largely on individual circumstances such as the investor's existing holdings, risk tolerance and other considerations. Given these differences, HSBC has two principal aims in its equity research: 1) to identify long-term investment opportunities based on particular themes or ideas that may affect the future earnings or cash flows of companies on a 12 month time horizon; and 2) from time to time to identify short-term investment opportunities that are derived from fundamental, quantitative, technical or event-driven techniques on a 0-3 month time horizon and which may differ from our long-term investment rating. HSBC has assigned ratings for its long-term investment opportunities as described below.
This report addresses only the long-term investment opportunities of the companies referred to in the report. As and when HSBC publishes a short-term trading idea the stocks to which these relate are identified on the website at www.hsbcnet.com/research. Details of these short-term investment opportunities can be found under the Reports section of this website.
HSBC believes an investor's decision to buy or sell a stock should depend on individual circumstances such as the investor's existing holdings and other considerations. Different securities firms use a variety of ratings terms as well as different rating systems to describe their recommendations. Investors should carefully read the definitions of the ratings used in each research report. In addition, because research reports contain more complete information concerning the analysts' views, investors should carefully read the entire research report and should not infer its contents from the rating. In any case, ratings should not be used or relied on in isolation as investment advice.
Rating definitions for long-term investment opportunities
Stock ratings HSBC assigns ratings to its stocks in this sector on the following basis:
For each stock we set a required rate of return calculated from the risk free rate for that stock's domestic, or as appropriate, regional market and the relevant equity risk premium established by our strategy team. The price target for a stock represents the value the analyst expects the stock to reach over our performance horizon. The performance horizon is 12 months. For a stock to be classified as Overweight, the implied return must exceed the required return by at least 5 percentage points over the next 12 months (or 10 percentage points for a stock classified as Volatile*). For a stock to be classified as Underweight, the stock must be expected to underperform its required return by at least 5 percentage points over the next 12 months (or 10 percentage points for a stock classified as Volatile*). Stocks between these bands are classified as Neutral.
Our ratings are re-calibrated against these bands at the time of any 'material change' (initiation of coverage, change of volatility status or change in price target). Notwithstanding this, and although ratings are subject to ongoing management review, expected returns will be permitted to move outside the bands as a result of normal share price fluctuations without necessarily triggering a rating change.

45
Climate Change India 27 November 2008
abc
*A stock will be classified as volatile if its historical volatility has exceeded 40%, if the stock has been listed for less than 12 months (unless it is in an industry or sector where volatility is low) or if the analyst expects significant volatility. However, stocks which we do not consider volatile may in fact also behave in such a way. Historical volatility is defined as the past month's average of the daily 365-day moving average volatilities. In order to avoid misleadingly frequent changes in rating, however, volatility has to move 2.5 percentage points past the 40% benchmark in either direction for a stock's status to change.
Prior to this, from 7 June 2005 HSBC applied a ratings structure which ranked the stocks according to their notional target price vs current market price and then categorised (approximately) the top 40% as Overweight, the next 40% as Neutral and the last 20% as Underweight. The performance horizon is 2 years. The notional target price was defined as the mid-point of the analysts' valuation for a stock.
From 15 November 2004 to 7 June 2005, HSBC carried no ratings and concentrated on long-term thematic reports which identified themes and trends in industries, but did not make a conclusion as to the investment action that potential investors should take.
Prior to 15 November 2004, HSBC's ratings system was based upon a two-stage recommendation structure: a combination of the analysts' view on the stock relative to its sector and the sector call relative to the market, together giving a view on the stock relative to the market. The sector call was the responsibility of the strategy team, set in co-operation with the analysts. For other companies, HSBC showed a recommendation relative to the market. The performance horizon was 6-12 months. The target price was the level the stock should have traded at if the market accepted the analysts' view of the stock.
Rating distribution for long-term investment opportunities
As of 26 November 2008, the distribution of all ratings published is as follows: Overweight (Buy) 47% (30% of these provided with Investment Banking Services)
Neutral (Hold) 35% (34% of these provided with Investment Banking Services)
Underweight (Sell) 18% (23% of these provided with Investment Banking Services)
Information regarding company share price performance and history of HSBC ratings and price targets in respect of its long-term investment opportunities for the companies the subject of this report,is available from www.hsbcnet.com/research.

46
Climate Change India 27 November 2008
abc
HSBC & Analyst disclosures Disclosure checklist
Company Ticker Recent price Price Date Disclosure
LARSEN & TOUBRO LART.BO 736.80 25-Nov-2008 2, 5, 6, 7OIL & NATURAL GAS CORP ONGC.BO 685.85 25-Nov-2008 6, 7PSL LTD PSLH.BO 88.75 25-Nov-2008 4RELIANCE INDUSTRIES RELI.BO 1071.80 25-Nov-2008 2, 5, 6, 9, 11SHREE RENUKA SUGARS SRES.BO 49.10 25-Nov-2008 6, 7WELSPUN GUJARAT STAHL ROH WGSR.BO 88.75 25-Nov-2008 4
Source: HSBC
1 HSBC* has managed or co-managed a public offering of securities for this company within the past 12 months. 2 HSBC expects to receive or intends to seek compensation for investment banking services from this company in the next
3 months. 3 At the time of publication of this report, HSBC Securities (USA) Inc. is a Market Maker in securities issued by this
company. 4 As of 31 October 2008 HSBC beneficially owned 1% or more of a class of common equity securities of this company. 5 As of 30 September 2008, this company was a client of HSBC or had during the preceding 12 month period been a client
of and/or paid compensation to HSBC in respect of investment banking services. 6 As of 30 September 2008, this company was a client of HSBC or had during the preceding 12 month period been a client
of and/or paid compensation to HSBC in respect of non-investment banking-securities related services. 7 As of 30 September 2008, this company was a client of HSBC or had during the preceding 12 month period been a client
of and/or paid compensation to HSBC in respect of non-securities services. 8 A covering analyst/s has received compensation from this company in the past 12 months. 9 A covering analyst/s or a member of his/her household has a financial interest in the securities of this company, as
detailed below. 10 A covering analyst/s or a member of his/her household is an officer, director or supervisory board member of this
company, as detailed below. 11 At the time of publication of this report, HSBC is a non-US Market Maker in securities issued by this company and/or in
securities in respect of this company
A member of Kirtan Mehta's household has a share holding in Reliance Industries Limited.
Analysts are paid in part by reference to the profitability of HSBC which includes investment banking revenues.
For disclosures in respect of any company, please see the most recently published report on that company available at www.hsbcnet.com/research.
* HSBC Legal Entities are listed in the Disclaimer below.
Additional disclosures 1 This report is dated as at 27 November 2008. 2 All market data included in this report are dated as at close 24 November 2008, unless otherwise indicated in the report. 3 HSBC has procedures in place to identify and manage any potential conflicts of interest that arise in connection with its
Research business. HSBC's analysts and its other staff who are involved in the preparation and dissemination of Research operate and have a management reporting line independent of HSBC's Investment Banking business. Chinese Wall procedures are in place between the Investment Banking and Research businesses to ensure that any confidential and/or price sensitive information is handled in an appropriate manner.

47
Climate Change India 27 November 2008
abc
Disclaimer * Legal entities as at 22 August 2007 'UAE' HSBC Bank Middle East Limited, Dubai; 'HK' The Hongkong and Shanghai Banking Corporation Limited, Hong Kong; 'TW' HSBC Securities (Taiwan) Corporation Limited; 'CA' HSBC Securities (Canada) Inc, Toronto; HSBC Bank, Paris branch; HSBC France; 'DE' HSBC Trinkaus & Burkhardt AG, Dusseldorf; 000 HSBC Bank (RR), Moscow; 'IN' HSBC Securities and Capital Markets (India) Private Limited, Mumbai; 'JP' HSBC Securities (Japan) Limited, Tokyo; 'EG' HSBC Securities Egypt S.A.E., Cairo; 'CN' HSBC Investment Bank Asia Limited, Beijing Representative Office; The Hongkong and Shanghai Banking Corporation Limited, Singapore branch; The Hongkong and Shanghai Banking Corporation Limited, Seoul Securities Branch; HSBC Securities (South Africa) (Pty) Ltd, Johannesburg; 'GR' HSBC Pantelakis Securities S.A., Athens; HSBC Bank plc, London, Madrid, Milan, Stockholm, Tel Aviv, 'US' HSBC Securities (USA) Inc, New York; HSBC Yatirim Menkul Degerler A.S., Istanbul; HSBC México, S.A., Institución de Banca Múltiple, Grupo Financiero HSBC, HSBC Bank Brasil S.A. - Banco Múltiplo, HSBC Bank Australia Limited.
Issuer of report HSBC Bank plc
8 Canada Square
London, E14 5HQ, United Kingdom
Telephone: +44 20 7991 8888
Fax: +44 20 7992 4880
Website: www.research.hsbc.com
In the UK this document has been issued and approved by HSBC Bank plc (“HSBC”) for the information of its Clients (as defined in the Rules of FSA) and those of its affiliates only. It is not intended for Retail Clients in the UK. If this research is received by a customer of an affiliate of HSBC, its provision to the recipient is subject to the terms of business in place between the recipient and such affiliate. HSBC Securities (USA) Inc. accepts responsibility for the content of this research report prepared by its non-US foreign affiliate. All U.S. persons receiving and/or accessing this report and wishing to effect transactions in any security discussed herein should do so with HSBC Securities (USA) Inc. in the United States and not with its non-US foreign affiliate, the issuer of this report. In Singapore, this publication is distributed by The Hongkong and Shanghai Banking Corporation Limited, Singapore Branch for the general information of institutional investors or other persons specified in Sections 274 and 304 of the Securities and Futures Act (Chapter 289) (“SFA”) and accredited investors and other persons in accordance with the conditions specified in Sections 275 and 305 of the SFA. This publication is not a prospectus as defined in the SFA. It may not be further distributed in whole or in part for any purpose. The Hongkong and Shanghai Banking Corporation Limited Singapore Branch is regulated by the Monetary Authority of Singapore. In Australia, this publication has been distributed by The Hongkong and Shanghai Banking Corporation Limited (ABN 65 117 925 970, AFSL 301737) for the general information of its “wholesale” customers (as defined in the Corporations Act 2001). Where distributed to retail customers, this research is distributed by HSBC Bank Australia Limited (AFSL No. 232595). These respective entities make no representations that the products or services mentioned in this document are available to persons in Australia or are necessarily suitable for any particular person or appropriate in accordance with local law. No consideration has been given to the particular investment objectives, financial situation or particular needs of any recipient. This publication has been distributed in Japan by HSBC Securities (Japan) Limited. It may not be further distributed, in whole or in part, for any purpose. In Hong Kong, this document has been distributed by The Hongkong and Shanghai Banking Corporation Limited in the conduct of its Hong Kong regulated business for the information of its institutional and professional customers; it is not intended for and should not be distributed to retail customers in Hong Kong. The Hongkong and Shanghai Banking Corporation Limited makes no representations that the products or services mentioned in this document are available to persons in Hong Kong or are necessarily suitable for any particular person or appropriate in accordance with local law. All inquiries by such recipients must be directed to The Hongkong and Shanghai Banking Corporation Limited. This document is not and should not be construed as an offer to sell or the solicitation of an offer to purchase or subscribe for any investment. HSBC has based this document on information obtained from sources it believes to be reliable but which it has not independently verified; HSBC makes no guarantee, representation or warranty and accepts no responsibility or liability as to its accuracy or completeness. The opinions contained within the report are based upon publicly available information at the time of publication and are subject to change without notice. Nothing herein excludes or restricts any duty or liability to a customer which HSBC has under the Financial Services and Markets Act 2000 or under the Rules of FSA. A recipient who chooses to deal with any person who is not a representative of HSBC in the UK will not enjoy the protections afforded by the UK regulatory regime. Past performance is not necessarily a guide to future performance. The value of any investment or income may go down as well as up and you may not get back the full amount invested. Where an investment is denominated in a currency other than the local currency of the recipient of the research report, changes in the exchange rates may have an adverse effect on the value, price or income of that investment. In case of investments for which there is no recognised market it may be difficult for investors to sell their investments or to obtain reliable information about its value or the extent of the risk to which it is exposed. HSBC Bank plc is registered in England No 14259, is authorised and regulated by the Financial Services Authority and is a member of the London Stock Exchange. © Copyright. HSBC Bank plc 2008, ALL RIGHTS RESERVED. No part of this publication may be reproduced, stored in a retrieval system, or transmitted, on any form or by any means, electronic, mechanical, photocopying, recording, or otherwise, without the prior written permission of HSBC Bank plc. MICA (P) 258/09/2008

Global Alternative Energy & Climate Change Research Team
abc
Alternative Energy
Robert Clover Global Sector Head, Alternative Energy +44 20 7991 6741 [email protected]
James Magness +44 20 7991 3464 [email protected]
Charanjit Singh +91 80 3001 3776 [email protected]
Christine Wang +8862 8725 6024 [email protected]
Burkhard Weiss +49 211 910 3722 [email protected]
Christian Rath +49 211 910 3049 [email protected]
Sebastian Satz +49 211 910 2373 [email protected]
Murielle André-Pinard +33 1 56 52 43 16 [email protected]
Pedro Herrera +1 212 525 5126 [email protected]
Yiannis Sinapis +30 210 6965 215 [email protected]
HSBC Climate Change Indices
Joaquim de Lima Analyst, Head of Equity Quantitative Research +44 20 7991 6836 [email protected]
Vijay Sumon +44 20 7991 6839 [email protected]
Elton Babameto +44 20 7991 6730 [email protected]
Freddie Siu +852 2996 6558 [email protected]
Utilities
Verity Mitchell +44 20 7991 6840 [email protected]
Climate Change Centre of Excellence
Nick Robins +44 20 799 16778 [email protected]
Roshan F Padamadan, CFA +44 207 991 6715 [email protected]
Credit Research
Madeleine King. CFA +44 20 7991 6789 [email protected]