Nutrition Services Updates Training WIC & Nutrition Services Implementation April 1, 2015.

WIC Nutrition Services and Administration Cost Study
Final Report
Prepared for: U.S. Department of Agriculture
Office of Policy Support
Attn: Chan Chanhatasilpa, Ph.D.
Prepared by: Altarum Institute and RTI International

WIC Nutrition Services and Administration
Cost Study
November 2017
Authors:
Stacy Gleason, Altarum Institute
Linnea Sallack, Altarum Institute
Loren Bell, Altarum Institute
Leslie Erickson, RTI International
Benjamin Yarnoff, RTI International
Celia Eicheldinger, RTI International
Submitted by:
Altarum Institute
4 Milk Street, 3rd
Floor
Portland, ME 04101
Submitted to:
USDA Food and Nutrition Service
Office of Policy Support
3101 Park Center Drive
Alexandria, VA 22302-1500
Project Director:
Loren Bell
Project Officer:
Chanchalat Chanhatasilpa
Suggested Citation: U.S. Department of Agriculture, Food and Nutrition Service, Office of Policy
Support. WIC NSACost Study: Final Report, by Stacy Gleason, Linnea Sallack, Loren Bell, Leslie
Erickson, Benjamin Yarnoff, and Celia Eicheldinger. Project Officer: Chanchalat Chanhatasilpa.
Alexandria, VA: November 2017.
USDA is an equal opportunity provider, employer, and lender.
Acknowledgements
Many individuals made important contributions to this report. The authors thank the Altarum Institute and
RTI International study team, especially Diane Phillips, Marcia Harrington, Ruth Morgan, Brent Walker,
Doris McGuire, David Plotner, Jessica Williams, and Sarah Harris, for their leadership on sampling and
data collection tasks. We also thank Dr. Chan Chanhatasilpa, Dr. Tameka Owens, and Hayes Brown of
the U.S. Department of Agriculture’s Food and Nutrition Service for providing oversight, guidance, and
critical program information as well as the numerous Special Supplemental Nutrition Program for
Women, Infants, and Children (WIC) State agencies and representatives from the WIC research
community who contributed to the advisory panel discussions, helped to guide the study protocols, and
pretested the data collection instruments.
Most importantly, we would like to thank the State WIC Directors, local agency WIC Coordinators, and
other WIC staff members who participated in Web surveys and case studies to provide us with
information regarding nutrition services and administration costs. Without their contribution, this project
could not have been conducted.

Table of Contents
Executive Summary ii
Chapter I: Introduction and Overview 1 A. Program Background and Funding Overview ................................................................................................ 1 B. Prior Studies and Reports Related to WIC NSA Costs ................................................................................. 4 C. Organization of the Report ............................................................................................................................ 5
Chapter II: Study Methodology 7 A. Extant Data Sources ..................................................................................................................................... 8 B. Web Survey Data .......................................................................................................................................... 9 C. Case Study Data ......................................................................................................................................... 18 D. Data Analysis .............................................................................................................................................. 20
Chapter III: Study Population 23 A. State Agency Characteristics ...................................................................................................................... 23 B. Local Agency Characteristics ...................................................................................................................... 25 C. Case Study SA Characteristics ................................................................................................................... 28
Chapter IV: Budget Planning 29 A. WIC SA Budget Planning ............................................................................................................................ 29 B. WIC LA Budget Planning............................................................................................................................. 35
Chapter V: NSA Expenditure Levels 40 A. NSA Expenditures for SA- and Local-Level Operations .............................................................................. 40 B. NSA Expenditures Across Four Cost Categories ........................................................................................ 41 C. Average Monthly NSA Expenditure per Participant ..................................................................................... 42
Chapter VI: NSA State Agency-Level Cost Centers 45 A. Labor/Personnel .......................................................................................................................................... 46 B. Contracted Services .................................................................................................................................... 48 C. Materials, Services, and Travel ................................................................................................................... 49 D. Indirect Costs .............................................................................................................................................. 50
Chapter VII: NSA Local-Level Cost Centers 52 A. Labor/Personnel .......................................................................................................................................... 53 B. Contracted Services .................................................................................................................................... 55 C. Materials, Services, and Travel ................................................................................................................... 55 D. Indirect Costs .............................................................................................................................................. 56
Chapter VIII: Factors Influencing NSA Costs 58 A. Factors SAs Attribute to Increases in SA-Level Costs in Recent Years ...................................................... 58 B. Factors SAs Attribute to Decreases in SA-Level Costs in Recent Years .................................................... 59 C. Factors LAs Attribute to Increases in Local-Level Costs in Recent Years ................................................... 60 D. Factors LAs Attribute to Decreases in Local-Level Costs in Recent Years ................................................. 61 E. Relationship Between Technology and NSA Costs ..................................................................................... 61 F. Data-Driven Examination of Factors That Influence Overall NSA Expenditures ......................................... 64
Chapter IX: Comparison to SNAP and TANF Costs 67 A. TANF ........................................................................................................................................................... 67 B. SNAP .......................................................................................................................................................... 68 C. Case Studies of TANF and SNAP ............................................................................................................... 70 D. Summary from a Comparison of WIC to SNAP and TANF .......................................................................... 74
Chapter X: Conclusion 75 A. Key findings ................................................................................................................................................. 75 B. Study Limitations and Lessons Learned...................................................................................................... 76

Appendix A: Web Survey User Guides
Appendix B: Recruitment Letters
Appendix C: Response Rate Formula
Appendix D: Web Survey Unit Response Rates
Appendix E: Nonresponse Bias Analysis Results Tables
Appendix F: Web Survey Item Response Rates
Appendix G: Model Used to Derive Weight Asjustment Factor
Appendix H: Case Study Interview Guides
Appendix I: Data Tables
Appendix J: Case Study State Agency Profiles
Table of Exhibits
Exhibit ES.1 FFY 2013 WIC Grants .............................................................................................................................. i
Exhibit ES.2 WIC SA Size and Structure .................................................................................................................... iii
Exhibit ES.3 Map of WIC SAs with EBT in the Contiguous United States, FFY 2013................................................. iv
Exhibit ES.4 Percentage of SAs Using Various Methods to Fund Local Services, FFY 2013 ..................................... v
Exhibit ES.5 Average Percentage of Total NSA Expenditures in Each Cost Category, by SA Size and Structure, FFY 2013 ............................................................................................................................................... vi
Exhibit ES.6 Proportion of the FFY 2013 NSA Grant Attributed to Key SA-Level Cost Centers ................................ vii
Exhibit 1.1 WIC Food and NSA Funding Formulas ................................................................................................... 2
Exhibit 1.2 FFY 2013 WIC Grants ............................................................................................................................. 3
Exhibit 1.3 WIC Functions Performed With NSA Funds ............................................................................................ 4
Exhibit 1.4 Additional Federal WIC Funding ............................................................................................................. 2
Exhibit 1.5 NSA Reporting Cost Categories .............................................................................................................. 3
Exhibit 2.1 Study Objectives and Research Questions ............................................................................................. 7
Exhibit 2.2 Variables Obtained Through Secondary and Existing Data Sources, by FNS Sources .......................... 8
Exhibit 2.2 Variables Obtained Through Secondary and Existing Data Sources, by SA Sources ............................. 9
Exhibit 2.3 Type of Data Obtained from Web Surveys, by SA Web-based Survey ................................................... 9
Exhibit 2.4 Relationship Between Web Survey Types and Eligible Respondent Pools ........................................... 12
Exhibit 2.5 List of Web Survey Screens .................................................................................................................. 14
Exhibit 2.6 Number and Percentage of SA and LA Respondents, by Respondent Type ........................................ 14
Exhibit 2.7 Frame Variables Used in the Nonresponse Bias Analysis and Nonresponse Weight Adjustment Models, by SA-level Variables ............................................................................................................... 15
Exhibit 2.8 Example of Bias Analysis for EBT Status .............................................................................................. 16
Exhibit 2.9 Item Response Rate Frequency ............................................................................................................ 17
Exhibit 2.10 Summary of Information Gathered Through Case Study Interviews by Respondent Type ................... 19
Exhibit 2.11 SA Cost and Size Categories ................................................................................................................ 19
Exhibit 2.12 Select Characteristics of 14 SAs Recruited Into the Case Study .......................................................... 20
Exhibit 3.1 WIC SA Size and Structure ................................................................................................................... 24
Exhibit 3.2 Map of WIC SAs with EBT in the Contiguous U.S., FFY 2013 .............................................................. 25
Exhibit 3.3 Percentage of LAs in Each Size Category ............................................................................................ 26
Exhibit 3.4 LA Types ............................................................................................................................................... 26
Exhibit 3.5 Percentage of LAs in Each Agency Type .............................................................................................. 27
Exhibit 3.6 Ten Services Most Commonly Provided by Agencies That Are Collocated With WIC .......................... 27
Exhibit 3.7 Case Study SA Characteristics ............................................................................................................. 28
Exhibit 4.1 Percentage of SAs Using Various Methods to Fund Local Services, FFY 2013 ................................... 33

Exhibit 4.2 State Expenditures in Dollars and as a Percentage of Total WIC Expenditures, FFY 2013 .................. 34
Exhibit 4.3 Percentage of SAs That Received In-Kind Contributions in FFY 2013 ................................................. 35
Exhibit 4.4 Percentage of LAs Reporting Other Types of Funding, FFY 2013 ........................................................ 38
Exhibit 4.5 Percentage of LAs Receiving In-Kind Contributions in FFY 2013 by Type............................................ 39
Exhibit 5.1 Average Percentage of NSA Expenditures for SA- and Local-Level Expenditures, by SA Size and Structure, FFY 2013 .............................................................................................................................. 41
Exhibit 5.2 Average Percentage of Total NSA Expenditures in Each Cost Category, by SA Size and Structure, FFY 2013 .............................................................................................................................................. 42
Exhibit 5.3 Average Monthly NSA Expenditure per Participant, by Agency Size, FFY 2013 ................................... 43
Exhibit 5.4 Average Monthly NSA Expenditure per Participant for LAs, by Agency Size, FFY 2013 ...................... 44
Exhibit 6.1 Proportion of the FFY 2013 NSA Grant Attributed to Key SA-Level Cost Centers ................................ 46
Exhibit 6.2 SA Functions for Which Agencies Estimated FTEs and Labor and Personnel Costs ........................... 46
Exhibit 6.3 SA Functions to Which Most SA-Level FTEs Were Allocated (Top Five) in FFY 2013 ......................... 47
Exhibit 6.4 Percentage of State-Level Labor and Personnel Costs Attributed to Each of the Four NSA Cost Categories in FFY 2013 ........................................................................................................................ 48
Exhibit 6.5 Type of Contracted Services for Which SAs Estimated Annual Expenditures ....................................... 48
Exhibit 6.6 Percentage of SAs Reporting Contracted Service-Related Costs in FFY 2013 .................................... 49
Exhibit 6.7 Type of Material, Service, and Travel Costs for Which SAs Estimated Annual Expenditures ............... 49
Exhibit 6.8 Percentage of SA-Level Material, Service, and Travel Costs Attributed to Each of the Four NSA Cost Categories in FFY 2013 ........................................................................................................................ 50
Exhibit 6.9 Percentage of SAs Reporting Various Types of Support in FFY 2013 That Were Paid Through Indirect Costs Charged to Their NSA Grants ..................................................................................................... 51
Exhibit 7.1 Proportion of the FFY 2013 NSA Grant Attributed to Major Local-Level Cost Centers ......................... 53
Exhibit 7.2 Staff Types for Which LAs Estimated FTEs and Labor and Personnel Costs ....................................... 53
Exhibit 7.3 Staff Types to Which LA FTEs Were Allocated in FFY 2013 ................................................................. 54
Exhibit 7.4 Type of Contracted Services for Which LAs Estimated Annual Expenditures ....................................... 55
Exhibit 7.5 Percentage of LAs That Report Various Types of Material-, Service-, and Travel-Related Costs in FFY 2013 ...................................................................................................................................................... 56
Exhibit 7.6 Percentage of LAs Reporting Various Types of Support in FFY 2013 That Were Paid Through Indirect Costs Charged to Their NSA Grant ....................................................................................................... 57
Exhibit 8.1 Factors Other Than Staffing That SAs Report Have Increased Their Costs Since FFY 2010 ......................... 59
Exhibit 8.2 Factors That SAs Report Have Decreased Their Staffing Costs Since FFY 2010 ................................ 59
Exhibit 8.3 Factors Other Than Staffing That LAs Report Have Increased Their Costs Since FFY 2010 ............... 61
Exhibit 8.4 Percentage of SAs Reporting Net Impact of EBT on NSA Expenditures, FFY 2013 ............................. 62
Exhibit 8.5 Average Percentage of SA Costs Attributable to Various Technology-Related Support and Development, FFY 2013 ....................................................................................................................... 63
Exhibit 8.6 Regression Analysis Testing the Influence of the Number of LAs on SA Cost per Participant .............. 64
Exhibit 8.7 Estimated SA Cost per Participant Based on the Number of LAs ......................................................... 65
Exhibit 8.8 Regression Analysis Testing the Influence of the Number of Participants on Cost per Participant in LAs .............................................................................................................................................................. 65
Exhibit 8.9 Percentage of WIC Dollars Allocated to NSA and Food Costs, FFY 2013 ............................................ 66
Exhibit 9.1 Total FFY 2013 Food/Cash Benefit and Non-Food/Cash Expenditures for WIC and TANF .................. 68
Exhibit 9.2 FFY 2013 Benefit and Administrative Expenditures for WIC and TANF When Nutrition Education and Breastfeeding Costs Are Included as Benefits ...................................................................................... 68
Exhibit 9.3 Total FFY 2013 Food Benefit and Non-food Expenditures for WIC and SNAP ..................................... 69
Exhibit 9.4 FFY 2013 Benefit and Administrative Expenditures for WIC and SNAP When Nutrition Education and Breastfeeding Costs Are Included as Benefits ...................................................................................... 70
Exhibit 9.5 SNAP and TANF Interviews Conducted ................................................................................................ 70

2015 WIC NSA Cost Study ● Final Report PAGE | i
Glossary of Terms
Centralized SA SAs that operate and staff local service delivery sites. Most SAs operated by Indian Tribal Organizations (ITOs) and Territories fall into this category.
Combination SA SAs that are a hybrid of centralized and decentralized structures. They operate and staff some local service delivery sites but also contract with one or more LAs for the provision of local services.
Contingency fund A reserve of money set aside to cover possible unforeseen future expenses.
Decentralized SA SAs that contract with LAs for local service delivery.
Direct costs Costs incurred specifically for a program.
EBT WIC consumers use paper food instruments or a card that looks like a debit card to redeem their WIC foods. The card system is called Electronic benefit transfer or EBT.
Indirect costs Costs incurred for the benefit of more than one program. Because indirect costs cannot be identified readily and specifically with a particular program, agencies use a variety of methods to allocated indirect costs to WIC.
Local agency (LA) Community-based agencies that manage applications and certifications and deliver WIC services and benefits.
NSA grant Nutrition Services and Administration (NSA) grant funds support a wide range of program activities at the State agency and local levels, including both administrative or management functions (e.g., establishing program policies and procedures, operating food delivery systems, monitoring program operations) and nutrition services functions (e.g., conducting nutrition assessments, providing nutrition education, making referrals).
Participant Lower-income pregnant, breastfeeding, and postpartum women; infants; and children up to age 5 who are at nutritional risk and receive WIC benefits.
State agency (SA) SAs receive grants along with any funding or policy guidance from the USDA Food and Nutrition Service and manage grants and set policy for local agencies. There are 90 SAs in all—one in each of the geographic U.S. States, the District of Columbia, 34 ITOs, American Samoa, Guam, the Northern Mariana Islands, Puerto Rico, and the Virgin Islands.
USDA The United States Department of Agriculture, which funds and oversees the WIC Program.
WIC Vendor A commercial entity, such as a grocery store, where WIC food instruments (paper checks, vouchers, or EBT cards) can be used to purchase WIC-approved food items.

2015 WIC NSA Cost Study ● Final Report PAGE | ii
Executive Summary
This report assesses the costs charged to the Special Supplemental Nutrition Program for Women, Infants,
and Children (WIC) in Federal fiscal year (FFY) 2013. In 2014, the U.S. Department of Agriculture’s
(USDA) Food and Nutrition Service (FNS) contracted Altarum Institute and RTI International to conduct
the Nutrition Services and Administration (NSA) Cost Study, an assessment of the amounts and
categories of costs charged to WIC NSA grants and the variation of these costs among WIC State
agencies (SAs) and local agencies (LAs). Prior to this report, the most recent similar assessment was
completed by the U.S. Government Accountability Office (GAO) and focused on costs associated with
operating WIC during FFY 1998.1 Since that time, the WIC program has changed: Participation has
increased, electronic benefits transfer (EBT) for food benefit delivery has been introduced, the use of
management information systems (MIS) to create and manage participant records has expanded, WIC
food packages have been updated, and breastfeeding support services have expanded.
The WIC NSA Cost Study was designed with consideration of four objectives:
1. Gather and analyze data on the NSA grant system to obtain a detailed and accurate picture of
average NSA funds and costs at the national, SA, Indian Tribal Organization (ITO), and LA
levels.
2. Determine the impact on NSA costs of the increased use of technology and infant formula
rebates.
3. Determine the extent and effect of economies of scale between larger and smaller States/ITOs and
LAs.
4. Compare WIC administration costs to administration costs for the Supplemental Nutrition
Assistance Program (SNAP) and the Temporary Assistance for Needy Families (TANF) program.
ES-1 BACKGROUND
WIC is a federally funded nutrition assistance program administered by FNS to provide supplemental
foods, nutrition education, breastfeeding support, and referrals for health care and other services to low-
income pregnant, breastfeeding, and postpartum women; infants; and children up to age 5 who are at
nutritional risk. FNS awards annual cash grants that in FFY 2013 supported program operations in 50
State health departments, 34 ITOs, the District of Columbia, and five U.S. Territories (American Samoa,
Guam, the Northern Mariana Islands, Puerto Rico, and the U.S. Virgin Islands). These 90 WIC SAs
provide services through approximately 10,000 clinic locations including county health departments,
Federally Qualified Health Centers, hospitals and health clinics, Indian Health Service facilities, and other
locations. Most ITOs and Territories along with a few State health departments operate the program at
both the SA and local levels, meaning they conduct SA-level functions and provide services directly to
participants through local service delivery sites, while some State health departments conduct the WIC
SA-level functions and establish contracts or agreements with more than 1,600 LAs for delivery of
program services. LAs have their own budget and operate independently from the SA, while SA-run local
service delivery sites are extensions of SA operations.
1 Financial Information on WIC Nutrition Services and Administrative Costs – General Accounting Office, March, 2000: http://www.gao.gov/assets/230/228748.pdf.
2015 WIC NSA Cost Study ● Final Report PAGE | i
FNS awards grants to SAs in two components: food grants and NSA grants. In each fiscal year, the split
of funds between these grant components starts with determining the amount of NSA funds required to
provide the national guaranteed administrative grant per participant (AGP). By law, the AGP is calculated
using the preceding fiscal year AGP with an inflation adjustment based on the estimated percent increase
in the State and local government purchase index. For FFY 2013, the AGP was $18.11. After determining
the amount required to provide NSA grants to SAs, the remaining funds are used for food grants.
The amount of funds allocated to each SA for both food and NSA grants is determined by FNS through a
funding formula established in Federal WIC regulations. The NSA portion of the funding formula was
last updated in 1999. The funding formula for both grant components factors in prior-year grant levels to
preserve stability in the program and includes other factors that encourage SAs to maximize program
reach. After applying these formulas to the annual appropriation, reallocating unspent prior-year funds,
and distributing contingency funds, WIC SAs received grant funds for FFY 2013 totaling nearly $6.82
billion. Almost three-fourths of these funds ($4.89 billion) were allocated for food costs and the
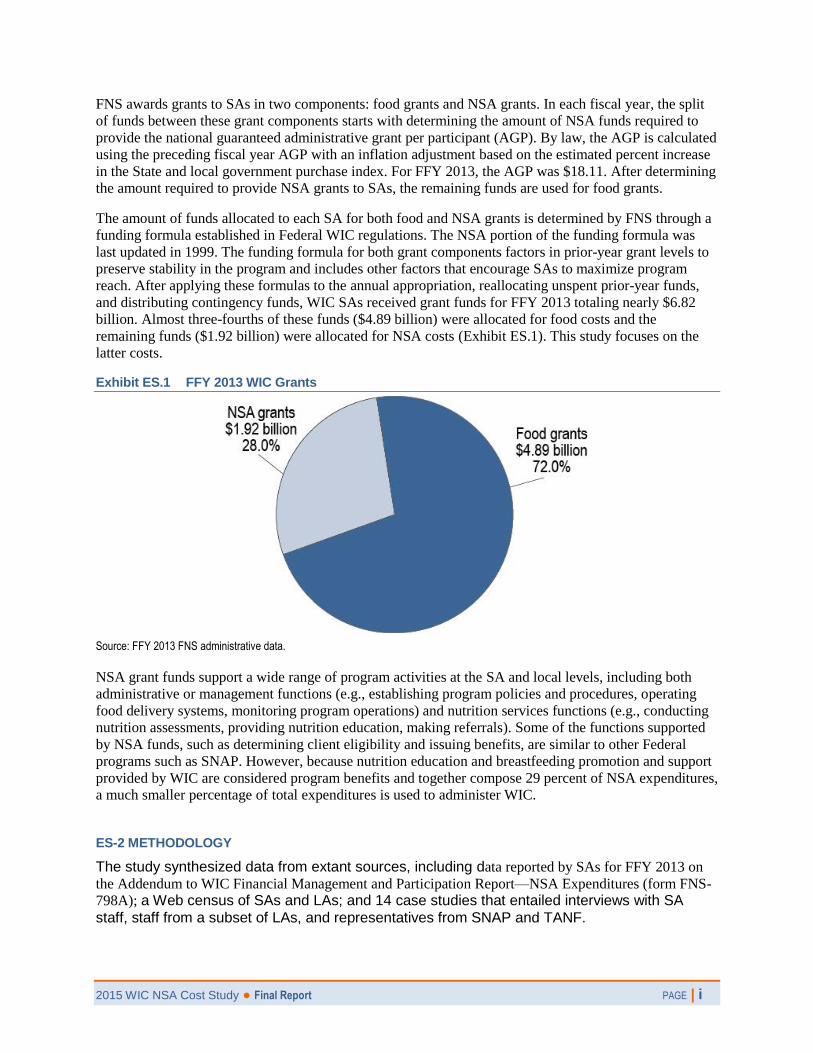
remaining funds ($1.92 billion) were allocated for NSA costs (Exhibit ES.1). This study focuses on the
latter costs.
Exhibit ES.1 FFY 2013 WIC Grants
Source: FFY 2013 FNS administrative data.
NSA grant funds support a wide range of program activities at the SA and local levels, including both
administrative or management functions (e.g., establishing program policies and procedures, operating
food delivery systems, monitoring program operations) and nutrition services functions (e.g., conducting
nutrition assessments, providing nutrition education, making referrals). Some of the functions supported
by NSA funds, such as determining client eligibility and issuing benefits, are similar to other Federal
programs such as SNAP. However, because nutrition education and breastfeeding promotion and support
provided by WIC are considered program benefits and together compose 29 percent of NSA expenditures,
a much smaller percentage of total expenditures is used to administer WIC.
ES-2 METHODOLOGY
The study synthesized data from extant sources, including data reported by SAs for FFY 2013 on
the Addendum to WIC Financial Management and Participation Report—NSA Expenditures (form FNS-
798A); a Web census of SAs and LAs; and 14 case studies that entailed interviews with SA
staff, staff from a subset of LAs, and representatives from SNAP and TANF.

2015 WIC NSA Cost Study ● Final Report PAGE | ii
Extant Data
The monthly WIC Financial Management and Participation Reports (form FNS-798) submitted by SAs
report the number of participants served, food fund obligations and expenditures, and NSA costs. At the
end of each fiscal year, SAs must submit a report summarizing how NSA funds were used. The FNS-
798A reports expenditures at the SA and local levels across four cost categories: program management,
client services, nutrition education, and breastfeeding promotion and support. FNS-798A instructions
define the items to be included in each of the four general categories. These data were supplemented by
backup financial data reported by LAs for preparation of the SAs’ FNS-798A closeout report. Extant SA
and LA financial data was obtained for all 90 SAs and 1,549 LAs and was used extensively to address the
study research objectives.
FNS also provided a LA directory and SA-level information on total, NSA, and food grant amounts;
participation; formula rebate amounts; and other Federal grants received. In addition to providing
financial data on each LA, SAs provided a list of active LAs and average monthly participation for each
LA.
SA and LA Web Surveys
A Web survey of SAs and LAs was conducted between June and November of 2014 to obtain detailed
information about the ways in which WIC NSA funds are spent, including (1) general information about
their service delivery system and changes in program costs; (2) detailed information on SA-level
expenditures broken out by the four cost categories; and (3) information about other sources of funding,
including in-kind contributions. Similar information was provided by LAs; however, these local-level
expenditures were reported in total, not by the four categories. Web survey content was reviewed by the
study’s Peer Advisory Panel and the instruments were pretested, revised accordingly, and then approved
by the Office of Management and Budget (OMB). The design of the survey required respondents to
confirm and validate each individual screen when completed and then confirm final submission when all
screens were completed. Because of this design, each confirmed screen was considered submitted and two
types of respondents were defined: Agencies validating the entire survey are called “full responders,” and
agencies validating at least the demographics screen are called “partial responders.”
SAs were categorized into one of three categories based on their operational structure and were assigned
the appropriate version of the survey:
Centralized SAs operate and staff local service delivery sites (n = 43; 47.8 percent). Most ITOs
and SAs operated by Territories fall into this category. These agencies responded to a version of
the survey that allowed them to provide detail on both State- and local-level program
characteristics and expenditures (called “the combination Web survey”).
Decentralized SAs contract with LAs for local service delivery (n = 38; 42.2 percent). These
agencies responded to a version of the survey that requested detail only on State-level program
characteristics and expenditures (called “the SA Web survey”).
Combination SAs are a hybrid of centralized and decentralized structures (n = 9; 10.0 percent).
These agencies operate and staff some local service delivery sites but also contract with one or
more LAs for the provision of local services. Like centralized SAs, these agencies responded to the
combination Web survey.
The eligible SA-level study population included all WIC SAs (n = 90). For the SA survey, the response
rate including full and partial responders was 86 percent; the response rate including only the full
responders was 74 percent. The eligible LA study population included all 1,556 LAs with which SAs
contract for the provision of local services. For the LA survey, the response rate including full and partial
responders was 80 percent; the response rate including only the full responders was 65 percent.

2015 WIC NSA Cost Study ● Final Report PAGE | iii
Case Study Indepth Interviews
Case studies were conducted with 14 SAs between July and October of 2014 to supplement the financial
information gathered from FNS and WIC SAs and LAs and subsequently gain an understanding of the
various factors that influence WIC costs and changes in these costs over time. Indepth interviews were
conducted with representatives from each of the 14 WIC SAs and with two to three LAs from each State,
where applicable, using interview guides that were approved by OMB. Representatives from the SNAP
and TANF programs in 9 of the 14 States were also recruited to participate in an interview. The purpose
of these interviews was to gather information on organizational structure and staffing, sources of
fundings, factors that influence program costs, and cost allocation methods so that comparisons could be
made between these programs and WIC. Eight SNAP and six TANF representatives participated in
interviews across a total of eight case study States.
ES-3 FINDINGS
Study Population
State agencies operated by a State health department were grouped into one of three size categories based
on the percentage that they contribute to total Federal NSA expenditures: Large SAs contributed more
than 2 percent to total Federal NSA expenditures (n = 14), medium SAs contributed more than 1 percent
and up to 2 percent to total Federal NSA expenditures (n = 16), and small SAs contributed 1 percent or
less to total Federal NSA expenditures (n = 26). ITOs were retained as a separate group, since they have
unique funding and program administration issues (n = 34).
As depicted in exhibit ES.2, although each State agency size grouping includes at least one agency with a
centralized structure and at least two agencies with a combination structure, most small, medium, and
large State agencies have a decentralized structure (57.7, 68.7, and 78.6 percent, respectively). Most
ITOs, on the other hand, have a centralized structure (97.1 percent). Only one ITO has a decentralized
structure.
Exhibit ES.2 WIC SA Size and Structure
Note: SA size was determined based on FFY 2013 NSA expenditures. Large SAs contributed more than 2 percent of total Federal NSA expenditures; medium SAs contributed more than 1 percent and up to 2 percent of total Federal NSA expenditures; small SAs contributed 1 percent or less of total Federal NSA expenditures; and ITOs were retained as a separate group, since they have unique funding and program administration issues. Centralized SAs operate and staff local service delivery sites. Decentralized SAs contract with LAs for local service delivery. Combination SAs are a hybrid of a centralized and decentralized structure.
2015 WIC NSA Cost Study ● Final Report PAGE | iv
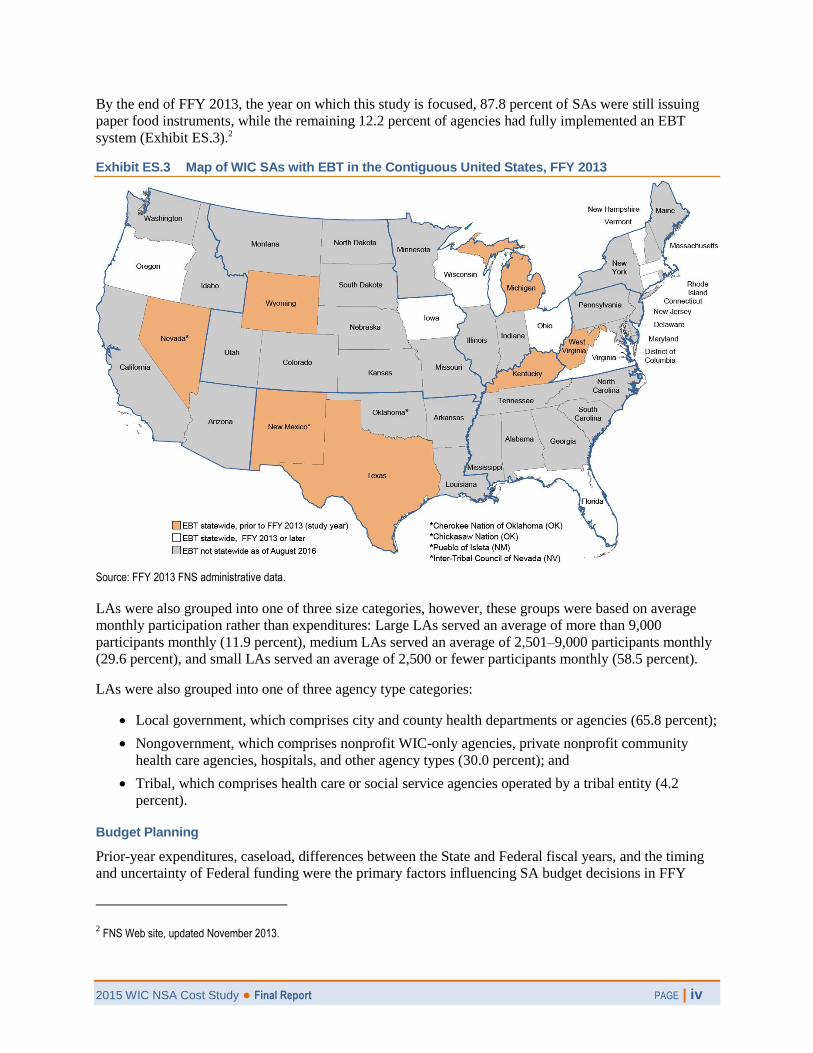
By the end of FFY 2013, the year on which this study is focused, 87.8 percent of SAs were still issuing
paper food instruments, while the remaining 12.2 percent of agencies had fully implemented an EBT
system (Exhibit ES.3).2
Exhibit ES.3 Map of WIC SAs with EBT in the Contiguous United States, FFY 2013
Source: FFY 2013 FNS administrative data.
LAs were also grouped into one of three size categories, however, these groups were based on average
monthly participation rather than expenditures: Large LAs served an average of more than 9,000
participants monthly (11.9 percent), medium LAs served an average of 2,501–9,000 participants monthly
(29.6 percent), and small LAs served an average of 2,500 or fewer participants monthly (58.5 percent).
LAs were also grouped into one of three agency type categories:
Local government, which comprises city and county health departments or agencies (65.8 percent);
Nongovernment, which comprises nonprofit WIC-only agencies, private nonprofit community
health care agencies, hospitals, and other agency types (30.0 percent); and
Tribal, which comprises health care or social service agencies operated by a tribal entity (4.2
percent).
Budget Planning
Prior-year expenditures, caseload, differences between the State and Federal fiscal years, and the timing
and uncertainty of Federal funding were the primary factors influencing SA budget decisions in FFY
2 FNS Web site, updated November 2013.

2015 WIC NSA Cost Study ● Final Report PAGE | v
2013. As confirmed by the interviews, one of the key decisions that SAs make when planning their WIC
budget is the amount needed to support State- and local-level program operations. While the approach to
planning for these costs varies, nearly all SAs plan for and report on NSA costs at both the State and local
levels. The SA survey asked about approaches used to determine funding amounts for local service
delivery operations. As shown in exhibit ES.4, a little more than one-third of the respondents (35.5
percent) indicated that the local services are provided directly by the SA (SA-run), so they do not have
specific allocations for local-level operations (e.g., centralized model). About 27 percent of SA
respondents make the determination through a funding formula, and the remainder use negotiated
contracts or grants or a combination of approaches.
Exhibit ES.4 Percentage of SAs Using Various Methods to Fund Local Services, FFY 2013
Source: SA Web survey. Note: Estimates were weighted to represent the population of SAs.
Because outside sources of fundings can influence budget decisions, the study also examined SA receipt
of State appropriated funding and in-kind support. In FFY 2013, 12 SAs (13 percent) received funds from
their State or Tribal government to support WIC operations. Overall, these State funds made up 9 percent
of the total NSA expenditures for these SAs during FFY 2013. About 25 percent of SAs reported on the
SA survey that they received in-kind support; however, these SAs were unable to estimate its value.
When case study SAs described their budget planning processes, none of them specifically mentioned
having funds appropriated by their State included in their budget plans, nor did they describe factoring in-
kind support into their budgets.
Many of the LA budget planning findings were similar to those for SAs. For example, most of the 24 case
study LAs reported using historical expenditure information along with anticipated expenses in the
upcoming year (e.g., salary increases, changes to benefits, equipment purchases) to plan their budget. All
of these LAs indicated that personnel/staffing costs, including salaries, salary increases, and benefits, are
the biggest factor when planning their budgets. After personnel/staffing costs, the next biggest budget
planning factor described by LAs was rent or facility costs. LAs that completed the LA survey were asked
for information regarding types of funding other than NSA they use for WIC operations, and 68 percent
indicated they do have other funding sources. While the majority of respondents indicated they receive
other Federal WIC funds, especially Breastfeeding Peer Counseling Program funds, about 13 percent
indicated they receive non-Federal locally appropriated (8.9 percent) or non-Federal State-appropriated
(3.5 percent) funds, and more than 20 percent responded that they receive other types of funding. A little
more than half (50.5 percent) of LAs report receiving one or more forms of in-kind contributions.
2015 WIC NSA Cost Study ● Final Report PAGE | vi
NSA Expenditure Levels
Of the $1.92 billion allocated for NSA (including operational adjustment [OA] allocations3, reallocated
FFY 2012 funds, and contingency funds) during FFY 2013, the SAs reported NSA costs totaling $1.88
billion. Approximately 8.7 million participants were served monthly for a mean per-participant monthly
expenditure of $18.14. Overall, 20.6 percent of total NSA expenditures supported State-level operations
and 79.4 percent supported local-level operations.
Average monthly NSA expenditure per participant was also calculated for LAs using expenditure data
provided by their SAs. Expenditure data were available for 1,549, or 99.6 percent, of all LAs that
operated via a contract with an SA during FFY 2013. Overall, LAs spent an average of $14.89 per
participant per month in FFY 2013.4 This value is approximately 82 percent of the national average
monthly expenditure per participant, which is consistent with the percentage of NSA expenditures that
were expended on local-level operations nationally.
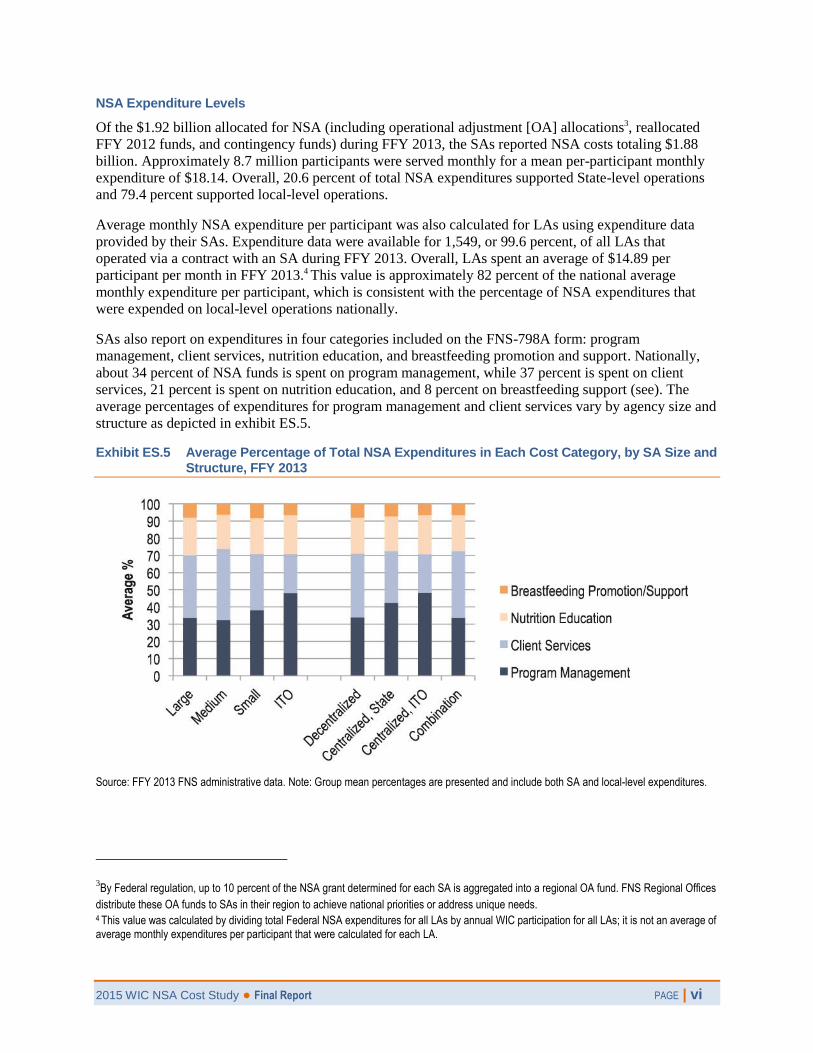
SAs also report on expenditures in four categories included on the FNS-798A form: program
management, client services, nutrition education, and breastfeeding promotion and support. Nationally,
about 34 percent of NSA funds is spent on program management, while 37 percent is spent on client
services, 21 percent is spent on nutrition education, and 8 percent on breastfeeding support (see). The
average percentages of expenditures for program management and client services vary by agency size and
structure as depicted in exhibit ES.5.
Exhibit ES.5 Average Percentage of Total NSA Expenditures in Each Cost Category, by SA Size and Structure, FFY 2013
Source: FFY 2013 FNS administrative data. Note: Group mean percentages are presented and include both SA and local-level expenditures.
3By Federal regulation, up to 10 percent of the NSA grant determined for each SA is aggregated into a regional OA fund. FNS Regional Offices
distribute these OA funds to SAs in their region to achieve national priorities or address unique needs. 4 This value was calculated by dividing total Federal NSA expenditures for all LAs by annual WIC participation for all LAs; it is not an average of average monthly expenditures per participant that were calculated for each LA.
2015 WIC NSA Cost Study ● Final Report PAGE | vii
NSA State Agency-Level Cost Centers
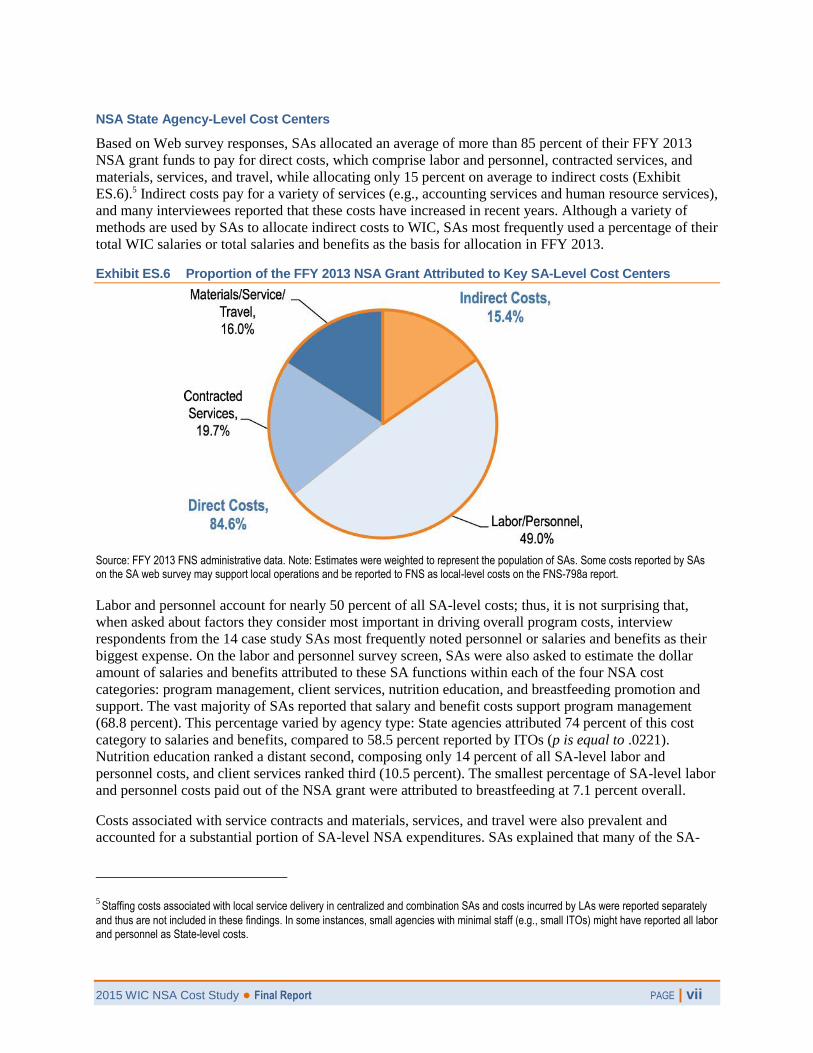
Based on Web survey responses, SAs allocated an average of more than 85 percent of their FFY 2013
NSA grant funds to pay for direct costs, which comprise labor and personnel, contracted services, and
materials, services, and travel, while allocating only 15 percent on average to indirect costs (Exhibit
ES.6).5 Indirect costs pay for a variety of services (e.g., accounting services and human resource services),
and many interviewees reported that these costs have increased in recent years. Although a variety of
methods are used by SAs to allocate indirect costs to WIC, SAs most frequently used a percentage of their
total WIC salaries or total salaries and benefits as the basis for allocation in FFY 2013.
Exhibit ES.6 Proportion of the FFY 2013 NSA Grant Attributed to Key SA-Level Cost Centers
Source: FFY 2013 FNS administrative data. Note: Estimates were weighted to represent the population of SAs. Some costs reported by SAs on the SA web survey may support local operations and be reported to FNS as local-level costs on the FNS-798a report.
Labor and personnel account for nearly 50 percent of all SA-level costs; thus, it is not surprising that,
when asked about factors they consider most important in driving overall program costs, interview
respondents from the 14 case study SAs most frequently noted personnel or salaries and benefits as their
biggest expense. On the labor and personnel survey screen, SAs were also asked to estimate the dollar
amount of salaries and benefits attributed to these SA functions within each of the four NSA cost
categories: program management, client services, nutrition education, and breastfeeding promotion and
support. The vast majority of SAs reported that salary and benefit costs support program management
(68.8 percent). This percentage varied by agency type: State agencies attributed 74 percent of this cost
category to salaries and benefits, compared to 58.5 percent reported by ITOs (p is equal to .0221).
Nutrition education ranked a distant second, composing only 14 percent of all SA-level labor and
personnel costs, and client services ranked third (10.5 percent). The smallest percentage of SA-level labor
and personnel costs paid out of the NSA grant were attributed to breastfeeding at 7.1 percent overall.
Costs associated with service contracts and materials, services, and travel were also prevalent and
accounted for a substantial portion of SA-level NSA expenditures. SAs explained that many of the SA-
5 Staffing costs associated with local service delivery in centralized and combination SAs and costs incurred by LAs were reported separately
and thus are not included in these findings. In some instances, small agencies with minimal staff (e.g., small ITOs) might have reported all labor and personnel as State-level costs.

2015 WIC NSA Cost Study ● Final Report PAGE | viii
level costs for contracts, materials and services are for purchases or services to support local-level
operations.
NSA Local-Level Cost Centers
According to the survey, on average, LAs allocated 90.8 percent of their FFY 2013 NSA grant funds to
pay for direct costs, which comprise labor and personnel, contracted services, materials, services, and
travel, while only 9.2 percent on average was allocated to indirect costs. On average, LAs operated by
local government entities allocated less of their grant to direct costs compared to nongovernment LAs
(89.9 percent and 93.0 percent, respectively; p is less than .001). Tribal LAs allocated 88.6 percent of
their grant to direct costs, which was not statistically significantly different from the other agency types.
Labor and personnel account for the vast majority of all costs associated with local service delivery (80.7
percent). Subsequently, it is not surprising that, when asked about factors they consider most important in
driving overall program costs, interview respondents from the 24 case study LAs most frequently noted
salaries, benefits, and the need for additional staff as their biggest expense in an effort to maintain a
skilled and experienced staff. Overall, 42.6 percent of LAs reported sharing staff with other programs,
Staff sharing with other programs has the potential to influence an agency’s labor and personnel costs.
For example, an agency that requires only a partial FTE to support certain operational functions (e.g.,
accounting, receptionist) may be able to save on labor and personnel costs if, by sharing these types of
staff, it can more efficiently to meet program needs. Indeed, survey data indicate that LAs that share staff
with other programs allocated a smaller percentage of their total FFY 2013 costs to labor and personnel
compared to agencies that do not (78.5 versus 82.4 percent, respectively; p is equal to .0014).
Indirect costs ranked second out of the four major cost centers in terms of total NSA expenditures,
accounting for approximately 9 percent of all local-level costs reported by LAs on the Web survey.
Overall, 65.4 percent of LAs reported charging indirect costs to their NSA grant. The percentage of
agencies reporting indirect costs did not vary by agency type but varied significantly by agency size (p is
less than .001). Approximately 78 percent of large LAs charge indirect costs to their WIC grant,
compared to 70.4 percent of medium agencies and 59.6 percent of small agencies. Costs associated with
materials, services, and travel and contracted services accounted for an additional 8.1 percent and 2.0
percent of local-level costs, respectively.
Factors Influencing NSA Costs
The study sought to understand the influence of various factors on NSA costs in recent years or in FFY
2013 specifically, including factors SAs and LAs associated with increased or decreased costs, use of
technology, economies of scale, and infant formula rebates.
When asked about factors that have increased SA-level staffing costs since FFY 2010, increases in fringe
benefit costs and staff salaries were the most common responses, reported by 65.1 percent and 61.9
percent of SAs, respectively. A majority of SAs also experienced an increase in SA-level costs associated
with facilities and support services (e.g., facility space, telecommunications) and program operations
(e.g., indirect costs, vendor management costs), 80 percent and 72.3 percent, respectively. Factors that
had decreased SA-level costs were less commonly reported, perhaps indicating that the majority of SAs
saw their costs increase or stay the same between FFY 2010 and FFY 2013.
Results for LAs were somewhat similar. Increases in fringe benefit costs and staff salaries were the
factors LAs most commonly associated with their increased staffing costs responses, reported by 81.1
percent and 77.4 percent of LAs, respectively. Likewise, more than 86 percent of LAs experienced an
increase in LA-level costs associated with facilities and support services, and nearly 66 percent reported
that one or more factors related to program operations contributed to an increase in their overall costs.
Like SAs, LAs reported fewer factors that contributed to decreased staffing and overall LA-level costs.

2015 WIC NSA Cost Study ● Final Report PAGE | ix
Still, approximately 30 percent of LAs indicated that decreases in program participation have decreased
their local-level costs since FFY 2010, which corresponds with the 30 percent of SAs that reported a
decrease in costs due to declining program participation. This is an indication that a large portion of SAs
and LAs have reduced their NSA costs in response to lower demand for program benefits and services.
Based on information gleaned through the survey, it is difficult to determine whether the implementation
of more sophisticated MIS and EBT has increased or decreased SA and LA need for NSA funds to
support these segments of program operations. It is clear from the case study interviews, however, that
SAs are concerned about the proportion of their grant that is currently being used or that may need to be
used in the future to support MIS and EBT implementation and maintenance. When asked about factors
they consider most important in driving their overall program costs and how much control they have over
these factors, 8 of the 14 case study SAs mentioned costs associated with MIS or EBT or both. The
concerns raised by respondents were varied but pervasive and included issues related to procuring
contractors and budgeting for large MIS and EBT expenditures without knowing well enough in advance
whether their SA will receive other Federal or OA funds to support these projects. If not, SAs must react
quickly and cover these costs with their NSA grant.
Because the size of an SA or LA or other factors associated with how the SA or LA operates may
influence its cost per participant, statistical models were used to explore the influence of economies of
scale. Economies of scale generally occur when there are large fixed costs that must be incurred
regardless of agency size. Diseconomies of scale generally occur when increasing size leads to
increasingly complex management requirements. Only the number of LAs within a State had any impact
on economies of scale. Results show that there are initially strong economies of scale for SAs, but there
are diseconomies of scale after SAs exceed 35 LAs. In SAs with a large number of LAs, it is possible that
there are more LAs of a smaller size and that this factor is driving the result rather than the total number
of LAs. With regard to LAs, the total caseload of the LA had a statistically significant impact on cost per
participant. However, the estimated effects are very small (only pennies for every additional 1,000
participants). Therefore, size of caseload is not an important driver of LA cost per participant.
Finally, in FFY 2013, approximately $1.88 billion in rebates were received by SAs, mostly from infant
formula contracts, which represents a substantial reduction to the Program’s annual food expenditures. In
other words, the Program issues a total of $6.38 billion in food benefits, but $1.88 billion of these costs
are offset by the rebates. When the Program’s gross food costs (pre-rebate) are considered, the proportion
of WIC dollars allocated to NSA changes substantially, from nearly 30 percent to less than 23 percent.
Moreover, if the 559 million NSA dollars allocated to nutrition education and breastfeeding promotion
and support—additional benefits of the Program—are shifted from an “administrative cost” to a “program
benefit cost,” the proportion of WIC dollars allocated for administrative expenses is further reduced to
approximately 16 percent.
Comparison to SNAP and TANF Costs
The study sought to examine whether and how WIC administrative expenditures compare to those from
two other Federal programs: SNAP and the TANF block grant. TANF is designed to help low-income
families achieve self-sufficiency. States receive block grants from the U.S. Department of Health and
Human Services’ Administration for Children and Families (ACF) to design and operate programs that
accomplish one or more of the purposes of TANF. SNAP is the largest program in the domestic hunger
safety net and provides a monthly food benefit to eligible participants and other services to support
healthy eating. Information gleaned from financial reports submitted by States to the Federal sponsoring
agencies and case studies conducted in a small number of States were used for this assessment. While
differences in cost reporting and variations in program mission and operations make it difficult to
compare costs for WIC, SNAP, and TANF, some general observations about the differences in
administrative costs between these programs can be made.
2015 WIC NSA Cost Study ● Final Report PAGE | x
For example, SNAP is more similar to WIC than is TANF because both programs offer food benefits to
low-income individuals and families, yet SNAP allocates a much smaller percentage of funds to program
non-food expenditures compared to WIC. When making this comparison, however, it is important to
consider that most of SNAP’s non-food expenditures support administration of the program, such as
certification of eligible clients, quality control measures, employment and training costs, and other
administrative requirements; whereas for WIC, non-food expenditures include the costs of providing
nutrition education, breastfeeding support, and referrals for health care and other services. Again, these
differences make it challenging to compare the true administrative costs of these programs.
TANF, on the other hand, allocates a much larger percentage of its funds to non-cash expenditures; but
like WIC, some of these “administrative” expenditures support non-cash benefits such as employment
support, tax credits, child care assistance, support for new fathers, programs to prevent out-of-wedlock
pregnancy, and transportation services for clients. Due to the way financial data are reported to ACF, it
was not possible to isolate or separate out costs that may be used to support these services. Moreover, the
specific services offered through TANF vary substantially by State.
The study also found that cost efficiencies and use of technology in SNAP appear to reduce its labor and
other costs compared to WIC and TANF. WIC and most TANF programs require onsite certification,
where a client must present themselves at an office and complete a certification process. SNAP has
moved away from this process, allowing Web- and phone-based application processes, using call centers,
and distributing workloads to ensure a timely application process and efficient use of staff. Respondents
in the case study States report that these efforts have significantly reduced the costs of administering the
program and made it more customer friendly.
Joint applications from SNAP, TANF, and Medicaid also help to reduce the financial burden and
duplication of effort for all three programs. Instead of having to complete an application for each of the
three programs, an applicant can complete a consolidated application, and costs are distributed across the
three programs based on an approved cost allocation methodology. This consolidated application system,
combined with employee time tracking, makes it easy to allocate costs across programs. Although WIC
may not benefit to the same degree, it is able to avoid costs associated with collecting and evaluating
income information for approximately 70 percent of its program applicants through adjunctive eligibility.
Finally, at least in the case study States, it appears that the Patient Protection and Affordable Care Act
(ACA) has provided enhanced funding for States to improve their technology and MIS with little or no
cost to TANF or SNAP. The opportunity provided through ACA to update computer systems using
Medicaid funds in these States has benefited all three programs. ACA-related enhancements were not
cited by WIC programs during case study interviews.
2015 WIC NSA Cost Study ● Final Report PAGE | 1
Chapter I: Introduction and Overview
The purpose of this report is to provide the U.S. Department of Agriculture’s (USDA) Food and Nutrition
Service (FNS) with findings from the Special Supplemental Nutriton Program for Women, Infants, and
Children (WIC) Nutrition Services and Administration (NSA) Cost Study. The purpose of the WIC NSA
Cost Study is to provide an updated assessment of the amounts and categories of costs charged to WIC
NSA grants and the variation of these costs among State agencies/Indian Tribal Organizations (ITOs) and
local agencies. The last national assessment of WIC NSA costs was completed by the U.S. Government
Accountability Office (GAO) and focused on costs associated with operating WIC during Federal fiscal
year (FFY) 1998.6 Since that time, many changes have occurred, including growth in WIC participation,
expanded use of technology including electronic benefits transfer (EBT) for food benefit delivery and use
of management information systems (MIS) to create and manage participant records, implementation of
updated WIC food packages and increased breastfeeding and support services, to name just a few. To
provide updated information on NSA costs, FNS contracted with Altarum Institute to conduct the WIC
NSA Cost Study. The study addresses four objectives:
OBJECTIVE 1: Gather and analyze data on the NSA grant system to obtain a detailed and accurate
picture of average NSA funds and costs at the national, State agency/ITO, and local levels.
OBJECTIVE 2: Determine the impact on NSA costs of the increased use of technology and infant
formula rebates.
OBJECTIVE 3: Determine the extent and effect of economies of scale between larger and smaller State
agencies/ITOs and local agencies (LAs).
OBJECTIVE 4: Establish comparisons between WIC administration costs and administration costs in
similar Federal programs.
This report presents the results of analysis of several data sources including data reported by State
agencies/ITOs (referred to collectively as SAs) for FFY 2013 on the Addendum to WIC Financial
Management and Participation Report—NSA Expenditures, data obtained from SAs on expenditures of
local agencies that provided WIC services via a contract with the SA in FFY 2013 (referred to as LAs), a
survey of SAs and LAs concerning FFY 2013 NSA costs and related topics, and interviews with 14 case
study SAs and 24 of their affiliated LAs.
A. Program Background and Funding Overview
WIC is a federally funded nutrition assistance program administered by FNS that provides supplemental
foods; nutrition education, breastfeeding support, and referrals for health care and other services to low-
income pregnant, breastfeeding, and postpartum women; infants; and children up to age 5 who are at
nutritional risk. FNS provides annual cash grants that in FFY 2013 (the reference year for the this study)
supported program operations in 50 State health departments, 34 ITOs, the District of Columbia, and five
U.S. Territories (American Samoa, Guam, the Northern Mariana Islands, Puerto Rico, and the U.S. Virgin
6 Financial Information on WIC Nutrition Services and Administrative Costs – General Accounting Office, March, 2000: http://www.gao.gov/assets/230/228748.pdf.

2015 WIC NSA Cost Study ● Final Report PAGE | 2
Islands). These 90 SAs provide services through approximately 10,000 clinic locations including county
health departments, community centers, hospitals and health clinics, Indian Health Service facilities, and
other locations. Most State health departments conduct WIC SA-level functions and establish contracts or
agreements with more than 1,600 local government and nongovernment agencies, or LAs, for delivery of
program services. A few State health departments and most ITOs and Territories operate the program at
both the SA and local levels, meaning they conduct SA-level functions and provide services directly to
participants through local service delivery sites. LAs have their own budget and operate independently
from the SA, while SA-run local service delivery sites are extensions of SA operations.
WIC is a discretionary Federal program with annual appropriations made through the Federal budget act.
In FFY 2013, the appropriation was subject to budget recisions and a sequester, which reduced the
amount available to operate the program by nearly 7.8 percent to a total of $6.52 billion. However,
unspent funds from the prior fiscal year and a WIC contingency fund supplemented the appropriation to
reach a total of $6.82 billion available in grants to SAs to operate the program.7
Grants are provided to SAs in two components: food grants and NSA grants. NSA grant funds support a
wide range of program activities at the SA and local levels, including both administrative or management
functions (e.g., establishing program policies and procedures, operating food delivery systems,
monitoring program operations) and nutrition services functions (e.g., conducting nutrition assessments,
providing nutrition education, making referrals). In each fiscal year, the split of funds between these grant
components starts with determining the amount of NSA funds required to provide the national guaranteed
administrative grant per participant (AGP). The AGP is calculated according to parameters in the Child
Nutrition Act of 1966 using the preceding fiscal year’s AGP with an inflation adjustment based on the
estimated percent increase in the State and local government purchase index.8 For FFY 2013, the AGP
was $18.11. After determining the amount required to provide NSA grants to SAs, the remaining funds
are used for food grants.
The amount of funds allocated annually to each SA for both food and NSA grants are determined by FNS
through a funding formula established in Federal WIC regulations. The NSA portion of the funding
formula was last updated in 1999. The funding formula for both grant components factor in prior-year
grant levels to preserve stability in the program and include other factors that encourage SAs to maximize
program reach. Both the food and NSA portions of the funding formula have three components shown in
exhibit 1.1.
Exhibit 1.1 WIC Food and NSA Funding Formulas
Food funding formula components:
Prior-year grants
Inflation (80 percent of remaining funds; based on thrifty food plan; 2013 = 3.31 percent)
Fair share/growth (20 percent of remaining funds)
NSA funding formula components:
Base grant (prior-year grants before operational adjustment [OA] decisions)
Fair share target (participation based; economy of scale and salary factors considered)
Regional OA funding
7 Contingency funds are funds maintained by the Program that can be spent in any year. After the contingency fund was depleted in FFY 2013, Congress provided $125 million to be held in contingency in the FFY 2014 appropriations law (P.L. 113-76). 8 7 C.F.R. §246.16 (c) (2).

2015 WIC NSA Cost Study ● Final Report PAGE | 3
After applying these formulas to the appropriation, reallocating unspent prior-year funds, and distributing
contingency funds, WIC SAs received grant funds for FFY 2013 totaling nearly $6.82 billion. Almost
three-fourths of these funds ($4.89 billion) were allocated for food costs, and the remaining funds ($1.92
billion) were allocated for NSA costs (Exhibit 1.2).9
Exhibit 1.2 FFY 2013 WIC Grants
Source: FFY 2013 FNS administrative data.
The $4.89 billion allocated for food costs, however, does not reflect the actual total value of foods issued
by WIC in FFY 2013, because it does not account for the $1.88 billion that SAs received in manufacturer
rebates. To maximize the available food funds, most WIC SAs are required to establish competitively bid
rebate contracts with infant formula manufacturers. The SA issues the contract brand of infant formula
and receives a rebate for each can of the contract brand of infant formula purchased by WIC participants.
Some SAs have additional rebate contracts for infant foods as well as formula. In FFY 2013,
approximately $1.88 billion in rebates were received by SAs, mostly from infant formula contracts,
substantially reducing SAs’ annual food expenditures; therefore, the actual total value of foods issued by
WIC was close to $6.77 billion. However, because the rebate contracts are for specified periods, the
amount of the rebates may increase or decrease periodically, which affects both food and NSA grant
levels and, in turn, the amount of the Federal WIC appropriation needed to serve all eligible applicants
seeking program benefits.
i. NSA grant requirements
Federal regulations state, “In general, costs necessary to the fulfillment of Program objectives are to be
considered allowable costs.”10 The two types of NSA costs described in the regulations are direct and
indirect costs. Direct costs are those that can be identified specifically with WIC-related activities, such as
salaries for staff who perform SA program functions staff who provide WIC services at the local level.
Indirect costs are for services that benefit the program but are not easily linked to specific WIC functions
(e.g., salaries for staff providing accounting services in an agency for both WIC and non-WIC programs).
SAs follow cost principles issued by the Federal Office of Management and Budget (OMB) for charging
costs to WIC. Indirect costs must be supported by a cost allocation plan approved by the cognizant
9 U.S. Department of Agriculture, Food and Nutrition Service. WIC Funding and Program Data. Available at: http://www.fns.usda.gov/wic/wic-funding-and-program-data. Accessed April 22, 2016. 10 7 C.F.R. §246.14 (a).

2015 WIC NSA Cost Study ● Final Report PAGE | 4
agency, which, for most health departments, is the Department of Health and Human Services. Typically,
the amount of indirect costs that SA or local WIC agencies are allowed to charge to NSA grant is based
on an indirect cost rate that is expressed as a percentage of specific direct expenditures, such as salaries
and benefits.
As noted previously, NSA grant funds are used to support a wide range of program activities at the SA
and local levels, including both administrative or management functions and nutrition services functions.
Examples of the program functions that are implemented at the SA and local levels using NSA funds are
shown in exhibit 1.3. Some of the functions supported by NSA funds are similar to other Federal
programs such as the Supplemental Nutrition Assistance Program (SNAP). For example, NSA funds are
used for SA and local functions associated with determining client eligibility and issuing benefits. Unlike
other Federal programs, there are WIC activities supported by the NSA grant that are associated with
providing key program services of nutrition counseling, breastfeeding services, and referrals.
Exhibit 1.3 WIC Functions Performed With NSA Funds
State level Develop and implement State-specific policies and
procedures for eligibility determination, nutrition risk assessment, nutrition education, breastfeeding support, referrals, and other program services
Establish contracts with LAs to provide program services and/or set up and operate local service delivery sites
Train local staff and monitor service delivery in local sites
Review and select food products for the State-authorized food list
Procure and manage an infant formula rebate contract
Authorize, train, and monitor retail food vendors or oversee the operations of alternate food delivery systems
Develop, implement, and maintain information systems and technology used to provide services, record information about program participants, and track issuance and redemption of all food benefits provided to participants
Provide administrative hearings for participants and vendors
Manage the WIC grant and produce required reports
Local level
Set up and operate local service sites
Hire, train, and monitor staff to provide program services
Conduct eligibility determinations of program applicants
Provide nutrition counseling and education
Identify referral resources and refer participants to available services
Offer breastfeeding promotion and support services
Prescribe supplemental foods
Issue food benefits to eligible participants
Maintain records of certified participants and the services and benefits they receive
Conduct vendor monitoring activities
Assist with voter registration
There are specific regulatory requirements for use of NSA funds to provide nutrition education and
breasfeeding promotion and support for participants. Each year, SAs must spend “an aggregate amount
that is not less than the sum of one-sixth of the amount expended by the SA for costs of NSA and an
amount equal to its proportionate share of the national minimum expenditure for breastfeeding promotion

2015 WIC NSA Cost Study ● Final Report PAGE | 2
and support activities.”11 If a SA fails to meet the requirement for nutrition education and breastfeeding
expenditures, FNS will issue a claim for the difference that must be paid with State/non-Federal funds. In
additon to the requirement for nutriton education and breastfeeding expenditures, there is an overall
performance standard governing NSA expenditures.12 Per Federal regulations, FNS will reduce an SA’s
NSA grant for the next fiscal year if the SA’s current year expenditure per participant is more than 10
percent higher than its NSA grant per participant. To avoid the grant adjustment, SAs may submit “good-
cause” justifications to FNS for exceeding the limit.
Federal regulations allow for SAs to “transfer” or “carry over” a small percentage of NSA funds between
two fiscal years. For example, a SA may spend forward an amount equal to 3 percent of its total grant
(NSA plus food grant) of unused NSA funds into the next fiscal year. Conversely, SAs may back spend
up to 1 percent of its NSA grant to cover either NSA or food overexpenditures in the prior fiscal year.
FNS periodically reallocates unspent prior-year grant funds (both NSA and food funds) during the
subsequent fiscal year, thereby increasing the total amount funds available for SA grants.
While NSA funds may be used for any allowable program costs, SAs may receive a portion of their NSA
grant for specific projects or activities. By Federal regulation, up to 10 percent of the NSA grant
determined for each SA is aggregated into a regional operational adjustment (OA) fund13. FNS Regional
Offices distribute these OA funds to SAs in their region to achieve national priorities or address unique
needs.
ii. Other program funding
In addition to the NSA grants and OA funds, SAs may receive Federal funds that are targeted for specific
WIC purposes or services as established in the WIC appropriation. For example, in recent years, Congress
has appropriated funds specifically for implementation of EBT for WIC food delivery. This funding is
directed for use by SAs for costs associated with planning and implementing EBT in accordance with a
mandate established in the Healthy Hunger Free Kids Act of 2010,14 which requires all SAs to implement
EBT for issuing WIC food benefits by 2020. Examples of additional appropriated funding that SAs may
receive are shown in exhibit 1.4.
Exhibit 1.4 Additional Federal WIC Funding
Breastfeeding Peer Counseling Program grants to hire peer counselors to provide breastfeeding support are allocated to SAs via non-competitive, 2-year grants. To receive the funds, each participating SA agrees to implement a peer counseling program based on the Loving Support Peer Counseling model. ($55 million was awarded nationally in FFY 2013);
Funding to support upgrades to or replacement of WIC MIS is awarded annually to SAs that apply and meet the funding requirements (approximately $14 million was awarded to SAs in FFY 2013);
Funding to support EBT planning and implementation is awarded annually to SAs that apply and meet the funding requirements (approximately $30.5 million was awarded in FFY 2013);
Special project grants to implement specific initiatives, such as new methods for nutrition education are awarded annually to SAs that apply and meet the funding requirements (approximately $150,000); and
General infrastructure grants to support a variety of one-time program needs over a 2-year period are awarded to SAs that apply and meet the funding requirements (awarded as part of MIS and EBT grants in FFY 2013).
Lastly, a few SAs receive State funds for WIC services, and some LAs receive local non-Federal funding
to support WIC services. SAs also occasionally have the opportunity to receive other Federal funds, such
11 7 C.F.R. §246.14 (c) (1). 12 7 C.F.R. §246.16 (e) (2). 13 7 C.F.R. §246.16(b)(2)(iv). 14
Pub. L. 111–296—DEC. 13, 2010, Section 352 (d).

2015 WIC NSA Cost Study ● Final Report PAGE | 3
as the American Recovery and Reinvestment Act (“stimulus funds”). These State-appropriated, non-
Federal local, or other Federal funding sources may be one-time or ongoing and may be targeted for
specific activities or available for general WIC operations.
iii. Allocation of NSA funds to SA and local levels
As previously explained, most State health departments that administer the program perform SA-level
functions from centralized or regionalized offices and allocate NSA funds to LAs to provide services to
participants (decentralized agencies), while some SAs operate by conducting all program functions,
including SA-level management functions and local-level direct service delivery functions (centralized
agencies). In some cases, SAs operate through a hybrid approach (combination agencies). Regardless of
the operational model, SAs must determine how to distribute the NSA grant funds to conduct both SA-
and local-level functions. SAs use different approaches for making these decisions with some creating
local funding formulas, some using historical expenditure experience and trends such as caseload and
others using budgets submitted by LAs.
iv. Reporting of NSA grant expenditures
Monthly WIC Financial Management and Participation Reports (form FNS-798) submitted by SAs
report data on the number of participants served, food fund obligations and expenditures, and NSA costs.
At the end of each fiscal year, SAs must submit a report summarizing how NSA funds were used. The
report, called form FNS-798A, Addendum to WIC Financial Management and Participation Report: NSA
Expenditures, encompasses reporting of expenditures at the SA and local levels across four cost
categories: program management, client services, nutrition education, and breastfeeding promotion and
support. Exhibit 1.5 includes a description of each cost category.
Exhibit 1.5 NSA Reporting Cost Categories
PROGRAM MANAGEMENT: All costs (direct or indirect) generally considered to be overhead or management costs. General management costs include those costs associated with program monitoring, prevention of fraud, general oversight, and food instrument accountability. Examples include WIC administrative salaries/benefits and other costs necessary to conduct outreach, food instrument reconciliation, monitoring and payment, and vendor monitoring; to keep administrative records; and to prepare and maintain fiscal and program management reports. Other examples include general management clerical support, payroll and personnel systems, accounting and bookkeeping, audits, and other financial services and legal services.
CLIENT SERVICES: All costs expended to deliver food and other client services and benefits. Examples include WIC staff salaries/benefits and medical supplies and equipment necessary to conduct diet and health assessments required in the certification process; salaries/benefits; and other costs necessary to refer clients to other health care and social services, to coordinate services with other programs, to participate in activities that promote a broader range of health and social services for participants, and to conduct and participate in surveys/studies that evaluate the impact of WIC on its participants.
NUTRITION EDUCATION: All costs directly related to general nutrition education. Examples include salaries/benefits; travel and training costs for WIC staff who plan or conduct nutrition education; costs to develop/procure, print, and distribute nutrition education materials; costs of equipment required to conduct nutrition education training; costs of interpreter and translator services to facilitate training; and costs associated with evaluating and monitoring nutrition education.
BREASTFEEDING PROMOTION AND SUPPORT: All costs expended for promotion and support of breastfeeding. Examples include salaries/benefits of WIC staff who plan or conduct educational and other services to promote or support breastfeeding; salaries/benefits of peer counselors and individuals hired to undertake home visits and other actions to encourage continuation of breastfeeding; costs to develop/procure, print, and distribute educational materials related to breastfeeding promotion and support; and clinic space devoted to breastfeeding educational and training activities, including space set aside for nursing.
NOTE: The examples listed for each cost category are not all-inclusive. These examples are merely intended to illustrate that when costs are reported by category, SAs must prorate salaries/benefits, data processing, supplies and equipment, communications, postage and freight, travel, rent and utilities, and more to the applicable functional category. Source: Instructions for FNS-798A, Addendum to WIC Financial Management and Participation Report.

2015 WIC NSA Cost Study ● Final Report PAGE | 4
The FNS-798A reports also allow for reporting on the total NSA grant amount used for indirect costs and
for expenditures of State-appropriated funds in the four cost categories, when applicable. Because SAs
have different operational models and each SA has a unique budgeting, financial management, and
accounting system, reporting of SA- and local-level expenditures and utilization of NSA funds across the
four cost categories may not be consistent. Furthermore, in SAs that contract with LAs, the reporting of
local-level expenditures in the four cost categories is affected by LA financial management and
accounting processes. Even with these limitations, the FNS-798A reports provide useful information
regarding how NSA funds are expended, and they enable FNS to assess for SA compliance with the
nutrition education and breastfeeding promotion and support expenditure requirement and the NSA
expenditure performance standard. These reports also provide a source for tracking NSA expenditures
supported by State WIC funds.
B. Prior Studies and Reports Related to WIC NSA Costs
There have been few studies focused on NSA costs. Prior to the year 2000, only a small number of
surveys and case studies presented limited information on costs associated with operating WIC. The most
comprehensive assessment on this topic was conducted by GAO (known as the U.S. General Accounting
Office at the time of the study; now known as the Government Accountability Office) in response to a
requirement in the William F. Goodling Child Nutrition Reauthorization Act of 1998 (P.L. 105-336). This
act, which reauthorized WIC, directed GAO to assess various cost aspects of WIC NSA. The first report,
Financial Information on WIC Nutrition Services and Administrative Costs, published by GAO in March
2000, provided information for FFY 1998 describing (1) the Federal and non-Federal sources and
amounts of funding and in-kind contributions received by State agencies, ITOs, and LAs for WIC NSA;
(2) the amount and type of NSA expenditures made by these agencies; and (3) the extent to which FNS
identified questionable NSA expenditures during their evaluations of these activities.15 To obtain the data
for the first two objectives, GAO used surveys completed by 55 SAs operating in the 50 States, the
District of Columbia, American Samoa, Puerto Rico, and the U.S. Virgin Islands; 25 ITOs; and 1,400
LAs.
Key findings in this GAO report pertaining to NSA costs include the following:
State agencies and ITOs responding to the survey received Federal NSA funds totaling about $1.08
billion in FFY 1998.
State agencies, ITOs, and LAs reported receiving another $57 million in FFY 1998 for WIC NSA
from non-Federal sources, mostly from State and local governments.
In addition to these funds, some State agencies and most ITOs and LAs reported receiving in-kind
contributions to help deliver WIC services, most often in the form of facilities, utilities, and
computers and maintenance.
About 75 percent of NSA expenditures ($846 million) in FFY 1998 were for local program
operations with the balance used for SA-level operations.
The vast majority of expenditures was for direct costs (91 percent for State agencies, 95 percent for
the LAs, and 88 percent for the ITOs).
Salary and benefit costs accounted for the largest percentage of direct costs for State agencies and
LAs.
15 Financial Information on WIC Nutrition Services and Administrative Costs – General Accounting Office, March, 2000: http://www.gao.gov/assets/230/228748.pdf.
2015 WIC NSA Cost Study ● Final Report PAGE | 5
A second report from the series of GAO assessments described findings from cases studies conducted at
six LAs on Activities and Use of Non-program Resources at Six WIC Agencies.16 This report, published in
September 2000, concluded, “The six WIC agencies we studied used a variety of nonprogram resources
to deliver WIC services, the most common being in-kind contributions from their sponsoring
organizations. The share of costs covered by nonprogram resources at the six agencies ranged from about
$0.20 to $0.02 for each dollar in costs covered with program funds.”
GAO conducted a third related study, WIC Faces Challenges in Providing Nutrition Services, published
in December 2001, aiming to (1) describe the challenges that SAs and LAs face in providing nutrition
services and administering the program and (2) identify approaches to address these challenges.17
Methods used to conduct this study during 2000–2001 included review of WIC-related literature; reports
and program policies; analysis of previously conducted surveys; case studies and other data collection
efforts; and stakeholder interviews with Federal, State, and local program administrators and
representatives from external groups. The report summarizes six key challenges WIC faces in delivering
high-quality nutrition services:
Coordinating its nutrition services with health and welfare programs undergoing considerable
change,
Responding to health and demographic changes in the low-income population that it serves,
Recruiting and keeping a skilled workforce,
Improving the use of information technology to enhance service delivery and program
management,
Assessing the effect of nutrition services, and
Meeting increased program requirements without a corresponding increase in funding.
The report also describes 16 approaches that could address aspects of the major challenges facing the
program. Four of the approaches focus on funding, four relate to performance or impact measurement,
three address staffing issues, three relate to information technology, and two relate to the provision of
nutrition services.
Of these three GAO reports, the report called Financial Information on WIC Nutrition Services and
Administrative Costs presents findings that are most relevant for comparison with the results of the WIC
NSA Cost Study. Again, the purpose of the current study is to provide an updated assessment of the
amounts and categories of costs charged to WIC NSA grants and the variation of these costs among SAs
and LAs.
C. Organization of the Report
Chapters II through X describe the study methods and findings for the WIC NSA Cost Study. Outlined
below is a brief summary of each chapter:
Chapter II describes data sources and data collection methods that were employed during the study,
as well as the approach to quantitative and qualitative data analysis.
Chapter III briefly describes key attributes of SAs and LAs.
Chapter IV describes the budget planning process employed by SAs, including how funds are
allocated to SA- and local-level operations, planned for key program functions and costs, and
16 Activities and Use of Non-program Resourcs at Six WIC Agencies – General Accounting Office, September, 2000: http://www.gao.gov/assets/230/229641.pdf. 17 WIC Faces Challenges in Providing Nutrition Services - General Accounting Office, December, 2001: http://gao.gov/assets/240/233023.pdf.

2015 WIC NSA Cost Study ● Final Report PAGE | 6
influenced by the receipt of State-appropriated funds and in-kind contributions. The LA budget
planning process is also described, including factors considered when planning their annual budget
and how funding received outside of WIC influences their budget and planning.
Chapter V provides a high-level summary of NSA expenditures, including the amount or
percentage of funds expended on SA- and local-level operations, across the four cost categories,
and on each participant per month.
Chapter VI describes costs reported by SAs in each of four key cost centers: labor and personnel;
contracted services; materials, services, and travel; and indirect.
Chapter VII describes costs reported by LAs in each of these four key cost centers.
Chapter VIII describes factors SAs and LAs attribute to changes in their costs between FFY 2010
and FFY 2013 and examines factors that may influence NSA costs, using a data-driven approach
(bivariate analysis and modeling).
Chapter IX provides an overview of SNAP and the Temporary Assistance for Needy Families
program and describes important similarilities and differences between these programs and WIC.
Chapter X provides a summary of study findings and conclusions and describes lessons learned
through implementation of the WIC NSA Cost Study, as well as opportunities for future research.
Supplemental materials are provided as appendices to the report. Appendix A includes copies of the Web
survey user guides that were provided to SA and LA respondents to support their completion of the
survey. Appendix B includes a sample to study related communcations used to inform SAs and LAs about
the study and their involvement in the Web survey and/or case study. Appendices C–G provide various
supplemental materials related to the study methods, such as formulas used to calculate response rates,
unit and item response rates, and information on respondents. Appendix H includes copies of the case
study interview guides. Appendix I includes tables that both support the findings summarized in each
chapter and address study research questions. Appendix J includes a brief summary profile on each of the
SAs included in the case studies.
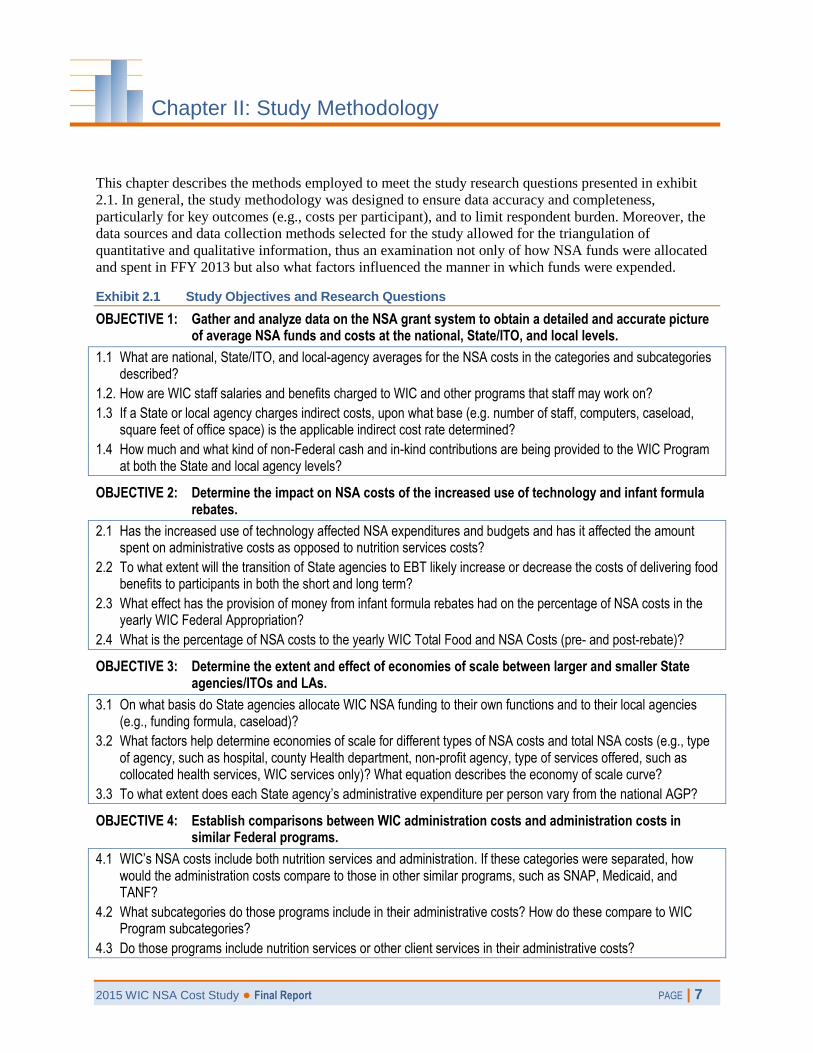
2015 WIC NSA Cost Study ● Final Report PAGE | 7
Chapter II: Study Methodology
This chapter describes the methods employed to meet the study research questions presented in exhibit
2.1. In general, the study methodology was designed to ensure data accuracy and completeness,
particularly for key outcomes (e.g., costs per participant), and to limit respondent burden. Moreover, the
data sources and data collection methods selected for the study allowed for the triangulation of
quantitative and qualitative information, thus an examination not only of how NSA funds were allocated
and spent in FFY 2013 but also what factors influenced the manner in which funds were expended.
Exhibit 2.1 Study Objectives and Research Questions
OBJECTIVE 1: Gather and analyze data on the NSA grant system to obtain a detailed and accurate picture of average NSA funds and costs at the national, State/ITO, and local levels.
1.1 What are national, State/ITO, and local-agency averages for the NSA costs in the categories and subcategories described?
1.2. How are WIC staff salaries and benefits charged to WIC and other programs that staff may work on?
1.3 If a State or local agency charges indirect costs, upon what base (e.g. number of staff, computers, caseload, square feet of office space) is the applicable indirect cost rate determined?
1.4 How much and what kind of non-Federal cash and in-kind contributions are being provided to the WIC Program at both the State and local agency levels?
OBJECTIVE 2: Determine the impact on NSA costs of the increased use of technology and infant formula rebates.
2.1 Has the increased use of technology affected NSA expenditures and budgets and has it affected the amount spent on administrative costs as opposed to nutrition services costs?
2.2 To what extent will the transition of State agencies to EBT likely increase or decrease the costs of delivering food benefits to participants in both the short and long term?
2.3 What effect has the provision of money from infant formula rebates had on the percentage of NSA costs in the yearly WIC Federal Appropriation?
2.4 What is the percentage of NSA costs to the yearly WIC Total Food and NSA Costs (pre- and post-rebate)?
OBJECTIVE 3: Determine the extent and effect of economies of scale between larger and smaller State agencies/ITOs and LAs.
3.1 On what basis do State agencies allocate WIC NSA funding to their own functions and to their local agencies (e.g., funding formula, caseload)?
3.2 What factors help determine economies of scale for different types of NSA costs and total NSA costs (e.g., type of agency, such as hospital, county Health department, non-profit agency, type of services offered, such as collocated health services, WIC services only)? What equation describes the economy of scale curve?
3.3 To what extent does each State agency’s administrative expenditure per person vary from the national AGP?
OBJECTIVE 4: Establish comparisons between WIC administration costs and administration costs in similar Federal programs.
4.1 WIC’s NSA costs include both nutrition services and administration. If these categories were separated, how would the administration costs compare to those in other similar programs, such as SNAP, Medicaid, and TANF?
4.2 What subcategories do those programs include in their administrative costs? How do these compare to WIC Program subcategories?
4.3 Do those programs include nutrition services or other client services in their administrative costs?

2015 WIC NSA Cost Study ● Final Report PAGE | 8
Specifically, study data were obtained from three primary sources:
1) FNS and WIC SAs, including ITOs, were asked to provide extant data such as backup financial
data reported by WIC LAs for preparation of the States’ FNS-798A closeout report;
2) Web-based surveys from SAs and LAs were used to gather detailed information on cost
categories within which their WIC NSA funds were spent; and
3) In-depth interviews with a sample of SAs and LAs were conducted to obtain rich, qualitative
information as well as interviews with SNAP and TANF representatives from a subgroup of
States selected for case study.
Each of these data sources is described in more detail below.
A. Extant Data Sources
FNS and SAs provided financial information that was critical to answer the research questions. Whenever
possible, SA-level financial information was obtained directly from FNS in order to reduce the burden on
SAs. Exhibit 2.2 provides a summary of the source, type of information, and approximate dates by which
extant data was submitted to Altarum.
Exhibit 2.2 Variables Obtained Through Secondary and Existing Data Sources, by FNS Sources
Type of information Submission date Completeness of information
LA directory August 2013 Obtained for all 90 SAs, included 1,838 LA records
Total, NSA, and food grant amounts provided to SAs in FFY 2013, including original grant amounts, operational adjustment funds, and reallocation funds
February 2014 Obtained for all 90 SAs
Total participation as reported by SAs on the FNS-798 annual closeout report
April 2014 Obtained for all 90 SAs
SNAP financial data reported on the FNS-778 annual report form
May 2014 Obtained for all 9 SNAP States included in case studies
Infant formula and infant food rebate amounts in FFY 2013 as reported by SAs on the FNS-798 annual closeout report
July 2014 Obtained for all 90 SAs
Other Federal grants provided to SAs in FFY 2013, such as grants for management information system development, EBT planning and implementation, and breastfeeding peer counselors
November 2013 Obtained for all 90 SAs
Final closeout expenditures overall and by the four major cost categories (program management, client services, nutrition education, and breastfeeding promotion and support) in FFY 2013 as reported by SAs on the FNS-798A annual closeout report
November to
December 2014 Obtained for all 90 SAs

2015 WIC NSA Cost Study ● Final Report PAGE | 9
Exhibit 2.2 Variables Obtained Through Secondary and Existing Data Sources, by SA Sources
Type of information Submission date Completeness of information
Lists of active LAs January 2014 Obtained for all decentralized (n = 38) and combination SAs (n = 9)
NSA expenditures by the four major cost categories for each LA
June to November 2014
Obtained for all decentralized (n = 38) and combination SAs (n = 9)
Average monthly participation for each LA August to November 2014
Obtained for all decentralized (n = 38) and combination SAs (n = 9)
Note: NSA expenditure data by the four major cost categories for each LA was provided for 99.6 percent of all LAs (n = 1,549). For the seven remaining LAs, these values were obtained from their Web survey (n = 4) or imputed (n = 3). Average monthly participation for each LA was provided for 99.5 percent of all LAs (n = 1,548). For the eight remaining LAs, these values were imputed.
B. Web Survey Data
A Web survey of SAs and LAs was conducted between June and November of 2014 to obtain detailed
information about the ways in which WIC NSA funds are spent. SA respondents provided (1) general
information about their service delivery system and changes in program costs; (2) detailed information on
SA-level expenditures, broken out by the four cost categories; and (3) information about other sources of
funding, including in-kind contributions. Similar information was provided by LAs; however, these local-
level expenditures were reported in total, not broken out by the four categories. Exhibit 2.3 summarizes
the type of information obtained from SAs and LAs through the Web surveys. In the following sections,
we describe the eligible population of SAs, the eligible population of LAs, and the processes employed to
recruit them and elicit a complete response to the survey.
Exhibit 2.3 Type of Data Obtained from Web Surveys, by SA Web-based Survey
Type of data Indicators
Program demographics How LAs are funded
Factors affecting infant formula rebates
Changes in program costs Factors increasing or decreasing SA-level staffing and total costs since FFY 2010
Expenditures broken out by four WIC cost categories: program management, client services, nutrition education, breastfeeding
Labor and personnel
Contracted services
Materials, services, and travel
Indirect costs
Other sources of funding Non-Federal grant funding (e.g., State dollars allocated to WIC)
In-kind contributions
Note: SAs that operate some or all of their local service delivery sites (combination and centralized agencies) responded to a third version of the survey which was a hybrid of the SA and LA Web surveys, allowing these agencies to report on both SA- and local-level expenditures.
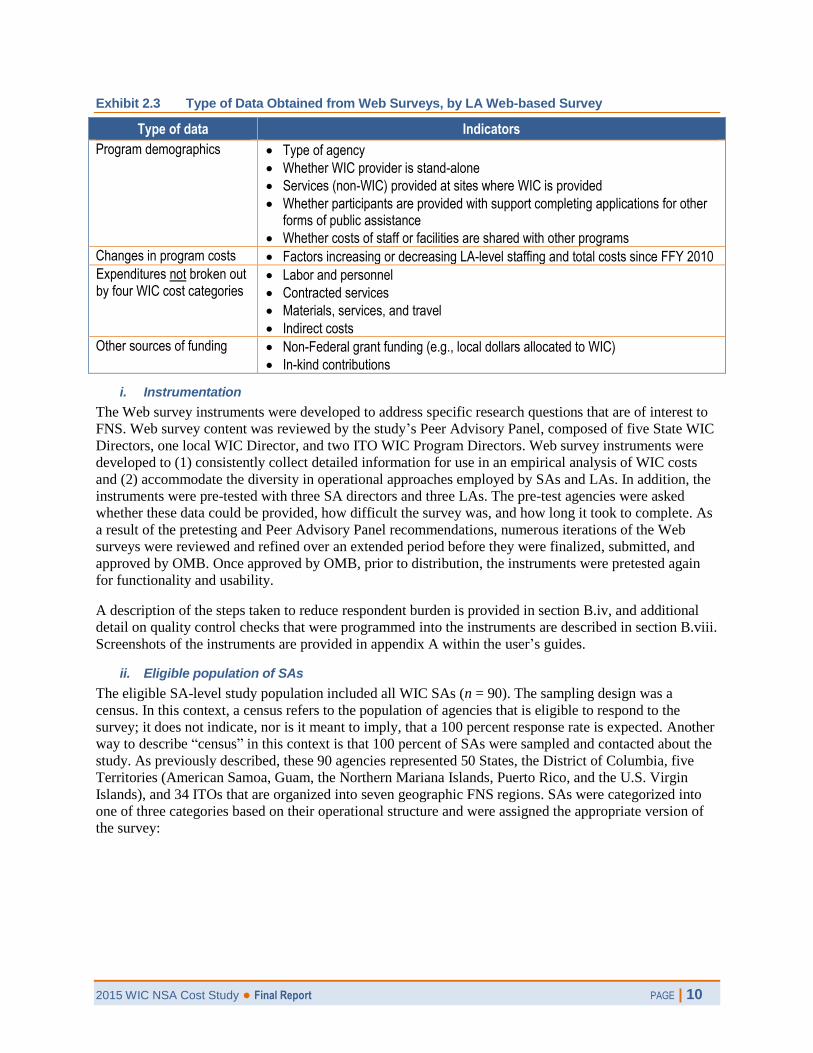
2015 WIC NSA Cost Study ● Final Report PAGE | 10
Exhibit 2.3 Type of Data Obtained from Web Surveys, by LA Web-based Survey
Type of data Indicators
Program demographics Type of agency
Whether WIC provider is stand-alone
Services (non-WIC) provided at sites where WIC is provided
Whether participants are provided with support completing applications for other forms of public assistance
Whether costs of staff or facilities are shared with other programs
Changes in program costs Factors increasing or decreasing LA-level staffing and total costs since FFY 2010
Expenditures not broken out by four WIC cost categories
Labor and personnel
Contracted services
Materials, services, and travel
Indirect costs
Other sources of funding Non-Federal grant funding (e.g., local dollars allocated to WIC)
In-kind contributions
i. Instrumentation
The Web survey instruments were developed to address specific research questions that are of interest to
FNS. Web survey content was reviewed by the study’s Peer Advisory Panel, composed of five State WIC
Directors, one local WIC Director, and two ITO WIC Program Directors. Web survey instruments were
developed to (1) consistently collect detailed information for use in an empirical analysis of WIC costs
and (2) accommodate the diversity in operational approaches employed by SAs and LAs. In addition, the
instruments were pre-tested with three SA directors and three LAs. The pre-test agencies were asked
whether these data could be provided, how difficult the survey was, and how long it took to complete. As
a result of the pretesting and Peer Advisory Panel recommendations, numerous iterations of the Web
surveys were reviewed and refined over an extended period before they were finalized, submitted, and
approved by OMB. Once approved by OMB, prior to distribution, the instruments were pretested again
for functionality and usability.
A description of the steps taken to reduce respondent burden is provided in section B.iv, and additional
detail on quality control checks that were programmed into the instruments are described in section B.viii.
Screenshots of the instruments are provided in appendix A within the user’s guides.
ii. Eligible population of SAs
The eligible SA-level study population included all WIC SAs (n = 90). The sampling design was a
census. In this context, a census refers to the population of agencies that is eligible to respond to the
survey; it does not indicate, nor is it meant to imply, that a 100 percent response rate is expected. Another
way to describe “census” in this context is that 100 percent of SAs were sampled and contacted about the
study. As previously described, these 90 agencies represented 50 States, the District of Columbia, five
Territories (American Samoa, Guam, the Northern Mariana Islands, Puerto Rico, and the U.S. Virgin
Islands), and 34 ITOs that are organized into seven geographic FNS regions. SAs were categorized into
one of three categories based on their operational structure and were assigned the appropriate version of
the survey:
2015 WIC NSA Cost Study ● Final Report PAGE | 11
Centralized SAs operate and staff local service delivery sites (n = 43; 47.8 percent). Most ITOs
and SAs operated by Territories fall into this category. These agencies responded to a version of
the survey that allowed them to provide detail on both SA- and local-level program characteristics
and expenditures (called the combination Web survey).
Decentralized SAs contract with LAs for local service delivery (n = 38; 42.2 percent). These
agencies responded to a version of the survey that requested detail only on SA-level program
characteristics and expenditures (called the SA Web survey).
Combination SAs are a hyrid of a centralized and decentralized structure (n = 9; 10.0 percent).
These agencies operate and staff some local service delivery sites but also contract with one or
more LAs for the provision of local services. Like centralized SAs, these agencies responded to the
combination Web survey. However, when reporting on local-level expenditures, these SAs were
asked to provide detail in aggregate and only with regard to the local services delivery sites they
operates; the LAs with which they contract received the local survey (described in the next section)
and reported on their own expenditures.
Representatives from FNS Regional Offices confirmed the operational structure of each SA in their
region before the survey was fielded.
iii. Eligible population of LAs
The eligible local-level study population included all WIC LAs. The sampling design was a census. In
this context, a census refers to the population of agencies that is eligible to respond to the survey; it does
not indicate, nor is it meant to imply, that a 100 percent response rate is expected. Another way to
describe “census” in this context is that 100 percent of LAs were sampled into and contacted about the
study. In August 2013, FNS provided a directory that it maintains of all WIC LAs. The directory included
a total of 1,838 LA records and served as the starting point for identifying the eligible population.
Next, updated LA lists were requested from each decentralized and combination SA in January 2014, and
these were reconciled with the LA directories provided by FNS. To reconcile this information, LA names
were compared between the lists within each State. When agency names were the same or very similar on
both lists and the addresses for the agencies were the same, they were identified as a match. If there was a
question about two agencies matching (e.g., the address was the same, but the name was not; the names
were the same, but the address was not), the SA was contacted for clarification. When a record existed on
the list provided by the SA but was not found in the FNS directory, it was added to the database. When an
agency record in the FNS directory did not have a match on the SA-provided list, the agency was marked
as inactive and effectively removed from the database, since only those agencies that were active at the
time of survey administration would have staff available to respond to a survey about FFY 2013
expenditures. Because LAs can close, merge, and change names at any point during the year, this
reconciliation process was not straightforward, thus might not have yielded a perfect list. It took a
substantial level of effort to follow up with SAs and to clarify inconsistencies.
Once the reconciliation process was complete, it was necessary to differentiate between LAs and local
service delivery sites in centralized and combination SAs, since the FNS directory and some SA-provided
LA lists included both types of entitites. During the pretest of data collection instruments, SAs that
administer local program services indicated that they do not treat their SA-run sites like LAs; instead, all
sites are budgeted and administered as a single entity under the umbrella of the SA. As a result, it was
determined that two versions of the Web survey would be needed to adequately capture expenditures
from SAs that administer some or all of their local programs (centralized and combination SAs) and SAs
that contract out all of their local services (decentralized). Sites identified as SA-run were deemed
ineligible and effectively removed from the LA database that was used for study purposes.
The final eligible respondent pool for the local survey comprised 1,556 LAs. For study purposes, SAs
with a centralized or combination structure (n = 52) were also counted as LAs, since they are responsible

2015 WIC NSA Cost Study ● Final Report PAGE | 12
for providing direct services within their State either in part or in full and are herein called SA-run LAs.
In sum, 1,608 agencies were eligible to provide local-level expenditure data; 1,556 LAs were eligible to
provide this information through the local survey, and 52 SA-run LAs (9 combination SAs and 43
centralized SAs) were eligible to provide this information through the combination Web survey (Exhibit
2.4).
Exhibit 2.4 Relationship Between Web Survey Types and Eligible Respondent Pools
iv. Web survey data collection procedures
Data collection for the Web survey began in June 2014 and ended in November 2014. This time frame
was considered ideal for several reasons:
1) SAs would have their final FFY 2013 year-end financial information available to aid them with
completion of the survey;
2) SAs could complete the survey before embarking on the preparation of FFY 2014 year-end
financial reporting to FNS, thereby minimizing overlap and potential confusion; and
3) It minimized overlap and potential confusion with another FNS-funded national survey that was
launched in late fall 2014.
Prior to fielding the Web surveys, SAs were informed of the study and associated data requests via email.
SAs were also provided with a draft notice that they could forward to their LAs to inform them of the
study and forthcoming survey invitation. Copies of these communications can be found in appendix B.
Announcements about the study were also made at the National WIC Association’s Annual Networking
and Training Conference in May 2014 during the SA and LA sections’ meetings.
All SAs and LAs were sent the official study email invitation, informing them of the start of Web survey
data collection. The email provided the Web link to the survey, a unique ID, and a password. Each site
had a single unique ID and password; if multiple staff members in an LA needed to complete sections of
the survey, only one ID and password were required. Agencies had the option to print out the survey to
distribute sections to various staff members, with one staff member entering the survey responses into the
online survey tool, or multiple individuals could enter data into the survey. Additionally, a Spanish-
language survey instrument was developed for Puerto Rico.
Survey help desk support was provided on all weekdays throughout the data collection period when SAs
and LAs were completing the survey. Survey respondents contacted the help desk via a toll-free phone
number or study email address for technical issues associated with accessing the survey or submitting
responses and for substantive questions about how to complete the survey. In addition to help desk
support, the Web survey included a link to a printable user’s guide and help text pop-ups that provided
additional context for the information being requested.
Numerous nonresponse follow-up strategies were implemented to increase response rates over the course
of data collection:

2015 WIC NSA Cost Study ● Final Report PAGE | 13
Sent nonresponse follow-up emails to SAs and LAs in two waves,
Added a read-receipt to the LA nonresponse follow-up email,
Added a personalized subject line to LA nonresponse follow-up email to decrease the likelihood of
being blocked by spam filters,
Developed and specialized answering machine scripts that were utilized when help desk staff were
not immediately available, and
Made follow-up calls and sent emails to all nonrespondents who had contacted the help desk for
assistance.
In addition, technical experts followed up via email and phone with every SA that did not fully respond
by the survey deadline. The purpose of this follow-up was to notify nonresponders that they had
additional time to complete the survey, inquire about help needed, and provide a personal point of
contact. SAs were also provided with a list of their nonresponding LAs in their State and asked to
encourage these agencies to respond. The National WIC Association included a message in their Monday
Morning Report to communicate the importance of the study and to encourage SA and LA response. The
California WIC Association also included messages in two of its newsletters to encourage LA response.
These efforts greatly enhanced both SA and LA response in the final weeks of survey administration.
Since ITOs are typically underrepresented in national surveys and response among this group was initially
quite low, each nonresponding ITO received at least two calls following the survey deadline to encourage
response.
v. Survey response
The design of the survey required respondents to confirm and validate each individual screen when
completed and then confirm final submission when all screens were completed. Because of this design,
each confirmed screen can be considered submitted and two types of respondents were defined:
1. Agencies validating the entire survey are called “full responders.”
2. Agencies validating at least the demographics screen are called “partial responders.”
Partial responders generally validated several screens before stopping the survey (Exhibit 2.5 for list of
survey screens). SA partial responders validated an average of 6.8 out of 11 screens, and LA partial
responders validated an average of 5.7 out of 12 screens. The survey allowed respondents to go back and
change entries on screens that had been previously validated, so long as they had not completed the final
validation and confirmation of the entire survey. Because of the nature of the data requested on costing
screens in particular, respondents may have planned to go back and change entries even after validating
the screen. However, this is unlikely the case for the demographics screen, since the information
requested on that screen is readily available to respondents; therefore, it was unlikely that the respondent
would need to correct responses on this screen once validated and confirmed. Therefore, to maximize the
use of data submitted by respondents while ensuring high-quality data, only the data from the
demographics screen was used for partial responders.
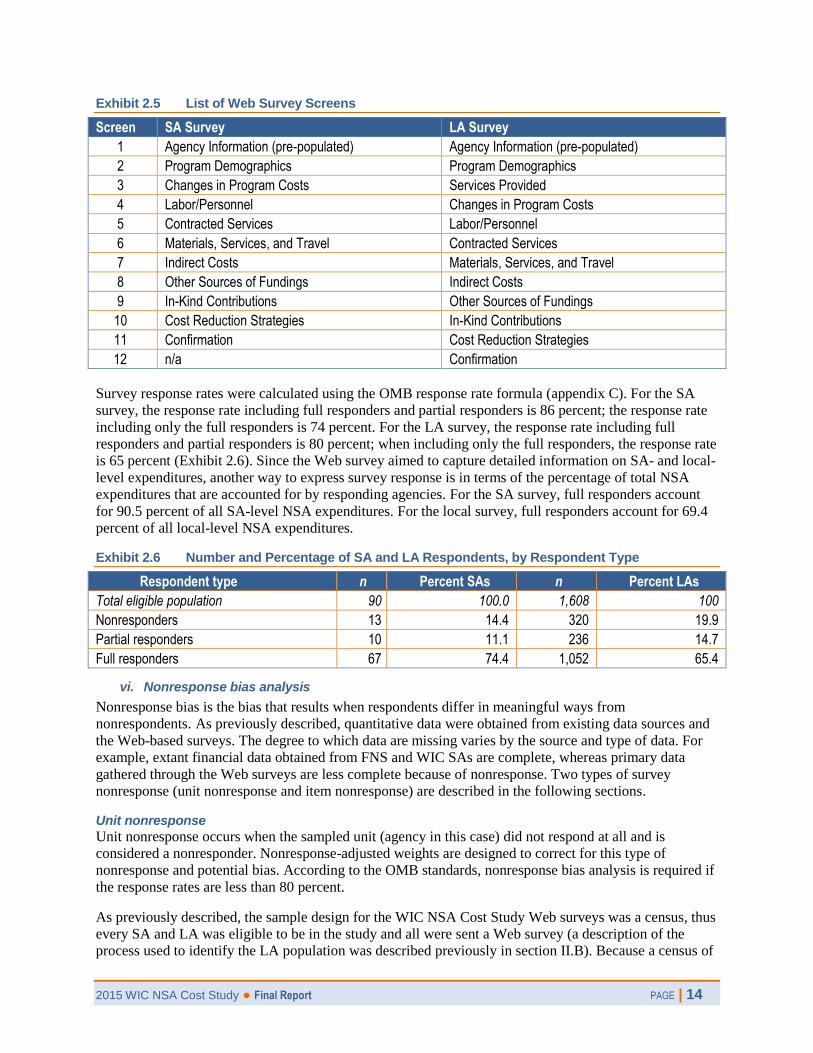
2015 WIC NSA Cost Study ● Final Report PAGE | 14
Exhibit 2.5 List of Web Survey Screens
Screen SA Survey LA Survey
1 Agency Information (pre-populated) Agency Information (pre-populated)
2 Program Demographics Program Demographics
3 Changes in Program Costs Services Provided
4 Labor/Personnel Changes in Program Costs
5 Contracted Services Labor/Personnel
6 Materials, Services, and Travel Contracted Services
7 Indirect Costs Materials, Services, and Travel
8 Other Sources of Fundings Indirect Costs
9 In-Kind Contributions Other Sources of Fundings
10 Cost Reduction Strategies In-Kind Contributions
11 Confirmation Cost Reduction Strategies
12 n/a Confirmation
Survey response rates were calculated using the OMB response rate formula (appendix C). For the SA
survey, the response rate including full responders and partial responders is 86 percent; the response rate
including only the full responders is 74 percent. For the LA survey, the response rate including full
responders and partial responders is 80 percent; when including only the full responders, the response rate
is 65 percent (Exhibit 2.6). Since the Web survey aimed to capture detailed information on SA- and local-
level expenditures, another way to express survey response is in terms of the percentage of total NSA
expenditures that are accounted for by responding agencies. For the SA survey, full responders account
for 90.5 percent of all SA-level NSA expenditures. For the local survey, full responders account for 69.4
percent of all local-level NSA expenditures.
Exhibit 2.6 Number and Percentage of SA and LA Respondents, by Respondent Type
Respondent type n Percent SAs n Percent LAs
Total eligible population 90 100.0 1,608 100
Nonresponders 13 14.4 320 19.9
Partial responders 10 11.1 236 14.7
Full responders 67 74.4 1,052 65.4
vi. Nonresponse bias analysis
Nonresponse bias is the bias that results when respondents differ in meaningful ways from
nonrespondents. As previously described, quantitative data were obtained from existing data sources and
the Web-based surveys. The degree to which data are missing varies by the source and type of data. For
example, extant financial data obtained from FNS and WIC SAs are complete, whereas primary data
gathered through the Web surveys are less complete because of nonresponse. Two types of survey
nonresponse (unit nonresponse and item nonresponse) are described in the following sections.
Unit nonresponse
Unit nonresponse occurs when the sampled unit (agency in this case) did not respond at all and is
considered a nonresponder. Nonresponse-adjusted weights are designed to correct for this type of
nonresponse and potential bias. According to the OMB standards, nonresponse bias analysis is required if
the response rates are less than 80 percent.
As previously described, the sample design for the WIC NSA Cost Study Web surveys was a census, thus
every SA and LA was eligible to be in the study and all were sent a Web survey (a description of the
process used to identify the LA population was described previously in section II.B). Because a census of

2015 WIC NSA Cost Study ● Final Report PAGE | 15
agencies was selected for the survey, the probability of selection was equal to 1 and the sampling weight
for all the agencies was also equal to 1. Despite efforts to secure a response from all SAs and LAs there
were some nonresponding SAs and LAs.
A nonresponse bias analysis was conducted for both the SA and LA surveys to evaluate the potential for
bias when only the full responders are retained. Our ability to estimate the degree of bias due to
nonresponse depends on having variables that reflect key characteristics of respondents and for which few
or no data are missing for both respondents and nonrespondents. Exhibit 2.7 presents the list of frame
variables used in the nonresponse bias analysis and nonresponse weight adjustments (because these
variables are known for both responding and nonresponding agencies).
Exhibit 2.7 Frame Variables Used in the Nonresponse Bias Analysis and Nonresponse Weight Adjustment Models, by SA-level Variables
SA-level variables Description
FNS region FNS region
Agency cost and size Small, medium, large, ITO, and high-cost
EBT status Yes/no
Total NSA expenditures Continuous
Exhibit 2.7 Frame Variables Used in the Nonresponse Bias Analysis and Nonresponse Weight Adjustment Models, by LA-level Variables
LA-level variables Description
Agency size 3-level categorical variable (small, medium, or large) created after carefully reviewing participation data to identify logical cut points
EBT status Yes/no
Metropolitan statistical area (MSA)
Micropolitan statistical area, MSA, neither micropolitan statistical area nor MSA, and State
Total NSA expenditures Continuous
Average monthly participation
Continuous
Note: An MSA status could not be assigned for combination and centralized SA-run LAs, since, unlike a LA with which SAs contract, they provide services throughout the State; therefore, a fourth category was added to the MSA variable to avoid assigning these unique agencies a missing value.
The first step in the nonresponse bias analysis was to calculate the response rates for the SA and LA
surveys by the variables listed in exhibit 2.7 (Appendix D for the response rates). Next, the distributions
of the SA and LA populations were compared to the distribution of survey responders, respectively.
Finally, nonresponse bias was calculated as the difference between the mean of the respondents and the
population means (OMB, 2006) and tested for significance.18 For example, consider the data presented
from the LA survey in exhibit 2.8. Thirteen percent of the LAs are in EBT States, but 14 percent of
responding LAs are in EBT States; thus, the calculated bias is 1 percent.
18 The bias formula from the OMB standards is the difference between the mean of the respondents and the mean of the sample. Because the survey design was a census, the mean of the population was used instead of the mean of the sample.

2015 WIC NSA Cost Study ● Final Report PAGE | 16
Exhibit 2.8 Example of Bias Analysis for EBT Status
EBT Status Distribution of population Distribution of respondents Estimated bias
Yes 0.13 0.14 0.01
No 0.87 0.86 -0.01
After creating the weights adjusted for nonresponse (described in section B.vii), we reexamined the
distributions for the respondents using the nonresponse adjusted weights to ensure they are more similar
to or the same as the distributions for the SA and LA populations. The bias calculations and tests for
significance were repeated using the nonresponse bias adjusted weights. The SUDAAN® procedure
DESCRIPT (RTI International, 2012) was used to determine whether the estimated biases are significant
at the 5 percent level.19
For the SA-level survey, results of the nonresponse bias analysis revealed minimal bias when comparing
the population distributions to the unweighted respondent distributions. Bias estimates bordered on
significance for the Mountain Plains Region (p-value = 0.0504) among full responders and for small SAs
(p-value = 0.0587) among partial responders.
For the LA survey, no bias was found when comparing the population distributions to the unweighted
respondent distributions for partial responders. Bias estimates were significant for SA-run LAs (p-value =
0.0079) and for LAs with EBT (p-value = 0.0329) and without EBT (p-value = 0.0329) when comparing
the population distributions to the unweighted respondent distributions for full responders whose reported
costs were deemed valid (within 10 percent of expenditures). See appendix E for tables showing the
population distributions, unweighted respondent distributions, estimated bias, and p-value from the
signficance test of the estimated bias.
For both the SA- and local-level surveys, the weighted respondent distributions or means for all the
variables included in the nonresponse bias analysis are the same as the population distributions for both
partial and full responders. This indicates that the final analysis weights have completely corrected
potential bias for the variables included in the nonresponse bias analysis. Results of the nonresponse bias
anlaysis utilizing the final analysis weights are also provided in appendix E.
Item nonresponse
Item nonresponse occurs when a responder decides not to respond to a specific question. Imputation—the
process of replacing missing data with substituted values—can be used to address this type of
nonresponse. This can be important, because when regression analyses are run, any record with a missing
value for any of the variables in the model will be deleted from the set of records included in the
regression. Thus, imputation is often performed on a set of core questions that will be used as predictor
variables in planned regression models. The Web survey was designed, however, to require responses for
all questions before allowing the respondent to continue. Because of this design feature, item response
rate for most of the questions is 99 percent or higher; thus imputation was not necessary. Exhibit 2.9
shows the distribution of item response rates for the SA and LA surveys. For the SA survey, 52.7 percent
of all items had a response rate greater than 99 percent. For the LA survey, 76.6 percent of all items had a
response rate greater than 99 percent. For both SAs and LAs, no items had a response rate lower than 92
percent. Appendix F contains the response rate for each individual question.
19 Although the individual error rate for the tests is 0.05, the family-wise error rate will be much larger. The family-wise error rate is the probability of incorrectly rejecting the null hypothesis when the alternative hypothesis is true when conducting multiple hypothesis tests. However, because this was an exploratory analysis and it was important to identify all potential bias, the significance level remained at 0.05 for all the tests instead of adjusting it downward to control the family-wise error rate.

2015 WIC NSA Cost Study ● Final Report PAGE | 17
Exhibit 2.9 Item Response Rate Frequency
Item response rate Percentage of items on SA survey Percentage of items on LA survey
greater than 99% 52.7% 76.6%
greater than 98% 80.5% 85.1%
greater than 97% 88.9% 85.1%
greater than 96% 88.9% 97.9%
greater than 95% 88.9% 97.9%
greater than 94% 94.4% 97.9%
greater than 93% 94.4% 97.9%
greater than 92% 100% 100%
vii. Weighting
The potential for nonresponse bias is introduced when survey respondents differ systematically from the
population as a whole with respect to characteristics used in an analysis. Weighting was used to
counterbalance missing data due to nonresponding agencies, thereby reducing nonresponse bias.
After assessing the potential for bias as described in the previous section, final analysis weights were
calculated for the SA and LA surveys. The final analysis weights are the product of the sampling weights
and a nonresponse bias adjustment factor. Since we selected a census, our sampling weights equal 1 for
all SAs and LAs; thus, the final analysis weights equal 1 times a nonresponse bias adjustment factor. The
nonresponse bias adjustment factor was created using the SUDAAN® procedure WTADJUST (RTI
International, 2012). This procedure uses a constrained logistic model to calculate the probability of
response. The nonresponse adjustment is the inverse of the probability of response. Included in the
logistic models as predictor variables are the variables listed in exhibit 2.7.
The WTADJUST procedure is designed so that the sum of the nonresponse-adjusted final analysis
weights equals the population totals. Two sets of weights were created, one for the full responders and
one for the full plus partial responders. Analyses conducted on the demographic questions used the
weights for the full plus partial responders and analyses conducted on the remaining questions used the
full responder weights.
The SUDAAN Language Manual, Volumes 1 and 2, Release 11 provides the exact formula for the weight
adjustment factors calculated by WTADJUST. Appendix G provides the formula.
viii. Cleaning and editing survey data
The Web survey was designed to perform automated checks on the accuracy of data as respondents
entered it, alerting users when data were inconsistent and prompting them to correct the entry. These
checks include requiring responses to all survey questions, ensuring that line items in cost tables contain
both total costs and quantities or percentages where relevant, and requiring all percentages to fall into a
feasible range. These checks were performed when the user validated each submission screen. The user
was unable to submit the survey without validating all the screens.
Although these validation benchmarks serve a critical role in promoting high-quality data entry, they must
be balanced with the added burden they place on respondents. In the case of cost surveys, the comparison
of aggregate costs reported through survey responses with aggregate costs reported via other means is
valuable for helping respondents determine whether they have omitted data; however, in some cases, it
may be difficult to make these cost data values exactly equivalent. Therefore, in an effort to balance the
improved data quality from validation checks with added burden that would be placed on respondents, the
WIC NSA Cost Study surveys were designed to allow for a 10 percent variation between survey cost data
and Federal or SA expenditure reports. This threshold was selected because it has been vetted, approved,

2015 WIC NSA Cost Study ● Final Report PAGE | 18
and used in cost studies of the Centers for Disease Control and Prevention’s Communities Putting
Prevention to Work and Community Transformation Grants programs.
Prior to performing tabulations, data collected through the Web surveys was reviewed for potential
inconsistencies and inaccuracies. Specifically, combinations of data elements were examined to identify
areas where quality of the data may be of concern (e.g., labor cost per full-time equivalent, ratio of in-
kind contributions to total NSA expenditures, ratio of other sources of funds to total NSA expenditures).
The distribution of these measures was examined to identify extreme outliers, defined as 4 or more
standard deviations above the sample mean. Less than 1 percent of all of these measures qualified as
extreme outliers. Detailed data for these extreme outliers was reviewed to determine whether there was an
obvious data entry error, such as a mistype or an extra “0.” In all cases, there was no obvious data entry
error, so data were retained as reported by the agency.
Additionally, total reported costs from the survey were compared to existing data on total reported
expenditures for survey full responders (SAs and LAs that confirmed and submitted their surveys). Based
on this review, 26 of the 67 SA full responders had reported costs that were not within 10 percent of their
total Federal expenditures (based on existing data provided by FNS). These agencies were contacted and
asked to provide data corrections or clarify reasons for the discrepancy. Based on information gleaned
from this additional communication, some expenditure data reported by 17 SAs/ITOs were corrected or
omitted. Additionally, a number of SAs/ITOs indicated that the reason their SA-level costs reported on
the survey exceed the SA-level expenditures reported to FNS is that some of these costs were reported on
the FNS-798A as local-level expenditures. Although data corrections were not necessary in these cases, a
note regarding the interpretation of expenditure data is included in chapter VI which describes the results
of analyses performed relative to SA-level cost centers.
A total of 284 of the 1,052 LA full responders also had reported costs that were not within 10 percent of
their total Federal expenditures (based on existing data provided by SAs on behalf of their LAs). Rather
than seeking clarification, these LAs were excluded from cost-related data tabulations. This approach
helped to minimize SA and LA response burden and did not compromise the analysis because a sufficient
number of respondents were retained in the analysis to meet required precision levels.
C. Case Study Data
Case studies were conducted with 14 SAs between July and October of 2014 to supplement the financial
information gathered from FNS and WIC SAs and LAs and subsequently gain an understanding of the
various factors that influence WIC costs and changes in these costs over time. Indepth interviews were
conducted with representatives from each of the 14 WIC SAs and with two to three LAs from each State,
where applicable, using interview guides that were approved by OMB. Representatives from the SNAP
and TANF programs in 9 of the 14 States were also recruited to participate in an interview. Exhibit 2.10
summarizes information gathered through the case studies. Additional information on State selection and
recruitment and data collection are provided in the following sections.
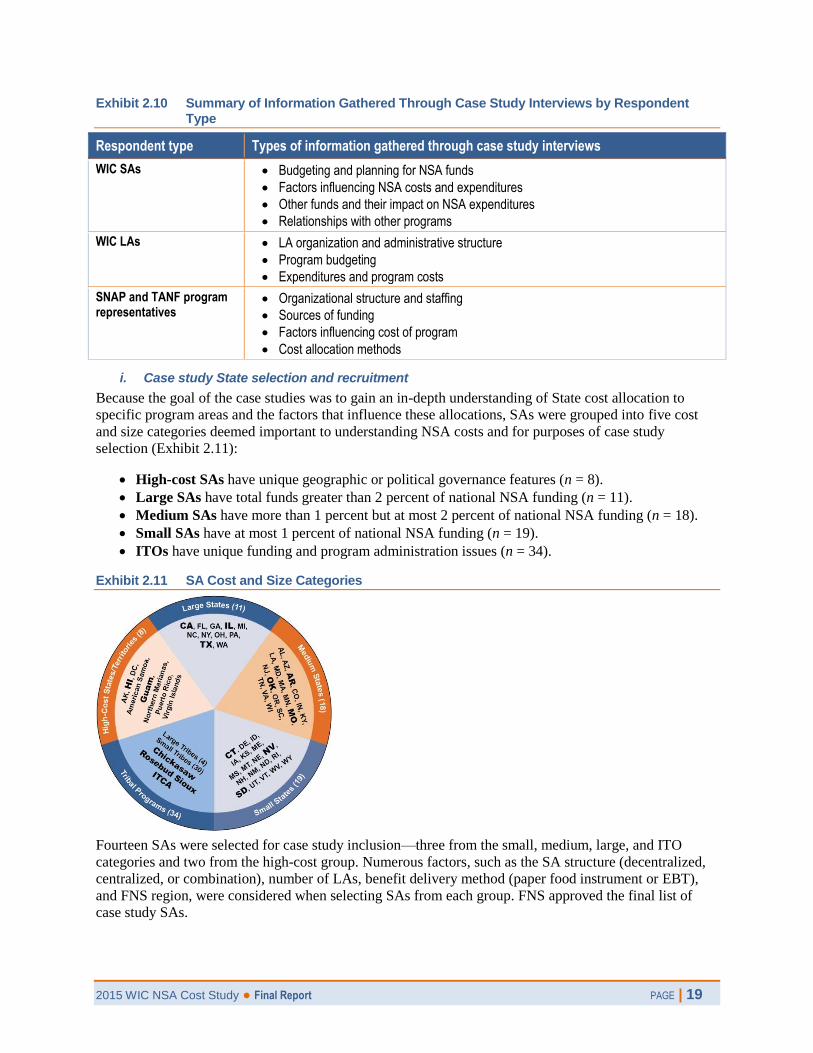
2015 WIC NSA Cost Study ● Final Report PAGE | 19
Exhibit 2.10 Summary of Information Gathered Through Case Study Interviews by Respondent Type
Respondent type Types of information gathered through case study interviews
WIC SAs Budgeting and planning for NSA funds
Factors influencing NSA costs and expenditures
Other funds and their impact on NSA expenditures
Relationships with other programs
WIC LAs LA organization and administrative structure
Program budgeting
Expenditures and program costs
SNAP and TANF program representatives
Organizational structure and staffing
Sources of funding
Factors influencing cost of program
Cost allocation methods
i. Case study State selection and recruitment
Because the goal of the case studies was to gain an in-depth understanding of State cost allocation to
specific program areas and the factors that influence these allocations, SAs were grouped into five cost
and size categories deemed important to understanding NSA costs and for purposes of case study
selection (Exhibit 2.11):
High-cost SAs have unique geographic or political governance features (n = 8).
Large SAs have total funds greater than 2 percent of national NSA funding (n = 11).
Medium SAs have more than 1 percent but at most 2 percent of national NSA funding (n = 18).
Small SAs have at most 1 percent of national NSA funding (n = 19).
ITOs have unique funding and program administration issues (n = 34).
Exhibit 2.11 SA Cost and Size Categories
Fourteen SAs were selected for case study inclusion—three from the small, medium, large, and ITO
categories and two from the high-cost group. Numerous factors, such as the SA structure (decentralized,
centralized, or combination), number of LAs, benefit delivery method (paper food instrument or EBT),
and FNS region, were considered when selecting SAs from each group. FNS approved the final list of
case study SAs.
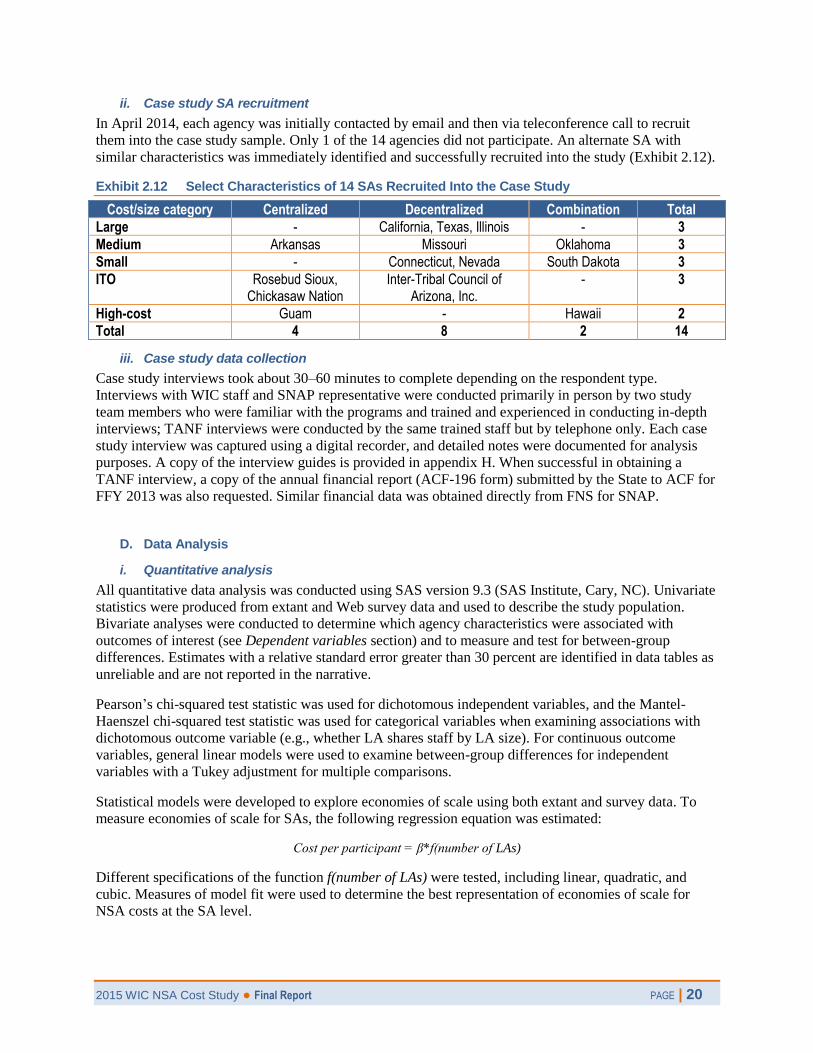
2015 WIC NSA Cost Study ● Final Report PAGE | 20
ii. Case study SA recruitment
In April 2014, each agency was initially contacted by email and then via teleconference call to recruit
them into the case study sample. Only 1 of the 14 agencies did not participate. An alternate SA with
similar characteristics was immediately identified and successfully recruited into the study (Exhibit 2.12).
Exhibit 2.12 Select Characteristics of 14 SAs Recruited Into the Case Study
Cost/size category Centralized Decentralized Combination Total
Large - California, Texas, Illinois - 3
Medium Arkansas Missouri Oklahoma 3
Small - Connecticut, Nevada South Dakota 3
ITO Rosebud Sioux, Chickasaw Nation
Inter-Tribal Council of Arizona, Inc.
- 3
High-cost Guam - Hawaii 2
Total 4 8 2 14
iii. Case study data collection
Case study interviews took about 30–60 minutes to complete depending on the respondent type.
Interviews with WIC staff and SNAP representative were conducted primarily in person by two study
team members who were familiar with the programs and trained and experienced in conducting in-depth
interviews; TANF interviews were conducted by the same trained staff but by telephone only. Each case
study interview was captured using a digital recorder, and detailed notes were documented for analysis
purposes. A copy of the interview guides is provided in appendix H. When successful in obtaining a
TANF interview, a copy of the annual financial report (ACF-196 form) submitted by the State to ACF for
FFY 2013 was also requested. Similar financial data was obtained directly from FNS for SNAP.
D. Data Analysis
i. Quantitative analysis
All quantitative data analysis was conducted using SAS version 9.3 (SAS Institute, Cary, NC). Univariate
statistics were produced from extant and Web survey data and used to describe the study population.
Bivariate analyses were conducted to determine which agency characteristics were associated with
outcomes of interest (see Dependent variables section) and to measure and test for between-group
differences. Estimates with a relative standard error greater than 30 percent are identified in data tables as
unreliable and are not reported in the narrative.
Pearson’s chi-squared test statistic was used for dichotomous independent variables, and the Mantel-
Haenszel chi-squared test statistic was used for categorical variables when examining associations with
dichotomous outcome variable (e.g., whether LA shares staff by LA size). For continuous outcome
variables, general linear models were used to examine between-group differences for independent
variables with a Tukey adjustment for multiple comparisons.
Statistical models were developed to explore economies of scale using both extant and survey data. To
measure economies of scale for SAs, the following regression equation was estimated:
Cost per participant = β*f(number of LAs)
Different specifications of the function f(number of LAs) were tested, including linear, quadratic, and
cubic. Measures of model fit were used to determine the best representation of economies of scale for
NSA costs at the SA level.

2015 WIC NSA Cost Study ● Final Report PAGE | 21
To measure economies of scale for LAs, the following regression equation was estimated:
Cost per participant = β*f(caseload)
Again, different specifications of the function f(caseload) were tested, including linear, quadratic, and
cubic, and measures of model fit were used to determine the best representation of economies of scale for
NSA costs among LAs. For local services, the influence of agency type and the services offered on
economies of scale was also explored by estimating the regression equation and stratifying by these
factors.
When analyzing data from the Web surveys, the final analytic weights which correct for nonresponse bias
were used to ensure estimates are representative of the population. In these cases, unweighted sample
sizes and weighted proportions are reported.
Dependent variables
Extant data on NSA expenditures—the primary outcome of interest for the study—were examined in
terms of total dollars expended, monthly dollars expended, and proportion of dollars expended (e.g., on
key cost centers or in the four WIC cost categories) and on a per-participant basis. The latter is a common
and useful way to compare costs between entities. To calculate various costs per participant, costs were
divided by annualized average monthly participation. Participation data obtained from the FNS-798 report
were used when calculating costs per participant at the SA level, and LA participation data supplied by
SAs were used when calculating costs per participant at the local level.
Independent variables
Independent variables were derived from WIC SA and LA characteristics that are readily available
through existing sources or reported primarily in the survey demographic sections of the Web survey
(Exhibit 2.13).
Exhibit 2.13 Independent Variables for the WIC NSA Cost Study, SA-level independent variables
Variable Variable description
Agency size Small, medium, large, or ITO
Agency structure Centralized (State agencies), centralized (ITO), decentralized, or combination
Agency type State agency/ITO
EBT status Yes/no
FNS region Northeast, Mid-Atlantic, Southeast, Midwest, Mountain Plains, Southwest, or Western
Receipt of in-kind Yes/no
Note: SA size was determined based on FFY 2013 NSA expenditures. Large SAs contributed more than 2 percent of total Federal NSA expenditures; medium SAs contributed more than 1 percent and up to 2 percent of total Federal NSA expenditures; small SAs contributed 1 percent or less of total Federal NSA expenditures; and ITOs were retained as a separate group, since they have unique funding and program administration issues.
Exhibit 2.13 Independent Variables for the WIC NSA Cost Study, Local-level independent variables
Variable Variable description
Agency size Small, medium, or large
Agency type SA-run, local government, local nongovernment, or ITO
EBT status Yes/no
FNS region Northeast, Mid-Atlantic, Southeast, Midwest, Mountain Plains, Southwest, or Western
Receipt of in-kind Yes/no
Note: LA size was determined by reviewing the distribution of LA participants across all agencies and identifying logical cutpoints.

2015 WIC NSA Cost Study ● Final Report PAGE | 22
ii. Qualitative analysis
The NVivo 10 software program (QRS International, Victoria, Australia) was used to code qualitative
data from detailed interview notes. Prior to being imported into NVivo 10, each note file for the
interviews was reviewed for completeness and renamed to reflect the respondents’ case study State, type
of agency (SA, local, SNAP, or TANF), size, and structure to ensure that responses from like agencies
were grouped together in the NVivo output for ease of analysis and interpretation of themes by these
factors.
During analysis in NVivo, a coding outline reflecting the interview guide questions and subquestions was
developed to capture and organize responses. Each interview was then coded according to this outline,
and the coded responses were exported from NVivo for review. The coded text was reviewed and
summarized according to the main topic areas of the discussion guide and the final report and with a focus
on recurring ideas and thoughts as well as to opposing viewpoints. Key findings from the interviews were
synthesized with the findings from the quantitative analysis to create a complete picture of NSA
budgeting, costs, factors that influence costs, and other topics of interest. Some caution is appropriate
when interpreting analyses of qualitative interviews, however. The same interview guide was used for all
the interviews conducted with specific respondent groups, but the individual dynamics of an in-depth,
qualitative interview can guide each discussion in unique ways. While it was possible to identify which
themes and subtopics were more common than others, it was not possible or appropriate to report what
percentage of interview participants agreed or disagreed with a given theme or topic, given the sometimes
divergent nature of discussions in qualitative interviews.

2015 WIC NSA Cost Study ● Final Report PAGE | 23
Chapter III: Study Population
A. State Agency Characteristics
The eligible State agency-level study population included all State agencies and ITOs (collectively
referred to as SAs throughout the report). As previously described, these 90 agencies are comprised of 50
States, the District of Columbia, five Territories (American Samoa, Guam, Northern Mariana Islands,
Puerto Rico, and the U.S. Virgin Islands), and 34 ITOs that are organized into seven geographic FNS
regions. This section describes the SA population in terms of size, structure, age of their MIS, and EBT
status. Additional tables related to this section can be found in appendix I-1.
i. Size
For analysis purposes, each SA operated by a State health department was grouped into one of three size
categories based on the percentage it contributes to total Federal NSA expenditures.20
SAs operated by an
ITO were included as a fourth category:
Large SAs contributed more than 2 percent to total Federal NSA expenditures (n = 14).
Medium SAs contributed more than 1 percent and up to 2 percent to total Federal NSA
expenditures (n = 16).
Small SAs contributed one percent or less to total Federal NSA expenditures (n = 26). ITOs were retained as a separate group, since they have unique funding and program
administration issues (n = 34).
ii. Structure
Another important factor to consider when examining NSA costs is SA structure. Nearly 48 percent of
SAs have a centralized structure; that is, the SA operates and staffs local service delivery sites (47.8
percent). Most ITOs and SAs operated by U.S. Territories fall into this category (Exhibit 3.1). More than
42 percent of SAs have a decentralized structure whereby they contract with LAs for local service
delivery (42.2 percent). The remaining 10 percent of SAs are considered to have a “combination”
structure—one that is a hybrid of truly centralized and decentralized structures. For example, Oklahoma
operates most of its sites directly through county health departments. However, it also contracts with 14
LAs to provide services in areas where there is not a county health department. The number of LAs with
which combination and decentralized SAs contract varies. In FFY 2013, the number of LAs per SA
ranged from 1 to 110.
As depicted in exhibit 3.1, most small, medium, and large State agencies have a decentralized structure
(57.7, 68.7, and 78.6 percent, respectively), however, each State agency size grouping includes at least
one agency with a centralized structure and at least two agencies with a combination structure. Most
ITOs, on the otherhand, have a centralized structure (97.1 percent). Only one ITO has a decentralized
structure.
20 SAs previously identified as high-cost were grouped into a size category for analysis purposes, primarily because (1) this group included only a small number of SAs and (2) WIC participation and NSA costs varied widely within this group. For example, Guam is one of the smallest SAs, while Puerto Rico is one of the largest SAs, yet both were were included in the high-cost category, because they are islands.

2015 WIC NSA Cost Study ● Final Report PAGE | 24
Exhibit 3.1 WIC SA Size and Structure
Note: SA size was determined based on FFY 2013 NSA expenditures. Large SAs contributed more than 2 percent of total Federal NSA expenditures; medium SAs contributed more than 1 percent and up to 2 percent of total Federal NSA expenditures; small SAs contributed 1 percent or less of total Federal NSA expenditures; and ITOs were retained as a separate group, since they have unique funding and program administration issues. Centralized SAs operate and staff local service delivery sites. Decentralized SAs contract with LAs for local service delivery. Combination SAs are a hybrid of a centralized and decentralized structure.
iii. EBT status
By the end of FFY 2014, 19.5 percent of SAs reported full implementation of EBT, 1.0 percent were
piloting EBT, 64.6 percent were in the planning phase, and 3.6 had not started EBT planning.21 Since the
focus of the survey was on costs incurred and changes in costs relative to FFY 2013, however, it may be
more important to consider the SA’s EBT status during this time frame. By the end of FFY 2013, 87.8
percent of SAs were still issuing paper food instruments, while the remaining 12.2 percent of agencies
had fully implemented an EBT system (Exhibit 3.2).22
21 Based on a weighted estimate of survey full responders. SAs responded to the Web survey between June and November 2014.
22 FNS Web site, updated November 2013.

2015 WIC NSA Cost Study ● Final Report PAGE | 25
Exhibit 3.2 Map of WIC SAs with EBT in the Contiguous U.S., FFY 2013
Source: FFY 2013 FNS administrative data.
iv. Age of MIS
SA survey respondents also reported on the age of their MIS. At the time of survey completion, 30.1
percent of SAs reported that their MIS was more than 15 years old, 17.0 percent reported it as 10–15
years old, 29.1 percent reported it as 5–9 years old, and 23.8 percent reported it as 1–4 years old.
B. Local Agency Characteristics
The eligible local-level study population included all WIC LAs. For study purposes, SAs with a
centralized or combination structure were counted as LAs, since they are responsible for providing direct
services within their State either in part or in full and are referred to herein as “SA-run” LAs. Because
SA-run LAs were asked to report only on local salaries and benefits, their reported local-level costs are
not comparable to LAs with which SAs contract; thus, they are excluded from most local-level analyses.
This section describes the LA population in terms of size, type, and colocation of WIC services.
Additional tables related to this section can be found in appendix I-1.
i. Size
For analysis purposes, each LA was grouped into one of three size categories based on average monthly
participation obtained directly from SAs:
Large LAs served an average of more than 9,000 participants monthly.
Medium LAs served an average of 2,501–9,000 participants monthly.
Small LAs served an average of 2,500 or fewer participants monthly.
Size category cutpoints were determined by first reviewing the distribution of average monthly
participation across all LAs and then attempting to identify natural cutpoints while also ensuring the

2015 WIC NSA Cost Study ● Final Report PAGE | 26
number of LAs in each group was sufficient for subgroup analysis. The majority of LAs were categorized
as small based on this definition (58.5 percent), while 29.6 percent were categorized as medium and only
11.9 were categorized as large. Exhibit 3.3 presents the proportion of LAs falling into each size category.
Exhibit 3.3 Percentage of LAs in Each Size Category
Source: FFY 2013 SA administrative data. Note: LA size is based on average monthly participation. Small agencies served 2,500 or fewer participants, medium agencies served more than 2,500 but at most 9,000 participants, and large agencies served more than 9,000 participants per month on average.
ii. Type
On the Web survey, LAs were asked to identify which of
the descriptions listed in exhibit 3.4 best described their
agency. LAs also had the ability to write in other
responses if none of these responses adequately
described their agency. For analysis purposes, these
agency types and many of the other responses provided
by LAs were recoded into one of three agency type
categories:
Exhibit 3.4 LA Types
City or county health department or agency
Nonprofit WIC-only agency
Private, nonprofit community health care agency
Hospital
Other
Tribal, health care, or social service agency
Local government, which comprises city and county health departments or agencies;
Nongovernment, which comprises nonprofit WIC-only agencies, private nonprofit community
health care agencies, hospitals, and other agency types (e.g., nonprofit social service agencies); and
Tribal, which comprises health care or social service agencies operated by a tribal entity.
While the majority of LAs were categorized as local government (65.8 percent), an additional 30.0
percent were categorized as non-government; only 4.2 percent were categorized as tribal. Exhibit 3.5
presents the proportion of LAs falling into each agency type category.

2015 WIC NSA Cost Study ● Final Report PAGE | 27
Exhibit 3.5 Percentage of LAs in Each Agency Type
Source: LA survey. Note: Estimates were weighted to represent the population of LAs. Local government comprises city and county health departments or agencies; nongovernment comprises nonprofit WIC-only agencies, private nonprofit community health care agencies, hospitals, and other agency types (e.g., nonprofit social service agencies); and tribal comprises health care or social service agencies operated by a tribal entity.
iii. Services offered by WIC LA-sponsoring agencies
Agencies were also asked whether they were a stand-alone WIC provider or part of a sponsoring agency
that provides services other than WIC. Only 6.0 percent of agencies self-identified as a stand-alone WIC
provider, indicating that the vast majority of LAs (94.0 percent) are part of an organization or agency that
provides other services in addition to WIC. Exhibit 3.6 presents the percentage of LAs that reported their
sponsoring agency provides certain services outside of WIC. Immunization services were most frequently
reported (79.1 percent), followed by screenings (e.g., vision, hearing, lead) and family planning, which
were reported by 60.1 and 54.0 percent of agencies, respectively.
Exhibit 3.6 Ten Services Most Commonly Provided by Agencies That Are Collocated With WIC
Source: LA survey. Note: Estimates were weighted to represent the population of LAs.

2015 WIC NSA Cost Study ● Final Report PAGE | 28
C. Case Study SA Characteristics
Because the goal of the case studies was to gain an in-depth understanding of SA cost allocation to
specific program areas and the factors that influence these allocations, it was important to select a sample
of SAs that was diverse in terms of agency size, structure, number of LAs, benefit delivery method, and
FNS region. Exhibit 3.7 summarizes characteristics of SAs included in the case studies. In total, the case
study sample included eight decentralized, four centralized, and two combination SAs across a total of
five FNS regions. At the time of selection, three agencies were included from each of the size categories
(small, medium, and large), three were included from the ITO group, and two were identified as high cost.
However, for analysis purposes, SAs were categorized into size classifications based on FFY 2013 NSA
expenditures, because it is the fiscal period on which the study is focused.23 Additionally, SAs previously
identified as high cost were also incorporated into a size classification (both high-cost case study SAs fell
into the small category). Eleven of the 14 case study SAs were still using paper food instruments (FI) in
FFY 2013, whereas only three had fully implemented EBT by that time. Summary profiles for each of the
case study SAs are provided in appendix J.
Exhibit 3.7 Case Study SA Characteristics
Size category SA Structure Number of LAs
included in case study
Benefit delivery method
FNS region
Large (n = 3) California Decentralized 4 Paper FIs Western
Large (n = 3) Texas Decentralized 3 EBT Southwest
Large (n = 3) Illinois Decentralized 3 Paper FIs Midwest
Medium (n = 2) Missouri Decentralized 3 Paper FIs Mountain Plains
Medium (n = 2) Oklahoma Combination 3 Paper FIs Southwest
Small (n = 6) Guam Centralized 0 Paper FIs Western
Small (n = 6) Arkansas Centralized 0 Paper FIs Southwest
Small (n = 6) Hawaii Decentralized 2 Paper FIs Western
Small (n = 6) Connecticut Decentralized 2 Paper FIs Northeast
Small (n = 6) Nevada Decentralized 2 EBT Western
Small (n = 6) South Dakota Combination 0 Paper FIs Mountain Plains
ITO (n = 3) Rosebud Sioux Centralized 0 Paper FIs Mountain Plains
ITO (n = 3) Chickasaw Nation Centralized 0 EBT Southwest
ITO (n = 3) ITCA Decentralized 2 Paper FIs Western
23 FFY 2012 NSA grant amounts were originally used to categorize SAs into the small, medium, or large group, since this information was
readily available when SAs were selected and recruited as case study sites (spring 2014). Once new size classifications were established based on FFY 2013 NSA expenditures, Arkansas shifted from the medium category to the small category.

2015 WIC NSA Cost Study ● Final Report PAGE | 29
Chapter IV: Budget Planning
This chapter describes information obtained from interviews with 14 SAs and 24 LAs in 9 of those States
on topics related to budget planning processes. Case study SAs were asked to describe how they approach
planning their WIC budget including decisions for allocating NSA grant funds for SA-level functions and
local program services (Exhibit 1.3 in chapter I for a partial list of SA- and local-level functions) and
practices for planning for specific program functions and costs. The LAs participating in the case study
interviews were asked to explain the local budgeting process and factors that they consider when planning
their WIC budget. Comparisons are made between SAs with different operational structures and LAs
operated by government and nonprofit organizations.
Because the FFY 2013 WIC appropriation was subject to spending cuts associated with the Federal
budget sequestration, there was uncertainty at the beginning of the year regarding the amount and timing
of NSA grants to SAs. During this period, the SAs needed to make decisions regarding program
operations, including caseload levels and, when applicable, allocation of funds to LAs. Case study SAs
and LAs were asked how this affected their budget planning and operations during the interviews.
In addition to information from case study SAs and LAs, this chapter includes responses to survey
questions related to budget planning factors, non-NSA funding and in-kind resources available to SAs and
LAs. Related tables can be found in appendix I-2. Lastly, data on State-appropriated funds available to
SAs as reported on FNS-798A reports are described.
A. WIC SA Budget Planning
The 14 SAs participating in case study interviews were asked to describe factors that were considered in
planning their WIC budget for FFY 2013. The factors that were mentioned most often include the
following:
Historical budget and expenditures. SAs described prior year expenditures as a starting point for
planning the subsequent year budget and noted that this information is important for determining
the amount of the NSA grant to budget for SA-level functions and for local program services.
Twelve of the 14 case study SAs reported that the percentage of funds for the SA- and local-level
remained consistent between FFY 2012 and FFY 2013. The two SAs that reported a change
indicated that the amount for local program services increased in FFY 2013 due to (1) salary
increases for staff providing direct services and (2) a change in their LA funding formula to
increase the amount per participant.
Caseload. All case study SAs mentioned WIC caseload as a key factor affecting how they plan
their budget for every fiscal year since caseload drives the cost of delivering services. Caseload
fluctuations, either up or down, impact both the amount of the NSA grant the SA receives and how
funds are allocated between SA- and local-level operations. About 70 percent of the SAs that
responded to the SA survey also identified caseload and prior-year expenditures as primary factors
in planning their budget.
State and Federal fiscal year differences. Several case study SAs indicated that fiscal year
differences between State and Federal governments affect their budget process. SAs that operate
on a State fiscal year (SFY, usually July 1–June 30) noted that NSA grant funds for an FFY are
planned across two SFYs. Therefore, they must use the grant from the last quarter of an FFY as
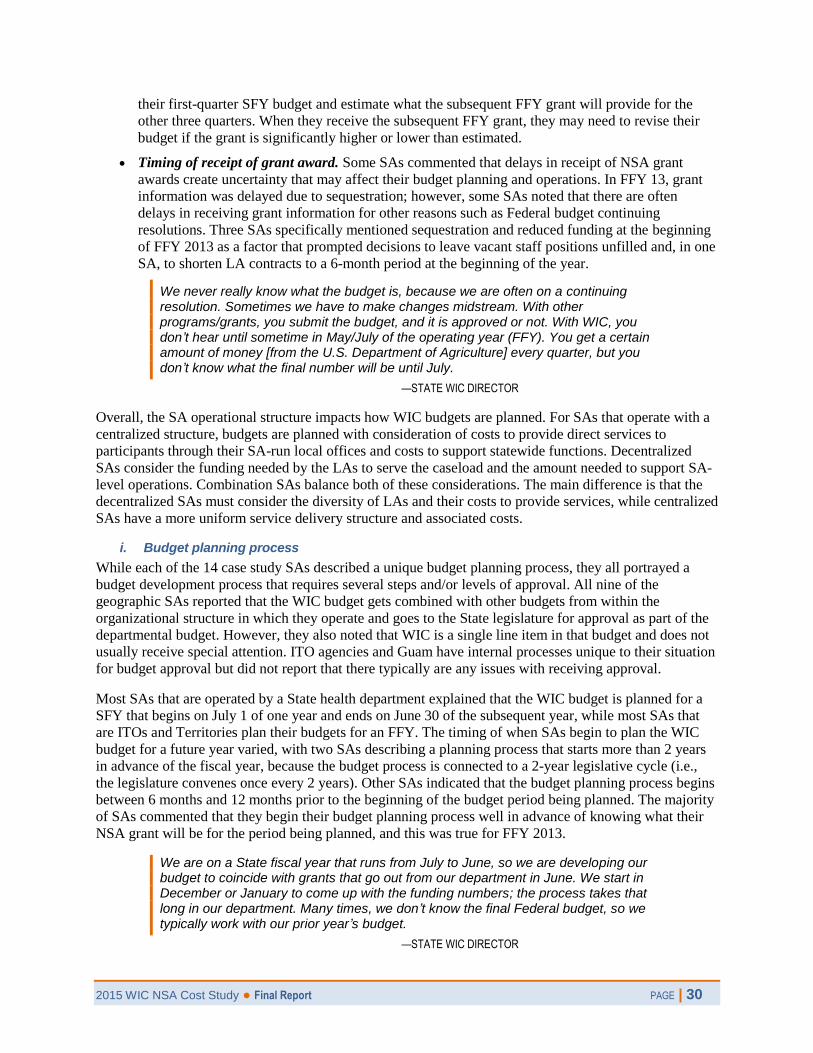
2015 WIC NSA Cost Study ● Final Report PAGE | 30
their first-quarter SFY budget and estimate what the subsequent FFY grant will provide for the
other three quarters. When they receive the subsequent FFY grant, they may need to revise their
budget if the grant is significantly higher or lower than estimated.
Timing of receipt of grant award. Some SAs commented that delays in receipt of NSA grant
awards create uncertainty that may affect their budget planning and operations. In FFY 13, grant
information was delayed due to sequestration; however, some SAs noted that there are often
delays in receiving grant information for other reasons such as Federal budget continuing
resolutions. Three SAs specifically mentioned sequestration and reduced funding at the beginning
of FFY 2013 as a factor that prompted decisions to leave vacant staff positions unfilled and, in one
SA, to shorten LA contracts to a 6-month period at the beginning of the year.
We never really know what the budget is, because we are often on a continuing resolution. Sometimes we have to make changes midstream. With other programs/grants, you submit the budget, and it is approved or not. With WIC, you don’t hear until sometime in May/July of the operating year (FFY). You get a certain amount of money [from the U.S. Department of Agriculture] every quarter, but you don’t know what the final number will be until July.
—STATE WIC DIRECTOR
Overall, the SA operational structure impacts how WIC budgets are planned. For SAs that operate with a
centralized structure, budgets are planned with consideration of costs to provide direct services to
participants through their SA-run local offices and costs to support statewide functions. Decentralized
SAs consider the funding needed by the LAs to serve the caseload and the amount needed to support SA-
level operations. Combination SAs balance both of these considerations. The main difference is that the
decentralized SAs must consider the diversity of LAs and their costs to provide services, while centralized
SAs have a more uniform service delivery structure and associated costs.
i. Budget planning process
While each of the 14 case study SAs described a unique budget planning process, they all portrayed a
budget development process that requires several steps and/or levels of approval. All nine of the
geographic SAs reported that the WIC budget gets combined with other budgets from within the
organizational structure in which they operate and goes to the State legislature for approval as part of the
departmental budget. However, they also noted that WIC is a single line item in that budget and does not
usually receive special attention. ITO agencies and Guam have internal processes unique to their situation
for budget approval but did not report that there typically are any issues with receiving approval.
Most SAs that are operated by a State health department explained that the WIC budget is planned for a
SFY that begins on July 1 of one year and ends on June 30 of the subsequent year, while most SAs that
are ITOs and Territories plan their budgets for an FFY. The timing of when SAs begin to plan the WIC
budget for a future year varied, with two SAs describing a planning process that starts more than 2 years
in advance of the fiscal year, because the budget process is connected to a 2-year legislative cycle (i.e.,
the legislature convenes once every 2 years). Other SAs indicated that the budget planning process begins
between 6 months and 12 months prior to the beginning of the budget period being planned. The majority
of SAs commented that they begin their budget planning process well in advance of knowing what their
NSA grant will be for the period being planned, and this was true for FFY 2013.
We are on a State fiscal year that runs from July to June, so we are developing our budget to coincide with grants that go out from our department in June. We start in December or January to come up with the funding numbers; the process takes that long in our department. Many times, we don’t know the final Federal budget, so we typically work with our prior year’s budget.
—STATE WIC DIRECTOR
2015 WIC NSA Cost Study ● Final Report PAGE | 31
Finance or fiscal staff from within WIC or the SA organization were mentioned most often as the
individuals who are most involved in planning the WIC budget, with the State WIC Director mentioned
next most often. In SAs where someone other than the State WIC Director initiates budget planning,
nearly all interview respondents indiated that the WIC Directors review the budget or provide input.
ii. Allocating the NSA grant between the SA and local levels
Case study SAs were asked to explain how they determine what portion of NSA funds to allocate for SA-
level functions and local program services when they plan their WIC budgets. Virtually all SAs stressed
the importance of allocating sufficient funds for local service delivery to maintain or increase caseload.
There were, however, different approaches to making decisions about allocating funds for SA- and local-
level operations. All of the decentralized SAs described a specific process for dividing WIC NSA funds
between the SA- and local-level. Most of these SAs use a funding formula or cost per participant to plan
for funds needed to support LA operations, and several commented that they allocate funds needed for
LAs as a first step in budget planning and use the remaining funds for SA functions.
We make sure that as much goes to the local level as possible. Participant-centered services is our goal. As little funds at the State level as possible is our desire.
—STATE WIC DIRECTOR
The centralized SAs explained that they do not specifically allocate their grant between the SA- and local-
level, since these SAs provide services to participants directly. They acknowledged that costs for
personnel/staffing to provide the direct services are the priority in budget planning, but they do not think
of these as separate budget portions. One centralized SA described having a regionalized structure of
State-operated local health departments with a budgeting process that includes regional allocations for
local WIC services based on labor utilization.
Combination SAs reported using expenditure data from previous years as a guide in dividing NSA funds
between the SA and local levels. These SAs discussed the significance of personnel/staffing costs in
planning their budget. Employee time reporting was described by one combination SA as the source of
data for allocating funds and tracking expenditures for State employees who work in local offices
providing services to participants (e.g., county health departments), as well as those who perform SA
functions (e.g., central office). Another combination SA described allocating funds for their LAs based on
their history of caseload performance and expenditures.
iii. Budget planning for program functions and costs
When the 14 case study SAs were asked about budgeting for SA-level functions (e.g., vendor
management, breastfeeding promotion), 11 reported planning and managing SA-level functions in
aggregate without regard to individual organizational subunits or program functions. One SA mentioned
that although it manages the WIC funds as an aggregate, it has a system for tracking a specific type of
funding or a function within their program (e.g., MIS expenditures). A second SA indicated that it has
line item budgets for nutrition services and breastfeeding for tracking expenditures, although it manages
its total budget as an aggregate. Three of the SAs shared that their budgets have line items or separate
budget amounts for certain functions (e.g., client services, breastfeeding, nutrition education).
The case study SAs reported that several key factors affected decisions they made regarding use of NSA
funds for FFY 2013. One-third of these SAs reported personnel/staff expenses as a key factor, describing
increases in benefit costs and salary increases that affected the amount of funds needed for this budget
item. About one-third mentioned information technology (e.g., MIS, maintenance costs) as a key factor.
Less commonly reported factors included travel, utilities, and contract costs. Two of the case study SAs
reported that they needed to plan for cutting costs during FFY 2013 and considered both SA- and local-
level costs that could be reduced, shifted, or eliminated if needed.

2015 WIC NSA Cost Study ● Final Report PAGE | 32
All the unknowns around sequestration and all the impacts it might have had needed to be considered. We’ve been involved with the WIC Program a long time and can hardly ever remember a cut [in funding]. It was a little hard to believe that might happen, but we did have to write contingency plans for our administration.
—STATE WIC DIRECTOR
When asked whether there were budget adjustments such as moving funds within the WIC budget during
the course of FFY 2013, slightly more than half the case study SAs reported making budget changes
during the year. The most common reason shared by these SAs was a change in personnel/staffing costs
(e.g., funds saved from positions being vacant). A few SAs commented that they routinely monitor WIC
expenditures and make budget adjustments throughout the year to address under- or overexpenditures in
different budget items. Three SAs also mentioned that budget changes occur when they receive additonal
funds (e.g., operational adjustment, reallocated funds) awarded during the year, and two of those SAs
recalled making adjustments for this reason during FFY 2013.
All but 1 of the 14 case study SAs reported budgeting and using NSA funds for contracted services,
including technology, outreach, conference planning, and audits. The use of contracted services for
information technology and MIS was reported by 11 of these SAs. Contracts for conferences and training
were reported by five SAs, and four indicated they have contracts for banking services. Most SAs
commented that costs for contracted services have been stable for the past few years, with only one
indicating that the amount spent on contracted services is growing.
Twelve of the 14 case study SAs report that they budget for and purchase equipment, materials, or other
resources for LAs. The costs of these items are included in the SA-level budget, even though they are
used at the local level. The items most often purchased are computers/printers (10 SAs) and breast pumps
(9 SAs). Other items purchased by these SAs for local use include nutrition education materials,
anthropometric and blood testing equipment, and training services. Some SAs distribute items to LAs
upon their request; others calculate the amount of items LAs receive based on caseload, number of staff,
or number of WIC clinics.
Case study SAs were asked about the amount of NSA funds used for indirect costs during FFY 2013.
Indirect rates reported during the interviews ranged from 5.1 percent to 38.0 percent, with nearly half the
SAs reporting rates between 17.8 percent and 21.6 percent. Both extremes of the indirect cost rate range
were reported by decentralized SAs. There was a narrow range of variation reported among ITOs, Hawaii,
and Guam, with indirect rates for ITOs being between 20.4 percent and 25.3 percent and indirect rates for
Hawaii and Guam being 15.8 percent and 17.8 percent, respectively. The full indirect cost rate was not
applied by two of the SAs due to limitations of the NSA grant; one of these explained that the amount of
indirect costs charged to WIC was “capped” at a set dollar amount (which was lower than the amount
calculated for the approved indirect cost rate), and the other shared that WIC was not charged for indirect
costs in FFY 2013.
There was an agency decision made to reduce WIC’s required indirect cost, because WIC funds were so reduced that year. Doing this was one of our strategies to try and keep our WIC services functioning during that time of reduced funding, because most of our funds were going to WIC staff. We don’t want to reduce staff if we can help it, because that impacts services and caseload.
—STATE WIC DIRECTOR
iv. Budget practices for local-level operations
The SA survey asked about approaches used to determine funding amounts for local service delivery
operations. As shown in exhibit 4.1, a little more than one-third of the respondents (35.5 percent)

2015 WIC NSA Cost Study ● Final Report PAGE | 33
indicated that the local services are provided directly by the SA (SA-run), so they do not have specific
allocations for local-level operations (e.g., centralized model). About 27 percent of SA respondents make
the determination through a funding formula, and the remainder use negotiated contracts or grants or a
combination of approaches.
Exhibit 4.1 Percentage of SAs Using Various Methods to Fund Local Services, FFY 2013
Source: SA Web survey. Note: Estimates were weighted to represent the population of SAs.
Case study SA responses to questions regarding how they determine funding amounts for LAs were
consistent with the SA survey. All but one of the decentralized SAs and one of the combination SAs
report using funding formulas to determine the budget amounts for LA contracts with caseload as the key
formula factor. Most of these SAs indicated the funding formulas work well overall, but some said they
are in the process of revising their funding formulas to address concerns from LAs regarding insufficient
funds or to incorporate performance standards. One decentralized SA reported using a Request for
Applications process and negotiating the LA budgets. Decentralized and combination SAs were asked
whether their LAs are required to prepare detailed budgets, and most responded that these are required. Of
the SAs that require detailed budgets from their LAs, all but one report that LAs must receive approval
from the SA to make budget changes through budget modifications or other approval methods, although
two of these SAs allow redirection of funds between line items up to a limited threshold without SA
approval.
Case study SAs that have contracts with LAs were asked whether there is a limit on the amount of
indirect costs that can be included in LA contract budgets. Of the 10 SAs for whom this question was
applicable, 4 indicated a limit on these costs. These four reported indirect cost limit ranges from 8 percent
to 20 percent, with limits that are based on the approved indirect rate for the State department or
organization that oversees WIC or on historical need. For SAs that indicate no limit on LA indirect costs,
most described some other method to control local indirect costs, such as audits of indirect costs and
negotiation when contracts are established.
The 10 SAs that have contracts with LAs and/or plan local-level budgets were asked whether they make
midyear adjustments to local-level budgets based on not meeting caseload targets or underspending the
budget amounts. Six of these SAs reported that they do make midyear adjustments; the other four
reported that they make adjustments in the subsequent year if performance expectations are not met.
When LAs exceed caseload targets or local-level budgets are overspent, several of the SAs will provide
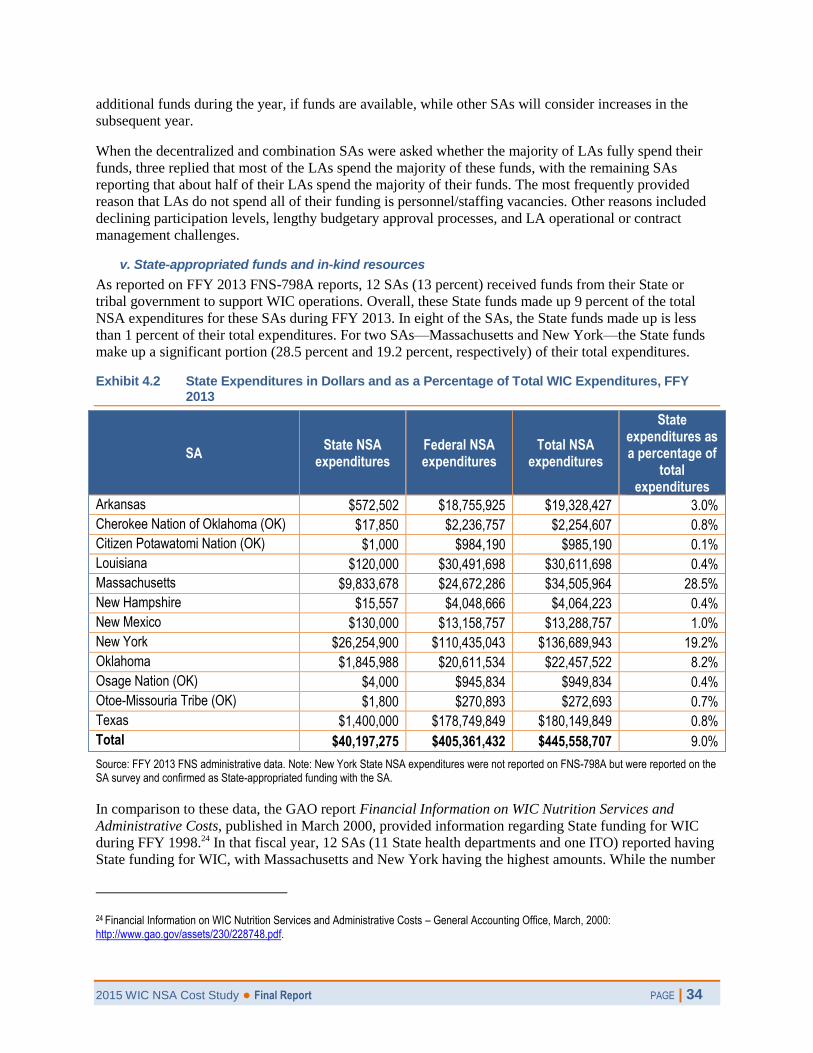
2015 WIC NSA Cost Study ● Final Report PAGE | 34
additional funds during the year, if funds are available, while other SAs will consider increases in the
subsequent year.
When the decentralized and combination SAs were asked whether the majority of LAs fully spend their
funds, three replied that most of the LAs spend the majority of these funds, with the remaining SAs
reporting that about half of their LAs spend the majority of their funds. The most frequently provided
reason that LAs do not spend all of their funding is personnel/staffing vacancies. Other reasons included
declining participation levels, lengthy budgetary approval processes, and LA operational or contract
management challenges.
v. State-appropriated funds and in-kind resources
As reported on FFY 2013 FNS-798A reports, 12 SAs (13 percent) received funds from their State or
tribal government to support WIC operations. Overall, these State funds made up 9 percent of the total
NSA expenditures for these SAs during FFY 2013. In eight of the SAs, the State funds made up is less
than 1 percent of their total expenditures. For two SAs—Massachusetts and New York—the State funds
make up a significant portion (28.5 percent and 19.2 percent, respectively) of their total expenditures.
Exhibit 4.2 State Expenditures in Dollars and as a Percentage of Total WIC Expenditures, FFY 2013
SA State NSA
expenditures Federal NSA expenditures
Total NSA expenditures
State expenditures as a percentage of
total expenditures
Arkansas $572,502 $18,755,925 $19,328,427 3.0%
Cherokee Nation of Oklahoma (OK) $17,850 $2,236,757 $2,254,607 0.8%
Citizen Potawatomi Nation (OK) $1,000 $984,190 $985,190 0.1%
Louisiana $120,000 $30,491,698 $30,611,698 0.4%
Massachusetts $9,833,678 $24,672,286 $34,505,964 28.5%
New Hampshire $15,557 $4,048,666 $4,064,223 0.4%
New Mexico $130,000 $13,158,757 $13,288,757 1.0%
New York $26,254,900 $110,435,043 $136,689,943 19.2%
Oklahoma $1,845,988 $20,611,534 $22,457,522 8.2%
Osage Nation (OK) $4,000 $945,834 $949,834 0.4%
Otoe-Missouria Tribe (OK) $1,800 $270,893 $272,693 0.7%
Texas $1,400,000 $178,749,849 $180,149,849 0.8%
Total $40,197,275 $405,361,432 $445,558,707 9.0%
Source: FFY 2013 FNS administrative data. Note: New York State NSA expenditures were not reported on FNS-798A but were reported on the SA survey and confirmed as State-appropriated funding with the SA.
In comparison to these data, the GAO report Financial Information on WIC Nutrition Services and
Administrative Costs, published in March 2000, provided information regarding State funding for WIC
during FFY 1998.24 In that fiscal year, 12 SAs (11 State health departments and one ITO) reported having
State funding for WIC, with Massachusetts and New York having the highest amounts. While the number
24 Financial Information on WIC Nutrition Services and Administrative Costs – General Accounting Office, March, 2000: http://www.gao.gov/assets/230/228748.pdf.

2015 WIC NSA Cost Study ● Final Report PAGE | 35
of SAs is the same in the two fiscal years, the percentage of total WIC expenditures from State funds
among the SAs that received them in FFY 1998 was a little more than 17 percent, compared to 9 percent
for FFY 2013. A key reason for the difference is the makeup of the SAs that received State funds during
the two fiscal years, with an increased number of ITOs and smaller SAs and a decreased number of larger
non-ITO SAs receiving these funds in FFY 2013.
While 13 percent of SAs reported receiving State funds during FFY 2013, about 25 percent reported on
the SA survey that they received in-kind support. Exhibit 4.3 shows the types of in-kind support reported
on the survey, with utilities (15.1 percent), facilities (12.1 percent), and staff support for computer
systems and networks (10.7 percent) as the most frequently reported types.
Exhibit 4.3 Percentage of SAs That Received In-Kind Contributions in FFY 2013
Note: Estimates were weighted to represent the population of SAs. Respondents could select multiple responses. A total of 5 SA full responders did not know whether their agency received one or more types of in-kind contribution; these were recoded as missing.
When case study SAs described their budget planning processes, none of them specifically mentioned
having funds appropriated by their State included in their budget plans, nor did they describe factoring in-
kind support into their budgets. Two of the case study SAs that reported receiving State funding in FFY
2013 explained that their States provide financial support for WIC when the NSA grant is not sufficient to
cover all program costs. In both cases, the WIC budgets are planned with the available NSA grant, and
the State “makes up the difference” needed to operate the program. One SA reported that it provided that
support in FFY 2013 by reducing the amount of indirect costs charged to WIC (i.e., the SA did not charge
the full percentage of indirect in its approved cost allocation plan). With respect to factoring in-kind
support into budget planning, SAs likely view it as a cost they can avoid including in the budget rather
than as a source of financial support to be planned in the budget. That notion is supported by SA survey
responses to the question regarding whether SAs can provide a dollar value for the in-kind support they
receive, since no repondents were able to do so.
B. WIC LA Budget Planning
The 24 LAs participating in the case study interviews were selected by 9 of the SAs participationg in the
case study. SAs were asked to select LAs representative of diversity in caseload size, type of organization
(e.g., city/county government, nonprofit, Federally Qualified Health Center) and urban/rural location.
2015 WIC NSA Cost Study ● Final Report PAGE | 36
Nineteen of the LAs were selected from the seven SAs with a decentralized structure, and five of the LAs
were selected from the two SAs with a combination structure.
i. Budget planning processes
The 24 LAs in case study States were asked to describe their approach to planning their WIC budget.
Similar to the SAs interviewed for the case studies, the specific budget planning and approval processes
described by LAs were unique. There were no specific process features that were described consistently
by LAs operated by city or county government or by those operated by tribal or nonprofit organizations.
However, some government-operated LAs explained that the WIC budget is integrated into the overall
budget for the city or county and goes through the review and approval process as part of the larger
agency budget. Nearly all LAs reported that the local WIC Director is involved in the planning process
either as the person who drafts the budget or as a contributor. A majority of LAs described working with
their fiscal/accounting and human resources departments during the budget planning process to obtain
information on salaries and benefits and historical expenditures. Half the LAs mentioned that the WIC
budget is reviewed and approved by a board of directors, city or county government board or committee,
or tribal council before or after it is submitted to the SA. Only a few stated that there is not a review or
approval process within their agency prior to submitting their budget to the SA. While several LAs
described budget processes that were lengthy and required many steps, only one indicated that the process
may impede its ability to use WIC funds.
The WIC budget is reviewed and approved at the WIC Program management level prior to submitting to the State WIC Program. Once we receive the State WIC agreement, which includes the budget, it is approved by the county Department of Public Health fiscal and administration staff and our County Board of Supervisors. The WIC budget is also incorporated into our county budget which is approved by the Department of Public Health fiscal director and the Department director.
—LOCAL WIC DIRECTOR
Once the WIC budget is prepared by accounting and the WIC director, it goes to both the Chief Financial Officer and the Chief Executive Officer for review and sign off. The WIC budget gets incorporated into the Agency budget and is sent to the Board of Directors.
—LOCAL WIC DIRECTOR
The majority of LAs reported that their contracts with the SA are for an FFY (October 1–September 30), and
most stated that the contracts are established for a single year. A few LAs have multiyear contracts with
budgets that are updated prior to each contract year. LAs in one State reported having a 6-month contract
period when FFY 2013 began but explained that they received a contract for a 12-month period within a few
months after the start of the year. These LAs indicated the 6-month contract period was not typical.
Most case study LAs stated that the funding they receive is based on caseload (i.e., the number of
participants they are serving or anticipate serving). Only three LAs stated they are able to negotiate their
budget amounts with the SA, although a few LAs said they had not thought about the possibility of trying
to negotiate their budgets. All 24 LAs said the SA usually informs them of the contract amount they will
receive for the next fiscal year between late spring and the end of summer (e.g., May–September).
2015 WIC NSA Cost Study ● Final Report PAGE | 37
Each year in the summer, State WIC consultants meet with us to review the anticipated caseload and grant for the upcoming year. We develop the budget based on the grant information they give us.
—LOCAL WIC DIRECTOR
ii. Budget planning factors
Most of the 24 case study LAs reported using historical expenditure information along with anticipated
expenses in the upcoming year (e.g., salary increases, changes to benefits, equipment purchases) to plan
the budget. Some LAs consider caseload trends when preparing their budgets. Specifically, if caseload is
declining, they prepare for a possible reduction in the funds they receive from the SA by budget
adjustments such as reducing staffing or closing WIC sites. Almost one-third of the LAs indicated that
they did make reductions in staffing, sites, and/or supplies during FFY 2013.
All of the LAs indicated that personnel/staffing costs, including salaries, salary increases, and benefits,
are the biggest factor when planning their budgets. While some LAs reported that salary increases are
negotiated in employee union contracts, others stated that salary increases are only provided if the agency
parent organization determines that increases are affordable for all staff working in the organization.
Our practice has been to take a strong look at historical information for the previous year and then couple that with forecasting. [So we ask ourselves whether] we received an increase in caseload and what other changes in costs we anticipate like staff turnover or an increase in salaries. It is more of an intuitive process than a numbers process. [We look at] the priorities and what else we anticipate going on during the year.
—LOCAL WIC DIRECTOR
After personnel/staffing costs, the next most prominent budget planning factor described by case study
LAs was rent or facility costs. While many local-government–operated LAs (cities and counties)
explained that they have access to some of the space they use for WIC for little or no cost, many others
cited facility costs as a very significant part of their budgets. Other costs that LAs described as part of
their budget include travel, office supplies, nutrition education materials, equipment, and repairs, although
some described these as lower priorities that are considered after costs for personnel/staffing and facilities
are included in the budget. A few LAs reported not being able to purchase supplies or delaying repairs at
WIC sites because there were not enough funds in their budget to pay for these. A small number
specifically mentioned receiving funds for special projects or activities in addition to the funding to serve
their caseload and indicated that these funds have a separate budget or are identified in their budget (e.g.,
separate budget line item).
Eighteen of the 24 LAs reported that a portion of their budget is planned and used to pay for agency
indirect costs, while 6 of them stated that they do not include indirect costs in the WIC budget. Of the
LAs that include indirect costs in the WIC budget, the rates ranged from 5 percent to 23 percent for FFY
2013, with most LA indirect charged at 10 percent to 14 percent. Several LAs mentioned that indirect
costs were used to cover services such as accounting, human resources, and informaton technology
sevices. A majority of the LAs that include indirect costs in the WIC budget reported that these costs have
stayed about the same over the past 3 years, one indicated that indirect costs decreased, and four indicated
that indirect costs had increased.
iii. Local funds and in-kind resources
Local agencies that completed the LA survey were asked for information regarding types of funding other
than NSA they use for WIC operations, and 68 percent indicated they do have other funding sources.
While the majority of responses indicated they receive other Federal WIC funds, especially Breastfeeding
Peer Counseling Program funds, about 13 percent indicated they receive non-Federal local-appropriated

2015 WIC NSA Cost Study ● Final Report PAGE | 38
(8.9 percent) or non-Federal State-appropriated (3.5 percent) funds, and more than 20 percent responded
that they receive other types of funding. Exhibit 4.4 shows the information reported on the survey.
Exhibit 4.4 Percentage of LAs Reporting Other Types of Funding, FFY 2013
Source: LA Web survey. Note: Estimates were weighted to represent the population of LAs. Two full responders were excluded due to missing data on other sources of funds.
The information provided by the 24 LAs that participated in case study interviews aligns with the LA
survey responses. Nearly half of the LAs in the case study States reported receiving non-WIC funds from
a State or local source, with most of them reporting that the funds are incorporated into the WIC budget.
Government-based agencies were much more likely to receive non-WIC funds than nonprofit-based
agencies. Examples of non-WIC funding included revenue from health insurance billing, private
donations, the Community Services Block Grant, and United Way funds. A few tribal and government-
based agencies reported they are receiving local funds from their tribal, city, or county government to
help supplement WIC funds (e.g., to pay for staff). A majority of the LAs receiving non-WIC funds stated
there is a policy or practice that WIC funds must be expended first before non-WIC funds from a State or
local source are used.
The LA survey collected information regarding types of in-kind support available to LAs during FFY
2013. A little more than half (50.5 percent) of LAs report receiving one or more forms of in-kind
contributions. Exhibit 4.5 shows the responses regarding in-kind contributions, with facilities (39.9
percent), utilities (28.0 percent), and staff support for computer systems and networks (23.7 percent) as
the most frequently reported types.
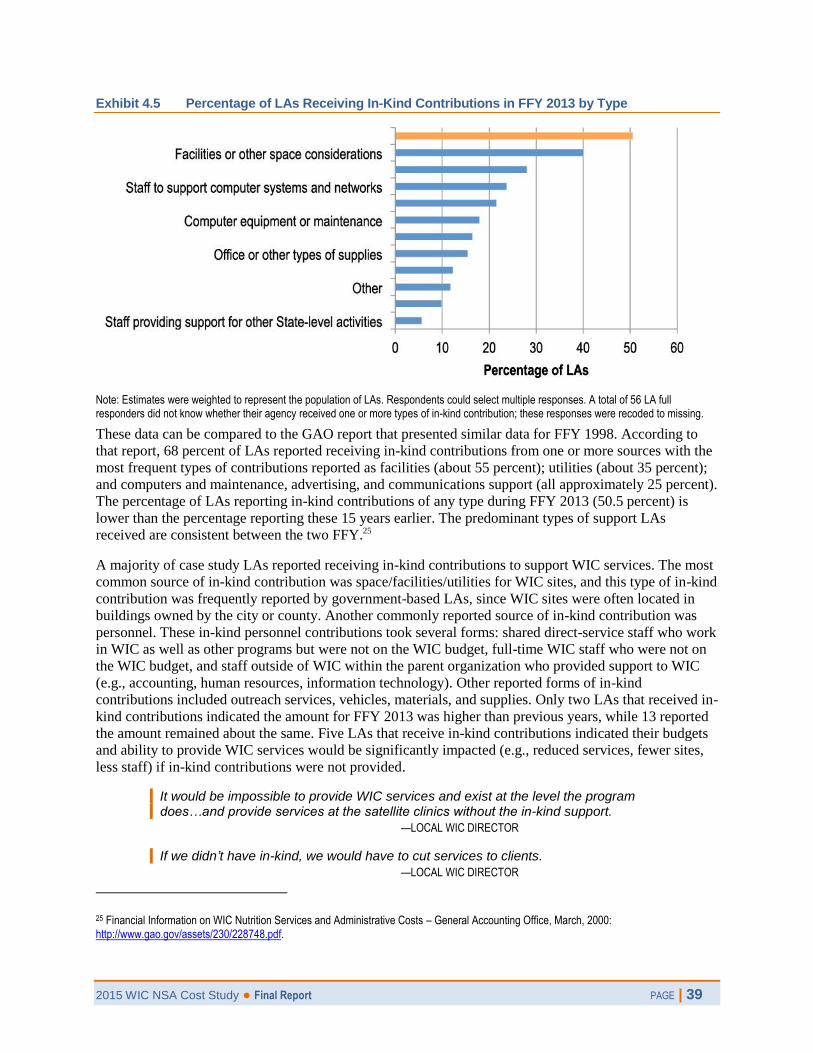
2015 WIC NSA Cost Study ● Final Report PAGE | 39
Exhibit 4.5 Percentage of LAs Receiving In-Kind Contributions in FFY 2013 by Type
Note: Estimates were weighted to represent the population of LAs. Respondents could select multiple responses. A total of 56 LA full responders did not know whether their agency received one or more types of in-kind contribution; these responses were recoded to missing.
These data can be compared to the GAO report that presented similar data for FFY 1998. According to
that report, 68 percent of LAs reported receiving in-kind contributions from one or more sources with the
most frequent types of contributions reported as facilities (about 55 percent); utilities (about 35 percent);
and computers and maintenance, advertising, and communications support (all approximately 25 percent).
The percentage of LAs reporting in-kind contributions of any type during FFY 2013 (50.5 percent) is
lower than the percentage reporting these 15 years earlier. The predominant types of support LAs
received are consistent between the two FFY.25
A majority of case study LAs reported receiving in-kind contributions to support WIC services. The most
common source of in-kind contribution was space/facilities/utilities for WIC sites, and this type of in-kind
contribution was frequently reported by government-based LAs, since WIC sites were often located in
buildings owned by the city or county. Another commonly reported source of in-kind contribution was
personnel. These in-kind personnel contributions took several forms: shared direct-service staff who work
in WIC as well as other programs but were not on the WIC budget, full-time WIC staff who were not on
the WIC budget, and staff outside of WIC within the parent organization who provided support to WIC
(e.g., accounting, human resources, information technology). Other reported forms of in-kind
contributions included outreach services, vehicles, materials, and supplies. Only two LAs that received in-
kind contributions indicated the amount for FFY 2013 was higher than previous years, while 13 reported
the amount remained about the same. Five LAs that receive in-kind contributions indicated their budgets
and ability to provide WIC services would be significantly impacted (e.g., reduced services, fewer sites,
less staff) if in-kind contributions were not provided.
It would be impossible to provide WIC services and exist at the level the program does…and provide services at the satellite clinics without the in-kind support.
—LOCAL WIC DIRECTOR
If we didn’t have in-kind, we would have to cut services to clients.
—LOCAL WIC DIRECTOR
25 Financial Information on WIC Nutrition Services and Administrative Costs – General Accounting Office, March, 2000: http://www.gao.gov/assets/230/228748.pdf.
2015 WIC NSA Cost Study ● Final Report PAGE | 40
Chapter V: NSA Expenditure Levels
For FFY 2013, FNS provided NSA grants totaling $1.923 billion to 90 SAs to operate WIC. Most of these
grant funds were provided through the FFY 2013 WIC appropriation, which totaled $6.413 billion. Of
that amount, the portion available for NSA grants was determined by calculating a guaranteed national
AGP for FFY 2013 as required by Federal law. Federal WIC regulations guiding the distribution of WIC
funds specify, “The funds available for allocation to SAs for NSA for each fiscal year must be sufficient
to guarantee a national average per participant NSA grant, adjusted for inflation.”26 The AGP is
determined by applying an inflation adjustment based on an index associated with State and local
government purchases to the AGP from the preceeding fiscal year to help ensure grants to SAs are
sufficient to keep up with costs that increase over time. For FFY 2013, the AGP was $18.11 resulting in
$1.791 billion (28 percent) of the appropriation designated for NSA.
Grants to individual SAs were calculated using an NSA funding formula, which is also specified in
Federal regulations and starts with a base amount that intends that “each State agency shall receive an
amount equal to 100 percent of the final formula-calculated NSA grant of the preceding fiscal year prior
to any operational adjustment funding allocations….” The funding formula also includes a fair share
allocation that factors in SA monthly participation levels with an adjustment that takes into consideration
the higher per-participant costs associated with serving small participation levels and variation in salary
costs in different parts of the country. After grants for each SA are calculated, 10 percent of the amount
for each SA is aggregated into an OA fund, along with the same portion for other SAs in their FNS
region. The FNS Regional Offices allocate these OA funds to SAs in their region according to national
guidelines reflecting program priorities and with consideration of varying needs of SAs within their
region. Some SAs receive OA funds that are greater than the 10 percent of their grant amount calculated
through the NSA funding formula, while others receive less than 10 percent. In addition to the amount
available from the annual appropriation, NSA grants may include reallocated funds not used in the prior
fiscal year and contingency funds included in the WIC appropriation in FFY 2009 that are available for
allocation to SAs in times when annual WIC appropriations are not sufficient to meet program needs.
During FFY 2013, FNS reallocated $375 million in unspent FFY 2012 funds and distributed $31.7
million in contingency funds.
Of the $1.923 billion allocated for NSA during FFY 2013, the SAs reported NSA costs totaling $1.882
billion for that fiscal year. FFY 2013 NSA costs were reported on the annual FNS-798A, Addendum to
WIC Financial Management and Participation Report: NSA Expenditures, including SA- and local-level
costs across four cost categories: program management, client services, nutrition education, and
breastfeeding promotion and support.
A. NSA Expenditures for SA- and Local-Level Operations
As discussed in chapter IV of this report, one of the key decisions that SAs make when planning their
WIC budget is the amount needed to support SA functions and local program services. While the
approach to planning for these costs varies based on SA operational structure and other factors, nearly all
SAs plan for and report on NSA costs at both the SA and local levels. According to information provided
26 CFR 246.16 ( c )

2015 WIC NSA Cost Study ● Final Report PAGE | 41
by SAs on the FNS-798A annual closeout report for FFY 2013, overall, 20.6 percent of total NSA
expenditures supported SA-level operations and 79.4 percent supported local-level operations.
In addition to calculating the percentage of NSA funds spent at the SA and local levels nationally, the
percentage was also calculated for each individual SA. The average percentage of NSA funds used to
support SA-level operations varied significantly by SA size (p is less than .0001) and by SA operational
structure (p is less than .0001) (Exhibit 5.1). When these associations were examined more closely,
however, statistically significant differences were only observed between ITOs and all other SAs
(including U.S. Territories). On average, ITOs spent 70.4 percent of their NSA grant funds on SA-level
operations, compared to an average of 26.7 percent among all SA-run agencies (p is less than .0001). This
difference likely reflects the operational approaches used by ITOs compared to State agencies. Nearly all
ITOs operate as centralized programs with the ITO performing WIC SA-level functions as well as
delivering program services to participants. In this structure, employees may have both SA- and local-
level job duties and facilities, supplies, etc. may also be shared, making differentiation of SA and local
costs more complex. While some State agencies operate with a centralized structure, the majority use
decentralized or combination structures which allow them to more easily distinguish SA- and local-level
expenditures.
Exhibit 5.1 Average Percentage of NSA Expenditures for SA- and Local-Level Expenditures, by SA Size and Structure, FFY 2013
Source: FFY 2013 FNS-798A annual closeout report. Note: Group mean percentages are presented. SA size was determined based on FFY 2013 NSA expenditures. Large SAs contributed more than 2 percent of total Federal NSA expenditures; medium SAs contributed more than 1 percent and up to 2 percent of total Federal NSA expenditures; small SAs contributed 1 percent or less of total Federal NSA expenditures; and ITOs were retained as a separate group, since they have unique funding and program administration issues. Centralized SAs operate and staff local service delivery sites. Decentralized SAs contract with LAs for local service delivery. Combination SAs are a hybrid of a centralized and decentralized structure.
B. NSA Expenditures Across Four Cost Categories
In addition to reporting NSA expenditures for SA- and local-level operations, SAs report on costs in each
of the four categories included on the FNS-798A closeout report. Nationally, about 34 percent of NSA
funds is spent on program management, while 37 percent is spent on client services, 21 percent is spent
on nutrition education, and 8 percent is spent on breastfeeding promotion and support. Since nutrition
education and breastfeeding promotion and support are considered program benefits and together

2015 WIC NSA Cost Study ● Final Report PAGE | 42
compose 29 percent of NSA expenditures, ultimately only 71 percent of all NSA expenditures are used to
administer WIC.
In addition to calculating the percentage of NSA funds spent on each of the four cost categories
nationally, the percentage was also calculated for each individual SA. Exhibit 5.2 shows the average
percentage of NSA costs expended in each category by agency size and structure. The percentages of
expenditures for program management and client services vary by agency size and structure. Upon closer
examination, pairwise testing (comparison of group means between one group and all other groups)
revealed that statistically significant differences exist between some but not all groups. For example, on
average, ITOs expended a significantly higher percentage of their NSA funds on program management
(48 percent) than medium and large SAs (34 percent and 32 percent, respectively) and a smaller
percentage on client services (23 percent) compared to all other SAs (36 percent). Additionally,
centralized ITOs expended a significantly higher percentage of their NSA funds on program management
than decentralized SAs did (48 percent compared to 34 percent, respectively), as well as a significantly
smaller percentage on client services (22 percent compared to 37 percent, respectively). A similar but
separate analysis was performed for both SA- and local-level expenditures in each cost category; the
results of these analysis are presented in appendix I-3.
Exhibit 5.2 Average Percentage of Total NSA Expenditures in Each Cost Category, by SA Size and Structure, FFY 2013
Source: FFY 2013 FNS administrative data. Note: Group mean percentages are presented and include both SA and local-level expenditures. SA size was determined based on FFY 2013 NSA expenditures. Large SAs contributed more than 2 percent of total Federal NSA expenditures; medium SAs contributed mor e than 1 percent and up to 2 percent of total Federal NSA expenditures; small SAs contributed 1 percent or less of total Federal NSA expenditures; and ITOs were retained as a separate group, since they have unique funding and program administration issues. Centralized SAs operate and staff local service delivery sites. Decentralized SAs contract with LAs for local service delivery. Combination SAs are a hyrid of a centralized and decentralized structure.
C. Average Monthly NSA Expenditure per Participant
Nationally, the average monthly NSA expenditure per participant was $18.14 in FFY 2013. This value
was calculated by dividing total Federal NSA expenditures at the national level by total FFY 2013 WIC
participation at the national level. The average expenditure per participant represents actual expenditures
and participation for FFY 2013 and is slightly higher ($0.03 or 0.2 percent) greater than the AGP of
$18.11 that was used to allocate grants to SAs.

2015 WIC NSA Cost Study ● Final Report PAGE | 43
To examine subgroups, the average monthly NSA expenditure per participant was calculated for each SA
by dividing its total Federal NSA expenditures by its annual WIC participation. Average expenditures
were then calculated and compared by agency size and structure groupings (Exhibit 5.3). Although
statistically significant differences were observed by agency size and structure, when examined more
closely using pairwise comparisons, the differences were only significant between State agencies of all
sizes and ITOs. On average, State agencies spent $20.07 per participant per month, which is statistically
significantly less than the $46.33 ITOs spent per participant per month in FFY 2013 (p is less than .0001;
see exhibit 5.3).
Exhibit 5.3 Average Monthly NSA Expenditure per Participant, by Agency Size, FFY 2013
Agency Size n Mean Standard deviation Min Max
Large 14 $18.37 $1.91 $15.60 $22.04
Medium 16 $18.33 $1.67 $15.36 $21.80
Small 26 $22.07 $4.43 $15.94 $34.92
ITO 34 $46.33 $18.49 $23.70 $93.07
Notes: FFY2013 FNS administrative data. The national WIC NSA expenditure per participant was calculated by dividing total federal outlays by total WIC participation. Group means represent an average of SA monthly expenditures per person. Significant difference in means detected between groups by ANOVA and Tukey’s post hoc test; p-value is greater than 0.0001. Agency size based on proportion of the SA’s FFY2013 WIC NSA federal outlays relative to national FFY2013 WIC NSA federal outlays.
Exhibit 5.3 Average Monthly NSA Expenditure per Participant, by Agency Structure
Agency Structure n Mean Standard deviation Min Max
Decentralized 38 $19.44 $3.02 $15.36 $27.61
Centralized, SAs 10 $22.50 $5.50 $17.41 $34.92
Centralized, ITOs 33 $46.94 $18.43 $23.70 $93.07
Combination 9 $20.74 $3.95 $16.57 $28.40
Notes: FFY2013 FNS administrative data. The national WIC NSA expenditure per participant was calculated by dividing total federal outlays by total WIC participation. Group means represent an average of SA monthly expenditures per person. Significant difference in means detected between groups by ANOVA and Tukey’s post hoc test; p-value is greater than 0.0001. One ITO was included in the decentralized category because it has LAs.
Average monthly NSA expenditure per participant was also calculated for LAs using expenditure data
provided by their SAs. Expenditure data were available for 1,549, or 99.6 percent, of all LAs that
operated via a contract with a SA during FFY 2013. Overall, LAs spent an average of $14.89 per
participant per month in FFY 2013.27 This value is approximately 82 percent of the national average
monthly expenditure per participant, which is consistent with the percentage of NSA expenditures that
were expended on local-level operations nationally (see chapter IV).
Average monthly NSA expenditure per participant was also calculated for the individual LAs by dividing
the agency’s total Federal NSA expenditures by its annual WIC participation. Average expenditures per
participant were compared by LA size and type. As presented in exhibit 5.4, small agencies spent $19.08
per participant, which is significantly more than both medium and large LAs spent per participant per
month ($15.26 and $13.97, respectively). Likewise, tribal agencies spent an average of $22.23 per
participant per month, which is significantly more than both local government agencies ($16.93) and
other types of agencies ($16.06). Average monthly NSA expenditures was also examined but did not vary
significantly by region (Appendix I-3) and receipt of in-kind contributions (Appendix I-6).
27 This value was calculated by dividing total Federal NSA expenditures for all LAs by annual WIC participation for all LAs; it is not an average of average monthly expenditures per participant that were calculated for each LA.
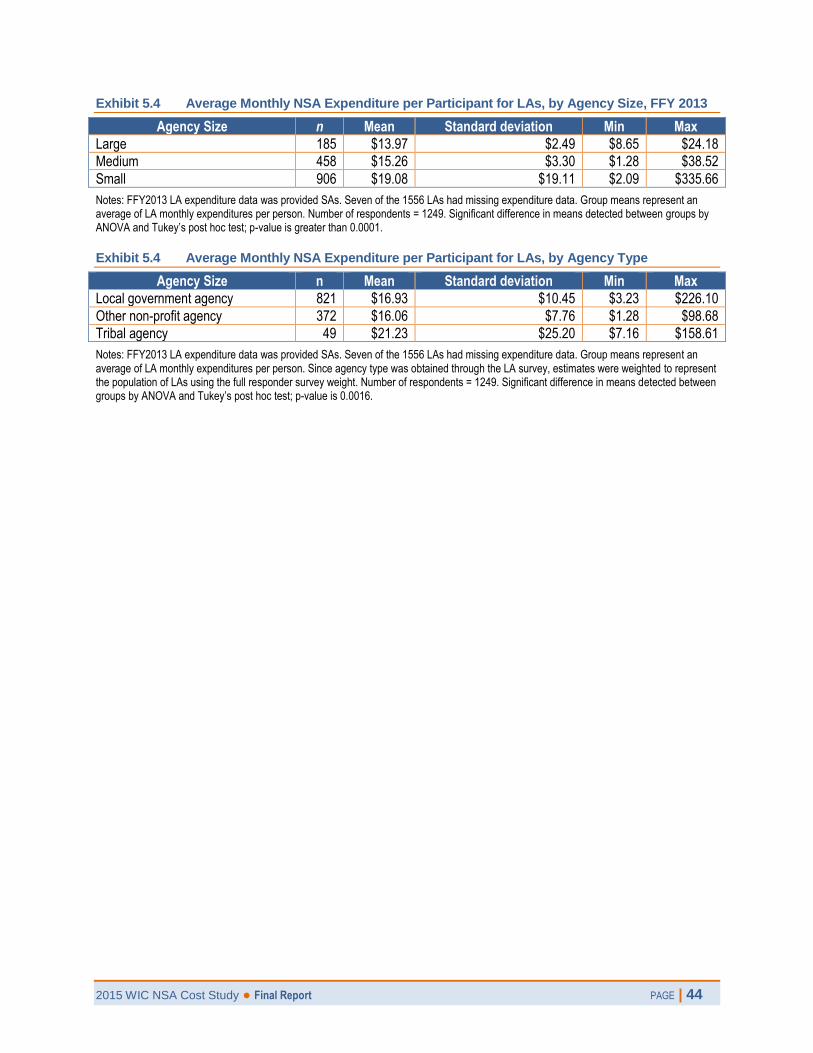
2015 WIC NSA Cost Study ● Final Report PAGE | 44
Exhibit 5.4 Average Monthly NSA Expenditure per Participant for LAs, by Agency Size, FFY 2013
Agency Size n Mean Standard deviation Min Max
Large 185 $13.97 $2.49 $8.65 $24.18
Medium 458 $15.26 $3.30 $1.28 $38.52
Small 906 $19.08 $19.11 $2.09 $335.66
Notes: FFY2013 LA expenditure data was provided SAs. Seven of the 1556 LAs had missing expenditure data. Group means represent an average of LA monthly expenditures per person. Number of respondents = 1249. Significant difference in means detected between groups by ANOVA and Tukey’s post hoc test; p-value is greater than 0.0001.
Exhibit 5.4 Average Monthly NSA Expenditure per Participant for LAs, by Agency Type
Agency Size n Mean Standard deviation Min Max
Local government agency 821 $16.93 $10.45 $3.23 $226.10
Other non-profit agency 372 $16.06 $7.76 $1.28 $98.68
Tribal agency 49 $21.23 $25.20 $7.16 $158.61
Notes: FFY2013 LA expenditure data was provided SAs. Seven of the 1556 LAs had missing expenditure data. Group means represent an average of LA monthly expenditures per person. Since agency type was obtained through the LA survey, estimates were weighted to represent the population of LAs using the full responder survey weight. Number of respondents = 1249. Significant difference in means detected between groups by ANOVA and Tukey’s post hoc test; p-value is 0.0016.

2015 WIC NSA Cost Study ● Final Report PAGE | 45
Chapter VI: NSA State Agency-Level Cost Centers
The primary source of information for this chapter is the SA Web survey (Appendix I-4 for related data
tables). Through the Web survey, SAs provided detailed information on direct and indirect costs
attributed to agency operations that were paid for with their FFY 2013 WIC NSA grant. Based on Web
survey responses, SAs allocated an average of more than 85 percent of their FFY 2013 NSA grant funds
to pay for direct costs, which comprise labor and personnel, contracted services, materials, services, and
travel while allocating only 15 percent on average to indirect costs (Exhibit 6.1).28 In comparison, in FFY
1998, SAs reported that about 91 percent of their NSA grant was used for direct costs and 9 percent was
used for indirect costs, according to the 2000 GAO report Financial Information on WIC Nutrition
Services and Administrative Costs.29
The percentage of NSA grant funds allocated to direct versus indirect costs was examined by agency size,
and structure but varied significantly only by the latter. On average, combination SAs expended a smaller
proportion of their grant on SA-level direct costs compared to centralized ITOs (69.7 percent versus 84.2
percent, respectively; p is less than .05) as did centralized State agencies compared to decentralized SAs
(84.2 percent versus 88.6 percent, repectively; p is less than .05). However, these results should be
interpreted with caution, since the types of costs on which SAs reported through the survey vary
somewhat based on agency structure. For example, none of the costs associated with contracted LAs were
reported by decentralized and combination SAs through the SA Web survey, as these costs were obtained
directly from LAs through the LA Web survey. Centralized and combination SAs did report on labor and
personnel costs associated with local service delivery through the SA Web survey; however, to ensure
greater consistency when comparing costs between and across SAs, these were not included in the SA-
level findings presented herein.
As depicted in exhibit 6.1, labor and personnel account for nearly 50 percent of all SA-level costs; thus, it
is not surprising that, when asked about factors they consider most important in driving overall program
costs, interview respondents from the 14 case study SAs most frequently noted personnel or salaries and
benefits as their biggest expense. Contracted services ranked second out of the four major cost centers,
accounting for nearly 20 percent of all SA-level costs reported by SAs on the Web survey. Costs
associated with materials, services, and travel accounted for an additional 16.0 percent of SA-level costs
and indirect costs accounted for an additional 15.4 percent. Details on the specific costs incurred within
each of these major cost centers are summarized in the subsequent sections.
28 Staffing costs associated with local service delivery in centralized and combination SAs and costs incurred by LAs were reported separately and thus are not included in these findings. In some instances, small agencies with minimal staff (e.g., small ITOs) might have reported all labor and personnel as a State-level costs. 29 Financial Information on WIC Nutrition Services and Administrative Costs – General Accounting Office, March, 2000:
http://www.gao.gov/assets/230/228748.pdf.

2015 WIC NSA Cost Study ● Final Report PAGE | 46
Exhibit 6.1 Proportion of the FFY 2013 NSA Grant Attributed to Key SA-Level Cost Centers
Source: FFY 2013 FNS administrative data. Note: Estimates were weighted to represent the population of SAs. Some costs reported by SAs on the SA web survey may support local operations and be reported to FNS as local-level costs on the FNS-798a report.
A. Labor/Personnel
Although every SA reported some labor and personnel costs, the percentage of costs attributed to this cost
center by SA varies. State agencies attribute 43.8 percent of their SA-level costs to labor and personnel on
average, which is nearly 14 percentage points less than agencies operated by an ITO (57.5 percent; p is
equal to .0142). On the labor and personnel survey screen, SAs were asked to report the total number of
full-time equivalents (FTEs) and estimate the
dollar amount allocated to labor and
personnel for each of the SA functions listed
in exhibit 6.2. Program administration and
supervision accounted for the majority of
FTEs reported by State agencies of all sizes
and ITOs—between approximately 27 and 45
percent, respectively. Vendor management
ranked second among medium (tied with
nutrition education and policy) and large
State agencies and ITOs and third among
small State agencies, accounting for
approximately 10 percent to 20 percent of all
Exhibit 6.2 SA Functions for Which Agencies Estimated FTEs and Labor and Personnel Costs
General program administration and supervision
Local program support
Vendor management
Food delivery
Breastfeeding support and promotion
Nutrition education and policy
Management information system (MIS) management (funded from NSA grant only)
Training: nutrition educator skills
Other
FTEs, respectively. Local program support ranked second among small State agencies, third among ITOs
and large State agencies, and fifth among medium State agencies and accounted for between
approximately 11 percent and 18 percent of all FTEs, respectively. Although nutrition education and
policy ranked in the top five among State agencies of all sizes and ITOs, its rank also varied across these
groups. MIS management accounted for the fourth highest percentage of FTEs among medium and large
State agencies and fifth among small State agencies while not even ranking in the top five for ITOs.
Likewise, breastfeeding support and promotion accounted for the fourth highest percentage of FTEs
among ITOs while not ranking in the top five for other State agencies. Exhibit 6.3 presents the five SA
functions to which most FTEs are allocated for each State agency size group and ITOs. The percentage
of FTEs allocated to each SA function, including those not shown in exhibit 6.3 are presented in
appendix I-4.

2015 WIC NSA Cost Study ● Final Report PAGE | 47
Exhibit 6.3 SA Functions to Which Most SA-Level FTEs Were Allocated (Top Five) in FFY 2013
Note: The top five SA functions were determined by calculating then ranking the percentage of FTEs allocated to each SA function. Estimates were weighted to represent the population of SAs using survey weight for full responders. SA size was determined based on FFY 2013 NSA expenditures. Large SAs contributed more than 2 percent of total Federal NSA expenditures; medium SAs contributed between 1 percent and 2 percent of total Federal NSA expenditures; small SAs contributed 1 percent or less of total Federal NSA expenditures; and ITOs were retained as a separate group, since they have unique funding and program administration issues.
On the labor and personnel survey screen, SAs were also asked to estimate the dollar amount of salaries
and benefits attributed to these SA functions within each of the four NSA cost categories: program
management, client services, nutrition education, and breastfeeding promotion and support. The vast
majority of SAs reported that salary and benefit costs support program management (68.8 percent). This
percentage varied by agency type: State agencies attributed 74 percent of this cost cateogry to salaries and
benefits compared to 58.5 percent reported by ITOs (p is equal to .0221). Nutrition education ranked a
distant second, composing only 14 percent of all SA-level labor and personnel costs, and client services
ranked third (10.5 percent). The smallest percentage of SA-level labor and personnel costs paid out of the
NSA grant were attributed to breastfeeding at 7.1 percent overall.

2015 WIC NSA Cost Study ● Final Report PAGE | 48
Exhibit 6.4 Percentage of State-Level Labor and Personnel Costs Attributed to Each of the Four NSA Cost Categories in FFY 2013
Source: SA Web survey. Note: Estimates were weighted to represent the population of SAs.
B. Contracted Services
Through the Web survey, SAs were asked to estimate
the total amount of FFY 2013 NSA funds spent on each
of the contracted services identified in exhibit 6.5, as
well as the percentage allocated to each of the four cost
categories. Contracted services that did not fit into these
categories could also be described and reported by SAs.
Overall, 72.1 percent of agencies reported paying for
some contracted services out of their NSA grant.
However, State agencies were significantly more likely
than ITOs to do so (95.8 percent compared to 33.1
percent, respectively; p is less than .0001).
Exhibit 6.5 Type of Contracted Services for Which SAs Estimated Annual Expenditures
Staff training
Equipment and computer maintenance
Consulting nutrition professionals
Program evaluation services
Clerical support or temporary help
Software development or computer programming
Referral or outreach services provided by another agency
As depicted in exhibit 6.6, software development or computer programming was the most frequently
reported type of contracted service (41.0 percent). Approximately one in three SAs reported contract for
services other than those listed on the survey, such as equipment and computer maintenance and banking
services.30 Staffing training and consulting nutrition professionals were reported by 25 percent and 19
percent, respectively, of SAs as contracted services paid for with their NSA grant. Costs associated with
technology-related contracted services (software development and computer programming and equipment
and computer maintenance) are further examined in chapter VIII.
30 Descriptions of “other” contracted services reported by SAs were reviewed and recoded into new or existing categories when possible. Some of the other contracted services that were reported by at least one but fewer than five SAs and thus were not recoded include printing, transportation, fiscal monitoring, and legal support.

2015 WIC NSA Cost Study ● Final Report PAGE | 49
Exhibit 6.6 Percentage of SAs Reporting Contracted Service-Related Costs in FFY 2013
Source: SA Web survey. Note: Estimates were weighted to represent the population of SAs.
On average, SAs expended 19.7 percent of their NSA grant on contracted services. Among SAs reporting
expenses on any contracted services, the largest percentage of NSA funds expended on this cost center
was 84.4 percent, and the smallest percentage was 1.6 percent. As previously described, SAs were asked
to estimate the percentage allocated to the four cost categories in FFY 2013 for each contracted service.
Since SAs do not necessarily track contracted service costs by the specific categories listed on the survey,
this was a challenging task; thus, the estimates provided by SAs truly reflect their best estimate in most
cases. Based on responses provided by 41 SAs, most costs associated with contracted services support
program management (66.1 percent). Only 14.3 percent of contracted service-related costs support client
services, while approximately 10 percent of these costs support nutrition education and breastfeeding,
respectively.
C. Materials, Services, and Travel
Through the Web survey, SAs were asked to
estimate the total amount of FFY 2013 NSA
funds spent on materials, services, and travel
in each of the categories listed in exhibit 6.7,
as well as the percentage allocated to each of
the four NSA cost categories. Costs that did
not fit into these categories could also be
described and reported by SAs.
Exhibit 6.7 Type of Material, Service, and Travel Costs for Which SAs Estimated Annual Expenditures
Supplies
Equipment
Travel and conference costs
Communications/Internet
Computer equipment/MIS training
Employee training
Overall, 95.5 percent of agencies reported paying for some materials, services, and travel out of their
NSA grant. Similar rates were observed among State agencies and ITOs when examined separately.
Travel and conference related costs were most frequently reported (95.6 percent), followed closely by
supplies which were reported by nearly 91 percent of SAs. A majority of SAs also reported
communications/Internet-, equipment-, and computer- and MIS training-related costs—approximately 83
percent, 64 percent, and 58 percent, respectively. Nearly 50 percent of SAs also reported employee

2015 WIC NSA Cost Study ● Final Report PAGE | 50
training costs. Other costs, such as printing and advertising, rent, postage, and dues, were reported less
frequently.
On average, SAs expended 16.0 percent of their NSA grant on materials, services, and travel-related
expenses. Among SAs reporting any such expenses, the largest percentage of NSA funds expended on
this cost center was 56.4 percent, and the smallest percentage was 1.9 percent. Again, since SAs do not
necessarily track materials, services, and travel costs by the specific NSA cost categories listed on the
survey, this was a challenging task; thus, the estimates provided by SAs reflect their best estimate in most
cases. Based on responses provided by 49 SAs, most costs associated with materials, services, and travel
support program management (61.7 percent; exhibit 6.8).
Exhibit 6.8 Percentage of SA-Level Material, Service, and Travel Costs Attributed to Each of the Four NSA Cost Categories in FFY 2013
Source: SA Web survey. Note: Estimates were weighted to represent the population of SAs.
D. Indirect Costs
On the Web survey, SAs were asked to report the total amount of FFY 2013 NSA funds spent on indirect
costs. In general, indirect costs are incurred for the benefit of multiple programs and therefore cannot be
identified readily and specifically with a particular program. Overall, 92.0 percent of SAs reported
charging indirect costs to their NSA grant and indirect costs composed 15.4 percent of total SA-level
costs on average. Among SAs reporting any indirect costs, the largest percentage of NSA funds expended
on this cost center was 70.5 percent and the smallest percentage was less than 1 percent.
When asked about the method used for indirect cost allocation, SAs most frequently reported using a
percentage of total salaries or total salaries and benefits as the basis for allocation (47.4 percent). The
second most common method was to calculate indirect costs based on a percentage of their total budget,
expenditures, or direct costs; 21.6 percent of SAs reported using this approach. Approximately 18 percent
of SAs direct charge their indirect costs every year. The remaining 12.8 percent of SAs use other
approaches to allocate indirect costs (e.g., set as a fixed dollar amount of the WIC budget).
Often, indirect costs are used to support both overall SA expenditures related to department
administration or activities of offices outside of WIC. However, sometimes WIC SAs receive support for
activities that are necessary for program activities. As depicted in exhibit 6.9 and according to responses
provided on the Web survey, SAs have a variety of costs and receive many services that are paid through
indirect costs charged to the NSA grant. Accounting services and human resource services (e.g., staff

2015 WIC NSA Cost Study ● Final Report PAGE | 51
recruitment, hiring, employee benefit management, payroll) were reported by the vast majority of SAs as
services that are paid through indirect costs—approximately 91 percent and 81 percent, respectively.
More than 50 percent of SAs reported costs for general space maintenance and repair, utilities, computer
and MIS support, and facility space that were also paid through indirect costs.
Exhibit 6.9 Percentage of SAs Reporting Various Types of Support in FFY 2013 That Were Paid Through Indirect Costs Charged to Their NSA Grants
Source: SA Web survey. Note: Estimates were weighted to represent the population of SAs. Respondents could select more than one response.

2015 WIC NSA Cost Study ● Final Report PAGE | 52
Chapter VII: NSA Local-Level Cost Centers
The primary source of information for this chapter is the LA Web survey (Appendix I-5 for related data
tables). Through the Web survey, LAs provided detailed information on direct and indirect costs
associated with local WIC service delivery that were paid for with their FFY 2013 WIC NSA grant.
According to the survey, on average, LAs allocated 90.8 percent of their FFY 2013 NSA grant funds to
pay for direct costs, which comprise labor and personnel, contracted services, materials, services, and
travel, while only 9.2 percent on average was allocated to indirect costs (Exhibit 7.1). In comparison, in
FFY 1998, LAs reported that about 95 percent of their NSA grant was used for direct costs and 5 percent
was used for indirect costs, according to the 2000 GAO report Financial Information on WIC Nutrition
Services and Administrative Costs.31
The percentages of NSA grant funds allocated to direct versus indirect costs were examined by agency
size and type but varied significantly only by type. On average, LAs operated by local government
entities allocated less of their grant to direct costs compared to nongovernment LAs (89.9 percent and
93.0 percent, respectively; p is less than .001). Tribal LAs allocated 88.6 percent of of their grant to direct
costs, which was not statistically significantly different from the other agency types.
As depicted in exhibit 7.1, labor and personnel account for the vast majority of all costs associated with
local service delivery. Subsequently, it is not surprising that, when asked about factors they consider most
important in driving overall program costs, interview respondents from the 24 case study LAs most
frequently noted salaries, benefits, and the need for additional staff as their biggest expense in an effort to
maintain a skilled and experienced staff. Indirect costs ranked second out of the four major cost centers,
accounting for approximately 9 percent of all local-level costs reported by LAs on the Web survey. Costs
associated with materials, services, and travel and contracted services accounted for an additional 8.1
percent and 2.0 percent of local-level costs, respectively. Additional detail on the specific costs incurred
within each of these major cost centers are summarized in the subsequent sections.
31 Financial Information on WIC Nutrition Services and Administrative Costs – General Accounting Office, March, 2000: http://www.gao.gov/assets/230/228748.pdf.

2015 WIC NSA Cost Study ● Final Report PAGE | 53
Exhibit 7.1 Proportion of the FFY 2013 NSA Grant Attributed to Major Local-Level Cost Centers
Source: LA Web survey. Note: Estimates were weighted to represent the population of LAs.
A. Labor/Personnel
Although every LA reported some labor and
personnel costs, the percentage of costs
attributed to this cost center varied by LA. When
examined by agency size and type, there were no
statistically significant differences in the
percentage of costs attributed to labor and
personnel between groups (Appendix I-5).
On the labor and personnel survey screen, LAs
were asked to report the total number of FTEs
and estimate the dollar amount allocated to labor
and personnel for each of 15 different staff types
listed in exhibit 7.2. WIC clerks accounted for
the majority of FTEs reported by LAs (22.8
percent), with FTEs for degreed nutritionists
ranking second at 13.3 percent. Program
manager and supervisor FTEs accounted for the
third highest percentage of FTEs (12.6 percent),
followed closely by registered dieticians (12.0
percent) and paraprofessional nutrition educators
(11.6 percent). Together, these five staff types
accounted for nearly three-quarters of all LA
FTEs (Exhibit 7.3)
Exhibit 7.2 Staff Types for Which LAs Estimated FTEs and Labor and Personnel Costs
Program manager/supervisor
Registered dietician
Degreed nutritionist
Paraprofessional nutrition educator
Lab technician/specialist
WIC clerk
Degreed breastfeeding specialist
Breastfeeding peer counselor
Receptionist
Public health nurse
Social worker
Computer support/maintenance
Vendor specialist/liaison
Accounting/financial staff
Research/evaluation specialist

2015 WIC NSA Cost Study ● Final Report PAGE | 54
Exhibit 7.3 Staff Types to Which LA FTEs Were Allocated in FFY 2013
Source: LA Web survey. Note: Estimates were weighted to represent the population of LAs.
LAs were also asked whether they share staff with other programs, such as the State Child Health
Insurance Program or the Health Resources and Services Administration’s Maternal and Child Health
Bureau, and what method they used to charge shared staff salaries and benefits to WIC if so. WIC staff
that work for multiple program or in multiple WIC cost categories can use one of three approved time
study methods for allocating and charging salaries and benefits to WIC: 100 percent time reporting;
periodic time studies (one week a month or one month a quarter); and random moment sampling, which is
a statically valid method of sampling used by some larger agencies. Overall, 42.6 percent of LAs reported
sharing staff with other programs, and among them, 100 percent time reporting was the most common
method used to allocate and charge salaries and benefits to WIC (80.0 percent).32 Periodic time reporting
was the second most common method, reported by only 10.0 percent of LAs.
Staff sharing with other programs has the potential to influence an agency’s labor and personnel costs.
For example, an agency that requires only a partial FTE to support certain operational functions (e.g.,
accounting, receptionist) may be able to save on labor and personnel costs if, by sharing these types of
staff, it can more efficiently to meet program needs. Indeed, survey data indicate that LAs that share staff
with other programs allocated a smaller percentage of their total FFY 2013 costs to labor and personnel
compared to agencies that do not (78.5 versus 82.4 percent, respectively; p is equal to .0014).
32 The survey distinguished between “100 percent time reporting,” which may be used for staff assigned to one functional area only; and “continuous time reporting,” which may reflect daily timekeeping across more than one cost area.
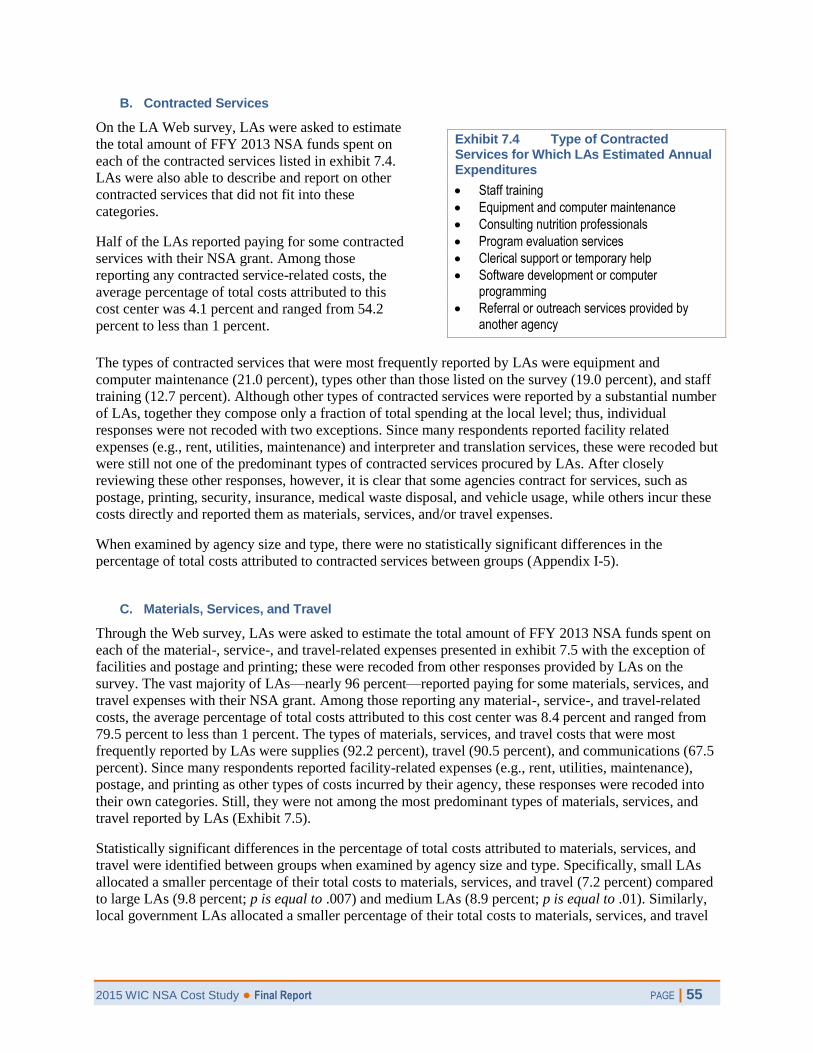
2015 WIC NSA Cost Study ● Final Report PAGE | 55
B. Contracted Services
On the LA Web survey, LAs were asked to estimate
the total amount of FFY 2013 NSA funds spent on
each of the contracted services listed in exhibit 7.4.
LAs were also able to describe and report on other
contracted services that did not fit into these
categories.
Half of the LAs reported paying for some contracted
services with their NSA grant. Among those
reporting any contracted service-related costs, the
average percentage of total costs attributed to this
cost center was 4.1 percent and ranged from 54.2
percent to less than 1 percent.
Exhibit 7.4 Type of Contracted Services for Which LAs Estimated Annual Expenditures
Staff training
Equipment and computer maintenance
Consulting nutrition professionals
Program evaluation services
Clerical support or temporary help
Software development or computer programming
Referral or outreach services provided by another agency
The types of contracted services that were most frequently reported by LAs were equipment and
computer maintenance (21.0 percent), types other than those listed on the survey (19.0 percent), and staff
training (12.7 percent). Although other types of contracted services were reported by a substantial number
of LAs, together they compose only a fraction of total spending at the local level; thus, individual
responses were not recoded with two exceptions. Since many respondents reported facility related
expenses (e.g., rent, utilities, maintenance) and interpreter and translation services, these were recoded but
were still not one of the predominant types of contracted services procured by LAs. After closely
reviewing these other responses, however, it is clear that some agencies contract for services, such as
postage, printing, security, insurance, medical waste disposal, and vehicle usage, while others incur these
costs directly and reported them as materials, services, and/or travel expenses.
When examined by agency size and type, there were no statistically significant differences in the
percentage of total costs attributed to contracted services between groups (Appendix I-5).
C. Materials, Services, and Travel
Through the Web survey, LAs were asked to estimate the total amount of FFY 2013 NSA funds spent on
each of the material-, service-, and travel-related expenses presented in exhibit 7.5 with the exception of
facilities and postage and printing; these were recoded from other responses provided by LAs on the
survey. The vast majority of LAs—nearly 96 percent—reported paying for some materials, services, and
travel expenses with their NSA grant. Among those reporting any material-, service-, and travel-related
costs, the average percentage of total costs attributed to this cost center was 8.4 percent and ranged from
79.5 percent to less than 1 percent. The types of materials, services, and travel costs that were most
frequently reported by LAs were supplies (92.2 percent), travel (90.5 percent), and communications (67.5
percent). Since many respondents reported facility-related expenses (e.g., rent, utilities, maintenance),
postage, and printing as other types of costs incurred by their agency, these responses were recoded into
their own categories. Still, they were not among the most predominant types of materials, services, and
travel reported by LAs (Exhibit 7.5).
Statistically significant differences in the percentage of total costs attributed to materials, services, and
travel were identified between groups when examined by agency size and type. Specifically, small LAs
allocated a smaller percentage of their total costs to materials, services, and travel (7.2 percent) compared
to large LAs (9.8 percent; p is equal to .007) and medium LAs (8.9 percent; p is equal to .01). Similarly,
local government LAs allocated a smaller percentage of their total costs to materials, services, and travel

2015 WIC NSA Cost Study ● Final Report PAGE | 56
than did non-government LAs—6.7 percent compared to 10.7 percent (p is less than 0.0001), respectively
(Appendix I-5).
Exhibit 7.5 Percentage of LAs That Report Various Types of Material-, Service-, and Travel-Related Costs in FFY 2013
Source: LA Web survey. Note: Estimates were weighted to represent the population of LAs.
LAs were also asked whether they shared costs such as office space or materials with other programs with
which they were located and, if so, what method they used to allocate shared costs to WIC. Overall, 42.3
percent of LAs reported sharing costs with other programs, which is similar to the percentage of agencies
reporting that they share staff with other programs (42.6 percent; see section VII.A). Percentage of time
spent working on WIC or percentage of space WIC occupies in a shared facility were the predominant
methods by which agencies allocate shared costs to the program, reported by 71.0 percent of agencies.
Formula allocation based on a negotiated rate was the second most common method (8.5 percent).
D. Indirect Costs
On the Web survey, LAs were asked to report the total amount of FFY 2013 NSA funds spent on indirect
costs. Overall, 65.4 percent of LAs reported charging indirect costs to their NSA grant. The percentage of
agencies reporting indirect costs did not vary by agency type but varied significantly by agency size (p is
less than .001). Approximately 78 percent of large LAs charge indirect costs to their WIC grant,
compared to 70.4 percent of medium agencies and 59.6 percent of small agencies.
When asked about the method used for indirect cost allocation, approximately one-third of LAs reported
using a percentage of total salaries or of total salaries and benefits as the basis for allocation, while
another 28.2 percent reported calculating indirect costs as a percentage of their total budget or
expenditures. A smaller percentage of agencies reported setting indirect costs as a fixed dollar amount of
the WIC budget or using other methods.
As depicted in exhibit 7.6, LAs reported various types of support that are paid through their indirect costs.
For example, 71.2 percent of LAs that charge indirect costs to their NSA grant receive accounting
services, and 69.7 percent receive human resource services (e.g., staff recruitment, hiring, employee
benefit management, payroll). General space maintenance and repair, utilities, and computer and MIS
support were also reported by one out of every two LAs.

2015 WIC NSA Cost Study ● Final Report PAGE | 57
Exhibit 7.6 Percentage of LAs Reporting Various Types of Support in FFY 2013 That Were Paid Through Indirect Costs Charged to Their NSA Grant
Source: LA Web survey. Note: Estimates were weighted to represent the population of LAs.
2015 WIC NSA Cost Study ● Final Report PAGE | 58
Chapter VIII: Factors Influencing NSA Costs
Chapter VIII describes the influence of various factors on NSA costs in recent years (since FFY
2010) or in FFY 2013 specifically. The findings presented herein are based primarily on
information obtained through the SA and LA Web surveys. Data tables associated with this chapter
can be found in appendix I-6.
A. Factors SAs Attribute to Increases in SA-Level Costs in Recent Years
All SAs were asked to identify factors that may have led to increases in their staffing and overall program
costs since FFY 2010, such as fringe benefit rates, program participation, indirect costs, access to outside
funding, in-kind contributions, facility costs, and IT support services. Factors were grouped into three
categories: staffing, facility and support services, and program operations. SAs had the option of selecting
“other” and describing factors that had increased their costs but were not included as a survey response
option. Because they were not first asked to indicate whether their costs had increased, it is reasonable to
assume that SAs selecting “none of the above” most likely had costs that decreased or remained the same
between FFY 2010 and FFY 2013.
When asked specifically about factors that have increased SA-level staffing costs since FFY 2010,
increases in fringe benefit costs and staff salaries were the most common responses, reported by 65.1
percent and 61.9 percent of SAs, respectively. Increased staff travel costs, number of FTEs, and staff
training costs were reported by approximately one-quarter to one-third of all SAs. Only 7.6 percent of
SAs selected “none of the above” which most likely indicates that their staffing costs did not increase.
When asked about factors related to facility costs and support services that have increased SA-level costs,
only 20.6 percent of all SAs selected “none of the above,” indicating that nearly 80 percent of SAs
experienced an increase in costs associated with facilities and/or support services (e.g., increase costs of
facility space, increase in telecommunication costs). Similarly, when asked about factors related to
program operations (e.g., increase indirect costs, increase in vendor management costs), a majority of SAs
(72.3 percent) reported that one or more factors contributed to an increase in their SA-level costs. Exhibit
8.1 presents the non-staffing related factors that were most commonly reported by SAs as having
increased their costs since FFY 2010. For example, more than half of SAs indicated that increases in
indirect costs (59.7 percent) and information technology support services (53.5 percent) have increased
their SA-level costs overall. Increases in the costs of equipment and supplies, telecommunications, facility
space (e.g., rent, utilities), facility services (e.g., security, maintenance), and vendor management were
also commonly reported (Exhibit 8.1). A number of other facility- and program operations-related factors
also contributed to increased costs in recent years but were reported by only a small percentage of SAs
(Appendix I-6).

2015 WIC NSA Cost Study ● Final Report PAGE | 59
Exhibit 8.1 Factors Other Than Staffing That SAs Report Have Increased Their Costs Since FFY 2010
Source: SA Web survey. Note: Estimates were weighted to represent the population of SAs.
B. Factors SAs Attribute to Decreases in SA-Level Costs in Recent Years
SAs were asked whether any factors contributed to a decrease in program costs between FFY 2010 and
FFY 2013. Factors were grouped into three categories: staffing, facility and support services, and program
operations. Again, SAs had the option of selecting “other” and describing factors that had decreased their
costs but were not included as a survey response option. Because they were not first asked to indicate
whether their costs had decreased, it is reasonable to assume that SAs selecting “none of the above” most
likely had costs that increased or remained the same between FFY 2010 and FFY 2013.
While 55.6 percent of all SAs did not report a decrease in staffing costs, 44 percent reported that one or
more factors contributed to a decrease in costs related to staffing. The two most commonly reported
factors were a decrease in staffing or FTEs (24.8 percent) and an increase in staff vacancy rates (15.7
percent). Other factors, such as a decrease in staff travel costs, reductions in staff salaries, and a decrease
in staff training costs, also contributed to a decrease in staffing costs for some SAs but were reported
infrequently. Exhibit 8.2 displays all of the staffing factors and the percentage of SAs reporting each.
Exhibit 8.2 Factors That SAs Report Have Decreased Their Staffing Costs Since FFY 2010
Source: SA Web survey. Note: Estimates were weighted to represent the population of SAs.

2015 WIC NSA Cost Study ● Final Report PAGE | 60
Nearly 80 percent of all SAs reported that none of the facility and support service-related factors had
contributed to a decrease in costs since FFY 2010. Among this set of factors, decreases in the costs of
telecommunications and equipment/supplies were reported most frequently but by only 8.1 percent and
7.1 percent of SAs, respectively.
Forty-three percent of SAs reported that one or more factors related to program operations had decreased
SA-level costs since FFY 2010. Approximately 30 percent of SAs indicated that decreases in program
participation have decreased their SA-level costs, while 18.6 percent of SAs reported that a decrease in
LA NSA grant funds had decreased their costs. Decreases in the number of clinic sites (5.9 percent),
indirect costs (3.5 percent), and a number of other factors also contributed to decreased costs but were
reported much less frequently (Appendix I-6 for additional detail).
C. Factors LAs Attribute to Increases in Local-Level Costs in Recent Years
All LAs were asked to identify factors that may have led to increases in their staffing and overall program
costs since FFY 2010. Factors were grouped into three categories: staffing, facility and support services,
and program operations. LAs had the option of selecting “other” and describing factors that had increased
their costs but were not included as a survey response option. LAs selecting “none of the above” most
likely had costs that decreased or remained the same between FFY 2010 and FFY 2013.
When asked specifically about factors that have increased LA-level staffing costs since FFY 2010,
increases in fringe benefit costs and staff salaries were the most common responses, reported by 81.1
percent and 77.4 percent of LAs, respectively. Increases in staff travel costs, number of FTEs, and staff
training costs were also reported by approximately one-quarter to one-third of all LAs, similar to the rate
of SAs reporting these factors. Only 5.2 percent of all LAs selected “none of the above” which most
likely indicates that their staffing costs did not increase during the specified time frame.
When asked about factors related to facility costs and support services that have increased LA-level costs,
only 13.9 percent of all LAs selected “none of the above,” indicating that more than 86 percent of LAs
experienced an increase in costs associated with facilities and/or support services (e.g., increased cost of
facility space, increase in telecommunication costs). Similarly, when asked about factors related to
program operations (e.g., increase indirect costs, increase in program participation), a majority of LAs
(65.5 percent) reported that one or more factors contributed to an increase in their costs. Exhibit 8.3
presents the non-staffing related factors that were most commonly reported by LAs as having increased
their costs since FFY 2010. More than half of LAs indicated that increases in the costs of equipment and
supplies (58.7 percent), facility space (56.6 percent), and telecommunications (50.0 percent) have
increased their costs overall. Increases in the costs of facility services, information technology support
services, indirect costs, and program participation were also commonly reported (Exhibit 8.1). A number
of other facility- and program operations-related factors also contributed to increased costs in recent years
but were reported by only a small percentage of LAs (Appendix I-6).

2015 WIC NSA Cost Study ● Final Report PAGE | 61
Exhibit 8.3 Factors Other Than Staffing That LAs Report Have Increased Their Costs Since FFY 2010
Source: LA Web survey. Note: Estimates were weighted to represent the population of LAs
D. Factors LAs Attribute to Decreases in Local-Level Costs in Recent Years
All LAs were also asked to identify factors that may have led to decreases in their staffing and overall
program costs since FFY 2010. Factors were grouped into three categories: staffing, facility and support
services, and program operations. LAs had the option of selecting “other” and describing factors that had
decreased their costs but were not included as a survey response option. LAs selecting “none of the
above” most likely had costs that increased or remained the same between FFY 2010 and FFY 2013.
While 48.3 percent of all LAs did not report a decrease in staffing costs, 51.7 percent reported that one or
more factors contributed to a decrease in costs related to staffing. For example, more than one-third of
LAs indicated that a decrease in FTEs or permanent staff had contributed to decreased staffing costs since
FFY 2010.
When asked about facility and program size and operation-related factors that have decreased their costs
since FFY 2010, the vast majority of LAs reported that none of them had contributed to decreased costs.
More specifically, 89.2 percent of LAs indicated that none of the facility-related factors had decreased
their costs, and 52.7 percent indicated that none of the factors related to program size (e.g., number of
clinics, LA size) and operations had decreased their costs. Approximately 30 percent of LAs indicated
that decreases in program participation have decreased their local-level costs since FFY 2010, which
corresponds with the 30 percent of SAs that reported a decrease in costs due to declining program
participation. This is an indication that a large portion of SAs and LAs have reduced their NSA costs in
response to lower demand for program benefits and services.
E. Relationship Between Technology and NSA Costs
SAs and LAs continually implement more sophisticated MIS to make their certification and food delivery
processes more efficient. Also, many SAs are in the process of implementing an EBT system to replace
their paper food instrument systems to deliver food benefits to participants. It is difficult to determine
whether this increased use of technology has increased or decreased SA and LA need for NSA funds for

2015 WIC NSA Cost Study ● Final Report PAGE | 62
this segment of program operations. In fact, when SAs with a new MIS (1–4 years old; n = 17) were
asked on the survey about the net impact of MIS on their total NSA expenditures, 30 percent reported that
they did not know. Approximately 36 percent of SAs with a new MIS reported that the impact has been
cost-neutral (their costs have stayed about the same), 23.6 percent reported an overall increase, and 10.7
percent reported an overall decrease in the cost of operating WIC due to MIS implementation and
management.
Similarly, when SAs that were currently piloting or implementing EBT (n = 63) were asked on the survey
about the net impact of EBT on their total NSA expenditures, a majority (59.2 percent) reported that they
did not know. Approximately, 31 percent of these same SAs reported no impact while a smaller
percentage reported an increase or decrease (Exhibit 8.4).
Exhibit 8.4 Percentage of SAs Reporting Net Impact of EBT on NSA Expenditures, FFY 2013
Source: SA Web survey. Note: Estimates were weighted to represent the population of SAs
The amount SAs spend on various technology-related labor, contracted services, and materials, services,
and travel was also examined. Exhibit 8.5 presents the average percentage of total NSA costs that were
spent on four technology-related cost categories. On average, 3.3 percent of total NSA costs reported by
SAs on the survey were spent on MIS management personnel. A similar percentage of total NSA costs are
attributed to contracted software development and computer programming (3.5 percent) and contracted
equipment and computer maintenance (4.0 percent). A smaller percentage of NSA costs were attributed to
computer equipment and MIS training (1.9 percent). The percentage of funds allocated to technology-
related costs centers was also examined by the age of an SA’s MIS and by the stage of EBT
implementation, but no statistically significant associations were found (Appendix I-6).

2015 WIC NSA Cost Study ● Final Report PAGE | 63
Exhibit 8.5 Average Percentage of SA Costs Attributable to Various Technology-Related Support and Development, FFY 2013
Type of technology-related support n Mean Standard deviation
Range
Total 64 13.1 17.6 (0, 74.5)
Personnel: MIS management funded from NSA 67 3.3 4.6 (0, 17.0)
Contracted services: software development or computer programming 66 3.5 12.7 (0, 74.5)
Contracted services: equipment or computer maintenance 67 4.0 10.1 (0, 42.0)
Materials/services/travel: computer equipment and MIS training 64 1.9 3.3 (0, 14.9)
Source: SA Web survey. Note: Estimates are weighted to represent the population of SAs using the full responder weight. Sum of mean percentages across categories do not equal total mean percentage due to varying sample sizes across categories. The mean for the Contracted services: software development or computer programming estimate does not meet the criteria for statistical reliability (relative standard error is greater than 30); thus the results should be interpreted with caution.
Although the Web survey data allow only for a point-in-time examination of technology-related costs, it
is clear from the case study interviews: SAs are concerned about the proportion of their grant that is
currently being used or that may need to be used in the future to support MIS and EBT implementation
and maintenance. When asked about factors they consider most important in driving their overall program
costs and how much control they have over these factors, 8 of the 14 case study SAs mentioned costs
associated with MIS or EBT or both. The concerns raised by respondents were varied but pervasive. For
example, some SAs discussed concerns related to procuring contractors. Since there are relatively few
contractors bidding on these projects, some SAs believe they may be vulnerable to cost increases, because
they have limited procurement options. Other SAs noted that the increased demand of MIS and EBT
projects has led to substantial increases in staff resources.
One of the biggest [factors] over the past several years has been the bigger demand for MIS and EBT projects. As little as 5 years ago, we didn’t even have program staff designated for MIS. Everything we needed for MIS was done through our agency’s IT department. We started out with one person in that role, and now we have five State-level people….
—SA CASE STUDY RESPONDENT
Still, others noted that it is challenging to budget for these large MIS and EBT expenditures, since they
don’t know well enough in advance whether their SA will receive other Federal or operational adjustment
funds to support these projects. If not, SAs must react quickly and cover these costs with their NSA grant.
…in the MIS and EBT area, not knowing if we are going to get any funds for this or if we have to try to use NSA funds. We don’t have much control over these things; we have to react to situations.
—SA CASE STUDY RESPONDENT

2015 WIC NSA Cost Study ● Final Report PAGE | 64
F. Data-Driven Examination of Factors That Influence Overall NSA Expenditures
i. Economies of scale
In theory, the size of an SA or LA or other factors associated with how the SA or LA operates may
influence its cost per participant. For example, it may be that larger agencies have lower costs per
participant, which is called “economies of scale”; or that larger agencies have higher costs per participant,
which is called “diseconomies of scale.” Economies of scale generally occur when there are large fixed
costs that must be incurred regardless of agency size. Diseconomies of scale generally occur when
increasing size leads to increasingly complex management requirements.
When a number of factors were considered, only the number of LAs within a State had any impact on
economies of scale. Exhibit 8.6 presents results from regressions testing for economies of scale in SAs.
All three specificiations find that the number of LAs has a statistically significant impact on cost per
participant. Comparing the R2 statistics for each specification shows that the cubic specification fits the
data best. Exhibit 8.7 shows what the specification predicts for SA cost per participant based on the
number of LAs. Results show that there are initially strong economies of scale for SAs, but there are
diseconomies of scale after SAs exceed 35 LAs. In SAs with a large number of LAs, it is possible that
there are more LAs of a smaller size. If smaller LAs require greater management costs, this factor may be
driving the result rather than the total number of LAs. We are unable to disentangle the two factors in this
analysis.
Exhibit 8.6 Regression Analysis Testing the Influence of the Number of LAs on SA Cost per Participant
Variable Linear
specification Quadratic
specification Cubic specification
Number of LAs -0.280 p-value less than 0.01
-0.868 p-value less than 0.01
-1.690 p-value less than 0.01
Standard Error (0.0632) (0.186) (0.363)
Number of LAs (squared) - 0.00720 p-value less than 0.01
0.0330 p-value less than 0.01
Standard Error - (0.00215) (0.0101)
Number of LAs (cubed) - - -0.000184 p-value less than 0.05
Standard Error - - (7.06e-05)
Intercept 35.00 p-value less than 0.01
38.25 p-value less than 0.01
40.58 p-value less than 0.01
Standard Error (2.006) (2.133) (2.251)
R2 0.183 0.276 0.329
N 90 90 90 Note: Each column represents a different estimated specification of the regression equation. In the linear specification the following regression equation is estimated: cost per participant equals Intercept plus Beta1 times number of LAs. In the quadratic specification, the following regression equation is estimated: Cost per participant equals Intercept plus Beta1 times number of LAs plus Beta2 times number of LAs2. For more details see the methodology section. In the cubic specification the following regression equation is estimated: Cost per participant equals Intercept plus Beta1 times number of LAs plus Beta2 plus number of LAs2 plus Beta2 times number of LAs3. For more details, refer to the methodology section.
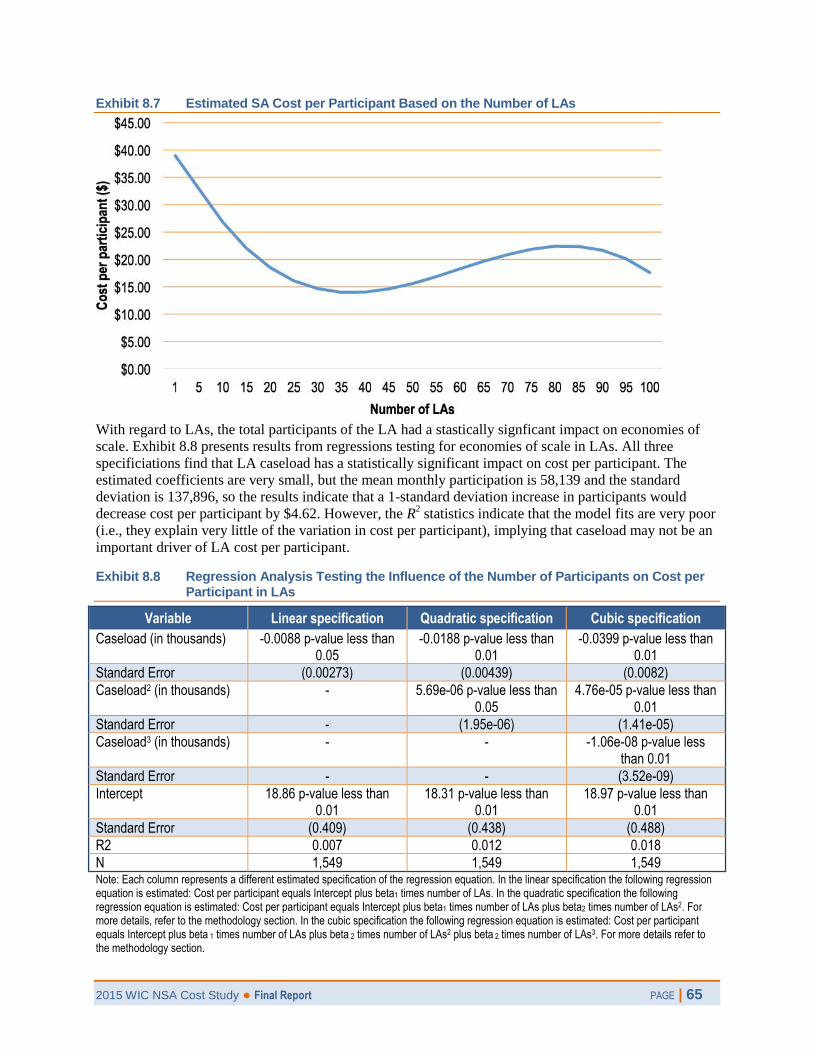
2015 WIC NSA Cost Study ● Final Report PAGE | 65
Exhibit 8.7 Estimated SA Cost per Participant Based on the Number of LAs
With regard to LAs, the total participants of the LA had a stastically signficant impact on economies of
scale. Exhibit 8.8 presents results from regressions testing for economies of scale in LAs. All three
specificiations find that LA caseload has a statistically significant impact on cost per participant. The
estimated coefficients are very small, but the mean monthly participation is 58,139 and the standard
deviation is 137,896, so the results indicate that a 1-standard deviation increase in participants would
decrease cost per participant by $4.62. However, the R2 statistics indicate that the model fits are very poor
(i.e., they explain very little of the variation in cost per participant), implying that caseload may not be an
important driver of LA cost per participant.
Exhibit 8.8 Regression Analysis Testing the Influence of the Number of Participants on Cost per Participant in LAs
Variable Linear specification Quadratic specification Cubic specification
Caseload (in thousands) -0.0088 p-value less than 0.05
-0.0188 p-value less than 0.01
-0.0399 p-value less than 0.01
Standard Error (0.00273) (0.00439) (0.0082)
Caseload2 (in thousands) - 5.69e-06 p-value less than 0.05
4.76e-05 p-value less than 0.01
Standard Error - (1.95e-06) (1.41e-05)
Caseload3 (in thousands) - - -1.06e-08 p-value less than 0.01
Standard Error - - (3.52e-09)
Intercept 18.86 p-value less than 0.01
18.31 p-value less than 0.01
18.97 p-value less than 0.01
Standard Error (0.409) (0.438) (0.488)
R2 0.007 0.012 0.018
N 1,549 1,549 1,549 Note: Each column represents a different estimated specification of the regression equation. In the linear specification the following regression equation is estimated: Cost per participant equals Intercept plus beta1 times number of LAs. In the quadratic specification the following regression equation is estimated: Cost per participant equals Intercept plus beta1 times number of LAs plus beta2 times number of LAs2. For more details, refer to the methodology section. In the cubic specification the following regression equation is estimated: Cost per participant equals Intercept plus beta 1 times number of LAs plus beta 2 times number of LAs2 plus beta 2 times number of LAs3. For more details refer to the methodology section.

2015 WIC NSA Cost Study ● Final Report PAGE | 66
ii. Impact of infant formula rebates on NSA costs
As previously described, most WIC SAs are required to establish competitively bid rebate contracts
with infant formula manufacturers. The SA issues the contract brand of infant formula and it receives a
rebate for each can of the contract brand of infant formula purchased by WIC participants. Some SAs
have additional rebate contracts for infant foods as well as formula. In FFY 2013, approximately $1.88
billion in rebates were received by SAs, mostly from infant formula contracts, which representes a
substantial reduction to the Program’s annual food expenditures. In other words, the Program issues a
total of $6.38 billion in food benefits, but $1.88 billion of these costs are offset by the rebates. When
the Program’s gross food costs (pre-rebate) are considered, the proportion of WIC dollars allocated to
NSA changes substantially, from nearly 30 percent to less than 23 percent (Exhibit 8.9). Moreover, if
the 559 million NSA dollars allocated to nutrition education and breastfeeding promotion and
support—additional benefits of the Program—are shifted from an “administrative cost” to a “program
benefit cost,” the proportion of WIC dollars allocated for administrative expenses is further reduced to
approximately 16 percent.
Exhibit 8.9 Percentage of WIC Dollars Allocated to NSA and Food Costs, FFY 2013
Rebate Status
Total WIC Costs
NSA Costs % Allocated to NSA Food Costs % Allocated to
Food
Pre-rebate $8.26 billion $1.88 billion 22.8% $6.38 billion 77.2%
Post-rebate $6.39 billion $1.88 billion 29.5% $4.50 billion 70.5%
Note: percentages may not add to 100 percent due to rounding.
Exhibit 8.9 Percentage of WIC Dollars Allocated to Administrative and Benefit Costs
Rebate Status
Total WIC Costs
Administrative Costs
% Allocated to Administrative
Benefit Costs
% Allocated to Food
Pre-rebate $8.26 billion $1.33 billion 16.1% $6.94 billion 84.0%
Note: percentages may not add to 100 percent due to rounding. Administrative costs include only program management and client service expenditures. Benefit costs include nutrition education and breastfeeding promotion and support expenditures.

2015 WIC NSA Cost Study ● Final Report PAGE | 67
Chapter IX: Comparison to SNAP and TANF Costs
Chapter IX addresses study objective 4, which required a comparison between WIC administration costs
and administration costs in other similar Federal programs. It describes how WIC expenditures compare
to those from SNAP and the TANF block grant. These programs were selected for comparison because
they serve a similar population in terms of income eligibility and were expected to have somewhat similar
cost categories that could be compared. Information included in this chapter was gathered from financial
reports submitted by States to the Federal sponsoring agencies and through case studies conducted in a
small number of States.
A. TANF
TANF is designed to help low-income families achieve self-sufficiency. States receive block grants from
ACF to design and operate programs that accomplish one or more of the purposes of TANF. The four
purposes of TANF are as follows:
Provide assistance to needy families so that children can be cared for in their own homes;
Reduce the dependency of needy parents by promoting job preparation, work, and marriage;
Prevent and reduce the incidence of out-of-wedlock pregnancies; and
Encourage the formation and maintenance of two-parent families.
The basic TANF block grants have remained at a level of $16.5 billion since 1996, when the program was
created; but on occasion, Congress has supplemented the block grants with special appropriations. For
example, in FFY 2009, Congress appropriated an additional 5 billion in TANF funding due to the
economic recession.
In addition to the Federal funds, States are required to contribute funds based on a formula that was
created to ensure Maintenance of Effort (MOE) when TANF replaced the former Aid to Families with
Dependent Children (AFDC) program in 1996. State-level MOE requirements are fixed as a percentage of
the States’ contribution during the last year of AFDC. These funds serve as a State program match to the
Federal funds and are included in total expenditures reported to ACF. In FFY 2013, around 4 million
individuals received one or more forms of TANF benefits.
TANF programs divide their expenditures into cash benefits and other non-cash expenditures that include
both some administrative costs and other types of program benefits that are usually provided through
contract agencies or local TANF offices. A portion of the funds are used for administrative functions such
as eligibility determination and benefit issuance. However, as with WIC, there are some non-cash
expenditures that could be considered “benefits.” For example, TANF provides programs such as
employment support, tax credits, child care assistance, support for new fathers, programs to prevent out-
of-wedlock pregnancy, and transportation services for clients. In addition, a portion of the TANF funds is
transferred to the Child Care Development Fund and the Social Services Block Grant. Different from
WIC, TANF does not provide food benefits to program participants. For the purpose of comparing WIC
and TANF in this section, expenditures are examined in two different ways. First, food/cash benefit
expenditures are compared to non-food/cash expenditures. Second, expenditures on all types of program
benefits are compared to non-benefit or administrative expenditures.
A comparison of the overall division of expenditures for WIC and TANF shows significant differences.
Exhibit 9.1 presents the national-level split for WIC and TANF expenditures as they relate to food/cash
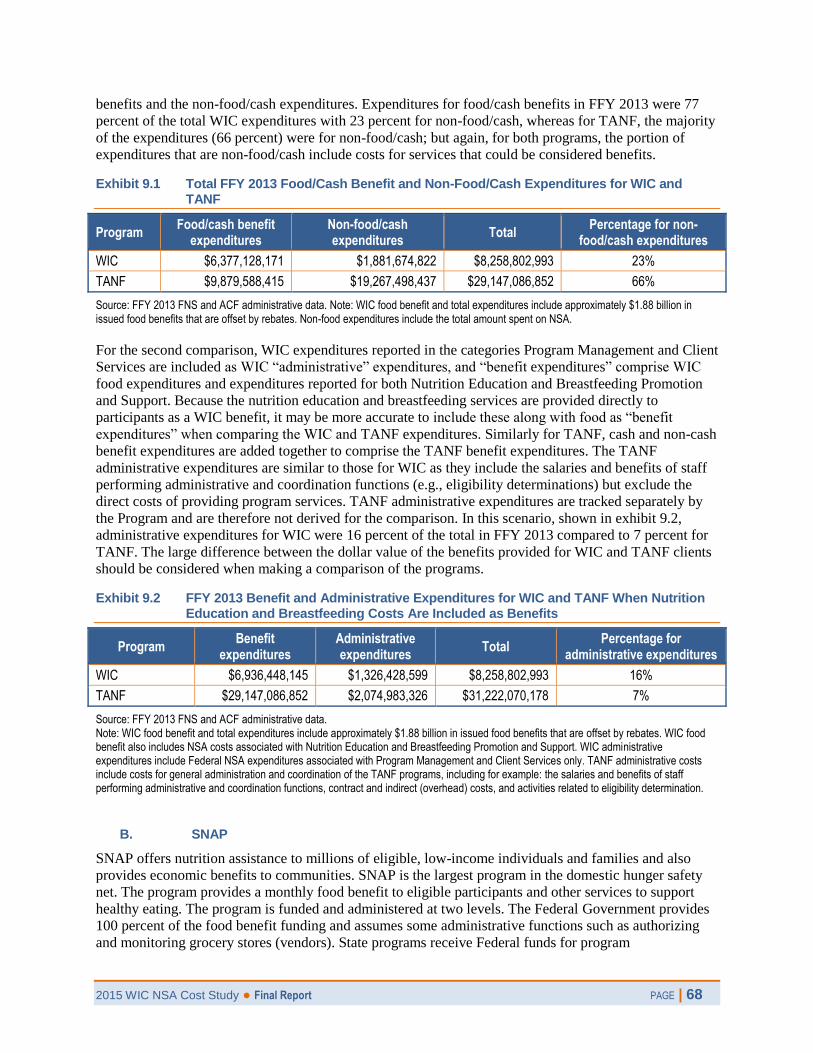
2015 WIC NSA Cost Study ● Final Report PAGE | 68
benefits and the non-food/cash expenditures. Expenditures for food/cash benefits in FFY 2013 were 77
percent of the total WIC expenditures with 23 percent for non-food/cash, whereas for TANF, the majority
of the expenditures (66 percent) were for non-food/cash; but again, for both programs, the portion of
expenditures that are non-food/cash include costs for services that could be considered benefits.
Exhibit 9.1 Total FFY 2013 Food/Cash Benefit and Non-Food/Cash Expenditures for WIC and TANF
Program Food/cash benefit
expenditures Non-food/cash expenditures
Total Percentage for non-
food/cash expenditures
WIC $6,377,128,171 $1,881,674,822 $8,258,802,993 23%
TANF $9,879,588,415 $19,267,498,437 $29,147,086,852 66%
Source: FFY 2013 FNS and ACF administrative data. Note: WIC food benefit and total expenditures include approximately $1.88 billion in issued food benefits that are offset by rebates. Non-food expenditures include the total amount spent on NSA.
For the second comparison, WIC expenditures reported in the categories Program Management and Client
Services are included as WIC “administrative” expenditures, and “benefit expenditures” comprise WIC
food expenditures and expenditures reported for both Nutrition Education and Breastfeeding Promotion
and Support. Because the nutrition education and breastfeeding services are provided directly to
participants as a WIC benefit, it may be more accurate to include these along with food as “benefit
expenditures” when comparing the WIC and TANF expenditures. Similarly for TANF, cash and non-cash
benefit expenditures are added together to comprise the TANF benefit expenditures. The TANF
administrative expenditures are similar to those for WIC as they include the salaries and benefits of staff
performing administrative and coordination functions (e.g., eligibility determinations) but exclude the
direct costs of providing program services. TANF administrative expenditures are tracked separately by
the Program and are therefore not derived for the comparison. In this scenario, shown in exhibit 9.2,
administrative expenditures for WIC were 16 percent of the total in FFY 2013 compared to 7 percent for
TANF. The large difference between the dollar value of the benefits provided for WIC and TANF clients
should be considered when making a comparison of the programs.
Exhibit 9.2 FFY 2013 Benefit and Administrative Expenditures for WIC and TANF When Nutrition Education and Breastfeeding Costs Are Included as Benefits
Program Benefit
expenditures Administrative expenditures
Total Percentage for
administrative expenditures
WIC $6,936,448,145 $1,326,428,599 $8,258,802,993 16%
TANF $29,147,086,852 $2,074,983,326 $31,222,070,178 7%
Source: FFY 2013 FNS and ACF administrative data. Note: WIC food benefit and total expenditures include approximately $1.88 billion in issued food benefits that are offset by rebates. WIC food benefit also includes NSA costs associated with Nutrition Education and Breastfeeding Promotion and Support. WIC administrative expenditures include Federal NSA expenditures associated with Program Management and Client Services only. TANF administrative costs include costs for general administration and coordination of the TANF programs, including for example: the salaries and benefits of staff performing administrative and coordination functions, contract and indirect (overhead) costs, and activities related to eligibility determination.
B. SNAP
SNAP offers nutrition assistance to millions of eligible, low-income individuals and families and also
provides economic benefits to communities. SNAP is the largest program in the domestic hunger safety
net. The program provides a monthly food benefit to eligible participants and other services to support
healthy eating. The program is funded and administered at two levels. The Federal Government provides
100 percent of the food benefit funding and assumes some administrative functions such as authorizing
and monitoring grocery stores (vendors). State programs receive Federal funds for program
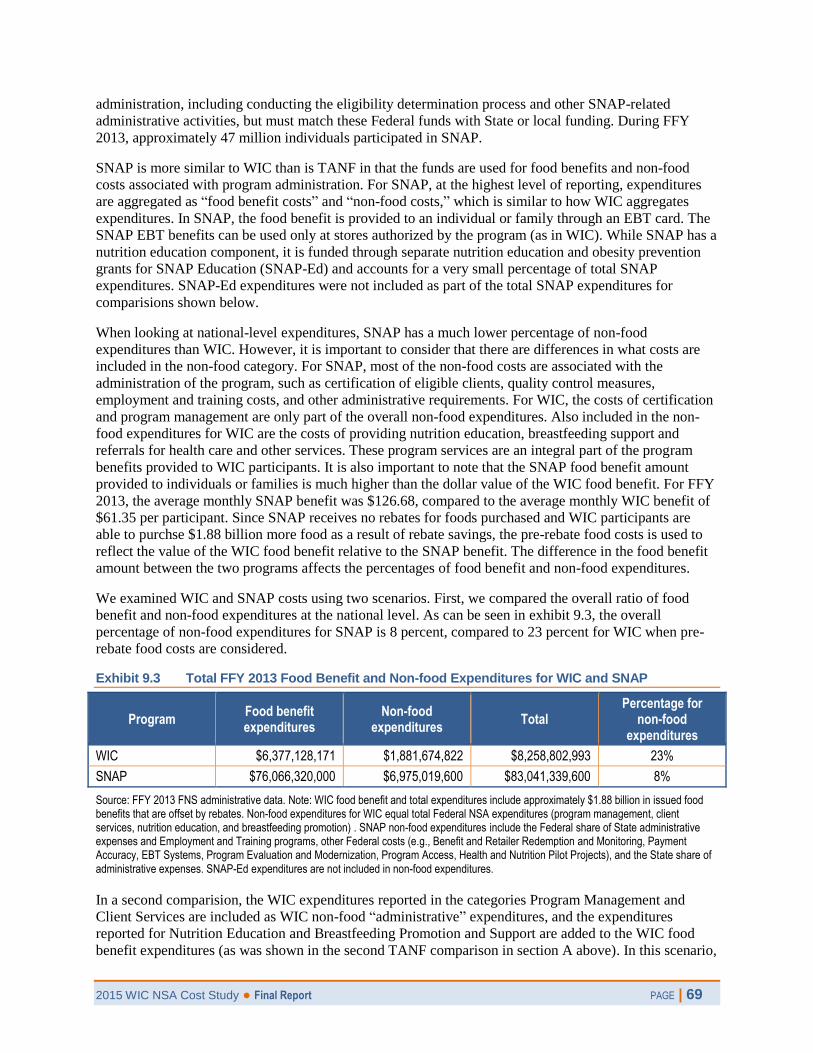
2015 WIC NSA Cost Study ● Final Report PAGE | 69
administration, including conducting the eligibility determination process and other SNAP-related
administrative activities, but must match these Federal funds with State or local funding. During FFY
2013, approximately 47 million individuals participated in SNAP.
SNAP is more similar to WIC than is TANF in that the funds are used for food benefits and non-food
costs associated with program administration. For SNAP, at the highest level of reporting, expenditures
are aggregated as “food benefit costs” and “non-food costs,” which is similar to how WIC aggregates
expenditures. In SNAP, the food benefit is provided to an individual or family through an EBT card. The
SNAP EBT benefits can be used only at stores authorized by the program (as in WIC). While SNAP has a
nutrition education component, it is funded through separate nutrition education and obesity prevention
grants for SNAP Education (SNAP-Ed) and accounts for a very small percentage of total SNAP
expenditures. SNAP-Ed expenditures were not included as part of the total SNAP expenditures for
comparisions shown below.
When looking at national-level expenditures, SNAP has a much lower percentage of non-food
expenditures than WIC. However, it is important to consider that there are differences in what costs are
included in the non-food category. For SNAP, most of the non-food costs are associated with the
administration of the program, such as certification of eligible clients, quality control measures,
employment and training costs, and other administrative requirements. For WIC, the costs of certification
and program management are only part of the overall non-food expenditures. Also included in the non-
food expenditures for WIC are the costs of providing nutrition education, breastfeeding support and
referrals for health care and other services. These program services are an integral part of the program
benefits provided to WIC participants. It is also important to note that the SNAP food benefit amount
provided to individuals or families is much higher than the dollar value of the WIC food benefit. For FFY
2013, the average monthly SNAP benefit was $126.68, compared to the average monthly WIC benefit of
$61.35 per participant. Since SNAP receives no rebates for foods purchased and WIC participants are
able to purchse $1.88 billion more food as a result of rebate savings, the pre-rebate food costs is used to
reflect the value of the WIC food benefit relative to the SNAP benefit. The difference in the food benefit
amount between the two programs affects the percentages of food benefit and non-food expenditures.
We examined WIC and SNAP costs using two scenarios. First, we compared the overall ratio of food
benefit and non-food expenditures at the national level. As can be seen in exhibit 9.3, the overall
percentage of non-food expenditures for SNAP is 8 percent, compared to 23 percent for WIC when pre-
rebate food costs are considered.
Exhibit 9.3 Total FFY 2013 Food Benefit and Non-food Expenditures for WIC and SNAP
Program Food benefit expenditures
Non-food expenditures
Total Percentage for
non-food expenditures
WIC $6,377,128,171 $1,881,674,822 $8,258,802,993 23%
SNAP $76,066,320,000 $6,975,019,600 $83,041,339,600 8%
Source: FFY 2013 FNS administrative data. Note: WIC food benefit and total expenditures include approximately $1.88 billion in issued food benefits that are offset by rebates. Non-food expenditures for WIC equal total Federal NSA expenditures (program management, client services, nutrition education, and breastfeeding promotion) . SNAP non-food expenditures include the Federal share of State administrative expenses and Employment and Training programs, other Federal costs (e.g., Benefit and Retailer Redemption and Monitoring, Payment Accuracy, EBT Systems, Program Evaluation and Modernization, Program Access, Health and Nutrition Pilot Projects), and the State share of administrative expenses. SNAP-Ed expenditures are not included in non-food expenditures.
In a second comparision, the WIC expenditures reported in the categories Program Management and
Client Services are included as WIC non-food “administrative” expenditures, and the expenditures
reported for Nutrition Education and Breastfeeding Promotion and Support are added to the WIC food
benefit expenditures (as was shown in the second TANF comparison in section A above). In this scenario,

2015 WIC NSA Cost Study ● Final Report PAGE | 70
shown in exhibit 9.4, administrative expenditures for WIC were 16 percent of the total in FFY 2013
compared to 8 percent for SNAP. As described previously, the large difference between food benefit
amounts for SNAP and WIC clients should be considered when making a comparison of the programs.
Exhibit 9.4 FFY 2013 Benefit and Administrative Expenditures for WIC and SNAP When Nutrition Education and Breastfeeding Costs Are Included as Benefits
Program Benefit
expenditures Administrative expenditures
Total Percentage for
administrative expenditures
WIC $6,936,448,145 $1,326,428,599 $8,258,802,993 16%
SNAP $76,066,320,000 $6,975,019,600 $83,041,339,600 8%
Source: FFY 2013 FNS administrative data. Note: WIC food benefit and total expenditures include approximately $1.88 billion in issued food benefits that are offset by rebates. WIC food benefit also includes NSA costs associated with Nutrition Education and Breastfeeding Promotion and Support. WIC administrative expenditures include Federal NSA expenditures associated with Program Management and Client Services only. SNAP non-food expenditures include the Federal share of State administrative expenses and Employment and Training programs, other Federal costs (e.g., Benefit and Retailer Redemption and Monitoring, Payment Accuracy, EBT Systems, Program Evaluation and Modernization, Program Access, Health and Nutrition Pilot Projects), and the State share of administrative expenses. SNAP-Ed expenditures are not included in non-food expenditures.
C. Case Studies of TANF and SNAP
TANF, SNAP, and WIC all have unique operations and requirements that drive their costs. For example,
TANF is a block grant program, SNAP is an entitlement program and WIC is a dicretionary program. The
case studies sought to examine operational features of TANF and SNAP that are different from or similar
to WIC to better understand program cost centers and expenditures. As was noted earlier, 14 States were
included in the case studies. States were selected and recruited for case study to ensure diversity in terms
of agency size, structure, FNS region, and benefit delivery type, so as to be representative of the diversity
of programs. WIC SA representatives from each of the 14 States participated in an indepth interview, as
did representatives from 24 WIC LAs (2 or 3 from each decentralized and combination SA) that operate
in these States. SNAP and TANF representatives from nine of the case study States were invited to
participate in indepth interviews. Five of the 14 SAs were excluded from the SNAP and TANF portion of
the case studies, because they were either an ITO program that did not have SNAP and TANF, a Trust
Territory that had a different type of social service program in place, or agencies not similar to other State
agencies with regard to cost centers (e.g., Hawaii). One SNAP and three TANF programs declined to
participate in case study interviews so SNAP representatives from eight States and TANF representatives
from six States participated in either a program-specific or joint interview. SNAP and TANF interviews
were primarily with program administrators at the State level; however, two interviews were also
conducted with county-level staff in California. Data were collected from July through October 2014.
Exhibit 9.5 summarizes for which States SNAP and TANF interviews were conducted.
Exhibit 9.5 SNAP and TANF Interviews Conducted
State SNAP Interview TANF Interview
California yes declined
Connecticut yes yes
Illinois yes yes
Texas yes yes
Oklahoma yes yes
Missouri yes yes
Arkansas yes declined
South Dakota yes yes
Nevada declined declined

2015 WIC NSA Cost Study ● Final Report PAGE | 71
State SNAP Interview TANF Interview
Total 8 State; 2 county-level 6
Note: One state-level and two county-level SNAP interviews were conducted in California. In Connecticut and Illinois, SNAP and TANF representatives participated in a joint interview during which both program were discussed.
i. Findings from case studies related to program similarities and differences
Based on interviews conducted with WIC, SNAP, and TANF representatives in the eight States, each of
the three programs conduct some functions that are similar. For example, each of the programs must have
a system in place to certify clients as eligible, issue benefits to the clients, and periodically reevaluate
client eligibility. All of the programs use management information systems to collect data on the clients
and record benefit issuance information. SNAP and WIC both provide nutrition education to clients,
although WIC is required to provide specific types and numbers of nutrition education contacts related to
eligibility categories, while nutrition education in SNAP is an optional activity with State flexibility to
develop the educational programming. All eight case study States provide some form of SNAP nutrition
education to eligible populations.
Another common function across the three programs is development and communication of policy. The
State-level agencies that administer SNAP and TANF are responsible for communicating Federal and
State policy to the local organizational units responsible for day-to-day program operations, which is
similar to how WIC is administered. State agencies administering the three programs typically have a
policy unit within their organization. In small States, it may be one individual; in large States, there may
be multiple people responsible for program policy. Like WIC, policies for TANF and SNAP are usually
communicated through policy manuals and “clarification letters” to local organizational units providing
direct services.
A final common function relates to compliance and audits of benefit issuance. Like WIC, SNAP and
TANF State agencies have compliance and audit units to ensure program integrity. These are similar to
WIC in that they have a role in detection and follow-up on participant fraud, such as false reporting of
eligibility information or misuse of benefits. For SNAP, States are held accountable for error rates in their
certification process and must conduct internal audits and report errors to the Federal Government.
While these common functions exist across the three programs, there is significant variation among the
case study States in the organizational structure and operations of SNAP, TANF, and WIC. These
differences affect the percentage of funds spent on non-benefit activities and how costs are shared
between programs. There also are some significant and unique functions that only exist in individual
programs that are associated with differences in how SNAP and TANF are administered compared to
WIC.
Below is a summary of factors identified in the financial analysis and case studies as being associated
with these differences.
ii. Program purpose and focus of efforts
The most notable difference in purpose and focus is between TANF and WIC. While WIC is a
preventative public health program that provides support for eligible mothers and children from
pregnancy through the child’s fifth birthday, TANF is designed to provide short-term support with an
emphasis on helping families gain independence from the program. This is evident in the way TANF
funds are used with 65 percent of TANF non-benefit funds committed to four activities: job-related
support, child care services for parents working or attending school, prevention of out-of-wedlock
pregnancies, and other family support services (ACF expenditure data, 2013).
Another example of the difference in program focus is in the area of administrative responsibility for
vendor (grocery store) activities between WIC and SNAP. For SNAP, FNS funds and conducts all
2015 WIC NSA Cost Study ● Final Report PAGE | 72
activities related to vendor authorization, compliance, and management at the Federal level, so each
individual State is not engaged in these activities. In WIC, all SAs have responsibility for authorizing,
training and monitoring grocery stores as well as for ensuring vendors have competitive prices and
imposing sanctions and fines for non-compliant vendors.
Finally, State agencies that operate SNAP and TANF have considerable flexibility in how they administer
their programs. As noted earlier, TANF is a block grant program that provides several options for States
to consider in operating their program. With SNAP, States can add their own limitations, expansions and
requirements (e.g., State legislation) that affect how services are delivered. Usually, these State-level
requirements are permitted through Federal options or States can apply for and receive waivers to Federal
policy in order to customize, improve, or limit program features. In comparison, WIC SAs have flexibility
in some program operations, such as the specific foods on their approved food list and their vendor
authorization criteria, but WIC SAs currently have no opportunity to obtain waivers to most program
requirements.
iii. Cost share between programs
For the most part, in the case study States,WIC functions as a stand-alone program in terms of how it is
administered and how costs are allocated. WIC has its own system of certifying clients and issuing
benefits that is not, in most cases, integrated with other programs. The one example of coordination of
WIC certification with the other programs that is commonly used is WIC adjunctive income eligibility
which allows WIC to accept documentation of participation in Medicaid, TANF, or SNAP as proof of
income eligibility. Adjunctive eligibility allows WIC to avoid costs associated with collecting and
evaluating income information from program applicants. The most recent FNS WIC Participant
Characteristics Study indicates that 70 percent of WIC participants are certified as income eligible
through adjunctive eligibility. Most of the other demographic and health data used for WIC eligibility
determination is collected as a part of the certification process and not incorporated in a joint application
in the case study States. Some States have linkages to Medicaid data for use in documenting adjunctive
eligibility, but not for obtaining health or medical information.
In the case study States, SNAP and TANF use a coordinated eligibility and benefit issuance system that
allows them to share the costs of conducting eligibility and providing benefits. The eligibility process for
the two programs is often consolidated into a single application for SNAP, TANF, Medicaid, and other
social service programs for low-income individuals (e.g., home heating allowances, child care). Clients
that come in for certification in one program can be certified (if eligible) for multiple programs using the
same forms and process. States that use this approach develop a cost-sharing method for sharing costs of
certifying a client across all of the programs for which the client is eligible. Although WIC was not part of
the joint application in any of the case study States, it may be in States that were not included in the case
studies.
During the case study visits, it was noted by all of the interview respondents that there is a significant
cost-sharing advantage to having SNAP and TANF combined with Medicaid. There were two distinct
advantages pointed out in the interviews. First, because of the implementation of the Patient Protection
and Affordable Care Act (ACA) and, in some States, Medicaid expansion, the systems used for
certification of clients have been upgraded significantly. They indicated that Medicaid is making
management information system upgrades that impact all of the other programs. Because these system
upgrades are being paid for mostly by Federal Medicaid dollars, SNAP and TANF are receiving the
benefit of these upgrades without incurring the cost.
A second advantage of being linked to Medicaid relates to methodologies used to determine and divide
the costs of certifying clients between the three programs. Five of the eight States included in the SNAP
and TANF case study interviews noted the use of Random Moment Time Study, a federally approved
statistical sampling technique, for cost allocation purposes. Using this approach, a statistical sample of
2015 WIC NSA Cost Study ● Final Report PAGE | 73
case workers or field staff are surveyed, typically via email, to determine the proportion of time spent
providing SNAP, TANF, or Medicaid services, and then costs are allocated accordingly. Some case study
States explained that if a client is applying for Medicaid, SNAP, and TANF at the time of the time study,
costs associated with working the case would be allocated across all three programs. Still other case study
States explained that if a client is applying for SNAP at the time of the time study, the worker’s time will
be coded to this program, even though the client may also be evaluated and, if eligible, enrolled in TANF,
Medicaid, or other programs. With the advent of ACA and the Medicaid expansion (in those States that
expanded Medicaid), State administrators indicated that more individuals have been applying for
Medicaid. As a result, the time studies are reflecting more costs attributed to Medicaid than in the past.
iv. Efforts related to program simplification and use of technology
WIC requires applicants to complete an application (certification) process at a local WIC office. The
certification process includes collecting and entering demographic, financial, nutrition, and health
information into an MIS system; prescribing and issuing food benefits; and providing program orientation
information. Nutrition education and/or breastfeeding support is provided at the time of the certification
and periodically during the period of eligibility.
TANF programs in the case study States operate somewhat similar to WIC in that they require an onsite
visit to complete the application/certification process. However, unlike WIC, many State SNAP programs
have developed efficient and less labor-intensive systems to enroll clients and issue benefits. For example,
all but one State in the case study group have a Web-based application system for SNAP, where clients
can access a website to apply online. Several States use call centers, where clients can call and enroll or
report changes to income over the phone. Still a third approach used by SNAP programs is to have
community agencies conducting outreach activities and help clients complete applications, which are then
mailed each day to the SNAP office.
Some examples of program simplification and enhanced use of technology described in the case study
interviews follow:
California. California State SNAP administrators noted that they have implemented a number of
program simplifications and efficiencies, including moving from quarterly to semiannual client
reporting, implementing broad-based categorical eligibility for certain populations, waiving face-
to-face interview requirements, and using automation such as e-notifications to SNAP households.
In addition, California opened 27 call centers to support SNAP certification and reporting. These
efforts have been helpful in streamlining county-level administrative processes and addressing the
SNAP expansion associated with the recession. California was able to maintain a high degree of
integrity and timeliness despite caseloads that doubled over the past few years.
Texas. Texas State SNAP and TANF administrators indicated that they are implementing an
application system for Medicaid, SNAP, and TANF using a Web-based application accessible via
smartphones. Applicants can take photos of required documentation and attach these to the
application as an alternative to providing paper copies of documentation to social service
offices.The use of Web-based and call center application processes allows States to reduce staffing
in local offices.
Illinois. Illinois SNAP and TANF State adminstrators described a call center with a Web-based
system that assigns cases based on staff availability to distribute the workload among caseworkers
across the State. The system allows the State to assign a percentage of time spent on certification
activity for each worker depending on their experience/abilities. An experienced worker could be
in the “round-robin” assignment at 100 percent, and a new worker could be at 50 percent. The next
phase will develop workload standards to create statewide equity in assignments and enhance
quality control.

2015 WIC NSA Cost Study ● Final Report PAGE | 74
Missouri. Missouri SNAP and TANF State administrators explained they are in the process of
reorganizing and developing a new application and enrollment system. The State intends to set up
resource centers, where program applicants can call in and get assistance with their applications;
and application processing centers, where the application review and eligibility determination will
be done. The result will be an upfront customer service center and a back-end processing center.
This system will facilitate an even distribution of workload and ensure applications are processed
timely.
D. Summary from a Comparison of WIC to SNAP and TANF
While differences in cost reporting and variations in program mission and operations make it difficult to
compare costs for WIC, SNAP, and TANF, some general observations about the differences in
administrative costs between these programs can be made. For example, SNAP is more similar to WIC
than is TANF, because both SNAP and WIC offer food benefits to low-income individuals and families,
yet SNAP allocates a much smaller percentage of funds to non-food expenditures compared to WIC.
When making this comparison, however, it is important to consider that most of SNAP’s non-food
expenditures support administration of the program, such as certification of eligible clients, quality
control measures, employment and training costs, and other administrative requirements; whereas for
WIC, non-food expenditures include the costs of providing nutrition education, breastfeeding support, and
referrals for health care and other services. These differences make it challenging to compare the true
administrative costs of SNAP and WIC.
TANF allocates a much larger percentage of its funds to non-cash expenditures, but like in WIC, some of
these “administrative” expenditures support non-cash benefits such as employment support, tax credits,
childcare assistance, support for new fathers, programs to prevent out-of-wedlock pregnancy, and
transportation services for clients. Due to the way financial data are reported to ACF, it was not possible
to isolate or separate out costs that may be used to support these services. Moreover, the specific services
offered through TANF vary substantially by State. These differences make it challenging to compare the
true administrative costs of TANF and WIC.
The study also found that cost efficiencies and use of technology in SNAP appear to reduce its labor and
other costs compared to WIC and TANF. Both WIC and most TANF programs require onsite
certification, where a client must present themselves at an office and complete a certification process.
SNAP has moved away from this process, allowing Web- and phone-based application processes, using
call centers, and distributing workloads to ensure timely application process and efficient use of staff.
Respondents in the case study States report that these efforts have significantly reduced the costs of
administering the program and made it more customer friendly.
Joint applications from SNAP, TANF, and Medicaid also help to reduce the financial burden and
duplication of effort for all three programs. Instead of having to complete an application for each of the
three programs, an applicant can complete a consolidated application, and costs are distributed across the
three programs based on an approved cost allocation methodology. This consolidated application system,
combined with employee time tracking, makes it easy to allocate costs across programs. Although WIC
may not benefit to the same degree, it is able to avoid costs associated with collecting and evaluating
income information for approximately 70 percent of its program applicants through adjunctive eligibility.
Finally, at least in the case study States, it appears that ACA has provided enhanced funding for States to
improve their technology and MIS with little or no cost to TANF or SNAP. The opportunity provided
through ACA to update computer systems using Medicaid funds in these States has benefited all three
programs. ACA-related enhancements were not cited by WIC programs during case study interviews.
2015 WIC NSA Cost Study ● Final Report PAGE | 75
Chapter X: Conclusion
The purpose of the WIC NSA Cost Study is to provide an updated assessment of how NSA funds are
used, including the amounts and categories of costs paid with NSA grants and the variation of these costs
among SAs and LAs. Many Program changes have occurred since that time, including growth in WIC
participation; expanded use of technology, including EBT for food benefits delivery and use of MIS to
create and manage participant records; implementation of updated WIC food packages; and increased
breastfeeding promotion and support services. This section summarizes key findings from the study and
describes lessons learned through the study’s extensive data collection effort.
A. Key findings
In FFY 2013, $1.923 billion was provided to SAs as NSA grants, including grant funds and operational
adjustment funds from the Federal appropriation, and reallocated FFY 2012 funds and SAs reported a
total of $1.882 billion in NSA expenditures. During this same fiscal year, the program served
approximately 8.7 million participants per month, resulting in an average Federal NSA expenditure per
participant per month of $18.14. The study highlights many contextual factors that are important to
understanding the actual cost of Program administration. For example, 12 SAs reported receiving State-
appropriated funding for WIC in addition to their Federal grants, although the amount of State funding as
a percentage of total NSA costs has declined since FFY 1998. Many SAs and LAs reported receiving in-
kind contributions that help support the Program. Moreover, nearly one-third of NSA expenditures are for
the provision of nutrition education and breastfeeding support, which are core program benefits provided
to participants, thus the amount WIC spends to administer the program is significantly less than the total
amount of its NSA expenditures.
i. SA-related findings
The study found that prior-year expenditures, caseload, differences between the State and Federal fiscal
years, and the timing and uncertainty of Federal funding were the primary factors influencing SA budget
decisions in FFY 2013. Although a SA’s operational structure has an influence on how it approaches
budget planning, most SAs allocated a majority of their FFY 2013 NSA grant for local service delivery,
which was provided either through SA-run sites (in centralized and combination SAs) or LAs (in
decentralized and combination SAs).
NSA costs are incurred in four key areas: labor and personnel; service contracts; materials, services, and
travel; and indirect costs. In FFY 2013, labor and personnel costs accounted for half of all NSA
expenditures at the SA-level and supported SA-level staff FTEs that were primarily dedicated to functions
associated with program administration and supervision, local program support, vendor management,
nutrition education and policy, and breastfeeding promotion and support. Many SAs reported that staffing
costs have increased in recent years.
Most SAs charged indirect costs to their NSA grants in FFY 2013. These costs pay for a variety of
services (e.g., accounting services and human resource services) and have increased in recent years for
many SAs. A variety of methods were used by SAs to allocate indirect costs to WIC in FFY 2013.
Costs associated with service contracts and materials, services, and travel were also prevalent and
accounted for a substantial portion of SA-level NSA expenditures. SAs explained that many of the SA-
level costs for contracts, materials and services are for purchases or services to support local-level
operations.

2015 WIC NSA Cost Study ● Final Report PAGE | 76
The study also examined NSA cost measures, including those described above, by SA size and
operational structure. When statistically significant differences were observed, it was primarily between
SAs operated by a State health department and SAs operated by an ITO.
ii. LA-related findings
Most LAs operating in FFY 2013 were small in size (served 2,500 participants or less per month) and
self-identified as a local government entity. Like SAs, LAs rely on historical expenditure information
along with anticipated expenses for the upcoming year when planning their budget. Personnel costs,
including anticipated increases in salaries/benefits, are the biggest factors that LAs consider during the
budget development process.
Labor and personnel costs account for the majority of NSA expenditures at the local level regardless of
LA size or type. WIC clerks, degreed nutritionists, program managers, registered dieticians, and
paraprofessional nutrition educators account for most staff FTEs at the LA level. LAs are typically part of
an organization or agency that provides services in addition to WIC; thus, it is not surprising that many of
them reported sharing staff resources and other costs, such as facility space, with other programs. Sharing
staff with other programs may provide LAs with greater flexibility in how they use NSA funds, since LAs
that share staff with other programs report a lower portion of expenditures for labor and personnel in FFY
2013 than those that do not share staff.
Although a majority of LAs charged indirect costs to their NSA grant in FFY 2013, this cost center
accounted for a relatively small percentage of total NSA expenditures at the local level. As with the
findings for SAs, LA indirect costs often pay for services, such as accounting services and human
resource services. At the LA level, indirect costs were typically calculated as each benefiting program’s
percentage of total salaries, total salaries and benefits, total budget, or total expenditures. Contracted
services were less common and accounted for a much smaller percentage of NSA expenditures among
LAs as compared to SAs. The same was true for materials, services, and travel expenses.
Local-level NSA cost measures, such as the percentage of NSA funds expended in each cost center, was
examined by LA size and type. The study found differences in the average NSA expenditure per
participant between small LAs and larger LAs (medium and large) and between LAs operated by a tribal
entity and all other LAs (local government and nongovernment). The study also found that the percentage
of NSA allocated to direct costs and specifically to materials, services, and travel was signficantly
different between governement-run and nongovernment-run LAs. Taken together, these findings indicated
that LA size and type may influence how NSA dollars are expended at the local-level.
B. Study Limitations and Lessons Learned
To inform the WIC NSA Cost Study, data were collected and compiled from several sources, including
extant financial data, Web surveys, and in-depth interviews. Overall, the study was successful in yielding
quality, useful information. This section describes study limitations that might have impacted data quality
and completeness as well as lessons learned that could improve future studies of WIC NSA costs.
i. Data collection procedures
The sampling design for both the SA and LA surveys was a census. There are many benefits to doing a
census when the population of interest is small, as was the case with this study. However, there are also
many benefits to doing a sample. When getting responses from the population of interest will be difficult
or burdensome, a sample is the better of the two options. Given the burden of this and other FNS surveys
that were fielded at the same time and the reporting requirements WIC agencies face, a sample may have
been a better approach and would be advisable in the future, particularly for LAs. Regardless of approach,
identifying the eligible pool of respondents is essential to ensuring that study findings are representative
of the population. Identifying the eligible pool of SAs for this study was straightforward, however,
2015 WIC NSA Cost Study ● Final Report PAGE | 77
because LAs can close, merge, and change names at any point during the year, identifying the eligible
pool of LAs was more challenging, thus might not have yielded a perfect list.
When collecting detailed cost data from SAs and LAs, the timing of the request is also an important
consideration. Data collection for the Web surveys began in June 2014 and ended in November 2014.
This time frame was ideal, because SAs had final FFY 2013 annual financial information readily
available to aid them with completion of the survey, and most had the opportunity to complete the survey
before preparing their FFY 2014 annual financial report; thus, the overlap and potential for confusion
regarding the fiscal year associated with the survey was minimized.
Still, it is important to note two related study limitations. First, due to staff turnover at the SA and LA
levels, it is possible that the person who prepared and submitted year-end expenditure reports was not the
same person who completed the Web survey. Second, because the FFY 2013 WIC appropriation was
subject to spending cuts associated with the Federal budget sequestration, some of the study findings may
be influenced by SAs having to report on an atypical funding year.
For a variety of reasons, case study data were collected concurrently with Web survey data. This limited
the extent to which interviews could be used to clarify and better understand data reported through the
survey. Staggering these data collection efforts would be advisable and would likely yield even more
useful information. Ideally, the surveys should be administered on a schedule slightly condensed but
similar to the one used in this study, and case study interviews should be conducted after Web survey data
collection is complete. Moreover, sufficient time should be allowed for the preliminary analysis of Web
survey data before conducting the case study interviews to provide the opportunity to discuss reported
cost data in more detail and clarify why and how specific cost data were reported.
Overall, communication about the study to FNS Regional Offices, SAs, and LAs was effective. Prior to
fielding the Web surveys, SAs were informed of the study and associated data requests via email. SAs
were also provided with a draft notice that they could forward to their LAs to inform them of the study
and forthcoming survey invitation. Then, all SAs and LAs were sent the official study email invitation,
which provided the Web link to the survey, a unique ID, and a password. Survey help desk support was
provided on all weekdays throughout the data collection period, a printable User’s Guide and help text
pop-ups were readily available, and numerous nonresponse follow-up strategies were implemented to
increase response rates over the course of data collection. Webinars may be an additional communication
mode that would be helpful for complex surveys such as this one. Webinars allow survey respondents to
receive consistent and clear instructions on how to complete the survey and troubleshoot issues they
might encounter and to ask questions about the survey.
ii. Instrumentation
According to survey respondents, the cost data they were asked to report was difficult to provide, because
they do not track expenditures in a way that allowed them to easily retrieve data for the specified line
items and categories that were requested. For example, the survey asked SAs to estimate the total amount
of salaries that supported various SA functions, such as vendor management. Because salaries are not
tracked by function, SAs with multiple staff supporting the vendor management program area would have
had to calculate a total salary value based on the percent of each person’s time and salary that was spent
on this functional area. Moreover, SAs were asked to determine the portion of salaries by functional area
that were allocated to each of the four cost categories. Future studies of WIC NSA Costs should require
less detailed cost reporting, allow greater flexibility for providing cost data, or use an alternative means
for collecting cost data if the same level of detail is desired. For example, FNS might want to consider an
audit-style data collection effort from a smaller number of agencies if it desires precise and detailed cost
data. The level of detail and precision required will likely depend on the specific research questions FNS
aims to address. If the goal is to gain a general understanding of how NSA dollars are being used, similar
to this study, a simplified, streamlined, and perhaps more flexible Web survey will likely suffice.

2015 WIC NSA Cost Study ● Final Report PAGE | 78
Additional consideration should also be given to the validation of cost data. In the case of cost surveys,
the comparison of aggregate costs reported through survey responses with aggregate costs reported via
other means is valuable for helping respondents determine whether they have omitted data. For the WIC
NSA Cost Study, SA-level costs reported on the SA survey were compared to existing annual SA-level
expenditure data from the FNS (reported by the SA on the FNS-798A report). The same was true for
local-level costs reported on the SA survey; these costs were compared to annual local-level expenditure
data from FNS (reported by the SA on the FNS-798A report). Based on a thorough review of survey data
and clarification provided by some SAs, it is clear that some of the costs reported by SAs on the survey
were reported as local-level costs on the FNS-798A report (e.g., costs for supplies and equipment that are
distributed by the SA for local use). For this reason, it may be more appropriate in future studies to
compare total costs (SA and local) reported on the survey to total NSA expenditures reported to FNS and
to ensure that SAs understand how their data will be validated.
Even with improvements to the data used for validation, it may be difficult for SAs to make survey cost
data exactly equivalent to existing expenditure information for a variety of reasons, including those
decribed above (e.g., SAs do not track expenditures in a way that allows them to easily retrieve the
requested data). In order to balance data quality and respondent burden, studies of WIC NSA costs should
always allow for some variation between reported and actual costs, similar to the current study.
Finally, because the Web survey required substantial effort on the respondents’ part, any future Web
surveys of NSA costs should integrate survey programming that allows for an assessment of time spent
on each screen so that realistic estimates for survey completion can be developed during pretesting.
iii. Understanding technology related costs
SAs and LAs continually implement more sophisticated MIS to make their certification and food delivery
processes more efficient. Also, many are in the process of implementing EBT systems to replace their
paper food instrument systems to deliver food benefits to participants. It is difficult to determine whether
this increased use of technology has increased or decreased the need to use NSA funds for information
technology related expenses, particularly based on a point-in-time analysis. To truly understand the costs
associated with planning and implementing a new MIS or EBT system, including the fixed or one-time
versus ongoing costs, FNS should conduct a longitudinal study that tracks related expenses and potential
cost-savings before project planning starts and for some period following implementation of the new MIS
or EBT system.
An important part of a study like this would be to understand the extent to which new technology creates
efficiencies in program operations such that NSA funds can be “redirected” from a cost such as staff
salaries to the ongoing costs associated with the technology, or vice versa. The Implementation Advanced
Planning Documents (IAPD) that SAs prepare prior to using NSA funds or receiving additional Federal
funds for a proposed technology-related project would be a valuable source of information for this type of
study. As part of the IAPD process, SAs have to conduct a cost analysis to identify what the one-time and
ongoing costs of the technology will be and anticipated cost savings once the technology is implemented.
This type of study would be invaluable, as there is much that can be learned from implementation efforts
that are currently underway. Because technology is constantly evolving, investments in this area are likely
to continue; thus, it would be in the Program’s best interest to take an in-depth look at the factors that
most influence the fixed and ongoing costs of technology-related projects.