WIC FAMILY FOOD ACCESS PROJECT, 2011. PHASE 2, TEAM A: FINANCIAL ACCESS AND FOOD INSECURITY Sarah...
27
WIC FAMILY FOOD ACCESS PROJECT, 2011
-
date post
19-Dec-2015 -
Category
Documents
-
view
216 -
download
1
Transcript of WIC FAMILY FOOD ACCESS PROJECT, 2011. PHASE 2, TEAM A: FINANCIAL ACCESS AND FOOD INSECURITY Sarah...

WIC FAMILY FOOD ACCESS PROJECT, 2011
PHASE 2, TEAM A:FINANCIAL ACCESS AND FOOD INSECURITY
Sarah Bailey, Juli Louttit, Emily Faerber
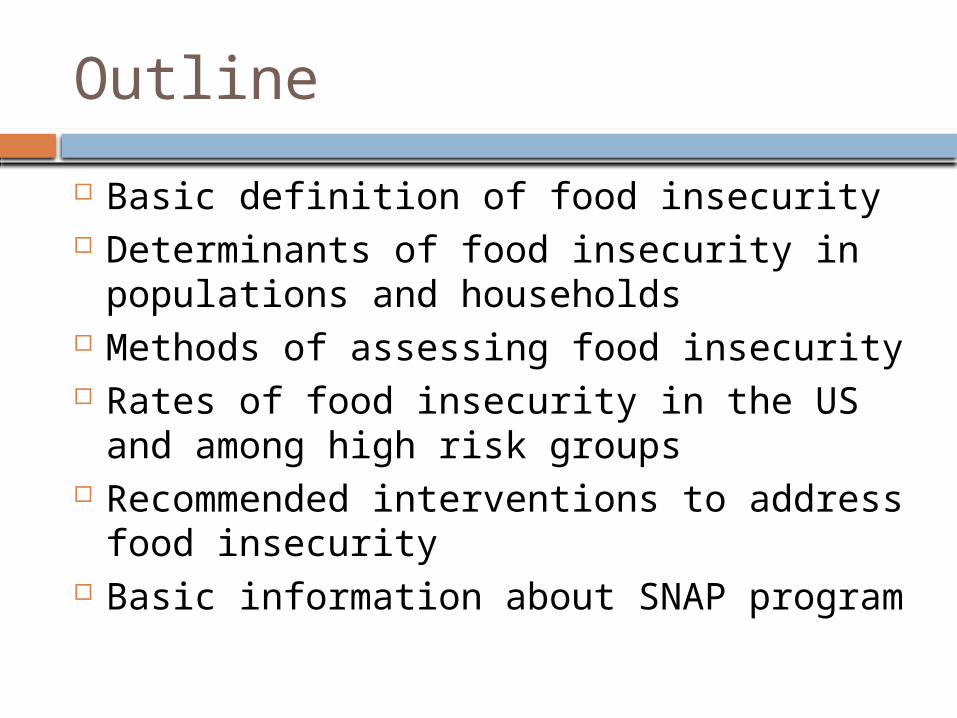
Outline
Basic definition of food insecurity Determinants of food insecurity in
populations and households Methods of assessing food insecurity Rates of food insecurity in the US and
among high risk groups Recommended interventions to address
food insecurity Basic information about SNAP program
Definition of food insecurity

What is food insecurity?
“Limited or intermittent access to nutritionally adequate, safe, and acceptable foods accessed in socially acceptable ways”¹
Low food security: multiple indications of food access problems, but little or no actual reductions of food intake¹
Very low food security: eating patterns of one or more members were disrupted and food intake was reduced¹

What is food insecurity?
The term “food insecurity” includes low food security and very low food security
Before 2006¹ Low food security was known as “food
insecure without hunger” Very low food security was known as “food
insecure with hunger”

Determinants of food insecurity in populations and households
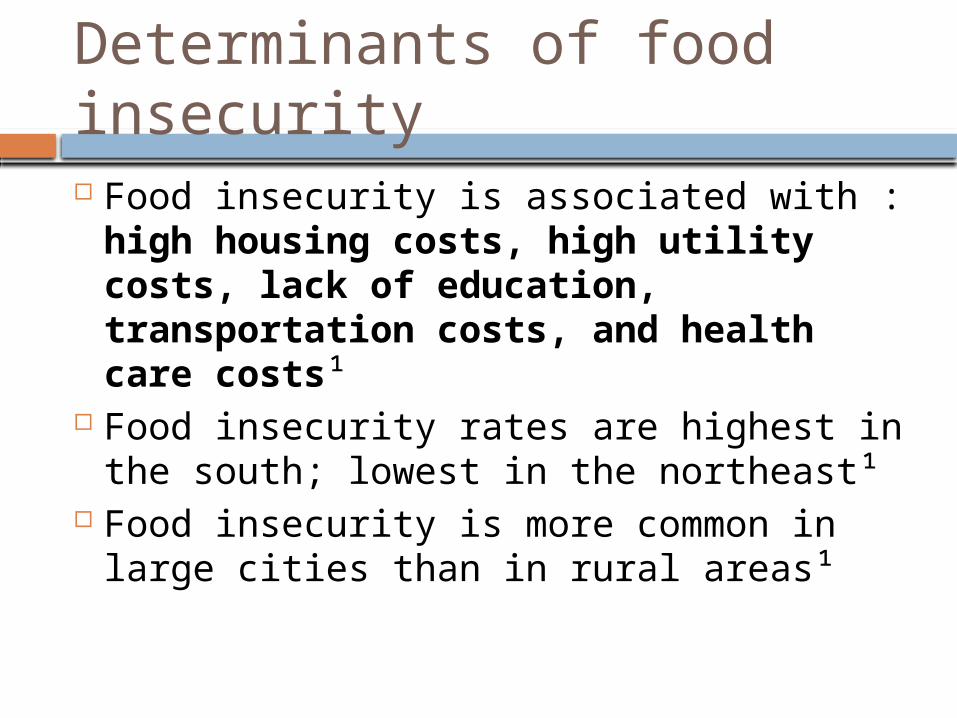
Determinants of food insecurity Food insecurity is associated with :
high housing costs, high utility costs, lack of education, transportation costs, and health care costs¹
Food insecurity rates are highest in the south; lowest in the northeast¹
Food insecurity is more common in large cities than in rural areas¹

Determinants of food insecurity
Food insecurity is associated with an event that puts stress on the household budget¹
Food insecurity is more common among families that stopped receiving SNAP benefits in the previous year than in families currently receiving SNAP benefits²
Families living near or below the FPL experience higher rates of food insecurity¹
Food insecurity rates parallel poverty rates¹

Methods of assessing food insecurity

Food Security Assessment: A Brief History⁴
1994- USDA’s Food and Nutrition Service partnered with DPHHS to hold a conference to identify an appropriate tool to measure food insecurity.
Since 1996- The food security statistics are reported by ERS based on annual surveys developed by the U.S. Food Security Measurement Project, a collaboration among Federal agencies, academic researchers, and non-profit agencies.
2006- Release of IOM report, “Food Insecurity and Hunger in the United States: An Assessment of the Measure.” Recommended ongoing annual surveying with minor adjustments to the survey tool.
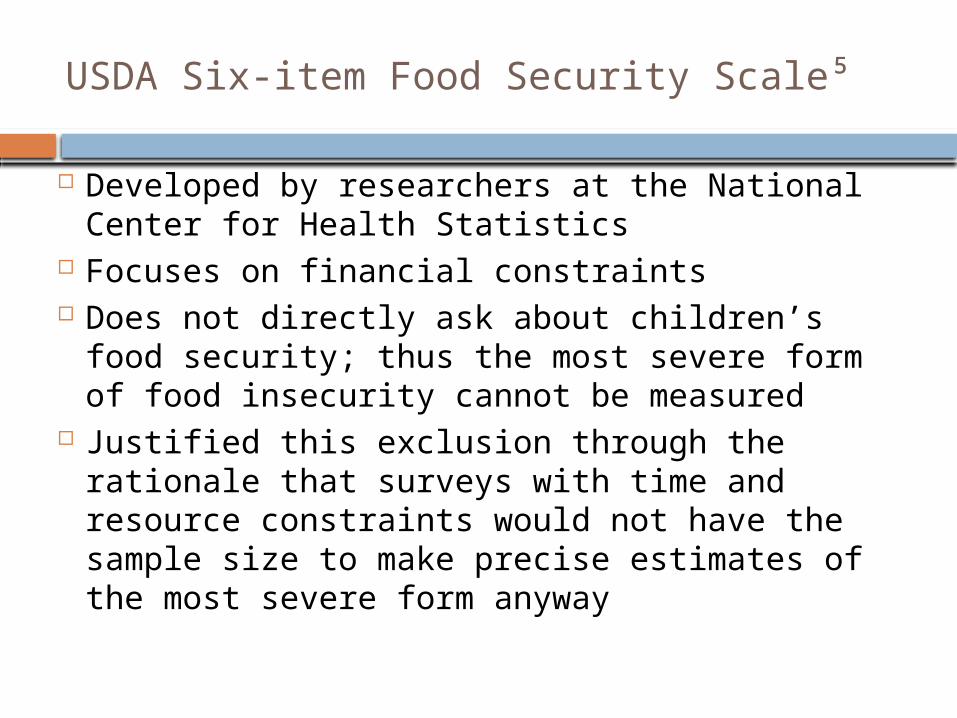
USDA Six-item Food Security Scale⁵
Developed by researchers at the National Center for Health Statistics
Focuses on financial constraints Does not directly ask about children’s food
security; thus the most severe form of food insecurity cannot be measured
Justified this exclusion through the rationale that surveys with time and resource constraints would not have the sample size to make precise estimates of the most severe form anyway

Six-Item Food Security Survey

Assessing household food insecurity through the six-item survey⁵
Raw Score 0-1: High or marginal food security
Raw Score 2-4: Low food security Raw score 5-6: Very low food security
Food insecurity refers to low food security and very low food security
To minimize respondent burden, respondents may be screened after the first three questions.

How Good is It?
Does not directly address children’s food security, and may miss the most severe range of food insecurity
May ignore non-financial causes of food security
Does correctly classify 97.7% of households as food insecure, and has satisfactory sensitivity and specificity⁶.
Less respondent burden; can be screened after 3 items for food secure individuals
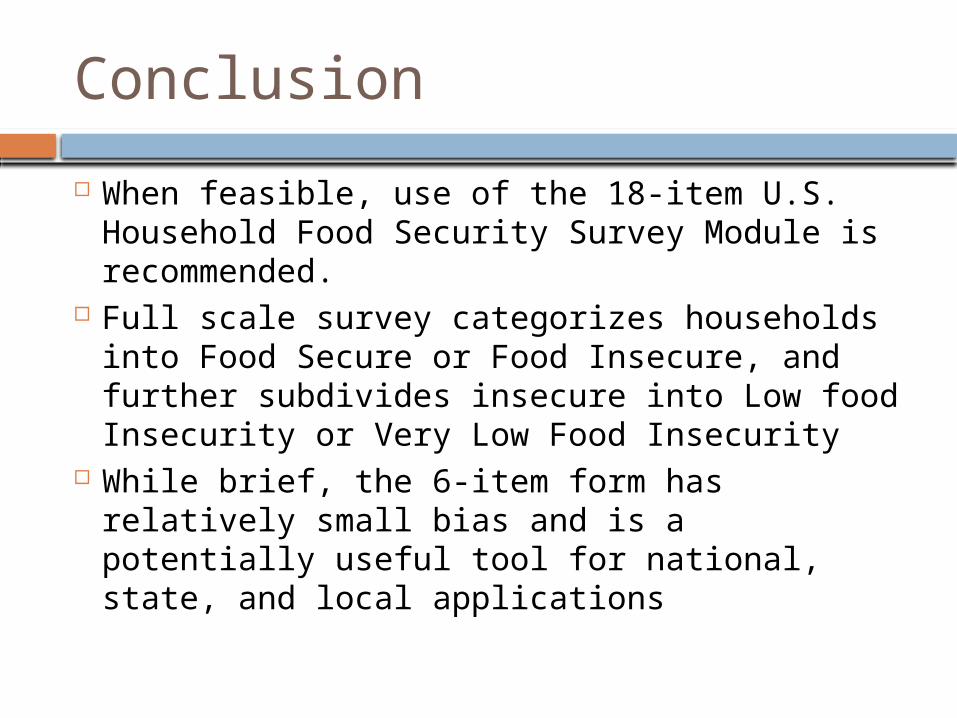
Conclusion
When feasible, use of the 18-item U.S. Household Food Security Survey Module is recommended.
Full scale survey categorizes households into Food Secure or Food Insecure, and further subdivides insecure into Low food Insecurity or Very Low Food Insecurity
While brief, the 6-item form has relatively small bias and is a potentially useful tool for national, state, and local applications

Rates of food insecurity
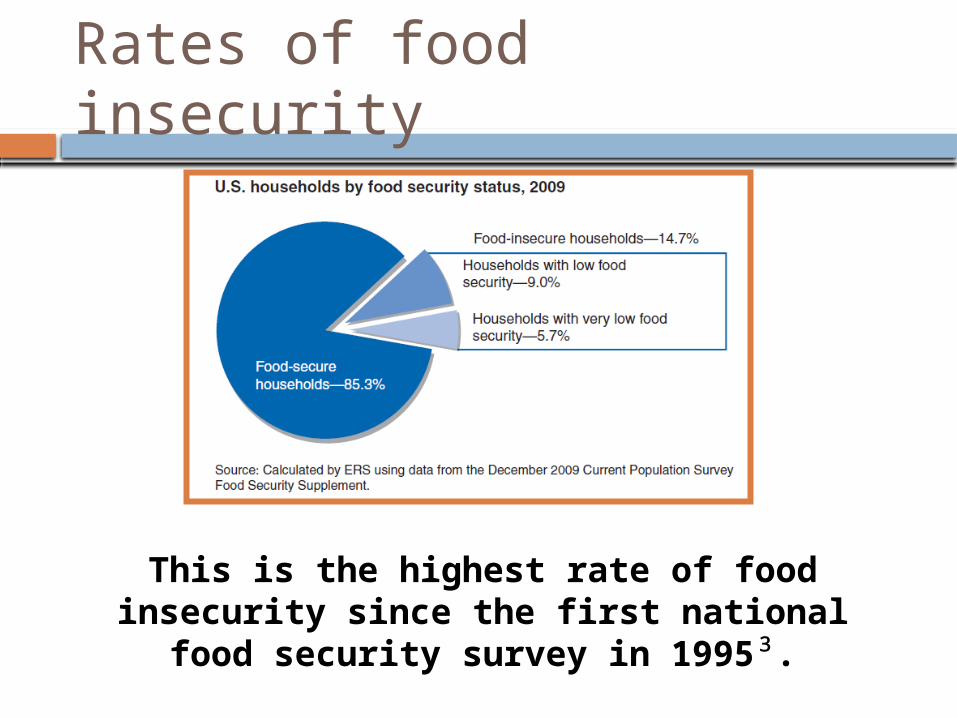
Rates of food insecurity
This is the highest rate of food insecurity since the first national
food security survey in 1995³.
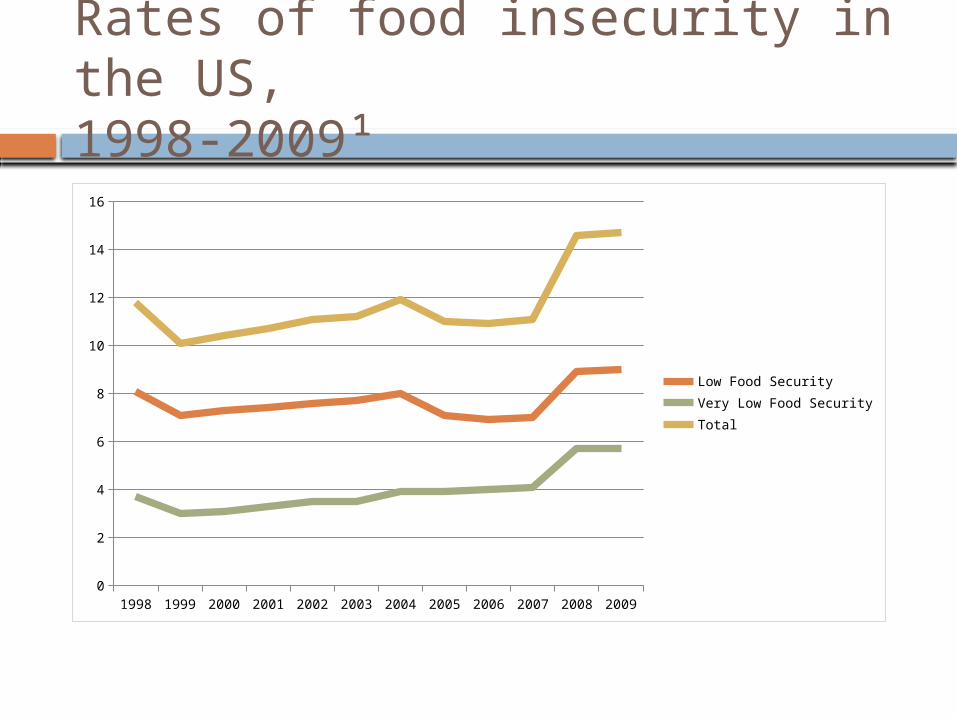
Rates of food insecurity in the US, 1998-2009¹
1998 1999 2000 2001 2002 2003 2004 2005 2006 2007 2008 20090
2
4
6
8
10
12
14
16
Low Food SecurityVery Low Food SecurityTotal
Basic information about SNAP Program
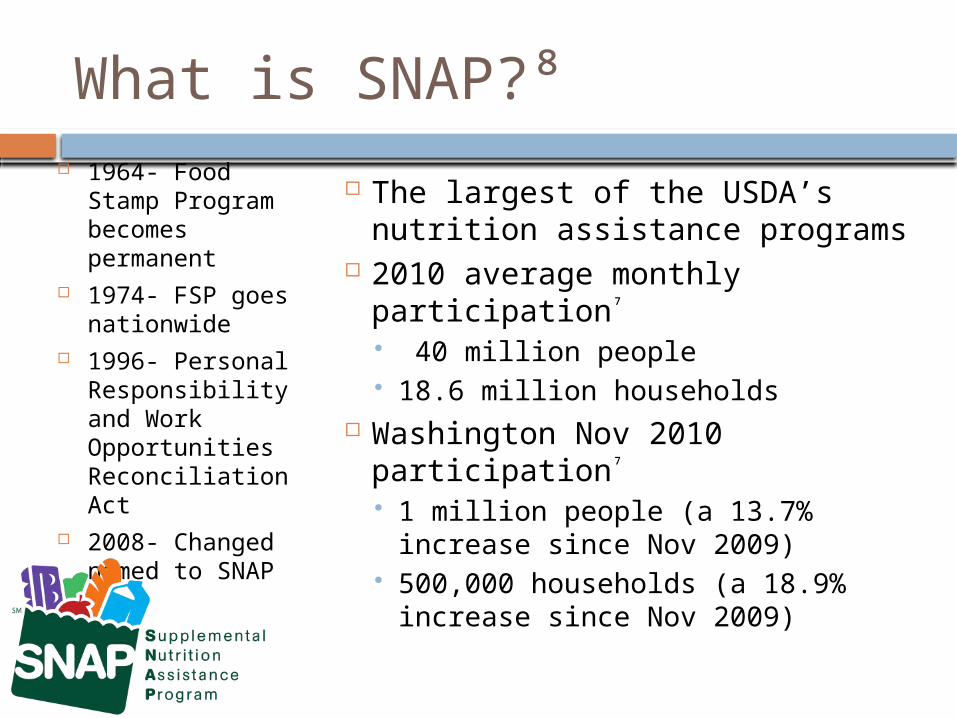
What is SNAP?⁸ 1964- Food
Stamp Program becomes permanent
1974- FSP goes nationwide
1996- Personal Responsibility and Work Opportunities Reconciliation Act
2008- Changed named to SNAP
The largest of the USDA’s nutrition assistance programs
2010 average monthly participation⁷
40 million people 18.6 million households
Washington Nov 2010 participation⁷
1 million people (a 13.7% increase since Nov 2009)
500,000 households (a 18.9% increase since Nov 2009)

SNAP Participation rates
SNAP participation follows trends in the poverty rate and the unemployment rate
2008 national participation rates⁹
66% among all eligible participants 54% among working poor
2008 Washington participation rates⁹
80% among all eligible participants 65% among working poor
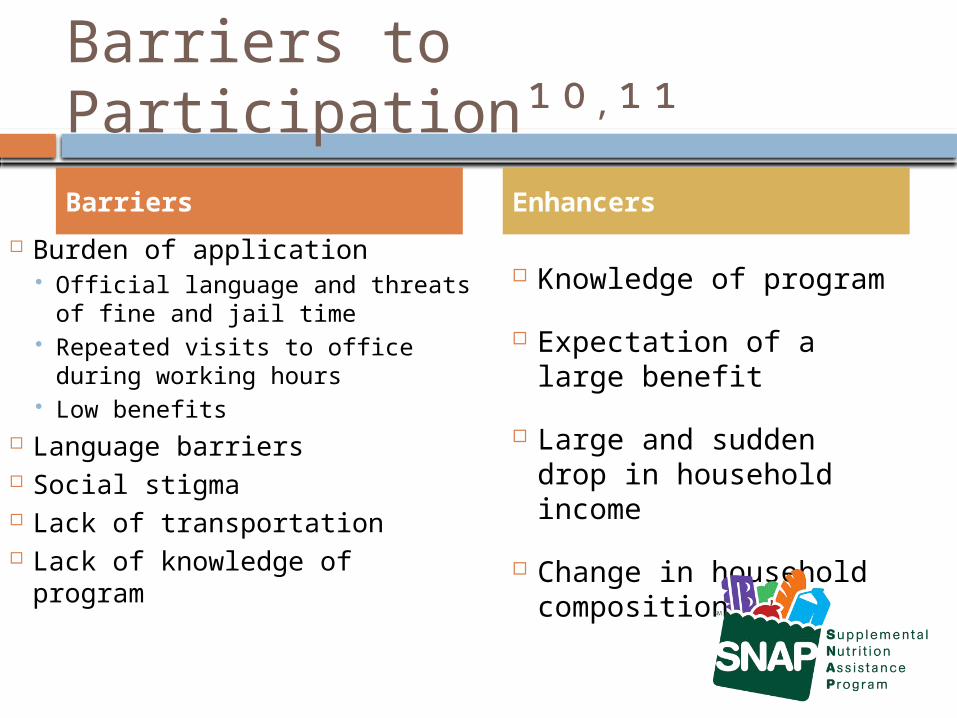
Barriers to Participation¹⁰,¹¹
Burden of application Official language and threats
of fine and jail time Repeated visits to office
during working hours Low benefits
Language barriers Social stigma Lack of transportation Lack of knowledge of
program
Knowledge of program
Expectation of a large benefit
Large and sudden drop in household income
Change in household composition
Barriers Enhancers
Recommended interventions to address food insecurity

Recommended Interventions
Increase participation in food assistance programs Streamline the application process for food
assistance programs Increase funding for school meals Support food security through policies
that strengthen infrastructure Housing, transportation, employment Social networks
Tax policies that support low income families

References
¹Position of the American Dietetic Association: Food Insecurity in the United States, 2010. Journal of the American Dietetic Association.²Food Insecurity in Households with Children, Prevalence, Severity, and Household Characteristics. ERS Report Summary, Sept 2009. USDA/ERS³Food Security in the United States. United States Department of Agriculture, Economic Research Service, The Economics of Food, Farming, Natural Resources, and Rural America.⁴Johnson, Donna. January 11, 2011. Household Food Security in the United States. Public Health Nutrition.⁵Economic Research Service, USDA. July 2008. Household Food Security Survey Module: Six item short form. ⁶S.J. Blumber; K. Bialostosky; W.L. Hamilton; R.R. Briefel. The effectiveness of a short form of the household food security scale. American Journal of Public Health. Vol 89, pp 1231-1234. 1999.
References
⁷Supplemental Nutrition Assistance Program Program Data. USDA, 02/01/2011. Web. 02/13/2011. ⁸A short history of SNAP. USDA, 04/30/2009. Web. ⁹Cunnygham, Karen E and Laura A. Castner. Reaching those in
need: State supplemental assistance program participation rates in 2008. Mathematica Policy Research. 2010; 1-8.
¹⁰Wilde, Parke and Elizabeth Dagata. Food Stamp Participation by Eligible Older Americans Remains Low. Food Review. 2002; 25-29.
¹¹Bhattarai, Gandhi Raj, Patricia A. Duffy, and Jennie Raymond. Use of Food Pantries and Food Stamps in Low-Income Households in the United States. The Journal of Consumer Affairs. 2002; (39:2) 276-298.