Why zika, malaria and ebola should fear analytics
21
SHOULD FEAR DATA ANALYTICS Presented by Real Impact Analytics WHY EBOLA & ZIKA MALARIA,
-
Upload
real-impact-analytics -
Category
Data & Analytics
-
view
179 -
download
1
Transcript of Why zika, malaria and ebola should fear analytics

SHOULD FEARDATA ANALYTICS
Presented by Real Impact Analytics
WHY EBOLA & ZIKAMALARIA,

OVERVIEW
Data Analytics can predict the spread of epidemicsWhy telecom data?How do we predict this?Example of malaria caseConclusion
Epidemics and endemic diseases are some of world’s most severe problems
ZIKA
Analytics can be used to predict thespread of epidemics
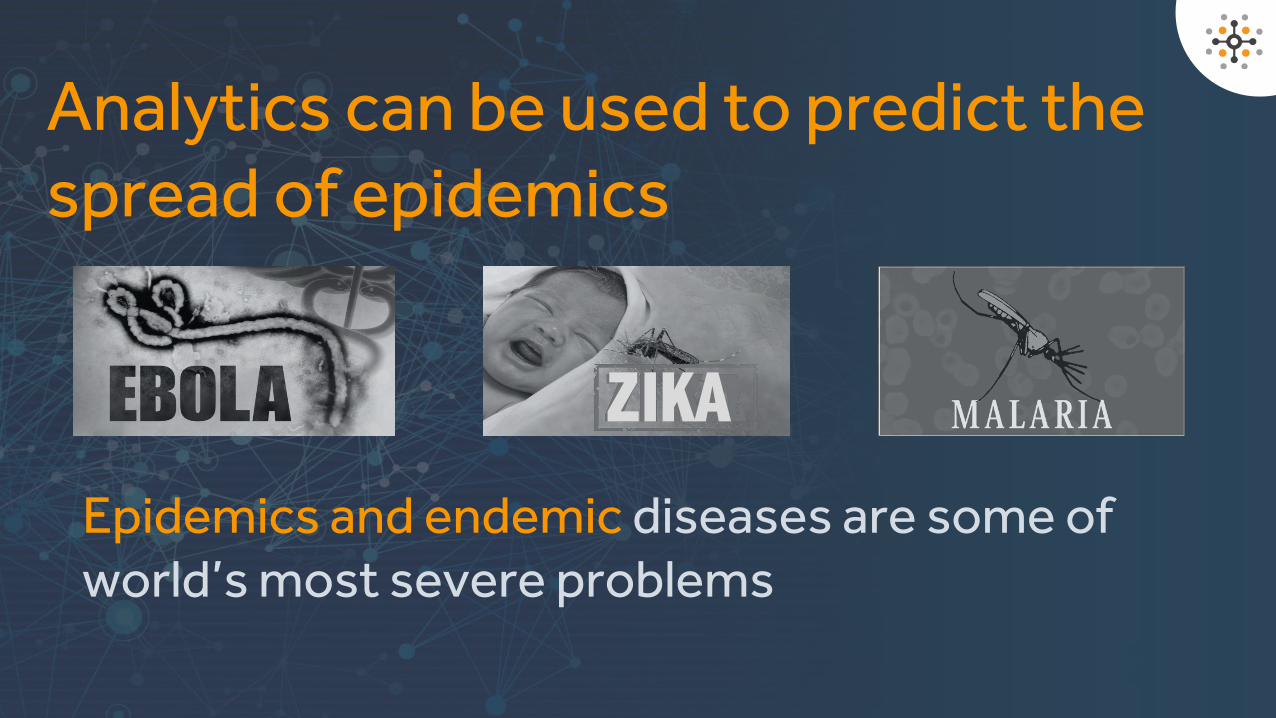
Different types of data can be leveraged to understand, measure and predict the transmission of these diseases
Analytics can be used to predict thespread of epidemics
Social Media Weather Transportation
Telecom data, thanks to its uniquefeatures, is one of the most valuabletypes of data for predictive analytics.
Analytics can be used to predict thespread of epidemics
WHYTELECOM DATA
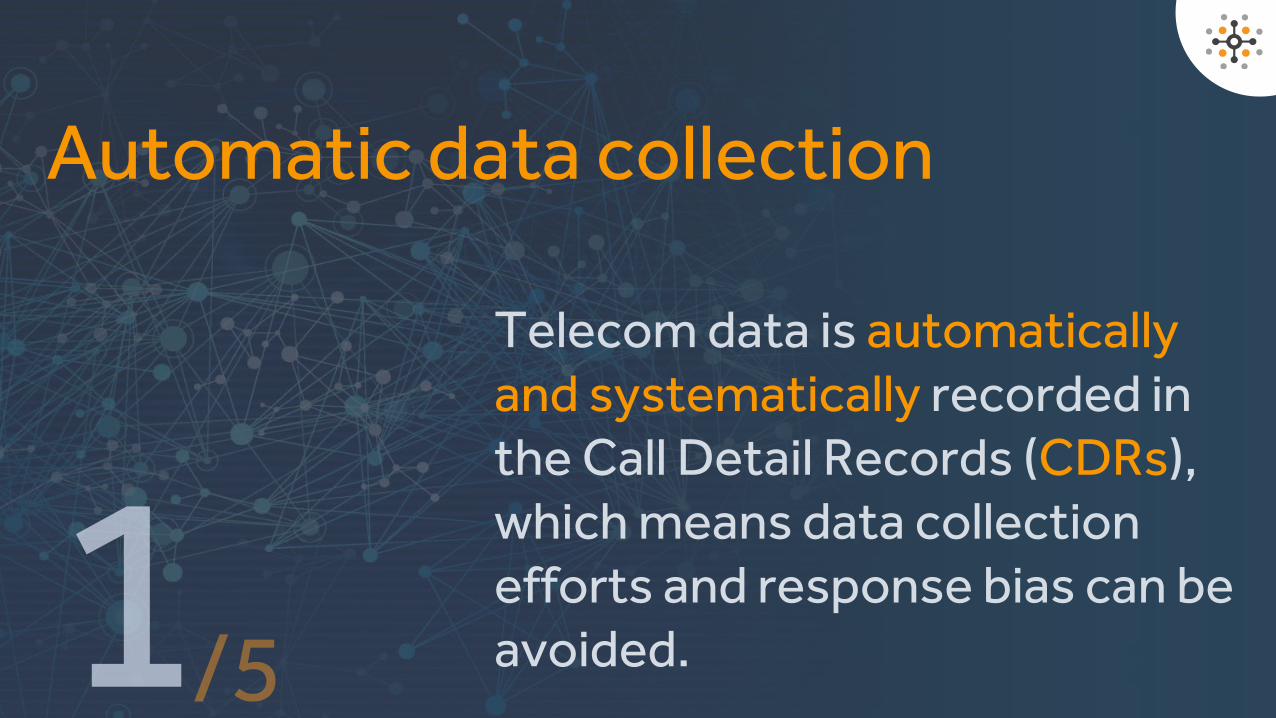
Telecom data is automaticallyand systematically recorded inthe Call Detail Records (CDRs),which means data collectionefforts and response bias can beavoided.
Automatic data collection
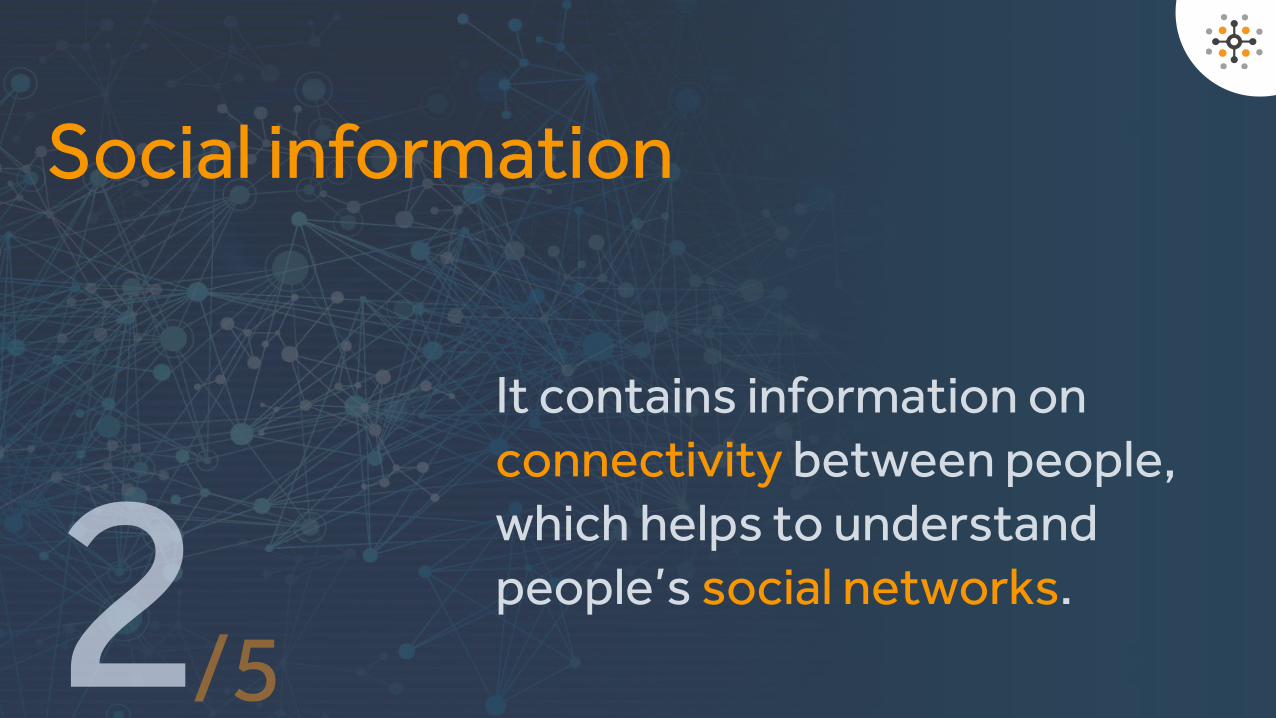
It contains information onconnectivity between people,which helps to understandpeople’s social networks.
Social information
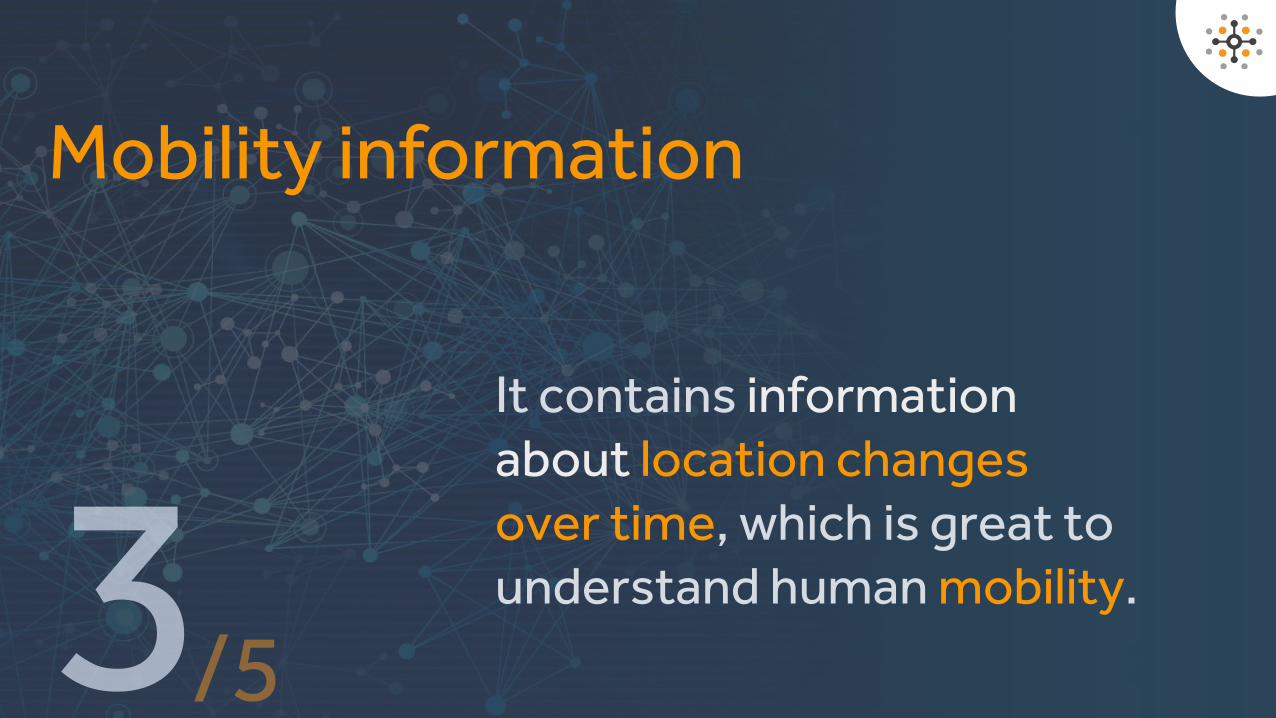
It contains informationabout location changesover time, which is great tounderstand human mobility.
Mobility information
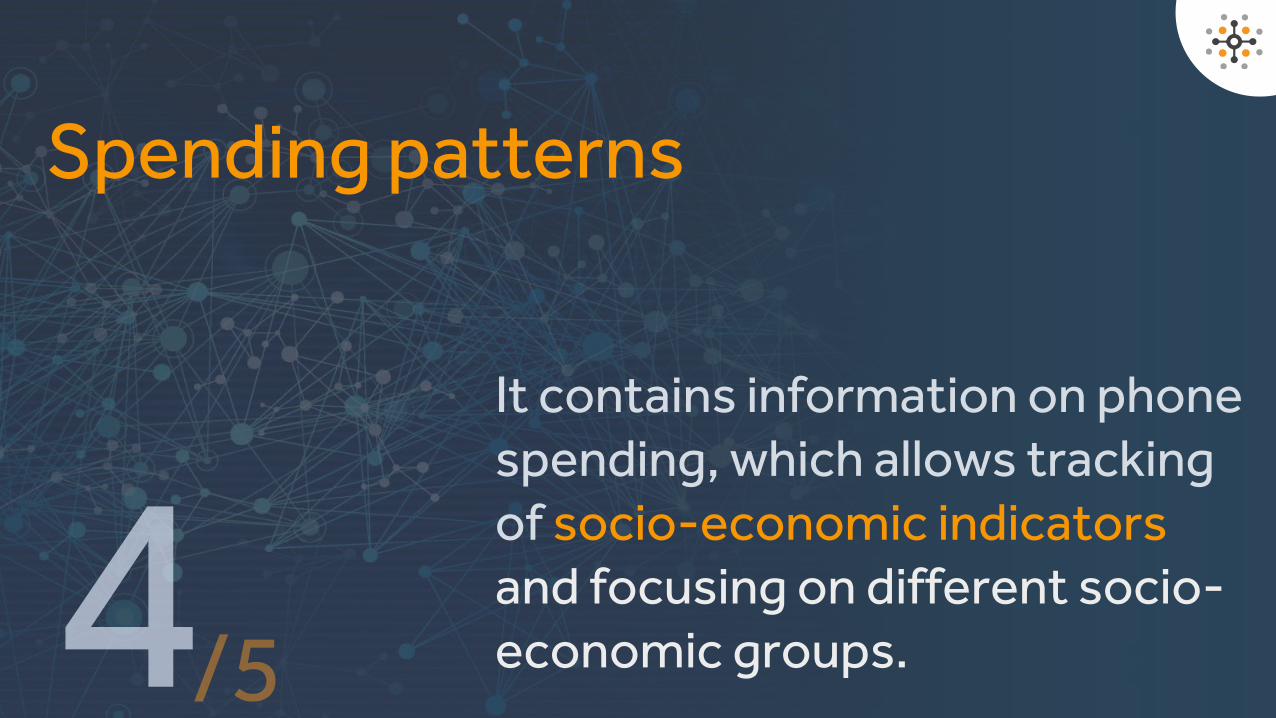
It contains information on phonespending, which allows trackingof socio-economic indicatorsand focusing on different socio-economic groups.
Spending patterns

Anonymized and aggregated mobile telecom data gives mobility insights while protecting privacy.
Confidentiality
HOWDO WE PREDICT?
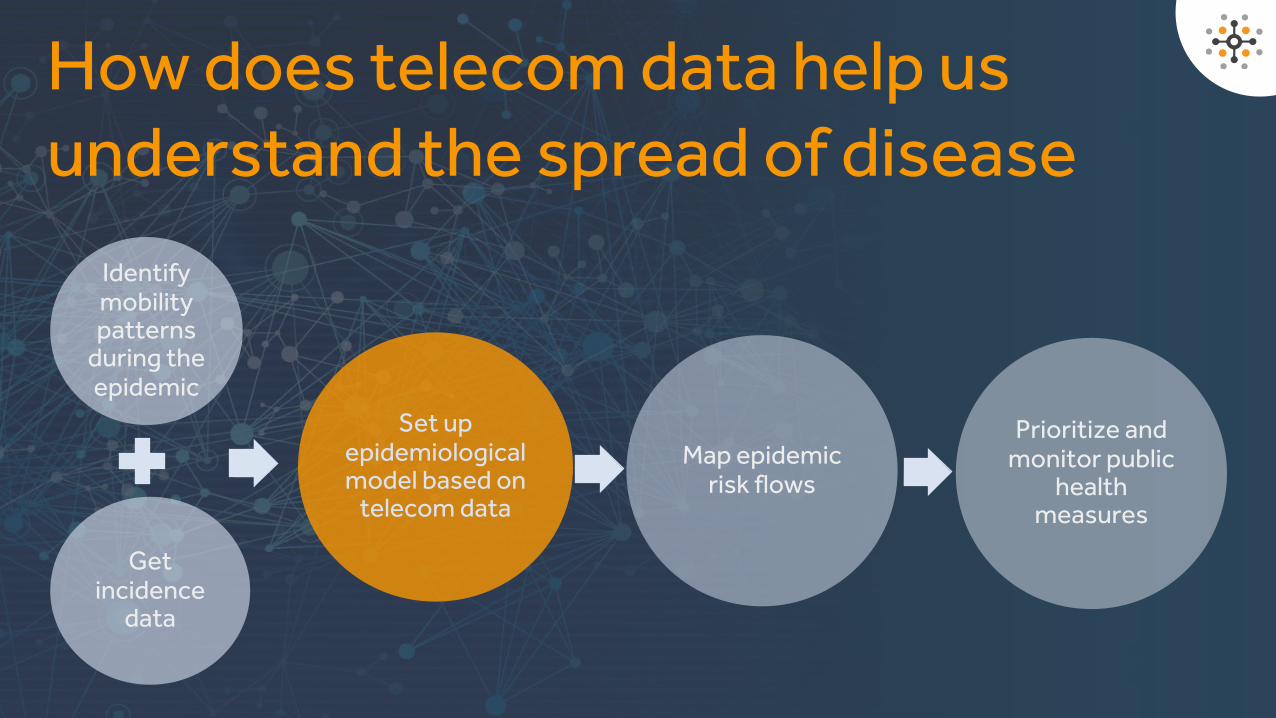
Identifymobilitypatterns
during theepidemic
Getincidence
data
Set upepidemiologicalmodel based on
telecom data
Map epidemicrisk flows
Prioritize andmonitor public
healthmeasures
How does telecom data help us understand the spread of disease
EXAMPLEMALARIA CASE
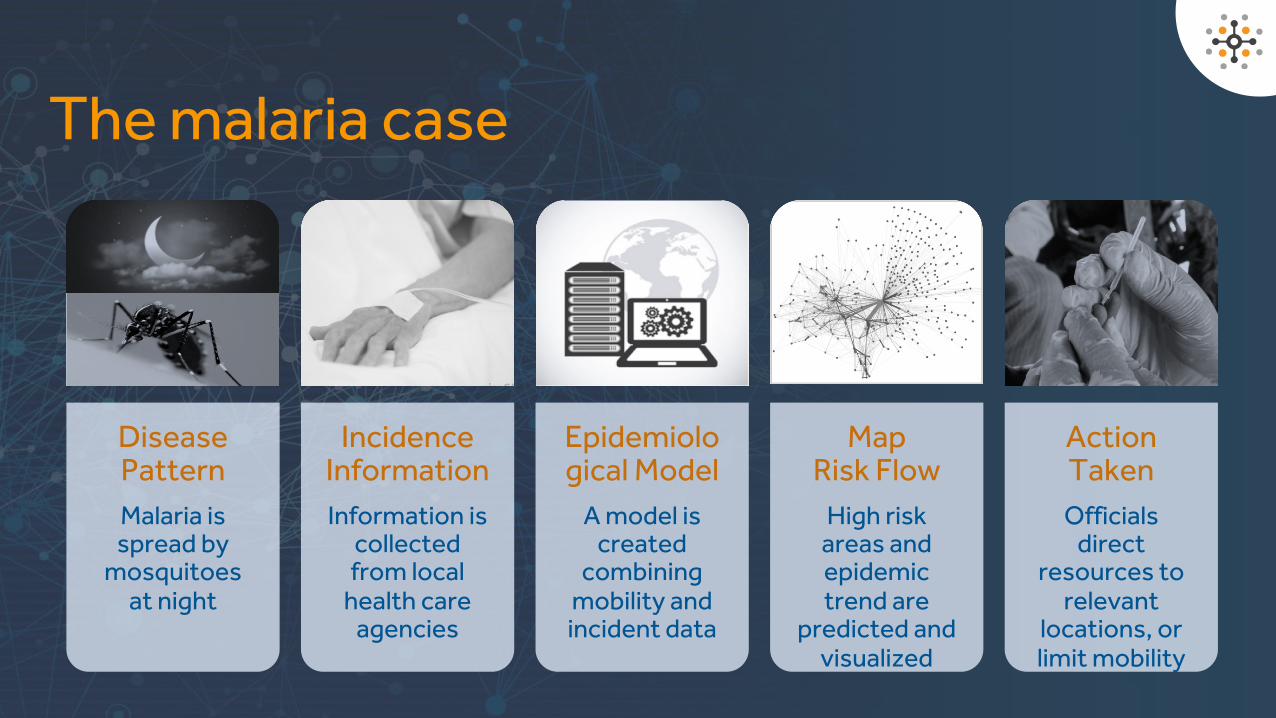
DiseasePatternMalaria isspread by
mosquitoesat night
IncidenceInformationInformation is
collectedfrom local
health careagencies
Epidemiological Model
A model is created
combiningmobility andincident data
MapRisk Flow
High riskareas andepidemictrend are
predicted andvisualized
ActionTakenOfficials
direct resources to
relevant locations, or limit mobility
The malaria case
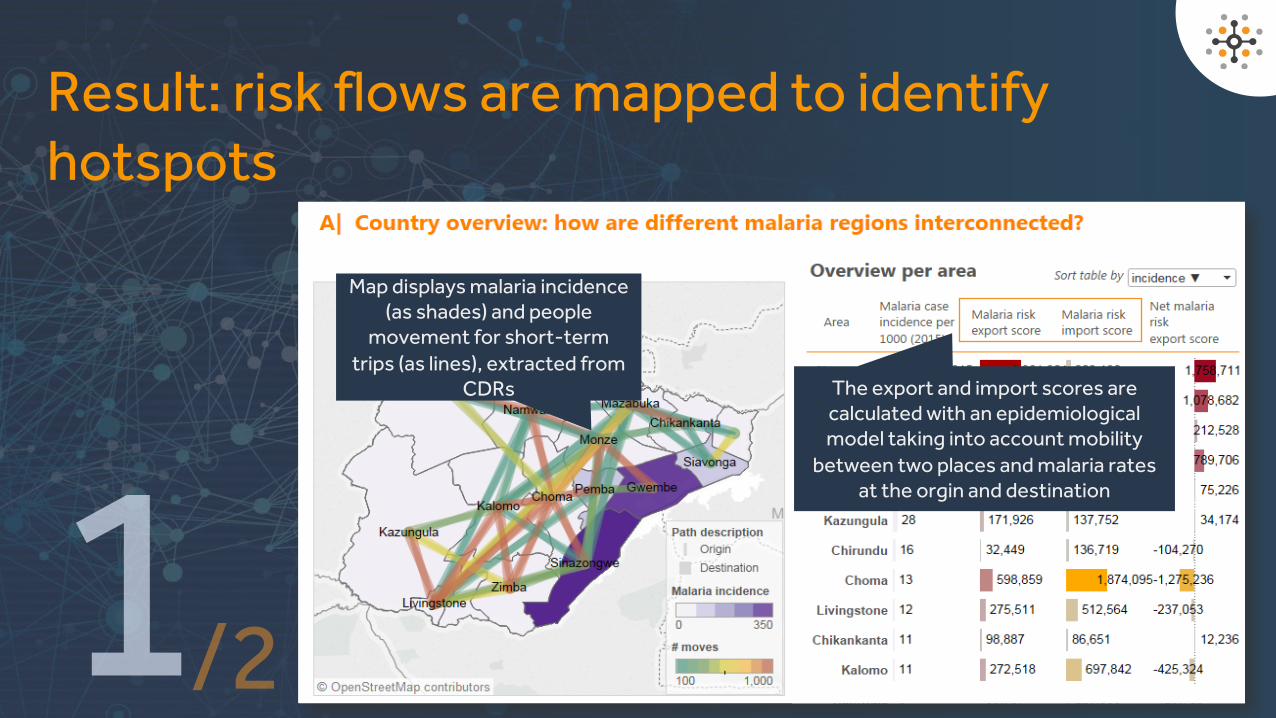
Result: risk flows are mapped to identifyhotspots
Map displays malaria incidence (as shades) and people
movement for short-term trips (as lines), extracted from
CDRs The export and import scores are calculated with an epidemiological model taking into account mobility
between two places and malaria rates at the orgin and destination
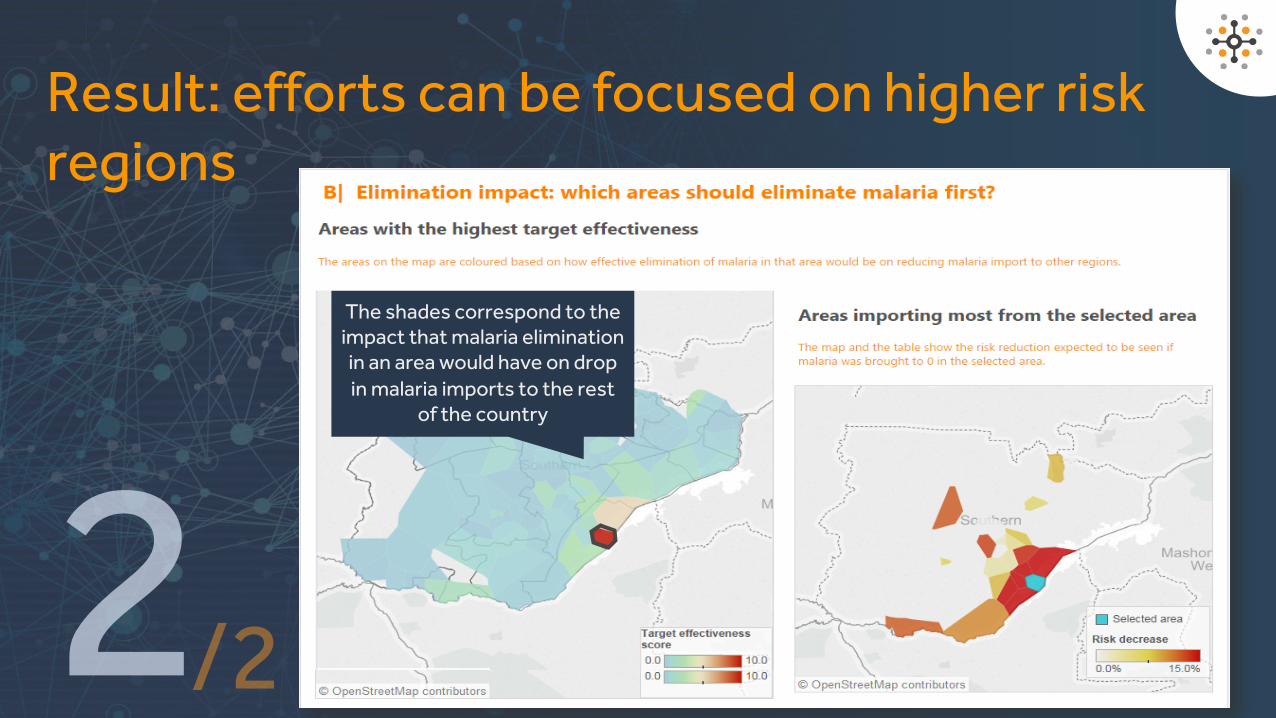
Result: efforts can be focused on higher risk regions
The shades correspond to the impact that malaria elimination in an area would have on drop in malaria imports to the rest
of the country

CONCLUSION
CONCLUSION
With anonymized telecom dataand proper data analyticsmethods, epidemic diseaseprediction can be more efficientand accurate.
QUESTIONS?#EPIDEMICRIA
@RIAnalytics
realimpactanalytics.com
@RealImpactAnalytics
Real Impact Analytics
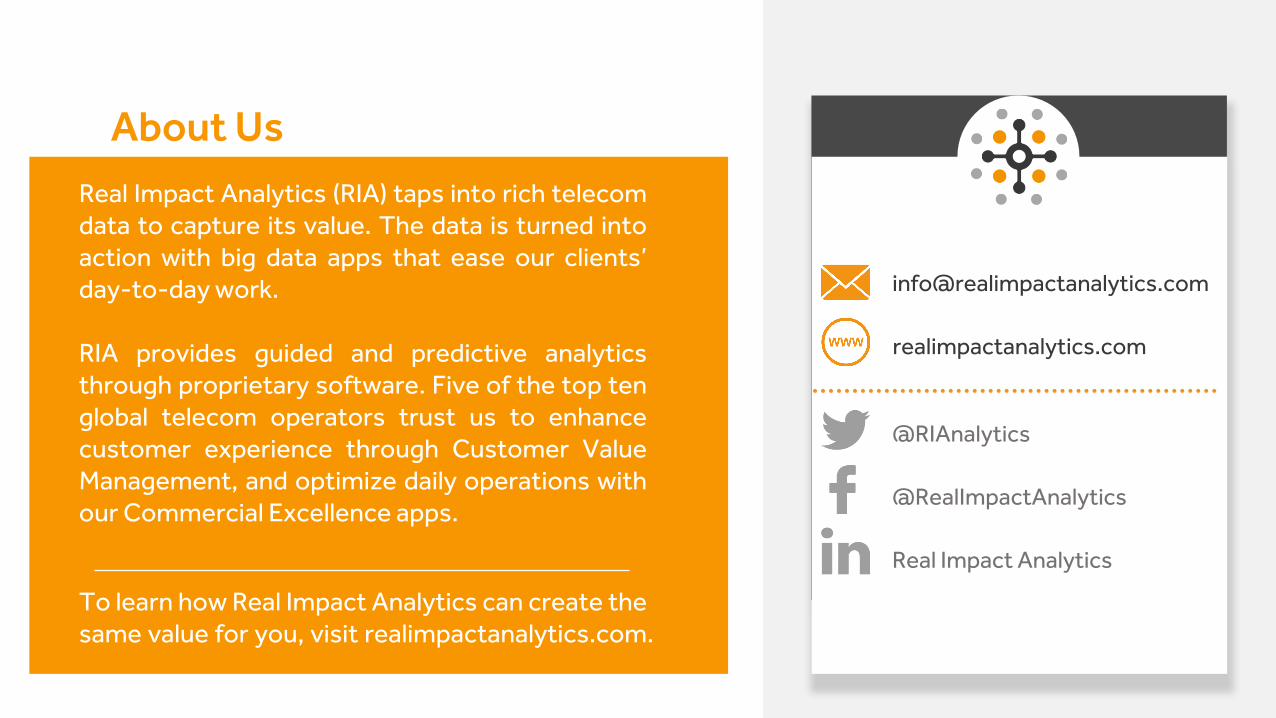
Real Impact Analytics (RIA) taps into rich telecomdata to capture its value. The data is turned intoaction with big data apps that ease our clients’day-to-day work.
RIA provides guided and predictive analyticsthrough proprietary software. Five of the top tenglobal telecom operators trust us to enhancecustomer experience through Customer ValueManagement, and optimize daily operations withour Commercial Excellence apps.
To learn how Real Impact Analytics can create thesame value for you, visit realimpactanalytics.com.
About Us