Why is the gender wage gap in Japan so large compar ed ... · PDF filedifferential between the...
38
HAL Id: halshs-00080181 https://halshs.archives-ouvertes.fr/halshs-00080181v2 Submitted on 3 Jun 2009 HAL is a multi-disciplinary open access archive for the deposit and dissemination of sci- entific research documents, whether they are pub- lished or not. The documents may come from teaching and research institutions in France or abroad, or from public or private research centers. L’archive ouverte pluridisciplinaire HAL, est destinée au dépôt et à la diffusion de documents scientifiques de niveau recherche, publiés ou non, émanant des établissements d’enseignement et de recherche français ou étrangers, des laboratoires publics ou privés. Why is the gender wage gap in Japan so large compared with France? : a comparison based on decomposition analysis Haruhiko Hori, Hiroatsu Nohara To cite this version: Haruhiko Hori, Hiroatsu Nohara. Why is the gender wage gap in Japan so large compared with France? : a comparison based on decomposition analysis. György Széll. Corporate Social Responsi- bility in the EU & Japan, Peter Lang, pp.147-171, 2006, Labour, Education & Society ; 1. <halshs- 00080181v2>
-
Upload
nguyenkhanh -
Category
Documents
-
view
213 -
download
0
Transcript of Why is the gender wage gap in Japan so large compar ed ... · PDF filedifferential between the...

HAL Id: halshs-00080181https://halshs.archives-ouvertes.fr/halshs-00080181v2
Submitted on 3 Jun 2009
HAL is a multi-disciplinary open accessarchive for the deposit and dissemination of sci-entific research documents, whether they are pub-lished or not. The documents may come fromteaching and research institutions in France orabroad, or from public or private research centers.
L’archive ouverte pluridisciplinaire HAL, estdestinée au dépôt et à la diffusion de documentsscientifiques de niveau recherche, publiés ou non,émanant des établissements d’enseignement et derecherche français ou étrangers, des laboratoirespublics ou privés.
Why is the gender wage gap in Japan so large comparedwith France? : a comparison based on decomposition
analysisHaruhiko Hori, Hiroatsu Nohara
To cite this version:Haruhiko Hori, Hiroatsu Nohara. Why is the gender wage gap in Japan so large compared withFrance? : a comparison based on decomposition analysis. György Széll. Corporate Social Responsi-bility in the EU & Japan, Peter Lang, pp.147-171, 2006, Labour, Education & Society ; 1. <halshs-00080181v2>
1
January 2005
Why is the gender wage gap in Japan so large compared with France? :
a comparison based on decomposition analysis
Haruhiko Hori* and Hiroatsu Nohara**
* Japan Institute of Labour Policy and Training, Tokyo, Japan
** Laboratory of Labour Economics and Industrial Sociology, (LEST-CNRS), Aix-
Marseille University, Aix-en-Provence, France
A chapter in Gyoergy Széll Ed. The Social Responsibility of Enterprise in Europe and Japan, Peter Lang Publisher, 2006, pp 147-182
Abstract
The aim of this paper is to compare in an empirical way the male/female wage gap
differential between the France and Japan. It is also proposed to explore the reasons why the
male/female wage gap is so large in Japan in comparison with France.
We attempt to opt for the Juhn-Murphy-Pierce decomposition method as an
analytical tool. This econometric model seemed to be the most suitable tool available for
carrying out international wage differential comparisons of this kind.
Both individual characteristics and discriminatory practices against women obviously play a
role in shaping the wage gaps between men and women. In this paper, our basic theoretical
assumption, however, is that gender differences in human capital result mainly from unequal
opportunities in training, promotion criteria, mobility, etc., rather than being a matter of
rational individual choice. In this field, public policy therefore can play an important role, not
only on the grounds of moral concern for ‘social justice’ but also in terms of the economic
efficiency and demographic vitality of society, which is true particularly for Japan.

2
Introduction
Although decreasing the gender wage gap is one of the goals set out in the OECD
recommendations and equal pay legislation1 has been introduced to ensure ‘equal pay for
equal work’ in some countries, a significant gap still exists between the hourly pay rates of
men and women in many countries. Identifying the various factors responsible for wage
differentials is crucial to be able to understand why the gender wage gap has persisted.
Finding suitable policy options is also bound to depend on the underlying reasons for the
gender wage gap.
From the beginning of the 1980s to the 2000s, a decreasing trend was however
observed in the wage gap between men and women in all the OECD countries. Despite many
differences between the labour market characteristics and the wage determination
mechanisms involved, this trend has been widely observed in all the world’s most highly
industrialized states. Nevertheless, if we look at this universal tendency in terms of the
absolute value of the male/female wage gap differentials, considerable disparities can still be
observed in this respect between some industrialised countries (Blau and Kahn 1995).
The aim of this paper is to compare in an empirical way the male/female wage gap
differential between the following two countries: France, an industrialized country where the
disparities between sexes are outstandingly small, and Japan, where they are particularly
large. It is also proposed to explore the reasons why the male/female wage gap is so large in
Japan in comparison with France.
We opted here for the Juhn-Murphy-Pierce decomposition method as an analytical
tool. This econometric model, which was developed by Juhn, Murphy and Pierce (1991) and
subsequently adapted by Blau and Kahn (1992, 1995), seemed to be the most suitable tool
available for carrying out international wage differential comparisons of this kind. The main
advantage of this method is that it brings to light the effects of visible human capital factors
1 The first recommendations on these lines were issued by EU in the early1980s, and the law on ‘equal opportunity between women and men’ was adopted in Japan in 1986.

3
such as age, years of service, academic background and other statistically measurable factors
which affect wage-earning capacities, while at the same time serving to analyze the impact of
factors which cannot be defined in statistical terms, such as discriminatory practices against
women at the workplace.
From the theoretical point of view, there has been much controversy between supply-
side and demand-side theories on this topic. In fact, much of the debate on the gender wage
gap has centred on the extent to which women’s lower earnings reflect lower levels of
productivity or human capital such as education, training, work commitment, or whether they
may be due to discriminatory practices such as unequal access to jobs and promotion and the
downgrading of women’s skills. From the human capital perspective, it has been argued that
women’s current or future involvement in family duties means that they will invest less in
improving their skills and tend to work part-time or intermittently and thus fail to accumulate
similar levels of occupational experience and job tenure to those achieved by men. One key
point in human capital theory (Becker 1985, Mincer and Polachek 1974, Polachek 1981) is
the idea that these female attitudes are based on rational individual decisions and that any
resulting wage inequalities are therefore not proper policy issues.
The proponents of demand-side theories (labour market segmentation theory, labour
queue theory etc.) look for the sources of gender wage gaps in the discrimination embedded
in institutional structures (educational systems, family strategies, government policies, labour
management practices), which is reproduced via the social decisions/attitudes of the actors
(employers, trade unions, families etc.) on the labour market. Both direct and indirect forms
of discrimination are viewed on these lines as the main factors denying women equal access
to jobs, training and promotion opportunities, thus leading to unequal pay. It is also argued
that differences in pay between occupations result not only from differences in the
productivity and skills of workers or in the demands of the job, but also from the market
position, the respective bargaining powers of diverse social groups and traditional patterns of

4
pay management between jobs. Variations of this type can be decisive on a labour market
where men and women tend to be concentrated in different sectors, occupations or
establishments.
Both individual characteristics (human capital factors) and discriminatory practices
against women obviously play a role in shaping the wage gaps between men and women. In
this paper, our basic theoretical assumption, however, is that gender differences in human
capital result mainly from unequal opportunities in training, promotion criteria, mobility, etc.,
rather than being a matter of rational individual choice. In this field, public policy therefore
can play an important role, not only on the grounds of moral concern for ‘social justice’ but
also in terms of the economic efficiency and demographic vitality of society.
This paper has been designed as follows. In section 1, we begin by comparing the
general features of labour markets in Japan and France. When it comes to the gender wage
gaps, it is necessary to take the general structure of wages and the way the labour markets
function in each country into account. Based on this comparative description, we will then
propose some hypotheses, which will subsequently be tested. In section 2, the econometric
method used here, the Juhn-Murphy-Pierce decomposition method, will be presented in
detail. In section 3, concrete analysis will be carried out on individual micro data collected in
Japan and France. Decomposion analysis is carried out in order to identify the types of
factors mainly responsible for the the gender wage gap differentials between the two
countries. Factor decomposition analysis focusing on full-time workers provides the first
model. In the second model, occasional part-time workers are introduced into the model. We
will then carry out a specific analysis on the male/female wage gap differential between
France and Japan in three age groups corresponding to the various phases in the female life
cycle. We shall conclude by summarising the most significant results obtained and
attempting to deduce some positive policy implications.

5
I-I-I-I-‘Internal labour market’ and forms of hierarchy in France and Japan
As stated above, the gender wage gap has been narrowing in Japan during the past
decade (Hori 1998). Yet the speed of this movement seems to be rather slow in comparison
with many other advanced countries, such as the Scandinavian countries. Consequently, the
male/female wage gap in Japan is still very large in statistically non-adjusted terms.
The average female wage in Japan amounts to only 58% of the average male wage
(on the basis of regular full time workers), while this figure reaches about 75% in France by
the mid-1990’s.
There obviously exist many economic, social and cultural factors contributing to the
large wage gap occurring in the case of Japan. The aim of the present analysis is to
distinguish some observable and non-observable factors, focusing mainly on labour
management practices and policy at the firm level. In a way, France is viewed here as a
reference country with which the Japanese practices are compared.
(1) Construction of hierarchies in Japan and France
From the viewpoint of traditional labour market issues, both Japan and France are
generally regarded as typical countries having developed a strong, highly organised ‘internal
labour market’ (Doeringer and Piore 1971). Needless to say, the labour market in Japan is
reputed for its ‘long-term employment system’ where employees spend a large part of their
career working for a single company or a single industrial group. In France too, many large
companies set up a typically French internal labour market, providing their workers with in-
house training, internal promotion opportunities and a seniority-based wage system. The
overall features of these ‘organised labour markets’ in France and Japan therefore look quite
similar, at least in terms of their incentive systems.
However, although France and Japan have basically similar labour institutions based
on the ‘internal labour market’, it should be pointed out that the structure of the internal
labour markets differs greatly between these two countries. In particular, the way in which
6
hierarchies are set up or embedded in the internal labour market seems to differ considerably.
This is an extremely important point, as far as the gender wage gap is concerned.
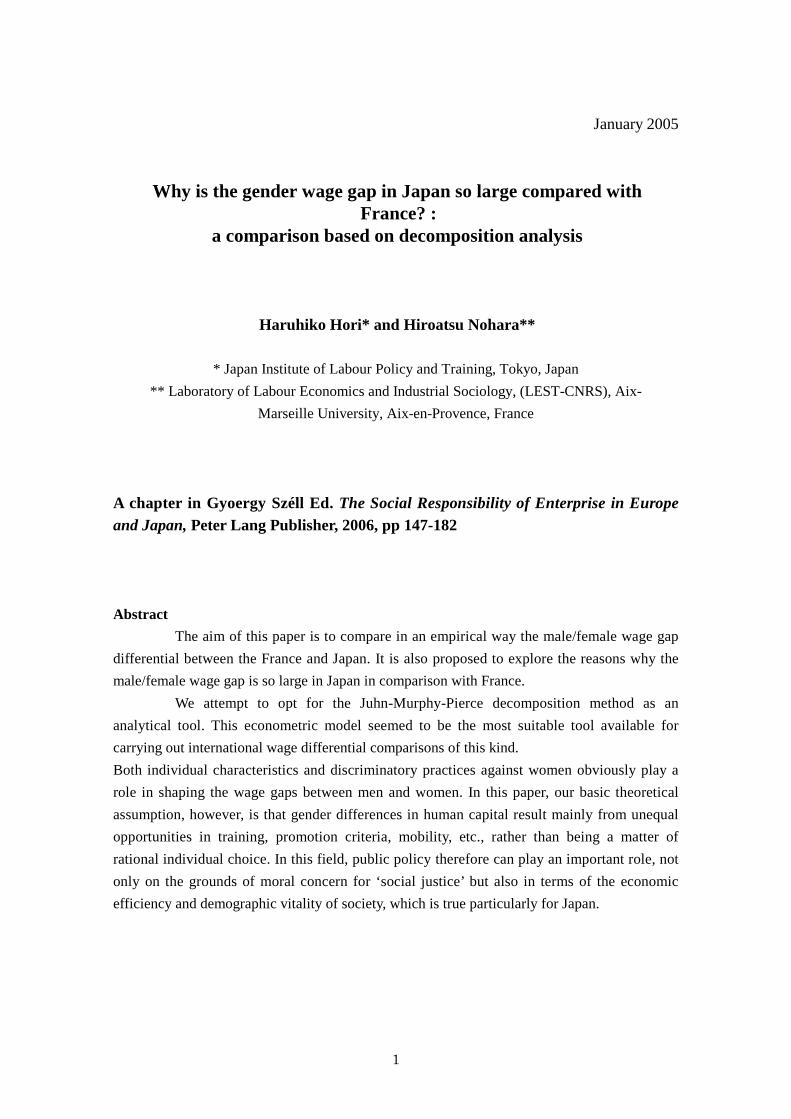
Some evidence has been obtained in comparative studies (Nohara 1998, Nohara
2000) that allocation of positions, career paths, mobility chains and wage systems are set up
in a quite differently at Japanese and French firms.
Figure I Types of the Internal Labour Market: Japanese Type and French Type
Figure I sums up the most distinctive features of the Japanese-type and French-type
hierarchies.
In the French case, there is a strict correspondence between diploma levels (formal
qualifications), occupational categories and ports of entry into the internal labour market.
Qualified blue-collar workers generally have CAP certificates. Non-skilled workers have no
formal diplomas. The intermediate level technicians and clerks have a Baccalaureate,
sometimes followed by 2 years’ schooling in the further education system. The ‘cadres’ or
managers –the top management category– have graduated from Grandes Ecoles (the elite
J A P A N FR A N C E
T o p M a n a g e m e n t
« In -h o u s e »
m a n a g e r
( c a d re )
W h ite -c o lla r
w o rk e r
F o re m a n
B lu e -c o lla r w o rk e r
B a c
B a c + 6B a c + 4B a c + 2
B o d y o f S ta te
te c h n o cra ts
T o p
M a n a g e m e n t
M a n a g e m e n tG ra d u a te
e n g in e e r
« in -h o u s e »
m a n a g e r
C e rt if ie d
te c h n ic ia n« in -h o u s e »
te c h n ic ia n
S k ille d w o rk e r
N o n -s k il le d w o rk e r
B a c + 5(u n ive rs ity o r
e n g in e e r in g s ch o o l)
B a c + 2
V o c a tio n a lB a c
C A P (ce r ti f ic a tio n
o f m a n u a l s k il l)
F o re m a n
w ith o u t d ip lo m a
M id d le
M a n a g e m e n t
S o u rc e :H . N o h a ra (1 9 9 5 ) , L E S T -C N R S
N o te : T h e le v e l o f e d u c a t io n c o r re sp o n d s to th e n u mb e r o f y e a rs o fs c h o o l in g a f te r th e b a c c a la u ré a t ( h ig h sc h o o l g ra d u a te ) .
7
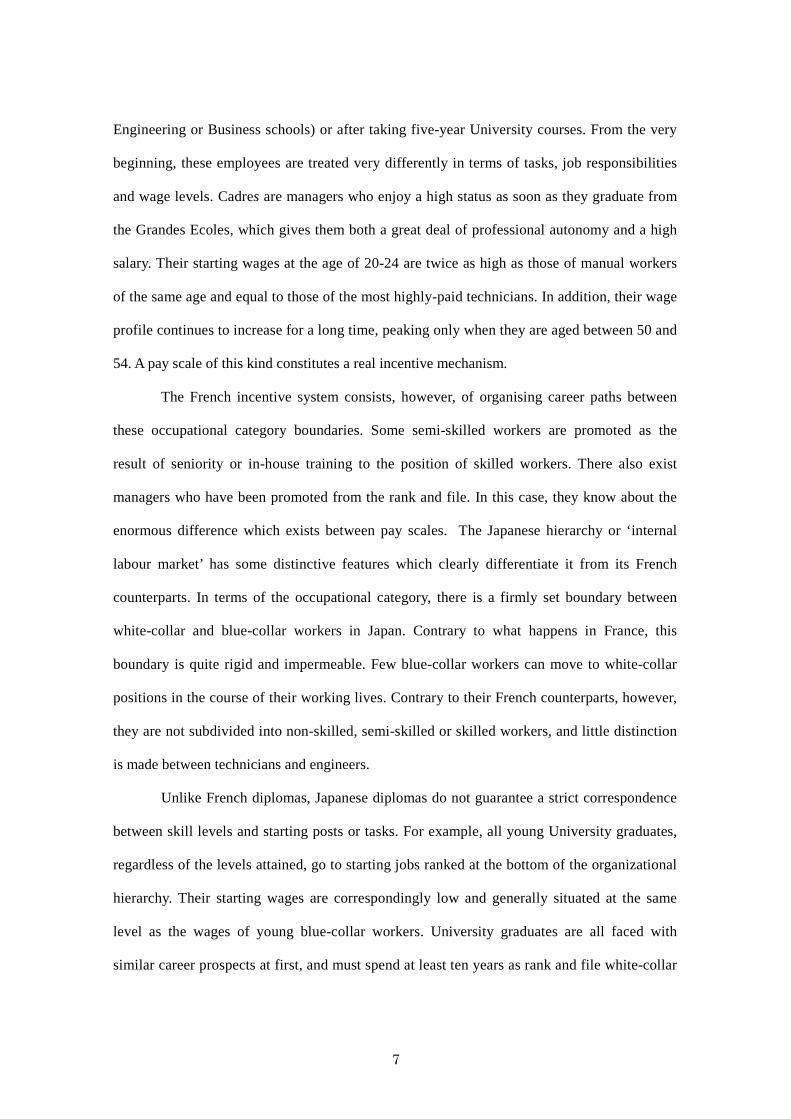
Engineering or Business schools) or after taking five-year University courses. From the very
beginning, these employees are treated very differently in terms of tasks, job responsibilities
and wage levels. Cadres are managers who enjoy a high status as soon as they graduate from
the Grandes Ecoles, which gives them both a great deal of professional autonomy and a high
salary. Their starting wages at the age of 20-24 are twice as high as those of manual workers
of the same age and equal to those of the most highly-paid technicians. In addition, their wage
profile continues to increase for a long time, peaking only when they are aged between 50 and
54. A pay scale of this kind constitutes a real incentive mechanism.
The French incentive system consists, however, of organising career paths between
these occupational category boundaries. Some semi-skilled workers are promoted as the
result of seniority or in-house training to the position of skilled workers. There also exist
managers who have been promoted from the rank and file. In this case, they know about the
enormous difference which exists between pay scales. The Japanese hierarchy or ‘internal
labour market’ has some distinctive features which clearly differentiate it from its French
counterparts. In terms of the occupational category, there is a firmly set boundary between
white-collar and blue-collar workers in Japan. Contrary to what happens in France, this
boundary is quite rigid and impermeable. Few blue-collar workers can move to white-collar
positions in the course of their working lives. Contrary to their French counterparts, however,
they are not subdivided into non-skilled, semi-skilled or skilled workers, and little distinction
is made between technicians and engineers.
Unlike French diplomas, Japanese diplomas do not guarantee a strict correspondence
between skill levels and starting posts or tasks. For example, all young University graduates,
regardless of the levels attained, go to starting jobs ranked at the bottom of the organizational
hierarchy. Their starting wages are correspondingly low and generally situated at the same
level as the wages of young blue-collar workers. University graduates are all faced with
similar career prospects at first, and must spend at least ten years as rank and file white-collar

8
workers until reaching their first managerial posts, contrary to what happens in France, where
the various occupational categories each have their own wage scale and profile, all categories
of employees in Japan are entitled to the same pay system and are often covered by a
collective agreement based on a single-status clause.
Japanese University graduates’ salaries therefore start at the lowest level available on the
whole labour market. This dissociation between formal qualifications and pay, which is specific to
Japan, runs counter to the teachings of the ‘signalling’ and ‘adverse selection’ theories (Spence
1972). In addition, these employees’ pay levels are always lower than those of experienced
manual workers until they are about 35 years of age. This slow rate of progress up the pay scale,
which from a European point of view seems to offer little by way of incentive, is accepted by
young graduates although they are aware that it does not always encourage risk-taking or
creativity. Nevertheless, the wage profile for non-manual workers does eventually diverge from
that for manual workers. From the age of 35-40 onwards, it begins to accelerate, eventually
reaching a peak that corresponds to more than twice the pay of manual workers. As a result,
managers at the end of their careers acquire professional recognition and legitimation thanks to
the hierarchical ascension they have achieved.
(2) Formulation of hypotheses
These differences in the way in which the hierarchy is constructed seem to have a
great impact on the formation of the gender wage gap in each country. Based on these
distinctive features, some working hypothesis can be formulated, which will be subsequently
tested using the econometric method selected.
i) The long career path to the Japanese manager’s position is not favourable to women,
since many young women quit their jobs after working for ten to twenty years to get married,
and especially to have children. Many women’s careers are therefore restricted to the poorly
paid initial period, and they tend to lose the opportunity of being promoted to higher
managerial positions.

9
ii) In the case of France, the correspondence between diplomas and jobs, which
corresponds to the social standardization of skills, tends to result in relatively equal wages
between female and male workers, while at the same time facilitating the mobility between
enterprises of both sexes.
iii) Active national intervention policies in favour of childcare enable French women to
continue working, although they often make a few breaks because of family events. Japanese
women are not yet sufficiently supported by the State, although options such as ‘parental
leave’ etc. are beginning to become available. Social facilities supporting female workers by
creating conditions enabling them to continue their careers at firms and sustaining female
wages - which depend on seniority - are available in France, but not in Japan.
iv) Gaining access for the first time to the internal labour market (school to work
transition) tends to be more difficult for young workers in France than in Japan, except for the
young people with the highest diplomas, such as engineers. Japanese companies seem to be
more open to young workers, regardless of gender. During the first period of working life, the
gender variable seems to play a less important role in Japan than in France. In other words,
the male/female wage gap might be less pronounced during this period in Japan than in
France.
v) The internal labour market in Japan is closed to middle aged people. Generally,
Japanese workers who leave their jobs in mid-career have little chance of finding another job
of the same kind. They tend to be geared towards the secondary labour market. Most Japanese
women also return to the labour market after the childcare period, but they are forced to take
flexible, short-term jobs on the secondary labour market, particularly in the service sectors. In
France, married women are faced with a similar situation, but their disadvantages are
somewhat attenuated by French State intervention, the high minimum wage levels and the
social standardization of occupational/educational certification.

10
II-II-II-II-Analytical decomposition of factors responsible for the male/female wage
gap differential between Japan and France
(1) Formulation of a model
In this section, we will look at the reasons why the male/female wage gap differential
between Japan and France reaches such a high level. In the first place, we give the following
equation based on the approach developed by Juhn, Murphy and Pierce (1991).
Wage equations for males and females can be defined respectively as follows:
lnWm =Xmβm+Vm ・・・(1)
lnWf =X fβf+V f ・・・(2)
where W denotes the hourly wage, X stands for explanatory variables affecting wages
such as age, years of tenure with the current employer, and educational background. β is a
coefficient vector. V is an error term having mean value 0 and variance σ. Subscripts m and f
stand for male and female, respectively.
The error term can be redefined as follows, using male coefficients βm:
Um=lnWm-Xmβm=Vm ・・・(3)
Uf=lnWf-X fβm
=X fβf+V f-X fβm
=X f(βf-βm)+V f ・・・(4)
If we take D to denote the male/female wage gap expressed as a mean value in a
single country, the following decomposition can be performed.
_____ ____
D=lnWm-lnWf
____ ____ ___
=(Xm-X f)βm+X f(βm-βf)
__
=ΔXβm-Uf ・・・(5)

11
Where
__ __ __
ΔX=Xm-X f
Next, to compare the male/female wage gaps between Japan and France, the
following equation can be written, where J stands for Japan, F for France, and DJ and DF the
male-to-female wage gap in each country.
__ __ __
DJ-DF=(ΔXJ-ΔXF) βmJ+ΔXF(βmJ-βmF)
__ __
-(UfJ-UfF) ・・・(6)
The first term of the right member is a part of the total wage gap differential that is
affected by the difference in the women's positions between Japan and France. In other words,
it is the gap resulting from statistically observable variables responsible for differences in
employment conditions, such as disparities in the age, years of service with the current
employer, educational background, opportunities for employment in high wage industries and
so on. For example, if the mean value of Japanese women's years of job experience is far
smaller than that of French women ceteris paribus, that point will be an important factor
accounting for the male/female wage gap differential between Japan and France. The first
term of the right member is called the ‘observed X's effect’.
In those cases where there are no male/female disparities in the rates of return to age,
education and years of services with the current employer, or in the wage premium on
industry and firm size in a country, the second term will be a part affecting the male/female
wage gap differential between Japan and France as the result of the difference in the pattern of
supply and demand between the two countries. This part is based on the gaps in the
statistically observable rates of return to age, years of education and years of tenure and in the
wage premium on industries and firm size between these two countries. It is generally known
as the ‘observed-prices effect’.
12
The third term is a part based on the gap in the remainders that cannot be explained in
terms of the above-mentioned factors. It is based on the gaps in ‘unobserved variables’
between Japan and France (for example, sex-related differences in job type or training in the
firm) that cannot be accounted for by means of above-mentioned factors.
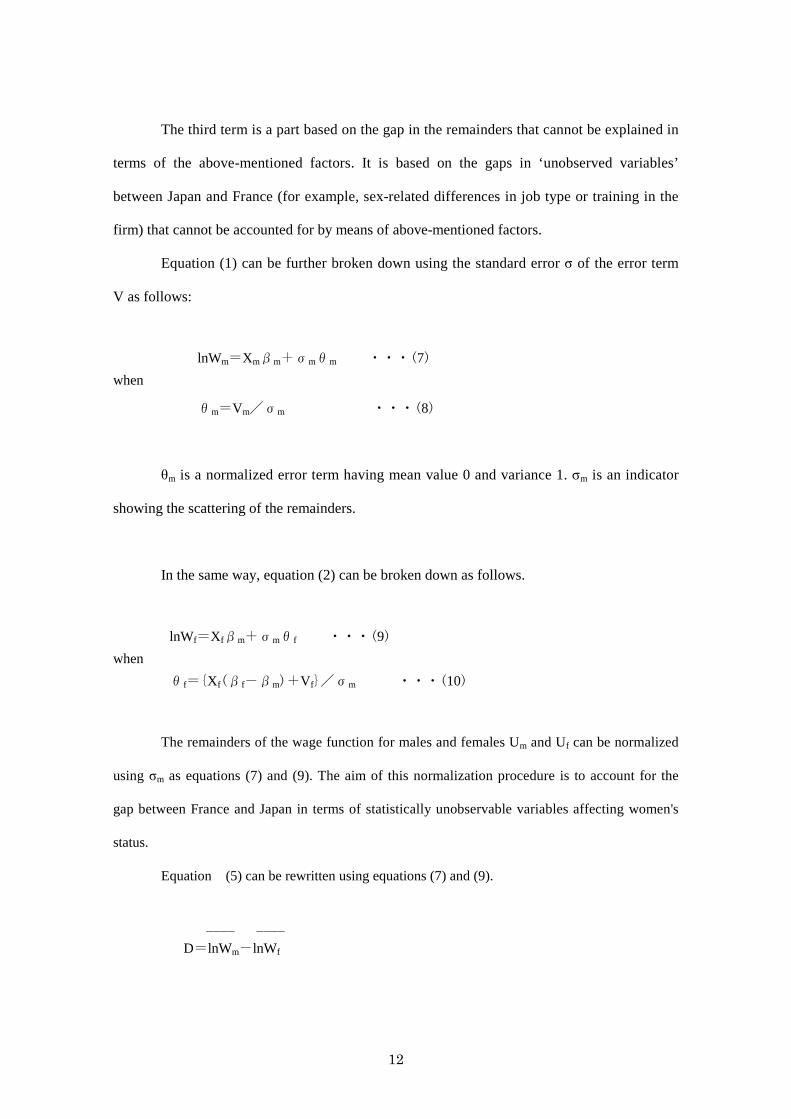
Equation (1) can be further broken down using the standard error σ of the error term
V as follows:
lnWm=Xmβm+σmθm ・・・(7)
when
θm=Vm/σm ・・・(8)
θm is a normalized error term having mean value 0 and variance 1. σm is an indicator
showing the scattering of the remainders.
In the same way, equation (2) can be broken down as follows.
lnWf=X fβm+σmθf ・・・(9)
when
θf={X f(βf-βm)+V f}/σm ・・・(10)
The remainders of the wage function for males and females Um and Uf can be normalized
using σm as equations (7) and (9). The aim of this normalization procedure is to account for the
gap between France and Japan in terms of statistically unobservable variables affecting women's
status.
Equation (5) can be rewritten using equations (7) and (9).
____ ____
D=lnWm-lnWf

13
__ __ __ __
=(Xm-X f)βm+σm(θm-θf)
__ __
=ΔXβm+σmΔθ ・・・(11)
when
__ __ __
Δθ=(θm-θf) ・・・(12)
Based on equation (11), we can rewrite equation (6) giving the male/female wage gap
differentials between Japan and France in terms of mean value(s).
__ __ __
DJ-DF=(∆XJ-∆XF)βmJ+∆XF(βmJ-βmF)
__ __ __
+(∆θJ-∆θF)σmJ+∆θF(σmJ-σmF) ・・・(13)
As explained above, the first and the second terms of the right member are the
‘observed-X's effect’ and ‘observed-prices effect’ respectively.
The third term is called the ‘gap effect’. It gives the gap between Japan and France in
statistically unobservable factors affecting women's status.
Each error term V in the wage function for males and females in both countries is
normalized using a standard error σ. For men in both countries, the normalized error terms θ
have a common framework with mean value 0 and variance 1. In other words, in the case of
men, there are no differences in distribution between the two countries. The normal
distribution in the figure shows the distribution of statistically unobservable factors affecting
men's status common to both countries.
On the other hand, in the case of women, by standardizing the error terms in the wage
function using the men's standard error σm, unobserved variables affecting women's status in
terms of the mean value can be displayed on the men's distribution of error terms. In addition,
since the men’s distribution of error terms is common to both countries, it is possible to
14
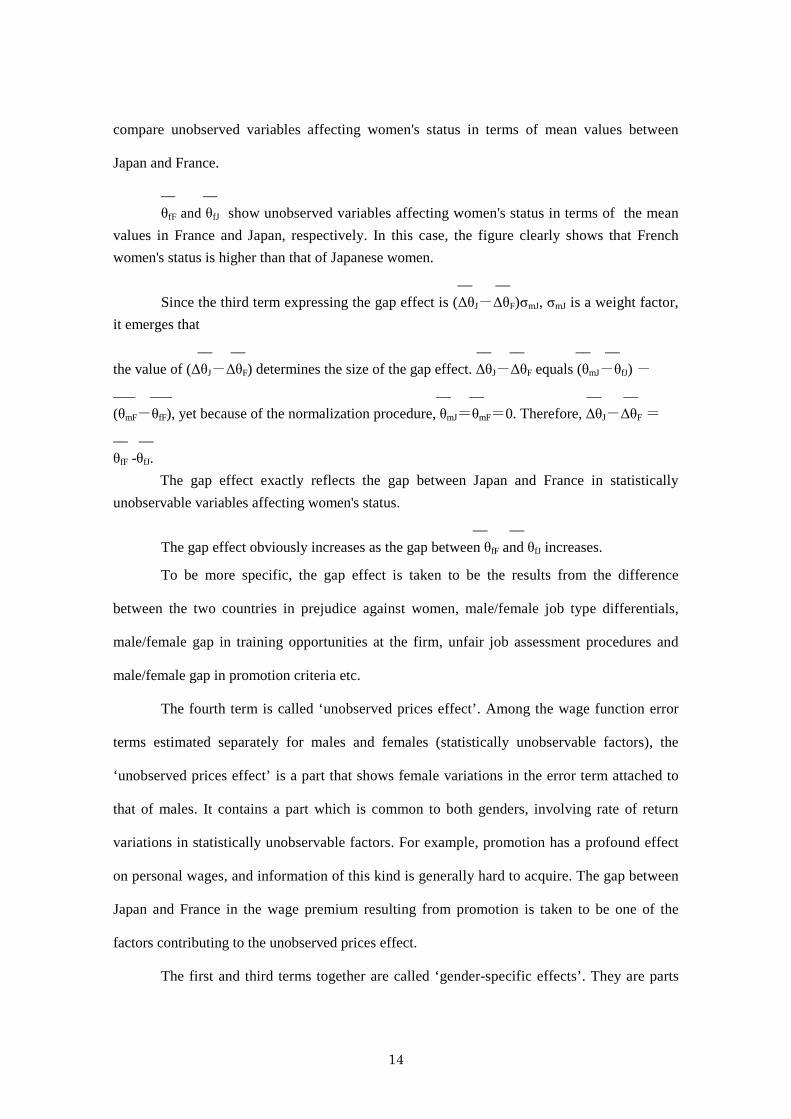
compare unobserved variables affecting women's status in terms of mean values between
Japan and France.
__ __
θfF and θfJ show unobserved variables affecting women's status in terms of the mean
values in France and Japan, respectively. In this case, the figure clearly shows that French
women's status is higher than that of Japanese women.
__ __
Since the third term expressing the gap effect is (∆θJ-∆θF)σmJ, σmJ is a weight factor,
it emerges that
__ __ __ __ __ __
the value of (∆θJ-∆θF) determines the size of the gap effect. ∆θJ-∆θF equals (θmJ-θfJ) -
___ ___ __ __ __ __
(θmF-θfF), yet because of the normalization procedure, θmJ=θmF=0. Therefore, ∆θJ-∆θF =
__ __
θfF -θfJ.
The gap effect exactly reflects the gap between Japan and France in statistically
unobservable variables affecting women's status.
__ __
The gap effect obviously increases as the gap between θfF and θfJ increases.
To be more specific, the gap effect is taken to be the results from the difference
between the two countries in prejudice against women, male/female job type differentials,
male/female gap in training opportunities at the firm, unfair job assessment procedures and
male/female gap in promotion criteria etc.
The fourth term is called ‘unobserved prices effect’. Among the wage function error
terms estimated separately for males and females (statistically unobservable factors), the
‘unobserved prices effect’ is a part that shows female variations in the error term attached to
that of males. It contains a part which is common to both genders, involving rate of return
variations in statistically unobservable factors. For example, promotion has a profound effect
on personal wages, and information of this kind is generally hard to acquire. The gap between
Japan and France in the wage premium resulting from promotion is taken to be one of the
factors contributing to the unobserved prices effect.
The first and third terms together are called ‘gender-specific effects’. They are parts

15
resulting from the gap between Japan and France in women's relative overall status, as given
by both statistically observable and unobservable factors. Likewise, the second and fourth
terms together are called ‘wage-structure effects’. They are parts that can be explained by the
gap between Japan and France in the statistically observable and unobservable rates of return.
(2) Nature of data and wage function
a) Explanation of data and technical adjustments
i) Data sources
The Japanese data referred to here originate from the ‘basic survey on wage structure’
collected by the Japanese Ministry of Labour (the present Ministry of Health, Labour and
Welfare) in 1994. This is a large-scale annual survey, in which a large body of information is
collected about the earnings and the characteristics of establishments and individual workers.
The sample size is 1,319,726 persons. The establishments surveyed in both countries are all
those with five or more employees, although French survey includes the category of
establishments having only one or more employees.
The Japanese survey contains information about monthly earnings for the month of
June (before taxes), the amount of extra income including bonuses and end-of-term
allowances paid in the previous year (1993), the total number of working hours completed
during the month of June, the educational background of the employees, and the number of
years of tenure, for example. It also contains some information about the number of regular
employees hired by firms and establishments2, industrial sectors, regions and so on. The
survey also provides information about the employees' occupations, but it tends to focus
mainly on the blue-collar occupations. The basic population covered by this survey consisted
of all establishments with 5 or more employees in nine of the main industrial branches. The
2 ‘Full-time workers’ refers to (1) workers hired for indefinite periods of time; (2) workers hired for set periods of time exceeding one month; and (3) workers hired for set periods of time within one month or workers hired on a day-to-day basis. In each of these cases, the workers were hired by the companies for a period of 18 days or more in April and May of the year under consideration.

16
sampling method used was a stratified 2-stage sampling method, where the establishments
were the primary sampling unit, while the employees were the secondary sampling unit.
On the other hand, the French data is based on the ‘wage structure survey’ carried out
in 1992 by the Institut National de la Statistique et des Etudes Economiques (INSEE). This
survey has been carried out at irregular intervals in France after the EEC-driven (EUROSTAT)
‘wage structure survey’ started in 1966. Like the Japanese survey, this survey also focuses mainly
on the establishments. The sampling method used here was a stratified 2-stage sampling method in
which the establishments were the primary sampling unit, while the employees were the secondary
sampling unit. The data were collected directly from each establishment’s pay register. Similar
methods of information collection were used to those on which the Japanese ‘basic survey on
wage structure’ was based. The French survey targeted approximately 20,000 establishments, and
the total number of employees covered amounted to roughly 130,000 persons.
The French survey explored a large rang of employees’ personal attributes at the target
establishments, such as annual earnings, annual number of working hours, educational background
and years of tenure, besides the employees' family composition, the earnings of family members
other than the employee, the non-wage income of the household, and the employee's occupation.
Questions were also asked about the work conditions, the nature of collective agreements and the
labour costs at the establishment. In addition, the survey on 1992 (conducted in 1993) contained
for the first time information about the personal educational background (diplomas). In this
respect, the data on 1992 are extremely useful, since they make it possible to estimate wage
functions by bringing the formal diploma levels (the main human capital indicator) into our
analysis and to compare the results with the Japanese wage functions.
ii) Some technical adjustments
The main employees targeted in this analysis were the regular employees hired with an
open-ended, long-term contract.
The wage in France is defined as the ‘hourly wage’ obtained by dividing the annual

17
earnings by the number of working hours. The French definition of annual earnings for regular
employees includes overtime pay and bonuses.
In the case of Japan, the ‘hourly wage’ is calculated as follows: first, the ‘scheduled
monthly earnings (including overtime pay)’ is multiplied by 12 (months), and any ‘special annual
bonuses’ are then added. However, since the data on the previous year’s bonuses are not known
for employees with less than one year of tenure, the bonus figures are not included. We were
obliged to eliminate from our calculations any employees working less than one year in both Japan
and France.
In addition, some technical problems remain to be solved which might bias our wage
function estimates: i) since we obtained no firm-scale data in the French survey, firm-scale effects
were replaced by establishment-scale dummy variables: a classification of establishment-scale
dummy variables will be presented below. ii) Due to the differences between the educational
systems of Japan and France (Nohara 1992, Mitani 1998), it was necessary to adjust the academic
diploma categories in order to render them comparable: we therefore adapted the French
educational system to the Japanese system. Consequently, the educational variable was classified
in the following four categories: graduates of junior high schools, graduates of senior high schools
(Baccalauréat), graduates of junior colleges and higher vocational training schools (two years in
tertiary education), and University graduates (having completed university study courses lasting at
least 4 years).
The industry dummy variable was added to control the sectoral premium in the estimation
of wage function. This variable refers to the Japanese industrial classification: the French one is
adjusted to match the standard Japanese system of classification (Two-Digit Industries).
As far as the geographical distribution is concerned, regional dummy variables were
created on the basis of Tokyo and Paris and used as the omitted categories, respectively.
Lastly, there was a time lag of one year between the Japanese and French data. It
would obviously have been preferable to use data collected the same year in both countries.

18
However, since the wage structure changes very little during such a short period, we assumed
that it was not prejudicial to carry out these comparisons despite the one-year time lag.
b) Formulation of wage function
For the factorial analysis of the gender wage gap differential between Japan and France,
we estimated the wage function separately for men and women in both countries. The wage
function was defined as follows.
lnWs =Xsβs+Vs ・・・(14)
S = m, f
Where lnWs is the logarithm of the wage per hour obtained by dividing the annual
earnings (including extra overtime pay and special bonuses) by the number of working hours.
Xs : -Age
-Square of age
-Years of tenure
-Square of years of tenure
-Educational background variable (senior high school, college or higher professional
school, and university (omitted category: junior high school))
-Establishment size variable (establishments with 30-99 persons, 100-499, 500-999,
establishments with 1,000 and more (omitted category: establishments with 5-29
employees))
-Industry variable (omitted category: mining)
-Regional variable (Japan: Tohoku, Kanto, Chubu, Kansai, Chugoku, Shikoku,
Kyushu (omitted category: Tokyo)) (France: outskirts of Paris, northern area, eastern
area, western area, south-western area, eastern and central area, and the
Mediterranean area (omitted category: Paris))
βs: coefficients

19
Vs: an error term
m and f denote male and female, respectively
III - Results of wage function estimates
(1) Descriptive statistics
Table 2 gives descriptive statistics resulting from the wage function estimates
obtained for men and women in Japan and France.
Variables Mean Standard Mean Standard Mean Standard Mean StandardDeviation Deviation Deviation Deviation
Age 38.671 9.6088 37.1441 9.806 40.2164 11.84845 36.8215 13.15816
Age2 1587.78 774.3408 1475.85 777.3752 1757.75 988.343 1528.961052.478Tenure 11.776 9.1529 10.6766 8.4844 13.2087 10.26888 8.1453 7.66602
Tenure2 222.45 290.13 185.9738 254.6583 279.92 358.351 125.11 226.46Education
High School 0.1026 0.1592 0.5138 0.49981 0.5688 0.49525Colleage 0.081 0.1355 0.0624 0.24191 0.2171 0.41226
University 0.0823 0.0538 0.2611 0.43921 0.0699 0.2549Establishment Size30~99 employees 0.2203 0.2389 0.261 0.43919 0.2785 0.44827
100~499 employees 0.2726 0.2683 0.2796 0.44878 0.2949 0.456500~999 employees 0.1399 0.1122 0.0864 0.28092 0.0724 0.25919
1,000 or more employees 0.1271 0.0955 0.1079 0.31022 0.0608 0.23887RegionRegion1 0.1885 0.1688 0.1044 0.30576 0.1273 0.33336Region2 0.0587 0.0481 0.2211 0.415 0.2047 0.40349Region3 0.119 0.1135 0.1572 0.36397 0.1541 0.36105Region4 0.1014 0.0951 0.1757 0.3806 0.1596 0.36625Region5 0.1042 0.1067 0.0597 0.23686 0.0659 0.24811Region6 0.1268 0.1135 0.0239 0.15279 0.0303 0.17148Region7 0.0806 0.0764 0.085 0.27893 0.1111 0.31425
Industry excluded from this table
Japan Women
Table 2 Descriptive Statistics
France Men France Women Japan Men
We can see from the table 2 that the male/female gap in years of tenure is relatively
large in Japan. The difference is 5.05 years (13.20 minus 8.15 years) in Japan, while it is only
1.10 years (11.78 minus 10.68 years) in France, which is quite small. The difference in the
male/female age distribution gap between Japan and France is also large (3.40 years in Japan
versus 1.53 years in France), but its magnitude is not comparable with that of the difference in
the tenure variable. And the percentage of employees with University education
(Baccalaureate plus at least 4 years at University) is remarkably high among Japanese men
(26.1 percent), while this figure is only between 5 and 8 percent among Japanese women and
20
among French men and women alike.
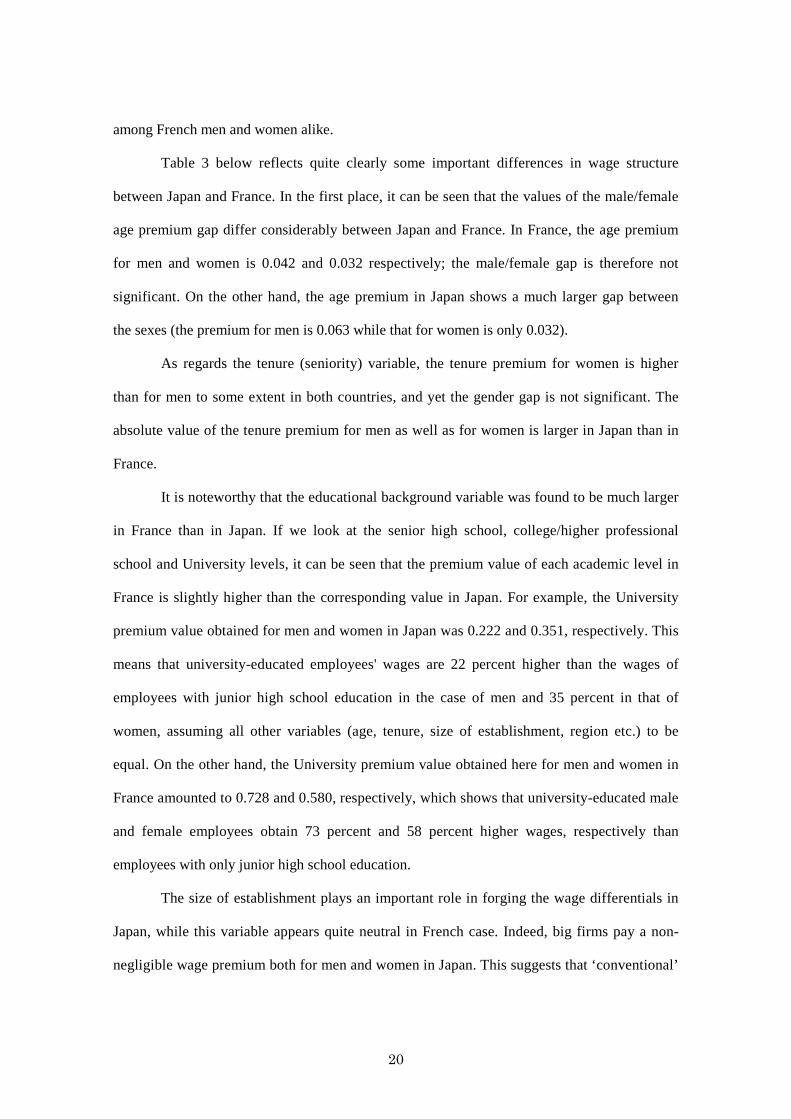
Table 3 below reflects quite clearly some important differences in wage structure
between Japan and France. In the first place, it can be seen that the values of the male/female
age premium gap differ considerably between Japan and France. In France, the age premium
for men and women is 0.042 and 0.032 respectively; the male/female gap is therefore not
significant. On the other hand, the age premium in Japan shows a much larger gap between
the sexes (the premium for men is 0.063 while that for women is only 0.032).
As regards the tenure (seniority) variable, the tenure premium for women is higher
than for men to some extent in both countries, and yet the gender gap is not significant. The
absolute value of the tenure premium for men as well as for women is larger in Japan than in
France.
It is noteworthy that the educational background variable was found to be much larger
in France than in Japan. If we look at the senior high school, college/higher professional
school and University levels, it can be seen that the premium value of each academic level in
France is slightly higher than the corresponding value in Japan. For example, the University
premium value obtained for men and women in Japan was 0.222 and 0.351, respectively. This
means that university-educated employees' wages are 22 percent higher than the wages of
employees with junior high school education in the case of men and 35 percent in that of
women, assuming all other variables (age, tenure, size of establishment, region etc.) to be
equal. On the other hand, the University premium value obtained here for men and women in
France amounted to 0.728 and 0.580, respectively, which shows that university-educated male
and female employees obtain 73 percent and 58 percent higher wages, respectively than
employees with only junior high school education.
The size of establishment plays an important role in forging the wage differentials in
Japan, while this variable appears quite neutral in French case. Indeed, big firms pay a non-
negligible wage premium both for men and women in Japan. This suggests that ‘conventional’
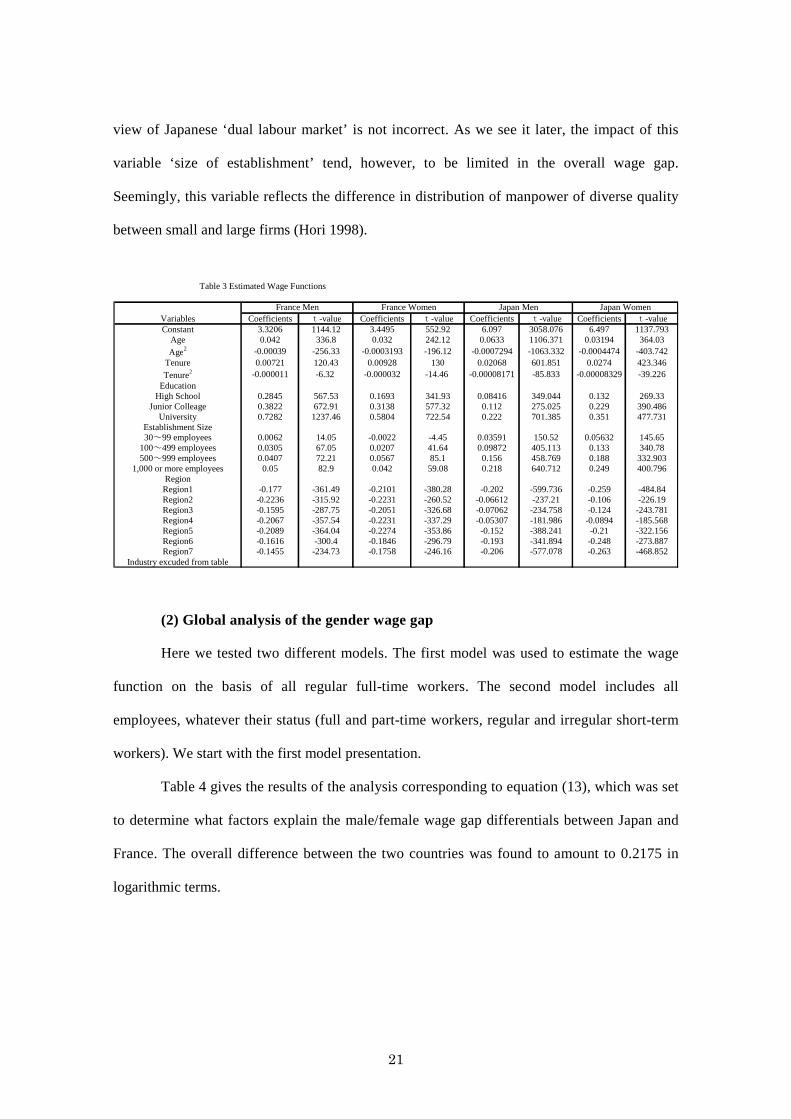
21
view of Japanese ‘dual labour market’ is not incorrect. As we see it later, the impact of this
variable ‘size of establishment’ tend, however, to be limited in the overall wage gap.
Seemingly, this variable reflects the difference in distribution of manpower of diverse quality
between small and large firms (Hori 1998).
Variables Coefficients t-value Coefficients t-value Coefficients t-value Coefficients t-valueConstant 3.3206 1144.12 3.4495 552.92 6.097 3058.076 6.497 1137.793
Age 0.042 336.8 0.032 242.12 0.0633 1106.371 0.03194 364.03Age2 -0.00039 -256.33 -0.0003193 -196.12 -0.0007294 -1063.332-0.0004474 -403.742
Tenure 0.00721 120.43 0.00928 130 0.02068 601.851 0.0274 423.346Tenure2 -0.000011 -6.32 -0.000032 -14.46 -0.00008171 -85.833 -0.00008329 -39.226
EducationHigh School 0.2845 567.53 0.1693 341.93 0.08416 349.044 0.132 269.33
Junior Colleage 0.3822 672.91 0.3138 577.32 0.112 275.025 0.229 390.486University 0.7282 1237.46 0.5804 722.54 0.222 701.385 0.351 477.731
Establishment Size30~99 employees 0.0062 14.05 -0.0022 -4.45 0.03591 150.52 0.05632 145.65
100~499 employees 0.0305 67.05 0.0207 41.64 0.09872 405.113 0.133 340.78500~999 employees 0.0407 72.21 0.0567 85.1 0.156 458.769 0.188 332.903
1,000 or more employees 0.05 82.9 0.042 59.08 0.218 640.712 0.249 400.796RegionRegion1 -0.177 -361.49 -0.2101 -380.28 -0.202 -599.736 -0.259 -484.84Region2 -0.2236 -315.92 -0.2231 -260.52 -0.06612 -237.21 -0.106 -226.19Region3 -0.1595 -287.75 -0.2051 -326.68 -0.07062 -234.758 -0.124 -243.781Region4 -0.2067 -357.54 -0.2231 -337.29 -0.05307 -181.986 -0.0894 -185.568Region5 -0.2089 -364.04 -0.2274 -353.86 -0.152 -388.241 -0.21 -322.156Region6 -0.1616 -300.4 -0.1846 -296.79 -0.193 -341.894 -0.248 -273.887Region7 -0.1455 -234.73 -0.1758 -246.16 -0.206 -577.078 -0.263 -468.852
Industry excuded from table
Table 3 Estimated Wage Functions
France Men France Women Japan Men Japan Women
(2) Global analysis of the gender wage gap
Here we tested two different models. The first model was used to estimate the wage
function on the basis of all regular full-time workers. The second model includes all
employees, whatever their status (full and part-time workers, regular and irregular short-term
workers). We start with the first model presentation.
Table 4 gives the results of the analysis corresponding to equation (13), which was set
to determine what factors explain the male/female wage gap differentials between Japan and
France. The overall difference between the two countries was found to amount to 0.2175 in
logarithmic terms.

22
DifferencesDifferencesDifferencesDifferences Percentage(%)Percentage(%)Percentage(%)Percentage(%)Japan-Farnce Gap in Male-Female Wage DifferentialsJapan-Farnce Gap in Male-Female Wage DifferentialsJapan-Farnce Gap in Male-Female Wage DifferentialsJapan-Farnce Gap in Male-Female Wage Differentials 0.21750.21750.21750.2175 100.0100.0100.0100.0 Observed X's Effect Observed X's Effect Observed X's Effect Observed X's Effect 0.14410.14410.14410.1441 66.366.366.366.3 Age 0.0330 15.2 Tenure 0.0723 33.2 Education 0.0250 11.5 Establishment Size -0.0007 -0.3 Industry -0.0041 -1.9 Region 0.0185 8.5 ObservedObservedObservedObserved----Prices EffectPrices EffectPrices EffectPrices Effect 0.00630.00630.00630.0063 2.92.92.92.9 Age -0.0055 -2.5 Tenure 0.0122 5.6 Education 0.0116 5.3 Establishment Size 0.0082 3.8 Industry -0.0221 -10.2 Region 0.0018 0.8 Gap EffectGap EffectGap EffectGap Effect 0.10460.10460.10460.1046 48.148.148.148.1 UnobservedUnobservedUnobservedUnobserved----Prices EffectPrices EffectPrices EffectPrices Effect -0.0375-0.0375-0.0375-0.0375 -17.2-17.2-17.2-17.2Gender-Specific Effect Gender-Specific Effect Gender-Specific Effect Gender-Specific Effect 0.24870.24870.24870.2487 114.3114.3114.3114.3Wage-Structure EffectWage-Structure EffectWage-Structure EffectWage-Structure Effect -0.0312-0.0312-0.0312-0.0312 -14.3-14.3-14.3-14.3
Table Table Table Table4444 Factor Analysis of JapanFactor Analysis of JapanFactor Analysis of JapanFactor Analysis of Japan----France Gap in MaleFrance Gap in MaleFrance Gap in MaleFrance Gap in Male----Female Wage Differentials Female Wage Differentials Female Wage Differentials Female Wage Differentials
As described above, the gap factors were classified in four groups. Among these
factor groups, the influence of ‘observed X's effect’ and ‘gap effect’ were found to be
particularly large. According to table 4, ‘Observed X's effect’ explains 66.8 percent, and gap
effect explains 48.1 percent of male/female wage gap differential between Japan and France.
Only the gender-specific effect, that is the ‘observed X's effect’ plus ‘gap effect’, can explain
the major part of the male/female wage gap differential between Japan and France.
On the other hand, the impact of the ‘observed-prices effect’ and the ‘unobserved-
prices effect’ was not significant. The ‘unobserved-prices effect’ obtained a negative value,
and thus even constitutes a factor reducing male/female wage gap differential between Japan
and France.
Among the variables contributing to the ‘X's effect’, which was found to explain
roughly two thirds of the male/female wage gap differential between Japan and France, the
‘tenure’ variable is the most influential: this factor accounts for 33.2 percent of the whole gap.
This finding indicates that any labour policy measures designed to increase the mean value of
women's seniority in Japan will be particularly useful approach to bring the Japanese
male/female wage gap up to the level prevailing in France.
After the tenure variable, ‘age’ and ‘educational background’ were the variables
having the largest effects on the wage gap in Japan: the influence of age was found to be 15.2

23
percent, and that of educational background, 11.5 percent. As can be seen from the descriptive
statistics given in table 2, the male/female differential in average age is larger in Japan than in
France, although it is not as large as the male/female tenure variable differential between the
two countries. This means that promoting easier re-entry to the labour market for women who
have left it because of childbirth, child care, family nursing and so on could contribute greatly
to reducing the male/female differential in Japan. This problem will be examined below in
connection with women's re-entry to the labour market and the possibility of stabilising their
careers by helping them to sustain their tenure.
As we explained above, the ‘gap effect’ reflects the differential between Japan and
France in statistically unobservable factors affecting women's status. This effect explains
about half of the whole gap in male/female wage gap differential between Japan and France.
The problem is, however, that the ‘gap effect’ cannot be identified concretely because it
involves unobservable factors. Nevertheless, a lot of empirical evidence is available that the
male/female wage gap differential between Japan and France results largely from
discrimination against women in their choice of job, training opportunities, promotion criteria
bias and so on.
(3) First model analysis (regular full-time workers only) by age groups
Here we tested the first model via distinguishing three age groups. As mentioned at
the presentation of the fourth hypothesis, it is vital to take women’s life cycle into account
when estimating the gender wage gap. All workers are liable to leave the labour market for
some time because of childcare, family care or personal incidents, but this is particularly true
in the case of female workers. The loss of human capital during these off-periods has a great
impact on women’s wages and by extension, on male/female wage differentials.
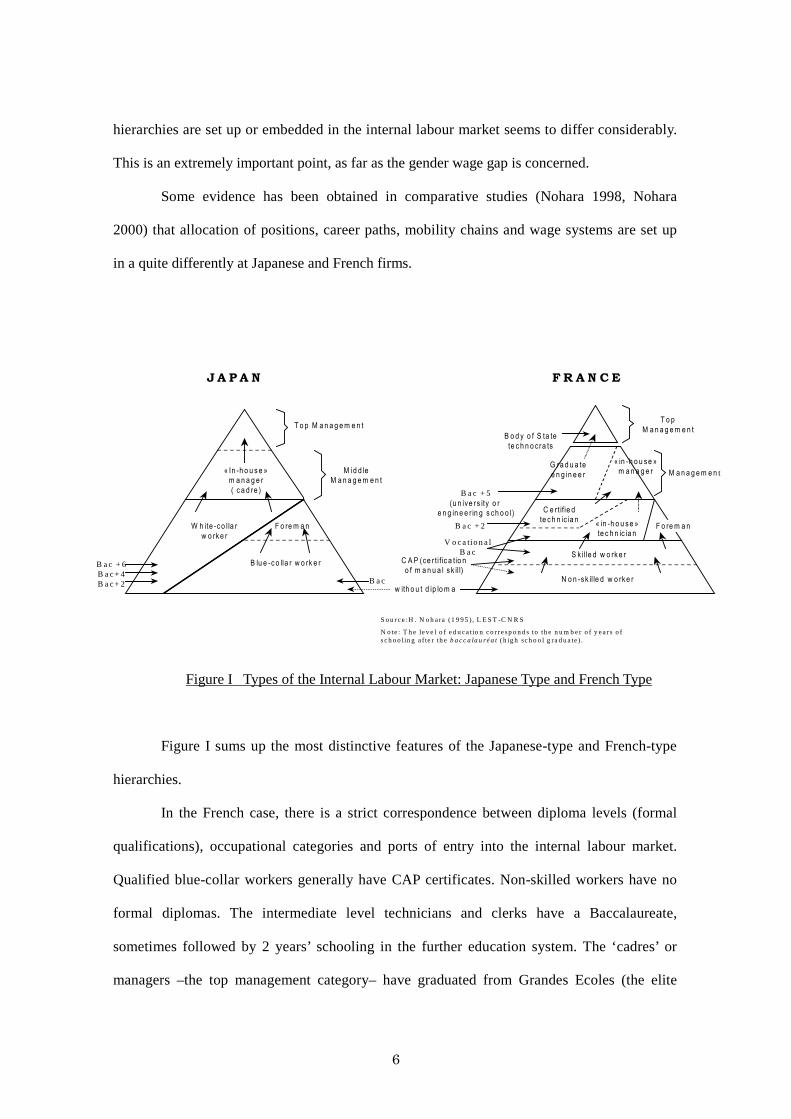
Indeed, women’s pattern of work in the course of their lives not only differs from that
of men but also differs from one country to other. For example, as shown in figure II,
women’s participation rate by age takes a different form depending on the country involved.

24
In Japan, the profile has a so-called M-shape, with a sharp drop in the participation rate
occurring at the age of 30-40, while in France, this profile remains relatively flat, regardless
of family events, except during the very first period. These differences mean that women are
treated and supported by State, Society and firms, via a specific societal ‘convention’, in a
different manner from one country to another (Nohara 2000).
Figure - II Women’s participation ratio by age in Japan and France
0 %
1 0 %
2 0 %
3 0 %
4 0 %
5 0 %
6 0 %
7 0 %
8 0 %
9 0 %
1 0 0 %
1 5 - 1 9 2 0 - 2 4 2 5 - 2 9 3 0 - 3 4 3 5 - 3 9 4 0 - 4 9 5 0 - 5 9 6 0 - 6 4
F e m a le p a r t ic ip a t io n r a te in F r a n c e
F e m a le p a r t ic ip a t io n r a te in J a p a n
Taking these societal effects into account, we applied this model to the following three
age groups: the first group consisted of those aged 30 and less, the second group of those aged
30 to 39, and the third group of those aged 40 and more.
Table 5 (in the Appendix) shows the results of decomposition analysis based on wage
function (13) for men and women, targeting only the under-30 age group. Interestingly, the
results obtained on this age group were quite different from the overall results presented
above on the population as a whole. In this age group, a very large part of the male/female
wage differential between Japan and France can be accounted for by the observed X's effect,
that is, by statistically observable explanatory variables. The fact that the level of wage
disparity between Japanese men and women in the under-30 age group is practically equal to
the French level greatly reduces the overall wage gap between the two countries.

25
Upon examining the observed-X’s effect more closely, three factors were found to
affect the gender wage gap in Japan: academic background (accounting for 36.8%), age
(accounting for 35.2%) and years of service in the company (accounting for 25.5%).
As far as the academic background variable is concerned, France is characterized by
the fact that there is no gap in the rates of university graduation between men and women,
while the overall college graduation rates are lower than in Japan. Another French trait worth
noting is the relatively high rate of middle school graduates, which include a higher
percentage of males than females. By contrast, the rate of college graduates is relatively high
in Japan, but shows a wider gap between men and women. Lastly, women achieve higher high
school and junior college graduation rates in Japan than in France.
In terms of diplomas distribution, the percentage of young people with further
educational qualifications is relatively high in Japan, although some gaps between men and
women subsist. This fact contributes to generating the relatively smaller male/female wage
disparities which exist in Japan, in comparison with France.
When it comes to examining the influence of the ‘observable price effect’, the impact
of diplomas is a major factor here as well: it actually explains 43% of the male/female wage
gap differential between Japan and France. Differences in the supply and demand structure of
the labour markets in Japan and France can also generate gaps in the earning rates. This leads
to ‘observed-price effects’ increasing the male/female wage gap differential between Japan
and France. A further break-down on the ‘price effects’ of academic background showed the
explanatory power of graduation from junior college, technical college and high school to be
even larger3. Assuming the existence of parity between the returns of educational investment
in Japan and France, a large decrease might be expected to occur in the male/female wage gap
3 In the results of the analysis on the younger (under-30) age group, the explanatory percentage corresponding to academic background (observed-price effects) was 42.9%. Taking the effects of overall academic background (observed-price effects) to be equal to 100%, the breakdown of the explanatory power gives 48.9% for high school graduates, 52.8% for junior college/technical college graduates and minus 1.7% for college graduates.

26
differential between the two countries in the under-30 age group4.
The table 6 (in the Appendix) indicates the results of decomposition analysis targeting
the 30-39 age group. The empirical findings on workers in their 30s differ slightly from those
obtained on the under-30 age group. The overall wage gap in absolute terms between France
and Japan is here three-fold large and reaches an extremely high level at this age group,
compared with the previous group. Factors corresponding to unobservable differences in
women’s status between the two countries, and resulting from highly discriminatory practices
at the workplace were found to have a particularly strong impact. These ‘gap effect’ factors
alone explain 95% of the total gap between France and Japan. Since the ‘gap effect’ is not
based on statistically observable factors, it is extremely difficult to set clear policy targets for
this age group with a view to eliminating gender-related wage discrimination in Japan. The
observed-X’s effect also accounts for 30% of the explanatory power. In this case, tenure and
academic background factors appear to be the two variables with the greatest explanatory
power; whereas the observed and unobserved price effects turn out to have negative effects,
and can thus be said to be factors responsible for decreasing the wage gap between the two
countries.
Table 7 (in the Appendix) shows the results obtained on the 40-year plus age group.
The impact of the gap effect is as strong in this group as it was in the 30-39 age group and
accounts for around 70% of the explanatory power. The observed-X’s effect, while not having
a comparable level of explanatory power to that of the gap effect, nevertheless has a major
effect, since it accounts for more than 50% of the total explanatory power. Among the
variables which come under this heading, that with the largest explanatory power is the
number of years of service (tenure) in the company, which accounts for just under 30% of the
4 If we look at the return rates versus academic background in the two countries, the return rate of high school graduates is 0.172 in France and 0.052 in Japan. The return rates of junior and technical college graduates are 0.276 in France and 0.072 in Japan. In both cases, the return rates are considerably higher in France. In addition, in the case of high school and junior college graduates, since the weighted ∆XF value is a minus value, the gap in the wage differential between the two countries narrows as the absolute value of the gap in return rates decreases between Japan and France (in other words, as the disparity between the return rates in the two countries decreases, see equation 13).

27
whole gap.
Finally, from the results of our age-group decomposition analysis on regular full-time
workers, some interesting conclusions can be drawn:
- Variables generating the male/female wage gap differential between Japan and
France vary widely from one age group to another. In the case of the youngest (under-30) age
group studied here, the gaps between the two countries are small and almost insignificant.
- In the case of the 30-39 age group, the impact of the ‘gap effect’ was found to be
extremely large. There seem to exist many social and cultural factors responsible for
discrimination against female workers in Japan. As these factors cannot be observed in
statistical terms, it is not easy to set up clear-cut policy targets, except by enforcing the equal
opportunity legislation and monitoring discriminatory attitudes against women at the
workplace. This is not a very easy task for the State.
- As far as the oldest age group (40 and above) studied here is concerned, the gap
effect has an even stronger influence on this group than on the 30-39 age group. However, the
‘observed-X’s effect’ was also found to have significant effects, including those of the
decisive ‘tenure’ variable. This suggests that many women who resume their jobs on the
secondary labour market after the childcare period lack occupational experience or have lost
their human capital, as compared with men, who continue to accumulate skill and experience
throughout their careers. There are high political stakes involved in guaranteeing occupational
continuity for women and improving their opportunities of re-entry into the market and
returning to good jobs (Higuchi 1993, Osawa 1993).
(4) Second model analysis including part-time workers
The next results were obtained by using the second model, which includes both
regular full-time workers and part-time workers.
Table 8 (in the Appendix) gives the results of decomposition analysis on male/female
wage gap differential between Japan and France, all types of employees combined. The

28
overall picture is not very different in this case, although women are enormously involved in
part time jobs in both countries. Part time jobs account for more than 20 % of all jobs in Japan
and France. In spite of this numerical importance of part-timers, which has even been
increasing during recent years, the basic pattern of gender segregation is similar in both
countries. One significant difference, however, is that when part-time workers are included in
the calculation, the explanatory power of the ‘observed-X’s effect’ increases noticeably. In
particular, the impact of the ‘tenure’ variable augments. But this does not fundamentally
affect the logics of female discrimination which are already at work. Needless to say, the
continuity (or lack of continuity) of Japanese women’s careers plays a decisive role. On the
other hand, the influence of the ‘gap effect’ was found to be almost identical to that observed
when targeting only regular full-time workers.
All these results mean that part-time jobs are fairly equally distributed in France and
Japan between the sexes.
The same method of analysis applied to the three age groups on the basis of the
second model yielded the following empirical results.
Table 9 (in the Appendix) gives the results of the analysis including part-time workers
on the under-30 age group. These results are slightly surprising, since some of the factors
turned out to have negative effects. In other words, the results of our calculations suggest that
in the under-30 age group (including part-timers), the male/female wage gap in France is
slightly larger than in Japan, contrary to what all previous analyses have indicated.
The main reason why the wage disparity is greater in France in the youngest age
group lies in the ‘gap effect’ (155.2%). This finding suggests that the school to work
transition process is relatively more difficult for girls than boys in France, whereas the
situation does not differ very greatly between the sexes in Japan (Ryan 2001).
If we look at the 30-39 age group, table 10 (in the Appendix) shows that if part-timers
are included in the model, the impact of the ‘observed-X’s effect’ becomes greater than with
29
the first model. Among the factors involved in the ‘observed-X’s effect’, both the tenure
variable and the academic background variable had a greater influence than with the first
model.
Table 11 (in the Appendix) gives the results obtained on the middle age group (40
years plus). In this group, the results did not differ so greatly from those obtained with the
first model. Regardless of whether part-timers are included or not in the model, the tenure
variable seems to have the greatest explanatory power of all the variables contributing to the
‘observed-X’s effect’.
Conclusion
The most significant results obtained from our decomposition analysis indicate that a
great part of male/female wage gap in Japan could be explained by differences in the way
men and women participate to the labour market, while another part remains ‘unexplained’ in
the sense that we can not observe statistically the difference, to put it in other way, that the
same attributes are rewarded differently between sexes. In particular, our attention has been
drawn to the fact that this type of male/female wage gap widened at the successive stages of
Japanese women’s life cycle. Very narrow at the first stage, this gap widens after the age of
thirties and remains profound until the end of fifties. Contrary to French women, Japanese
women’s labour supply behaviours are greatly shaped by a series of family events (marriage,
birth of children, family care etc).
However, this doesn’t mean that Japanese women are more ‘traditionalist’, ‘family-
orientated’ or ‘national culture-dominated’ than French counterparts. The fact is that the latter
are strongly supported by the French State in the field of childcare (kinder garden, childcare
leave, par-time work law etc), family care and job protection legislation, to continue their
careers in spite of similar barriers that exist in Japan. Majority of Japanese women wish to
better conciliate their professional career and family life (Osawa and Houseman 2003).

30
If the wage gap is to be reduced further and the women’s ‘normal’ career is to be
encouraged, policy issues on both the discrimination and the labour participation must be
addressed in parallel.
From the viewpoint of anti-discrimination , it is important to render more effective the
monitoring function of current ‘equal opportunity law between men and women’, as the
discriminatory practices against women in workplace remain numerous. Particularly in the
Japanese case, the notion of ‘equal pay for the ‘same’ work – in terms of skill, mental or
physical requirements and working conditions’ is to be reinforced. This could allow to supply
the objective basis to any complaint and to generate a ‘culture of compliance with equality
legislation’. Trade-unions here have a great role to play.
From the point of view of women’s labour participation, various actions can be taken
on a large range of policy matters. Evidences from our analysis show that the most effective
way is to sustain the continuity of their career trajectory. On this issues, the Japanese State
needs to go further, to efficiently support working women. In particular, the cost of childcare
in Japan being much higher than in other countries, the state has to significantly raise the
level of financial aids (tax reductions in connection with childcare) or increase the
accommodation capacity of publicly supported day nursery schools, as implemented in
France. Parental leave is another issue. Longer leave period than one year - currently in place
in Japan5 - will entitle mothers to better organize the career with family responsibilities. Also,
facilitating parental leave among fathers may lead to a more equitable division of home tasks
and could have a further equalising impact on male and female participation in the labour
market6.
Finally, firms must be encouraged to create favourable working conditions for
5 In France, parental leave is allowed for three years with one third of on-going wage level in compensation. 6 In 2003, 97.1 % of those taking parental leave are women against 2.9% of male workers (Jyosei Koyokanri Kihon Chosa – Female Personal Management Survey – Ministry of Health, Labour and Welfare).

31
mothers, so that they could assure their career development. Married women’s employment
may be greatly facilitated by changes in the work organisation such as flexitime, job sharing
and short-time work. It is important, of course, to make sure that these flexible working
arrangements will not lead women to adopt a ‘disadvantaged’ employment status or a poor
career option. To this regard, the implementation of ‘part-time/full-time reversible system at
the employee’s initiative’ could contribute to a great continuity of women’s employment.
In short, all these gender issues we have discussed do not constitute a simple moral
concern for ‘social justice’, but correspond to a vital question for the future of Japanese
society.
Japan is experiencing two major demographic problems. On the one hand, a drastic
fall of birth rate since thirty years accelerates the advent of aging society. On the other hand,
Japan is most likely to face a serious labour shortage in the near future. Although universal
trend in all OECD countries, these demographic problems seem to be worsened by the
‘gender questions specific to Japan’. It is clear that these dilemmas may not be solved
without improving the social, economic and family conditions of female workers. All
institutional actors (government, firms, trade-union, family etc.) are now invited to
renegotiate a new ‘social compromise’ which takes more account of the women’s will. This
is the only way to build a ‘sustainable long-term development’ into the Japanese society.
References
Becker Gary (1985), ‘Human capital, effort and sexual division of labor’, Journal of Labor
Economics, Vol.3, No.1, Part2, ppS33-S58.
Blau, Francine D. and Lawrence M. Kahn (1992),’The Gender Earnings Gap: Learning from
International Comparisons’, American Economic Review Vol.82, No.2, pp533-538.
Blau, Francine D. and Lawrence M. Kahn,(1995), ‘The Gender Earnings Gap: Some
International Evidence’, in Richard Freeman and Lawrence Katz, eds., Differences
and Changes in Wage Structures, Chicago, IL: University of Chicago Press.
Doeringer P. and Piore Micheal. (1971), Internal Labor Markets and Manpower Analysis,
Lexington, MA : Heath.

32
Higuchi, Yoshio (1991), Nihon Keizai to Shugho Kodo (Japanese economy and employment
structure), Tokyo : Toyo Keizai Sioposha.
Hori, Haruhiko (1998), ‘Danjyokan Chingin Kakusa no Shukusho Keiko to sono Yoin’
(Reducing trend of male/female wage gap and its driving factors), The Japanese
Journal of Labour Studies, Vol.40. No.6, pp41-51.
Juhn, Chinhui, Kevin M.Murphy and Brooks Pierce (1991), ‘Accounting for the Slowdown
in Black-White Wage Convergence’. In Marvin H. Kosters ed., Workers and Their
Wages, Washington,D.C.: AEI Press, pp107-143.
Mitani, Naoki (1998), ‘France: Internal Labour Markets and Wage Structure’, In Toshiaki
Tachibanaki ed., Wage Differentials: An International Comparison, London :
Macmillan Press LTD.
Mincer, Jacob and Solomon Polachek (1974), ‘Family Investment in Human Capital :
Earnings of Women’, Journal of Political Economy, Vol.82, No.2, ppS76-S108.
Nohara, Hiroatsu (1998), ‘Human Resources Management in Japanese Firms Undergoing
Transition: A Hierarchical Approach’, Paris, Economie Appliquée, Tome LI, N° 3,
pp23-39.
Nohara, Hiroatsu (2000), ‘Male and Female Patterns of Labour Force Participation: a
comparison between France and Japan’. In Maurice M, Sorge A ed., Embedding
Organizations: societal analysis of actor, organizations and socio-economic
context. Amsterdam: John Benjamins publishing company.
Osawa, Machiko (1993), ‘Keizai Henka to Jyoshi Rodo’ (Economic changes and women’s
work), Tokyo: Nihon Keizai Hyoronsha.
Osawa, Machiko and Houseman, Suzan (2003), Hatarakikata no Mirai (The future of working
patterns), Tokyo: The Japan Institute for Labor Policy and Training.
Polachek, Solomon (1981), ‘Occupational Self-Selection : A Human Capital Approach to Sex
Differences in Occupational Structure,’ The Review of Economics and Statistics, Vol.63,
No.1, pp60-69.
Ryan Paul (2001), ‘The school-to-work transition: a cross-national perspective’, Journal of
Economic Literature, Vol. 39, No.1, pp34-92.
Spence M (1973), ‘Job market signaling’, The Quarterly Journal of Economics, Vol.87, No.3,
pp355-374.

33
Variables Mean Standard Mean Standard Mean Standard Mean StandardDeviation Deviation Deviation Deviation
Age 38.671 9.6088 37.1441 9.806 40.2164 11.84845 36.8215 13.15816
Age2 1587.78 774.3408 1475.85 777.3752 1757.75 988.343 1528.961052.478Tenure 11.776 9.1529 10.6766 8.4844 13.2087 10.26888 8.1453 7.66602
Tenure2 222.45 290.13 185.9738 254.6583 279.92 358.351 125.11 226.46Education
High School 0.1026 0.1592 0.5138 0.49981 0.5688 0.49525Colleage 0.081 0.1355 0.0624 0.24191 0.2171 0.41226
University 0.0823 0.0538 0.2611 0.43921 0.0699 0.2549Establishment Size30~99 employees 0.2203 0.2389 0.261 0.43919 0.2785 0.44827
100~499 employees 0.2726 0.2683 0.2796 0.44878 0.2949 0.456500~999 employees 0.1399 0.1122 0.0864 0.28092 0.0724 0.25919
1,000 or more employees 0.1271 0.0955 0.1079 0.31022 0.0608 0.23887RegionRegion1 0.1885 0.1688 0.1044 0.30576 0.1273 0.33336Region2 0.0587 0.0481 0.2211 0.415 0.2047 0.40349Region3 0.119 0.1135 0.1572 0.36397 0.1541 0.36105Region4 0.1014 0.0951 0.1757 0.3806 0.1596 0.36625Region5 0.1042 0.1067 0.0597 0.23686 0.0659 0.24811Region6 0.1268 0.1135 0.0239 0.15279 0.0303 0.17148Region7 0.0806 0.0764 0.085 0.27893 0.1111 0.31425Industry
Construction 0.092 0.0155 0.1117 0.31494 0.0439 0.20487Manufacturing 12 0.0238 0.0256 0.0218 0.14617 0.0408 0.19787Manufacturing 13 0.0169 0.0111 0.0041 0.06427 0.0034 0.05813Manufacturing 14 0.0097 0.0181 0.0086 0.09224 0.0202 0.14061Manufacturing 15 0.0023 0.0191 0.004 0.06343 0.0363 0.1871Manufacturing 16 0.0066 0.003 0.0062 0.07835 0.0051 0.07096Manufacturing 17 0.0055 0.0063 0.0061 0.07777 0.0049 0.06948Manufacturing 18 0.0147 0.0073 0.0092 0.09539 0.0073 0.08515Manufacturing 19 0.015 0.0162 0.0202 0.14084 0.0147 0.1202Manufacturing 20 0.0242 0.0207 0.0237 0.15221 0.0151 0.12195Manufacturing 21 0.0043 0.0014 0.0019 0.0435 0.0006 0.02388Manufacturing 22 0.0122 0.0115 0.0102 0.10041 0.01 0.09956Manufacturing 23 0.0117 0.0038 0.0056 0.07495 0.0043 0.06556Manufacturing 24 0.0037 0.0107 0.0012 0.03448 0.0019 0.04324Manufacturing 25 0.0171 0.0058 0.0161 0.1257 0.01 0.09938Manufacturing 26 0.0127 0.0044 0.0158 0.12468 0.0038 0.06155Manufacturing 27 0.0133 0.0041 0.0072 0.08437 0.0033 0.0574Manufacturing 28 0.0229 0.0119 0.0242 0.15366 0.0167 0.12813Manufacturing 29 0.0304 0.0075 0.0434 0.20379 0.0195 0.13835Manufacturing 30 0.0612 0.0549 0.0646 0.24582 0.0659 0.24816Manufacturing 31 0.0681 0.0295 0.0485 0.21478 0.0181 0.13324Manufacturing 32 0.0099 0.008 0.0088 0.09354 0.009 0.09445Manufacturing33 0.0105 0.0186 0.0058 0.07591 0.0063 0.07941Public Utilities 36 0.0191 0.0089 0.0073 0.0851 0.0019 0.04351Public Utilities 37 0.0014 0.0005 0.0018 0.04276 0.0011 0.03274Public Utilities 39 0.0037 0.0007 0.0038 0.06166 0.0007 0.02596Transportation 40 0.0577 0.0074 0.0119 0.10856 0.0007 0.02676Transportation 42 0.0399 0.0106 0.0787 0.26921 0.0146 0.11991Transportation 43 0.0004 0.0012 0.001 0.03166 0.0007 0.02719Transportation 44 0.0026 0.0021 0.0014 0.03803 0.0022 0.04638Transportation 45 0.0073 0.0046 0.0039 0.06212 0.0026 0.05061Transportation 46 0.0098 0.0158 0.0123 0.11014 0.0078 0.08816Transportation 47 0.0066 0.0057 0.0212 0.14394 0.0069 0.08275
Wholesale & Retail Trade 52 0.0774 0.0663 0.1096 0.31244 0.1079 0.31025Wholesale & Retail Trade 53 0.0165 0.0341 0.0105 0.10204 0.0262 0.15973Wholesale & Retail Trade 55 0.0073 0.0086 0.0109 0.10372 0.0195 0.13843Wholesale & Retail Trade 56 0.027 0.011 0.0213 0.14449 0.0084 0.09117Wholesale & Retail Trade 58 0.0227 0.0625 0.0155 0.12349 0.0228 0.14931
Finance & Insurance 66 0.0398 0.0695 0.0311 0.17354 0.045 0.20733Finance & Insurance 67 0.0108 0.0363 0.0087 0.09264 0.0453 0.20786
Real Estate 0.0083 0.0195 0.0065 0.08006 0.0059 0.07646Services 72 0.0026 0.0043 0.0033 0.05693 0.0027 0.05167Services 73 0.0237 0.0297 0.0196 0.1386 0.0291 0.16797Services 82 0.0029 0.0012 0.0053 0.07234 0.0019 0.04364Services 84 0.0585 0.0893 0.0239 0.15279 0.0185 0.13486Services 87 0.0248 0.1192 0.0154 0.12332 0.1176 0.3221Services 89 0.0023 0.0011 0.0033 0.0577 0.0016 0.03936Services 90 0.0042 0.0078 0.0182 0.13364 0.0298 0.17015Services 91 0.0037 0.0057 0.016 0.12539 0.0231 0.15007Services 92 0.0086 0.0382 0.0038 0.06173 0.0297 0.16964Services 93 0.0053 0.0064 0.007 0.08326 0.0034 0.05815Services 95 0.0084 0.0159 0.056 0.22986 0.0609 0.2392
Japan Women
Table 2 Descriptive Statistics
France Men France Women Japan Men

34
Variables Coefficients t-value Coefficients t-value Coefficients t-value Coefficients t-valueConstant 3.3206 1144.12 3.4495 552.92 6.097 3058.076 6.497 1137.793
Age 0.042 336.8 0.032 242.12 0.0633 1106.371 0.03194 364.03Age2 -0.00039 -256.33 -0.0003193 -196.12 -0.0007294 -1063.332-0.0004474 -403.742
Tenure 0.00721 120.43 0.00928 130 0.02068 601.851 0.0274 423.346Tenure2 -0.000011 -6.32 -0.000032 -14.46 -0.00008171 -85.833 -0.00008329 -39.226
EducationHigh School 0.2845 567.53 0.1693 341.93 0.08416 349.044 0.132 269.33
Colleage 0.3822 672.91 0.3138 577.32 0.112 275.025 0.229 390.486University 0.7282 1237.46 0.5804 722.54 0.222 701.385 0.351 477.731
Establishment Size30~99 employees 0.0062 14.05 -0.0022 -4.45 0.03591 150.52 0.05632 145.65
100~499 employees 0.0305 67.05 0.0207 41.64 0.09872 405.113 0.133 340.78500~999 employees 0.0407 72.21 0.0567 85.1 0.156 458.769 0.188 332.903
1,000 or more employees 0.05 82.9 0.042 59.08 0.218 640.712 0.249 400.796RegionRegion1 -0.177 -361.49 -0.2101 -380.28 -0.202 -599.736 -0.259 -484.84Region2 -0.2236 -315.92 -0.2231 -260.52 -0.06612 -237.21 -0.106 -226.19Region3 -0.1595 -287.75 -0.2051 -326.68 -0.07062 -234.758 -0.124 -243.781Region4 -0.2067 -357.54 -0.2231 -337.29 -0.05307 -181.986 -0.0894 -185.568Region5 -0.2089 -364.04 -0.2274 -353.86 -0.152 -388.241 -0.21 -322.156Region6 -0.1616 -300.4 -0.1846 -296.79 -0.193 -341.894 -0.248 -273.887Region7 -0.1455 -234.73 -0.1758 -246.16 -0.206 -577.078 -0.263 -468.852Industry
Construction -0.2305 -134.36 -0.1116 -19.02 0.04422 26.031 0.04914 8.872Manufacturing 12 -0.1582 -83.66 -0.1904 -32.81 -0.123 -69.757 -0.205 -37.158Manufacturing 13 -0.0384 -19.4 -0.047 -7.94 0.104 50.075 0.04787 8.081Manufacturing 14 -0.257 -116.3 -0.362 -62.01 -0.176 -92.348 -0.273 -48.747Manufacturing 15 -0.133 -38.29 -0.2733 -46.85 -0.168 -72.472 -0.36 -64.801Manufacturing 16 -0.2469 -101.44 -0.2061 -31.82 -0.129 -64.745 -0.142 -23.939Manufacturing 17 -0.1933 -75.19 -0.3054 -50.11 -0.147 -74.651 -0.16 -27.479Manufacturing 18 -0.0836 -41.27 -0.1658 -27.48 0.01213 6.561 -0.08101 -14.164Manufacturing 19 -0.0062 -3.03 -0.0243 -4.14 0.02262 12.826 -0.0088 -1.578Manufacturing 20 -0.0089 -4.71 -0.0391 -6.7 0.08511 48.335 0.05866 10.491Manufacturing 21 0.2398 86.65 0.0277 3.78 0.265 108.718 0.09889 12.99Manufacturing 22 -0.1395 -66.37 -0.1925 -32.54 -0.04807 -26.208 -0.109 -19.394Manufacturing 23 -0.2185 -102.36 -0.2253 -35.54 0.008105 4.136 -0.13 -22.16Manufacturing 24 -0.2781 -95.44 -0.3228 -54.47 -0.132 -38.548 -0.251 -36.893Manufacturing 25 -0.1016 -51.41 -0.1155 -18.86 -0.01004 -5.648 -0.06472 -11.41Manufacturing 26 -0.1598 -76.41 -0.0318 -5.09 0.01834 10.328 -0.01398 -2.375Manufacturing 27 -0.1156 -55.9 0.0245 3.9 -0.01094 -5.802 -0.0869 -14.699Manufacturing 28 -0.141 -74.17 -0.1624 -27.5 -0.03841 -21.972 -0.08161 -14.623Manufacturing 29 -0.0942 -51.22 -0.128 -21.23 -0.02924 -16.997 -0.04361 -7.82Manufacturing 30 -0.1142 -65.65 -0.1736 -30.18 -0.03062 -17.925 -0.129 -23.405Manufacturing 31 -0.1505 -87.44 -0.1543 -26.67 0.008868 5.169 -0.0304 -5.443Manufacturing 32 -0.0958 -43.66 -0.1541 -25.66 -0.0524 -27.694 -0.126 -22.245Manufacturing33 -0.1414 -65.29 -0.2362 -40.48 -0.02808 -13.766 -0.09346 -16.167Public Utilities 36 -0.0108 -5.52 -0.0483 -8.07 0.318 170.064 0.27 44.318Public Utilities 37 -0.0698 -16.65 0.1537 15.73 0.224 94.201 0.132 19.583Public Utilities 39 -0.0158 -5.4 -0.0695 -8.09 0.316 155.091 0.407 55.016Transportation 40 -0.0543 -31.17 -0.0377 -6.25 0.156 87.058 0.192 26.838Transportation 42 -0.2283 -126.88 -0.1726 -29.06 -0.09994 -58.888 -0.03132 -5.597Transportation 43 -0.1233 -16.84 -0.1375 -18.42 0.06608 21.617 0.06668 9.513Transportation 44 0.0895 27.19 0.1165 17.11 0.359 123.22 0.445 67.516Transportation 45 -0.0658 -27.73 -0.0333 -5.34 0.07515 36.377 0.07422 12.498Transportation 46 -0.0761 -34.33 -0.0322 -5.49 0.04003 22.222 0.06656 11.792Transportation 47 0.00071 0.29 -0.1106 -17.95 0.183 104.554 0.324 57.382
Wholesale & Retail Trade 52 -0.1011 -58.45 -0.0965 -16.79 0.0279 16.333 0.01667 3.027Wholesale & Retail Trade 53 -0.1896 -95.19 -0.2194 -37.96 0.01231 6.547 0.01131 2.039Wholesale & Retail Trade 55 -0.2105 -88.29 -0.261 -43.49 -0.07767 -41.668 -0.105 -18.879Wholesale & Retail Trade 56 -0.1796 -95.9 -0.1916 -32.3 -0.02005 -11.319 0.01729 3.052Wholesale & Retail Trade 58 -0.1671 -87.11 -0.1659 -28.84 -0.05414 -29.664 -0.03741 -6.721
Finance & Insurance 66 0.0202 11.26 0.0304 5.3 0.262 150.675 0.192 34.823Finance & Insurance 67 -0.0054 -2.5 -0.0374 -6.47 0.444 213.446 0.296 52.998
Real Estate -0.1203 -52.11 -0.1324 -22.67 0.12 57.525 0.08717 15.092Services 72 -0.1467 -44.32 -0.2302 -36.77 0.04784 21.676 0.0498 8.355Services 73 -0.2386 -125 -0.2324 -40.08 -0.104 -57.256 -0.05344 -9.612Services 82 -0.1467 -45.87 -0.1005 -13.37 0.07988 40.999 0.08634 14.068Services 84 -0.0588 -33.32 -0.0535 -9.32 0.05672 32.172 0.08119 14.597Services 87 -0.1997 -106.31 -0.143 -24.98 0.152 83.87 0.203 36.895Services 89 -0.2533 -72.69 -0.1731 -22.62 0.06835 29.389 -0.01014 -1.485Services 90 -0.0222 -7.96 -0.0469 -7.78 0.0633 34.988 0.0928 16.718Services 91 -0.224 -76.63 -0.187 -30.45 0.118 62.552 0.192 33.922Services 92 -0.2378 -104.03 -0.2098 -36.33 0.15 68.01 0.203 36.604Services 93 -0.0938 -35.92 0.0249 4.09 0.125 64.942 0.108 18.481Services 95 -0.222 -96.58 -0.2204 -37.54 -0.03075 -17.905 -0.006513 -1.18
adjR2
Table 3 Estimated Wage Functions
France Men France Women Japan Men Japan Women
0.517 0.492 0.616 0.589

35
DifferencesDifferencesDifferencesDifferences Percentage(%)Percentage(%)Percentage(%)Percentage(%)Japan-Farnce Gap in Male-Female Wage DifferentialsJapan-Farnce Gap in Male-Female Wage DifferentialsJapan-Farnce Gap in Male-Female Wage DifferentialsJapan-Farnce Gap in Male-Female Wage Differentials 0.21750.21750.21750.2175 100.0100.0100.0100.0 Observed X's Effect Observed X's Effect Observed X's Effect Observed X's Effect 0.14410.14410.14410.1441 66.366.366.366.3 Age 0.0330 15.2 Tenure 0.0723 33.2 Education 0.0250 11.5 Establishment Size -0.0007 -0.3 Industry -0.0041 -1.9 Region 0.0185 8.5 ObservedObservedObservedObserved----Prices EffectPrices EffectPrices EffectPrices Effect 0.00630.00630.00630.0063 2.92.92.92.9 Age -0.0055 -2.5 Tenure 0.0122 5.6 Education 0.0116 5.3 Establishment Size 0.0082 3.8 Industry -0.0221 -10.2 Region 0.0018 0.8 Gap EffectGap EffectGap EffectGap Effect 0.10460.10460.10460.1046 48.148.148.148.1 UnobservedUnobservedUnobservedUnobserved----Prices EffectPrices EffectPrices EffectPrices Effect -0.0375-0.0375-0.0375-0.0375 -17.2-17.2-17.2-17.2Gender-Specific Effect Gender-Specific Effect Gender-Specific Effect Gender-Specific Effect 0.24870.24870.24870.2487 114.3114.3114.3114.3Wage-Structure EffectWage-Structure EffectWage-Structure EffectWage-Structure Effect -0.0312-0.0312-0.0312-0.0312 -14.3-14.3-14.3-14.3
Table Table Table Table4444 Factor Analysis of JapanFactor Analysis of JapanFactor Analysis of JapanFactor Analysis of Japan----France Gap in MaleFrance Gap in MaleFrance Gap in MaleFrance Gap in Male----Female Wage Differentials Female Wage Differentials Female Wage Differentials Female Wage Differentials
( Under 30 years olds ) ( Under 30 years olds ) ( Under 30 years olds ) ( Under 30 years olds )DifferencesDifferencesDifferencesDifferences Percentage(%)Percentage(%)Percentage(%)Percentage(%)
Japan-Farnce Gap in Male-Female Wage DifferentialsJapan-Farnce Gap in Male-Female Wage DifferentialsJapan-Farnce Gap in Male-Female Wage DifferentialsJapan-Farnce Gap in Male-Female Wage Differentials 0.06500.06500.06500.0650 100.0100.0100.0100.0 Observed X's Effect Observed X's Effect Observed X's Effect Observed X's Effect 0.06570.06570.06570.0657 101.1101.1101.1101.1 Age 0.0229 35.2 Tenure 0.0166 25.5 Education 0.0239 36.8 Establishment Size -0.0010 -1.5 Industry -0.0080 -12.3 Region 0.0114 17.5 ObservedObservedObservedObserved----Prices EffectPrices EffectPrices EffectPrices Effect 0.01080.01080.01080.0108 16.616.616.616.6 Age 0.0008 1.2 Tenure -0.0033 -5.1 Education 0.0279 42.9 Establishment Size 0.0014 2.2 Industry -0.0195 -30.0 Region 0.0035 5.4 Gap EffectGap EffectGap EffectGap Effect -0.0029-0.0029-0.0029-0.0029 -4.5-4.5-4.5-4.5 UnobservedUnobservedUnobservedUnobserved----Prices EffectPrices EffectPrices EffectPrices Effect -0.0086-0.0086-0.0086-0.0086 -13.2-13.2-13.2-13.2Gender-Specific Effect Gender-Specific Effect Gender-Specific Effect Gender-Specific Effect 0.06280.06280.06280.0628 96.696.696.696.6Wage-Structure EffectWage-Structure EffectWage-Structure EffectWage-Structure Effect 0.00220.00220.00220.0022 3.43.43.43.4
Table 5 Factor Analysis of Japan-France Gap in Male-Female Wage Differentials Table 5 Factor Analysis of Japan-France Gap in Male-Female Wage Differentials Table 5 Factor Analysis of Japan-France Gap in Male-Female Wage Differentials Table 5 Factor Analysis of Japan-France Gap in Male-Female Wage Differentials
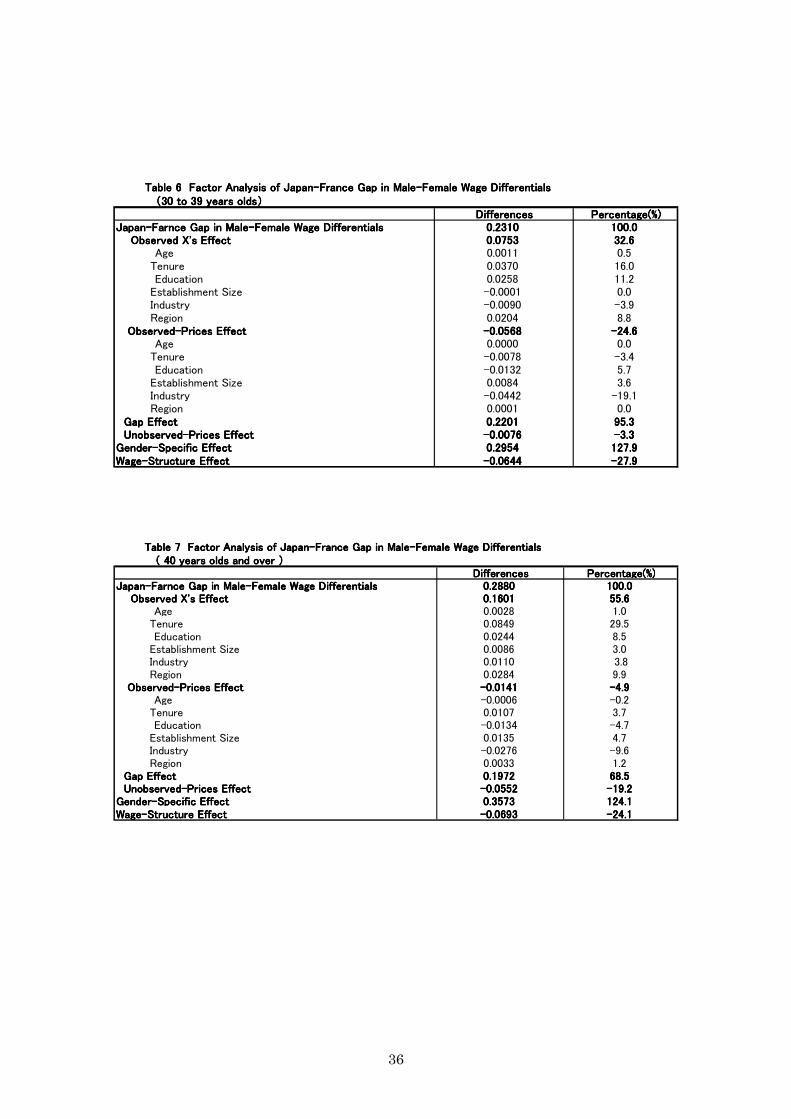
36
( ( ( (30 30 30 30 to to to to 39 39 39 39 years oldsyears oldsyears oldsyears olds))))DifferencesDifferencesDifferencesDifferences Percentage(%)Percentage(%)Percentage(%)Percentage(%)
Japan-Farnce Gap in Male-Female Wage DifferentialsJapan-Farnce Gap in Male-Female Wage DifferentialsJapan-Farnce Gap in Male-Female Wage DifferentialsJapan-Farnce Gap in Male-Female Wage Differentials 0.23100.23100.23100.2310 100.0100.0100.0100.0 Observed X's Effect Observed X's Effect Observed X's Effect Observed X's Effect 0.07530.07530.07530.0753 32.632.632.632.6 Age 0.0011 0.5 Tenure 0.0370 16.0 Education 0.0258 11.2 Establishment Size -0.0001 0.0 Industry -0.0090 -3.9 Region 0.0204 8.8 ObservedObservedObservedObserved----Prices EffectPrices EffectPrices EffectPrices Effect -0.0568-0.0568-0.0568-0.0568 -24.6-24.6-24.6-24.6 Age 0.0000 0.0 Tenure -0.0078 -3.4 Education -0.0132 5.7 Establishment Size 0.0084 3.6 Industry -0.0442 -19.1 Region 0.0001 0.0 Gap EffectGap EffectGap EffectGap Effect 0.22010.22010.22010.2201 95.395.395.395.3 UnobservedUnobservedUnobservedUnobserved----Prices EffectPrices EffectPrices EffectPrices Effect -0.0076-0.0076-0.0076-0.0076 -3.3-3.3-3.3-3.3Gender-Specific Effect Gender-Specific Effect Gender-Specific Effect Gender-Specific Effect 0.29540.29540.29540.2954 127.9127.9127.9127.9Wage-Structure EffectWage-Structure EffectWage-Structure EffectWage-Structure Effect -0.0644-0.0644-0.0644-0.0644 -27.9-27.9-27.9-27.9
Table 6 Factor Analysis of Japan-France Gap in Male-Female Wage Differentials Table 6 Factor Analysis of Japan-France Gap in Male-Female Wage Differentials Table 6 Factor Analysis of Japan-France Gap in Male-Female Wage Differentials Table 6 Factor Analysis of Japan-France Gap in Male-Female Wage Differentials
( ( ( ( 40 40 40 40 years olds and over years olds and over years olds and over years olds and over ))))DifferencesDifferencesDifferencesDifferences Percentage(%)Percentage(%)Percentage(%)Percentage(%)
Japan-Farnce Gap in Male-Female Wage DifferentialsJapan-Farnce Gap in Male-Female Wage DifferentialsJapan-Farnce Gap in Male-Female Wage DifferentialsJapan-Farnce Gap in Male-Female Wage Differentials 0.28800.28800.28800.2880 100.0100.0100.0100.0 Observed X's Effect Observed X's Effect Observed X's Effect Observed X's Effect 0.16010.16010.16010.1601 55.655.655.655.6 Age 0.0028 1.0 Tenure 0.0849 29.5 Education 0.0244 8.5 Establishment Size 0.0086 3.0 Industry 0.0110 3.8 Region 0.0284 9.9 ObservedObservedObservedObserved----Prices EffectPrices EffectPrices EffectPrices Effect -0.0141-0.0141-0.0141-0.0141 -4.9-4.9-4.9-4.9 Age -0.0006 -0.2 Tenure 0.0107 3.7 Education -0.0134 -4.7 Establishment Size 0.0135 4.7 Industry -0.0276 -9.6 Region 0.0033 1.2 Gap EffectGap EffectGap EffectGap Effect 0.19720.19720.19720.1972 68.568.568.568.5 UnobservedUnobservedUnobservedUnobserved----Prices EffectPrices EffectPrices EffectPrices Effect -0.0552-0.0552-0.0552-0.0552 -19.2-19.2-19.2-19.2Gender-Specific Effect Gender-Specific Effect Gender-Specific Effect Gender-Specific Effect 0.35730.35730.35730.3573 124.1124.1124.1124.1Wage-Structure EffectWage-Structure EffectWage-Structure EffectWage-Structure Effect -0.0693-0.0693-0.0693-0.0693 -24.1-24.1-24.1-24.1
Table 7 Factor Analysis of Japan-France Gap in Male-Female Wage Differentials Table 7 Factor Analysis of Japan-France Gap in Male-Female Wage Differentials Table 7 Factor Analysis of Japan-France Gap in Male-Female Wage Differentials Table 7 Factor Analysis of Japan-France Gap in Male-Female Wage Differentials

37
(Including part time workers) (Including part time workers) (Including part time workers) (Including part time workers)DifferencesDifferencesDifferencesDifferences Percentage(%)Percentage(%)Percentage(%)Percentage(%)
Japan-Farnce Gap in Male-Female Wage DifferentialsJapan-Farnce Gap in Male-Female Wage DifferentialsJapan-Farnce Gap in Male-Female Wage DifferentialsJapan-Farnce Gap in Male-Female Wage Differentials 0.24600.24600.24600.2460 100.0100.0100.0100.0 Observed X's Effect Observed X's Effect Observed X's Effect Observed X's Effect 0.18130.18130.18130.1813 73.773.773.773.7 Age 0.0185 7.5 Tenure 0.0744 30.2 Education 0.0405 16.5 Establishment Size 0.0006 0.2 Industry 0.0268 10.9 Region 0.0148 6.0 Part 0.0057 2.3 ObservedObservedObservedObserved----Prices EffectPrices EffectPrices EffectPrices Effect -0.0062-0.0062-0.0062-0.0062 -2.5-2.5-2.5-2.5 Age -0.0044 -1.8 Tenure 0.0150 6.1 Education 0.0097 3.9 Establishment Size 0.0101 4.1 Industry -0.0603 -24.5 Region 0.0006 0.2 Part 0.0231 9.4 Gap EffectGap EffectGap EffectGap Effect 0.11630.11630.11630.1163 47.347.347.347.3 UnobservedUnobservedUnobservedUnobserved----Prices EffectPrices EffectPrices EffectPrices Effect -0.0453-0.0453-0.0453-0.0453 -18.4-18.4-18.4-18.4Gender-Specific Effect Gender-Specific Effect Gender-Specific Effect Gender-Specific Effect 0.29760.29760.29760.2976 121.0121.0121.0121.0Wage-Structure EffectWage-Structure EffectWage-Structure EffectWage-Structure Effect -0.0515-0.0515-0.0515-0.0515 -20.9-20.9-20.9-20.9
Table 8 Factor Analysis of Japan-France Gap in Male-Female Wage Differentials Table 8 Factor Analysis of Japan-France Gap in Male-Female Wage Differentials Table 8 Factor Analysis of Japan-France Gap in Male-Female Wage Differentials Table 8 Factor Analysis of Japan-France Gap in Male-Female Wage Differentials