Why Is Population Increasing at Different Rates in Different Countries?
15
Why Is Population Increasing at Different Rates in Different Countries? * POPULATION
-
Upload
rodger-elliott -
Category
Documents
-
view
227 -
download
0
Transcript of Why Is Population Increasing at Different Rates in Different Countries?

Why Is Population Increasing at Different Rates in Different Countries?
*POPULATION

*DEMOGRAPHIC TRANSITION
*Process of change in a society’s population
*Moves from a condition of high crude birth and death rates and low rate of natural increase
*End with a condition of low crude birth and death rates, low rate of natural increase and a higher population

*STAGES OF DEMOGRAPHIC
TRANSITION
*Stage 1 – low growth
*Prominent in a society that depends on hunting and gathering
*Food is scarce, so population remains low
*Stage 2 – high growth
*Results from a period of industrialization
*More inventions and advancements makes it easier to sustain growing population

*STAGES OF DEMOGRAPHIC
TRANSITION
*Stage 3 – moderate growth
*Crude birth rate drops sharply, but population continues to grow
*MDC were in this stage during the early 20th century
*Stage 4 – low growth
*Zero population growth (ZPG) – birth rate equals death rate

*The Demographic Transition
Fig. 2-13: The demographic transition consists of four stages, which move from high birth and death rates, to declines first in death rates then in birth rates, and finally to a stage of low birth and death rates. Population growth is most rapid in the second stage.

*World Population & Growth Rates, 400,000 BC
- AD 2000

*POPULATION PYRAMIDS
*Shows the total population in 5-year age groups with the youngest group at the base
*Males on the left of the graph; females on the right
*Countries in Stage 2 of demographic transition would have more young children
*Countries in stage 4 of demographic transition would have more older people
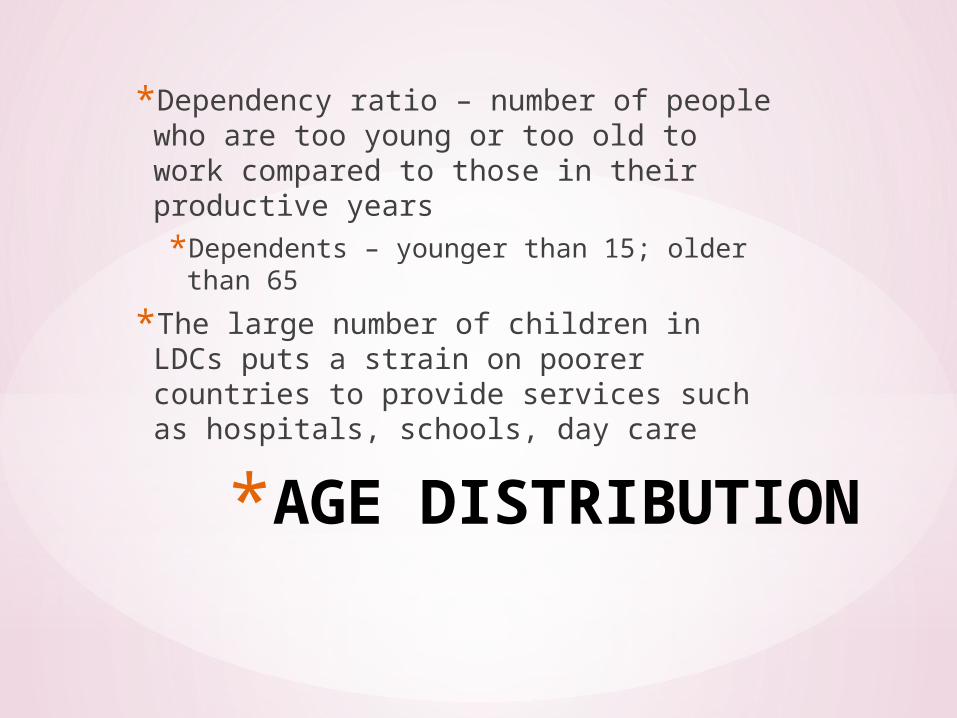
*AGE DISTRIBUTION
*Dependency ratio – number of people who are too young or too old to work compared to those in their productive years
*Dependents – younger than 15; older than 65
*The large number of children in LDCs puts a strain on poorer countries to provide services such as hospitals, schools, day care

*Percent of Population under 15
Fig. 2-15: About one-third of world population is under 15, but the percentage by country varies from over 40% in most of Africa and some Asian countries, to under 20% in much of Europe.

*SEX RATIO
*Number of males per hundred females in the population
*More males are born than females; however, males have a higher death rate
*A high mortality rate during childbirth accounts for the small female population in LDCs

*Population Pyramids in U.S. Cities
Fig. 2-16: Population pyramids can vary greatly with different fertility rates (Laredo vs. Honolulu), or among military bases (Unalaska), college towns (Lawrence), and retirement communities (Naples).

*Rapid Growth in Cape Verde
Cape Verde, which entered stage 2 of the demographic transition in about 1950, is experiencing rapid population growth. Its population history reflects the impacts of famines and out-migration.
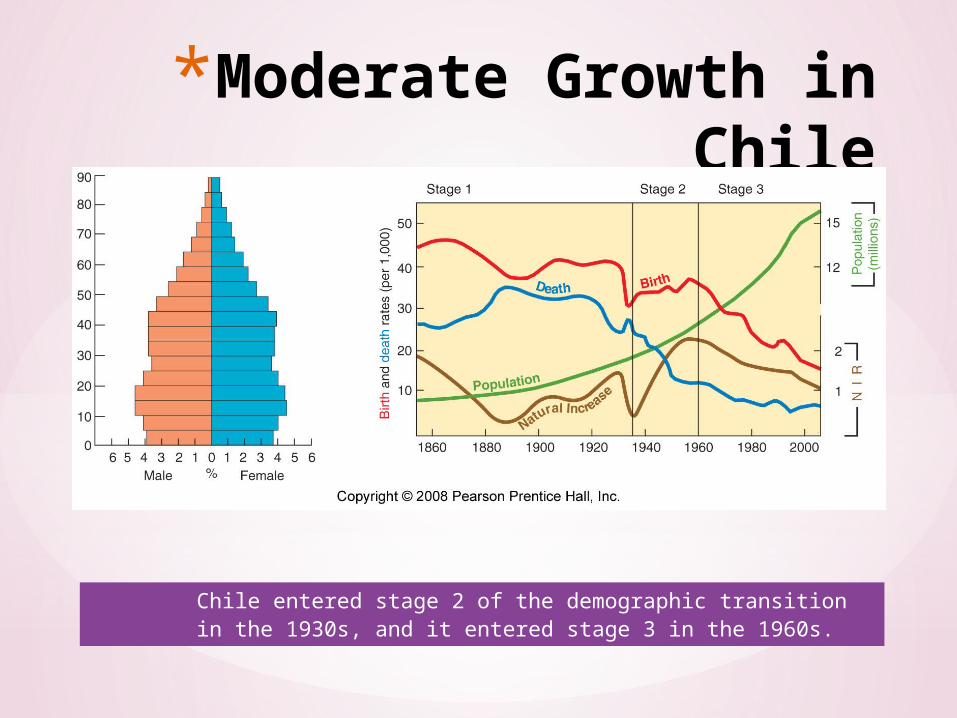
*Moderate Growth in Chile
Chile entered stage 2 of the demographic transition in the 1930s, and it entered stage 3 in the 1960s.
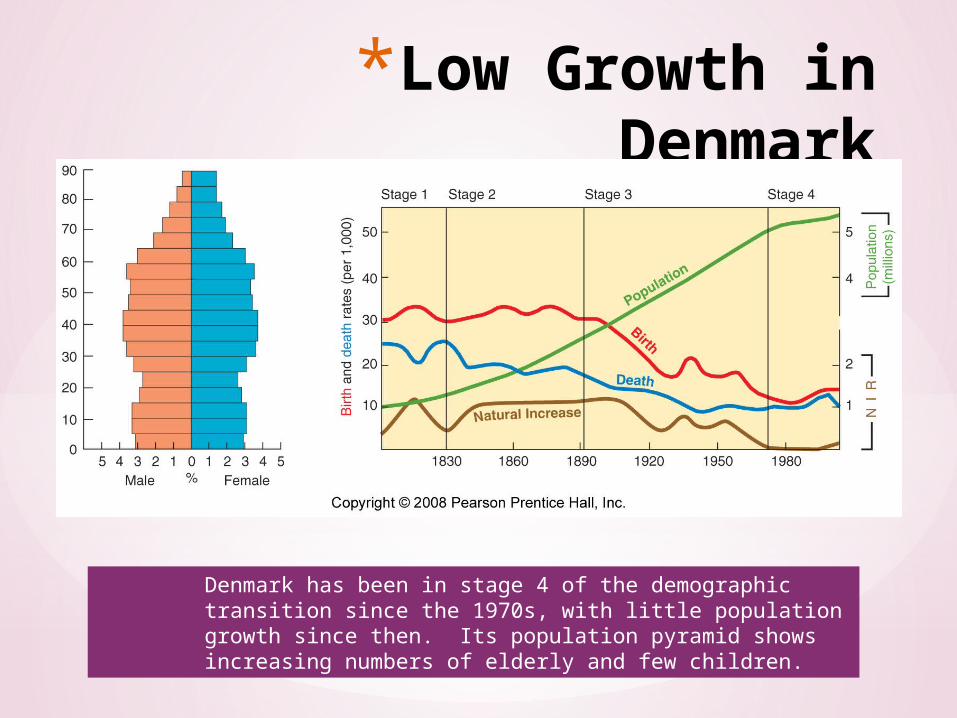
*Low Growth in Denmark
Denmark has been in stage 4 of the demographic transition since the 1970s, with little population growth since then. Its population pyramid shows increasing numbers of elderly and few children.

*SOMETHING TO THINK ABOUT . . .
*What reasons can you give that may have contributed to a drop in the crude death rate throughout the world?