
Why Invest In Indonesia - platinum-asia.com · 6 6 5. Recent Foreign Investors (Project Size In...
16
0 Why Invest In Indonesia 0 0 July 2019
Transcript of Why Invest In Indonesia - platinum-asia.com · 6 6 5. Recent Foreign Investors (Project Size In...
00
Why Invest In Indonesia
00
July 2019
11
Table of Contents
1. Macro Overview
2. Indonesia : Map
3. Infrastructure Investment
4. Tourism Industry
5. Recent Foreign Investors
6. Key Industries in Indonesia
7. Government Polices
22
1. Macro Overview
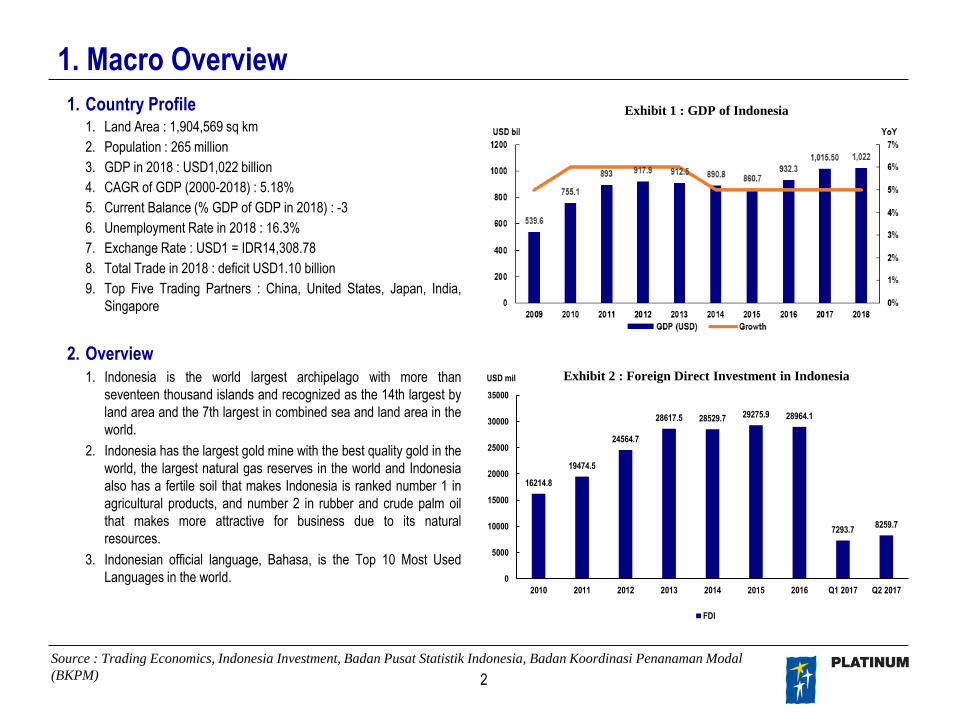
1. Country Profile1. Land Area : 1,904,569 sq km
2. Population : 265 million
3. GDP in 2018 : USD1,022 billion
4. CAGR of GDP (2000-2018) : 5.18%
5. Current Balance (% GDP of GDP in 2018) : -3
6. Unemployment Rate in 2018 : 16.3%
7. Exchange Rate : USD1 = IDR14,308.78
8. Total Trade in 2018 : deficit USD1.10 billion
9. Top Five Trading Partners : China, United States, Japan, India,
Singapore
2. Overview
1. Indonesia is the world largest archipelago with more than
seventeen thousand islands and recognized as the 14th largest by
land area and the 7th largest in combined sea and land area in the
world.
2. Indonesia has the largest gold mine with the best quality gold in the
world, the largest natural gas reserves in the world and Indonesia
also has a fertile soil that makes Indonesia is ranked number 1 in
agricultural products, and number 2 in rubber and crude palm oil
that makes more attractive for business due to its natural
resources.
3. Indonesian official language, Bahasa, is the Top 10 Most Used
Languages in the world.
Source : Trading Economics, Indonesia Investment, Badan Pusat Statistik Indonesia, Badan Koordinasi Penanaman Modal
(BKPM)
16214.8
19474.5
24564.7
28617.5 28529.7 29275.9 28964.1
7293.78259.7
0
5000
10000
15000
20000
25000
30000
35000
2010 2011 2012 2013 2014 2015 2016 Q1 2017 Q2 2017
USD milExhibit 2 : Foreign Direct Investment in Indonesia
FDI
Exhibit 2 : Foreign Direct Investment in Indonesia
Exhibit 1 : GDP of Indonesia

33
2. Indonesia: Map
JAKARTA
The largest city, the
capital city
government,
business district and
the most populous
city in the country.SURABAYA
The second largest city,
the capital of East Java
Province, has the busiest
port in Indonesia, one of
the best marine vessel
manufacturers in Asia.
MAKASSAR
The capital of South
Sulawesi province,
center of production
and processing of
agricultural,
plantation, fishery
products and nickel
mining.
MEDAN
The capital of North
Sumatera province,
production and processing
centre of agricultural
products and principal
mining and energy
resources.
BANDUNG
The capital of West
Java Province, the
biggest fashion city
in Indonesia, also
known as the
beautiful city.
YOGYAKARTA
The city of tourism,
become one of the
destinations for
domestic and
foreign tourist.
DENPASAR
The capital of Bali
province, the most
popular tourism
destination, one of the
International getaways
to Indonesia.
BANJARMASIN
The biggest producer
of diamonds and
precious stones in
Indonesia.
BALIKPAPAN
The largest oil refinery
and port that is quite
busy.
MERAUKE
The Centre of food,
fishery, energy, and
national mining
development.
SAMARINDA
The centre of
production and
processing of mining
and energy resources.
ARWANDOP
The world’s largest
gold mine and the
world’s third largest
copper mine.
Source : Platinum Research

44
3. Infrastructure Investment
Source : Presidenri.go.id, Indonesia Investment, PWC, Finance Detik, Nasional Kontan, CNBC Indonesia, Kompas
1. Road Infrastructure
I. Trans-Sumatran Highway (Completed in Dec 2018) – linking Banda
Aceh to Bandar Lampung to increase the development
competitiveness and economic growth points around this road.
II. Trans-Java Toll Road (Phase 2) (To be completed by 2019) – linking
Merak (northwestern end of Java) to Banyuwangi (eastern end of
island in Indonesia).
2. Rail Infrastructure
I. Jakarta MRT (Phase 1) (Completed in Mar 2019) – linking Lebak
Bulus to Bundaran HI.
II. Jakarta LRT (Phase 1) (To be completed by 2021) – LRT is meant to
handle Jakarta’s more respectable option traffic clog and to replaces
the Jakarta Monorail venture which has been cancelled.
3. Port Infrastructure
I. Kalibaru Port (Phase 2) (To be completed by 2023) – the largest
container terminal in Indonesia in order to increase annual capacity of
Tanjung Priok more than triple.
4. Long-term Airport Developments
I. New Yogyakarta International Airport, Central Java – To be
completed in April 2019.
II. Kediri International Airport, East Java – To be completed in 30 years.
III. New North Bali International Airport, Bali – Completion date is not
disclosed.
IV. Terminal IV Soekarno-Hatta International Airport – Completion date is
not disclosed.
1
2
3
4
5
6
7
8
9
Exhibit 3 : Indonesia Future Infrastructure Map

55
4. Tourism Industry
1. Overview
1. Travel & Tourism grew at 7.8% in 2018 – double the global
average of 3.9%
2. The largest inbound international markets were Singapore (15%);
Malaysia (14%); China (13%); Australia (11%); and Japan (5%).
3. The Government of Indonesia’s focus on building infrastructure
will boost tourism growth i.e 10 new airports between 2015-2018
and 5 new airports to open in 2019.
2. GDP Contribution – 6.0% to Indonesia’s GDP, direct & indirect
contribution worth IDR 890,428 billion (USD 62.6 billion), and is forecast
to rise by 5.2% in 2019.
3. Employment : Direct Contribution – Supported 10.3% of all
Indonesia’s employment, or 13 million jobs.
4. Visitor Exports – generated IDR192,608 billion (USD14.4 billion), 7%
of total exports in 2017 and forecast to grow 6.4% per annum from 2018-
2028 to IDR372,088 billion (USD27.8 billion)
Source : Ceicdata, Indonesia Investments, World Travel and Tourism Council, Badan Pusat Statistik
Exhibit 4 : Foreign Exchange Earning
2.93.2
2.8 2.952.7 2.64
2.82 2.67 2.813.1
2.81 2.73 2.84
-15%
-10%
-5%
0%
5%
10%
15%
0
0.5
1
1.5
2
2.5
3
3.5
2005 2006 2007 2008 2009 2010 2011 2012 2013 2014 2015 2016 2017
YoYNights Average Lengths of Stay
Average Lengths of Stay Growth
Exhibit 6 : Average Lengths of Stay
5.56.23 6.32
7 7.65 8.048.8 9.44 9.73
11.52
14.04
15.8
0%
5%
10%
15%
20%
25%
0
5
10
15
2007 2008 2009 2010 2011 2012 2013 2014 2015 2016 2017 2018
YoYMilExhibit 5: Foreign Tourist Arrivals
Foreign Tourist Arrivals Growth
8.6 9.110.2 11.2 12.2
16.315
17
0
5
10
15
20
2011 2012 2013 2014 2015 2016 2017 2018
USD bil
Foreign Exchange Earnings

66
5. Recent Foreign Investors (Project Size In USD)1. China Railway Group Limited (CREC) – High Speed Rail in Indonesia (Jakarta –
Bandung)
1. Sept 2015 – Indonesia granted the rail venture to China.
2. Ongoing – Building the connection from Halim (Jakarta) to Tegalluar (Bandung) – USD5.5
billion.
2. Japan International Cooperation Agency (JICA) – High Speed Rail in Indonesia (Jakarta
– Surabaya)
1. Mar 2017 – Indonesian Government choose Japan as the accomplice for the rejuvenation
of the railroad associating Jakarta and Surabaya – USD4.4 billion.
3. DP World (Dubai) – Kuala Tanjung Port (USD2.5 billion)
1. 2015-2017 – First Stage : development multipurpose terminal.
2. 2018-2018 – Second Stage : improvement of 3000 hectares of a mechanical zone.
3. 2017-2019 – Third Stage : improvement of a compartment port and local location.
4. 2012-2023 – Fourth Stage : development of an incorporate mechanical zone or a port city.
4. Japan International Cooperation Agency (JICA) – Jakarta MRT (USD1.49 billion)
1. Mar 2019 – Phase 1 of undertaking was subsidized through a delicate advance from JICA
with a 30 years residency and 0.25% intrigue per annum.
2. Oct 2018 – JICA marked an arrangement to fund the MRT Phase 2. The loan fee is at 1%
with a 40-year residency.
Exhibit 7 : Projected Development of Jakarta MRT
Source : Indonesia Investment, Reuters, ABC News, The Jakarta Post, The Strait Times, Finance Detik
77
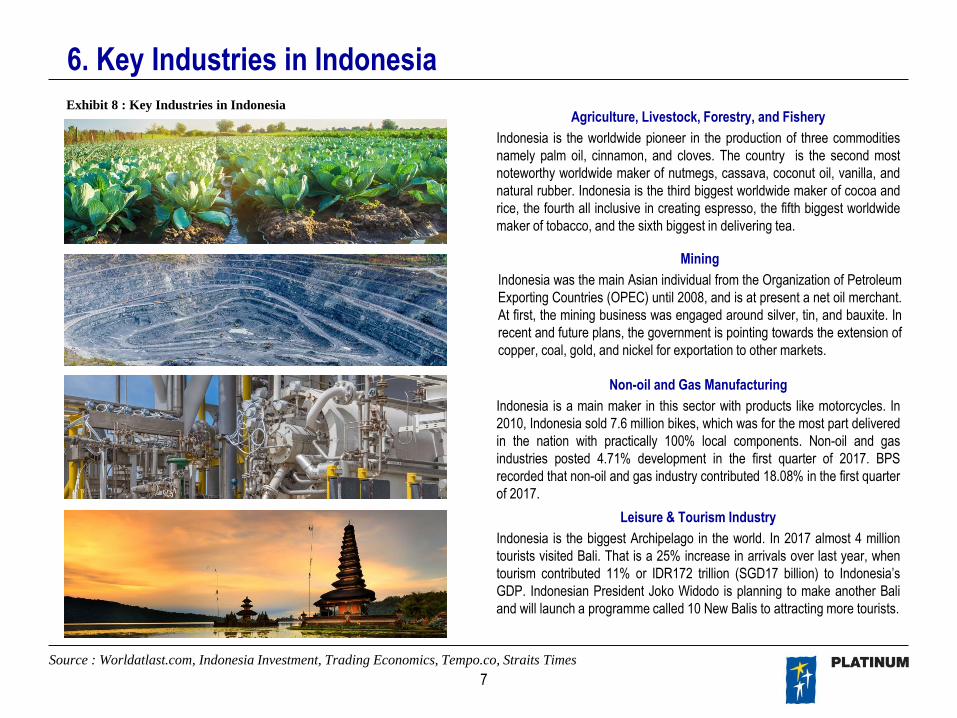
6. Key Industries in Indonesia
Agriculture, Livestock, Forestry, and Fishery
Indonesia is the worldwide pioneer in the production of three commodities
namely palm oil, cinnamon, and cloves. The country is the second most
noteworthy worldwide maker of nutmegs, cassava, coconut oil, vanilla, and
natural rubber. Indonesia is the third biggest worldwide maker of cocoa and
rice, the fourth all inclusive in creating espresso, the fifth biggest worldwide
maker of tobacco, and the sixth biggest in delivering tea.
Source : Worldatlast.com, Indonesia Investment, Trading Economics, Tempo.co, Straits Times
Mining
Indonesia was the main Asian individual from the Organization of Petroleum
Exporting Countries (OPEC) until 2008, and is at present a net oil merchant.
At first, the mining business was engaged around silver, tin, and bauxite. In
recent and future plans, the government is pointing towards the extension of
copper, coal, gold, and nickel for exportation to other markets.
Non-oil and Gas Manufacturing
Indonesia is a main maker in this sector with products like motorcycles. In
2010, Indonesia sold 7.6 million bikes, which was for the most part delivered
in the nation with practically 100% local components. Non-oil and gas
industries posted 4.71% development in the first quarter of 2017. BPS
recorded that non-oil and gas industry contributed 18.08% in the first quarter
of 2017.
Leisure & Tourism Industry
Indonesia is the biggest Archipelago in the world. In 2017 almost 4 million
tourists visited Bali. That is a 25% increase in arrivals over last year, when
tourism contributed 11% or IDR172 trillion (SGD17 billion) to Indonesia’s
GDP. Indonesian President Joko Widodo is planning to make another Bali
and will launch a programme called 10 New Balis to attracting more tourists.
Exhibit 8 : Key Industries in Indonesia
88
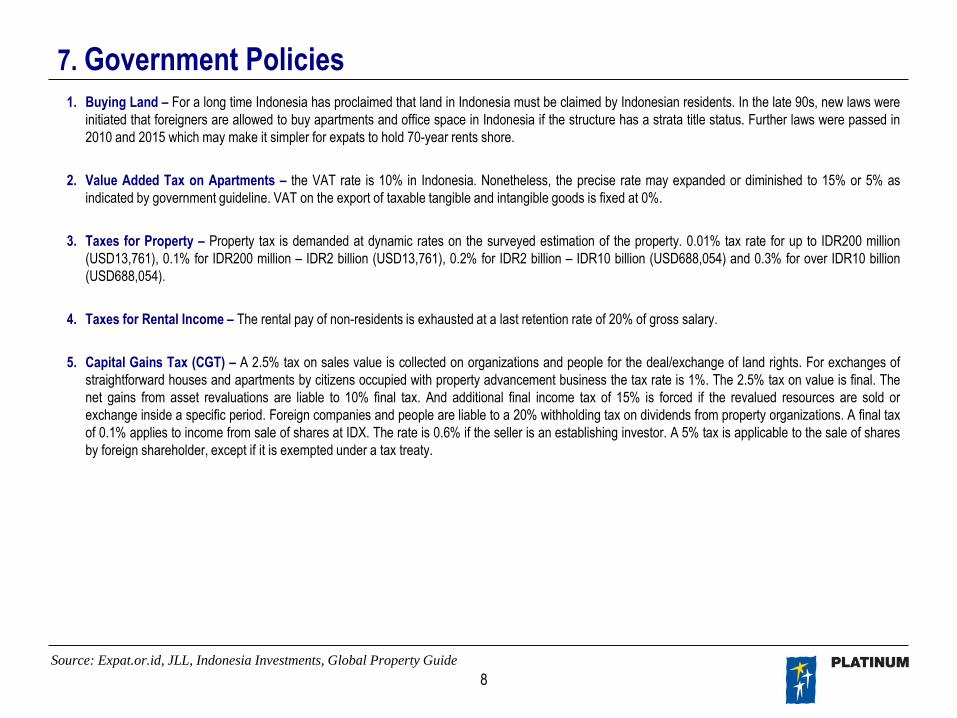
7. Government Policies1. Buying Land – For a long time Indonesia has proclaimed that land in Indonesia must be claimed by Indonesian residents. In the late 90s, new laws were
initiated that foreigners are allowed to buy apartments and office space in Indonesia if the structure has a strata title status. Further laws were passed in
2010 and 2015 which may make it simpler for expats to hold 70-year rents shore.
2. Value Added Tax on Apartments – the VAT rate is 10% in Indonesia. Nonetheless, the precise rate may expanded or diminished to 15% or 5% as
indicated by government guideline. VAT on the export of taxable tangible and intangible goods is fixed at 0%.
3. Taxes for Property – Property tax is demanded at dynamic rates on the surveyed estimation of the property. 0.01% tax rate for up to IDR200 million
(USD13,761), 0.1% for IDR200 million – IDR2 billion (USD13,761), 0.2% for IDR2 billion – IDR10 billion (USD688,054) and 0.3% for over IDR10 billion
(USD688,054).
4. Taxes for Rental Income – The rental pay of non-residents is exhausted at a last retention rate of 20% of gross salary.
5. Capital Gains Tax (CGT) – A 2.5% tax on sales value is collected on organizations and people for the deal/exchange of land rights. For exchanges of
straightforward houses and apartments by citizens occupied with property advancement business the tax rate is 1%. The 2.5% tax on value is final. The
net gains from asset revaluations are liable to 10% final tax. And additional final income tax of 15% is forced if the revalued resources are sold or
exchange inside a specific period. Foreign companies and people are liable to a 20% withholding tax on dividends from property organizations. A final tax
of 0.1% applies to income from sale of shares at IDX. The rate is 0.6% if the seller is an establishing investor. A 5% tax is applicable to the sale of shares
by foreign shareholder, except if it is exempted under a tax treaty.
Source: Expat.or.id, JLL, Indonesia Investments, Global Property Guide
99
Appendices

1010
App 1 – [10 Year Relative Performance IDR to USD]
Source: Bloomberg

1111
App 2 – [International Airports]1. Indonesian Airports
1. Indonesia currently has 24 airports spread throughout Java, 40 airports throughout Sumatra, 22 airports throughout Kalimantan, 19 airports throughout
Sulawesi, 17 airports throughout Lesser Sunda Islands, 16 airports throughout Maluku Islands, and 17 airports throughout Papua.
2. Soekarno-Hatta International Airport (CGK) is the major airport in Indonesia, located at Tangerang City, Banten.
3. Kertajati International Airport (KJT) is the largest international airport of Indonesia, opened in 2018, located at Majalengka, West Java .
2. Indonesia Current Passenger Movements
1. In 2012, Jakarta’s Soekarno-Hatta International Airport was the world’s ninth busiest airport and the third busiest in Asia, served 66.9 million
passengers in 2018.
2. Bali is served by Ngurah Rai International Airport, presently the nation’s second busiest airplane terminal, found south of Denpasar and served 23.8
million passengers in 2018.
3. Surabaya’s Juanda International Airport is the nation’s third busiest airport and served 20.2 million passengers in 2018.
3. Indonesia Recent Airports Development
1. West Java International Airport in Majalengka, West Java – Completed in 2018
2. Aji Pangeran Tumenggung International Airport in Samarinda, East Kalimantan – Completed in 2018
3. Letung Airport in Anambas Islands Regency, Riau Archipelago – Completed in 2018
4. Maratua Airport in Derawan Islands, East Kalimantan – Completed in 2017
5. Miangas Airport in Miangas Islands, North Sulawesi – Completed in 2017
6 . Werur Airport in Tambrauw, West Papua – Completed in 2018
7. Tebelian Airport in Sintang, West Kalimantan – Completed in 2018
8. Maleo Airport in Morowali, Central Sulawesi – Completed in 2018
9. Namniwel Airport in Buru Islands, Maluku – Completed in 2017
10. Koroway Batu Airport in Boven Digul, Papua – Completed in 2017
11. Buntu Kunik Airport in Tana Toraja, South Sulawesi – Completed in 2019
12. Pantar Airport in Alor, East Nusa Tenggara – Completed in 2019
13. Pihise Airport in Sitaro, North Sulawesi – Completed in 2019
14. Beringin Airport in Muara Teweh, Central Kalimantan – Completed in 2019
15. Tambelan Airport in Bintan, Riau Archipelago – Completed in 2019
Source : Indonesia Travel, RedDoorz
1212
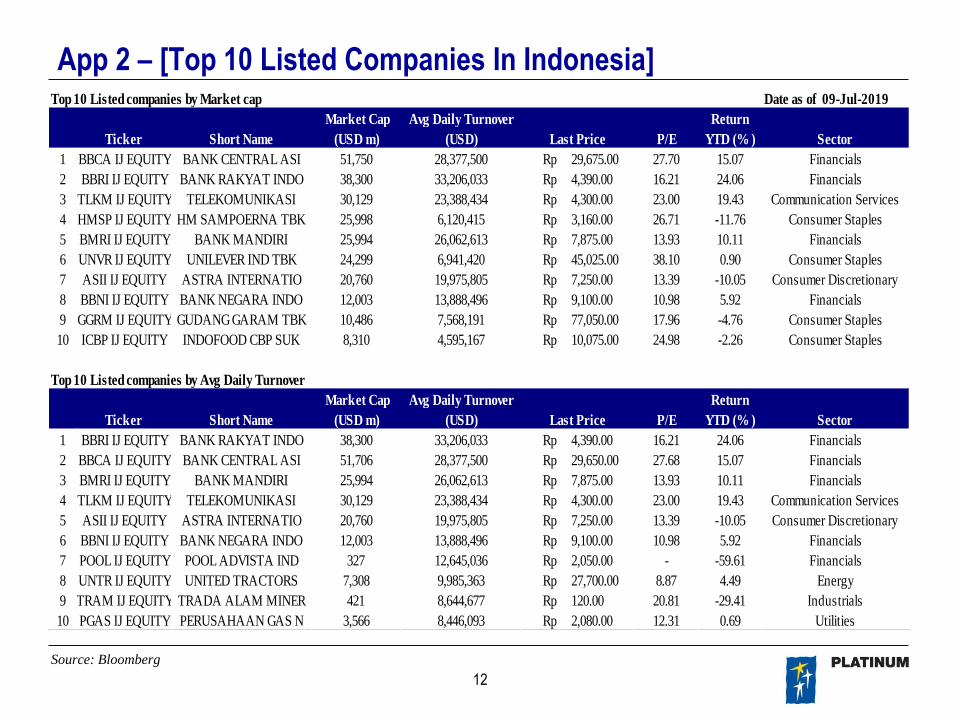
App 2 – [Top 10 Listed Companies In Indonesia]
Source: Bloomberg
Top 10 Listed companies by Market cap Date as of 09-Jul-2019
Market Cap Avg Daily Turnover Return
Ticker Short Name (USD m) (USD) Last Price P/E YTD (% ) Sector
1 BBCA IJ EQUITY BANK CENTRAL ASI 51,750 28,377,500 Rp 29,675.00 27.70 15.07 Financials
2 BBRI IJ EQUITY BANK RAKYAT INDO 38,300 33,206,033 Rp 4,390.00 16.21 24.06 Financials
3 TLKM IJ EQUITY TELEKOMUNIKASI 30,129 23,388,434 Rp 4,300.00 23.00 19.43 Communication Services
4 HMSP IJ EQUITY HM SAMPOERNA TBK 25,998 6,120,415 Rp 3,160.00 26.71 -11.76 Consumer Staples
5 BMRI IJ EQUITY BANK MANDIRI 25,994 26,062,613 Rp 7,875.00 13.93 10.11 Financials
6 UNVR IJ EQUITY UNILEVER IND TBK 24,299 6,941,420 Rp 45,025.00 38.10 0.90 Consumer Staples
7 ASII IJ EQUITY ASTRA INTERNATIO 20,760 19,975,805 Rp 7,250.00 13.39 -10.05 Consumer Discretionary
8 BBNI IJ EQUITY BANK NEGARA INDO 12,003 13,888,496 Rp 9,100.00 10.98 5.92 Financials
9 GGRM IJ EQUITY GUDANG GARAM TBK 10,486 7,568,191 Rp 77,050.00 17.96 -4.76 Consumer Staples
10 ICBP IJ EQUITY INDOFOOD CBP SUK 8,310 4,595,167 Rp 10,075.00 24.98 -2.26 Consumer Staples
Top 10 Listed companies by Avg Daily Turnover
Market Cap Avg Daily Turnover Return
Ticker Short Name (USD m) (USD) Last Price P/E YTD (% ) Sector
1 BBRI IJ EQUITY BANK RAKYAT INDO 38,300 33,206,033 Rp 4,390.00 16.21 24.06 Financials
2 BBCA IJ EQUITY BANK CENTRAL ASI 51,706 28,377,500 Rp 29,650.00 27.68 15.07 Financials
3 BMRI IJ EQUITY BANK MANDIRI 25,994 26,062,613 Rp 7,875.00 13.93 10.11 Financials
4 TLKM IJ EQUITY TELEKOMUNIKASI 30,129 23,388,434 Rp 4,300.00 23.00 19.43 Communication Services
5 ASII IJ EQUITY ASTRA INTERNATIO 20,760 19,975,805 Rp 7,250.00 13.39 -10.05 Consumer Discretionary
6 BBNI IJ EQUITY BANK NEGARA INDO 12,003 13,888,496 Rp 9,100.00 10.98 5.92 Financials
7 POOL IJ EQUITY POOL ADVISTA IND 327 12,645,036 Rp 2,050.00 - -59.61 Financials
8 UNTR IJ EQUITY UNITED TRACTORS 7,308 9,985,363 Rp 27,700.00 8.87 4.49 Energy
9 TRAM IJ EQUITY TRADA ALAM MINER 421 8,644,677 Rp 120.00 20.81 -29.41 Industrials
10 PGAS IJ EQUITY PERUSAHAAN GAS N 3,566 8,446,093 Rp 2,080.00 12.31 0.69 Utilities

1313
App 3 – [Regional Snapshot]
Source : World Population Review, Badan Pusat Statistik
Top 10 Regional Demographics
Top 10 Gross Regional Domestic Product (In IDR)

1414
This page is intentionally left blank
1515
DisclaimerDISCLOSURE OF INTERESTS
Terms not expressly defined have the meanings given to them in the Code of Conduct for Persons Licensed by or Registered with the Securities and Futures Commission.
Analyst Compensation: No part of the compensation of the analyst(s) who prepared this document was, is or will be directly or indirectly related to the analysis, comments or recommendations stated
in this document. The compensation of such analyst(s) is not directly linked to any specific investment banking transaction of Platinum (which collectively refers to Access Investment Management
(H.K.) Limited, Platinum Broking Company Limited and Platinum Securities Company Limited).
Analyst Relationships: The analyst(s) who prepared this document and the associates of such analyst(s) do not serve as an officer of an issuer or new listing applicant reviewed by such analyst(s).
Analyst Financial Interests: The analyst(s) who prepared this document and the associates of such analyst(s) do not have any financial interests in relation to an issuer or new listing applicant
reviewed by such analyst(s).
Market Making: Platinum does not make a market in the securities of any issuer reviewed in this document and will not make a market in the securities of any new listing applicant reviewed in this
document.
Firm Financial Interests: On the date of publication of this document, Platinum does not have financial interests in relation to: (i) any issuer reviewed in this document in an amount equal to or more
than 1% of the market capitalisation of such issuer; or (ii) any new listing applicant reviewed in this document in an amount equal to or more than 1% of the new listing applicant’s issued share capital,
or issued units, as applicable.
Investment Banking Relationship: Platinum does not have an investment banking relationship with any issuer or listing applicant reviewed in this document.
Relevant Relationships: On the date of publication of this document, no individual employed by or associated with Platinum serves as an officer of an issuer or new listing applicant reviewed in this
document.
General Disclaimer
This document is prepared, produced and published by Platinum Broking Company Limited. Platinum Broking Company Limited is a licensed corporation registered with the Hong Kong Securities
and Futures Commission. This document is for distribution in Hong Kong and in other jurisdictions only to the extent permissible by applicable law. This document is intended for information
purposes only, and may be subject to change without further notice. This document is not an offer or a solicitation of an offer to buy or sell any securities or financial instruments in any country or
jurisdiction. This document is not to be relied upon by any person in making any investment decision or otherwise dealing in the securities mentioned, as it does not take into account the specific
investment objectives, financial situation or needs of any person. Investors should consider whether the analysis and recommendations in this document are suitable for their particular circumstances
and, if appropriate, seek independent professional advice. While we have endeavoured to ensure the information in this document is true and up-to-date at the time of publication, we cannot guarantee
its accuracy, timeliness and completeness. The price and value of the securities referred to in this document may fluctuate. Past performance is not a guide to future performance, future returns are not
guaranteed, and a loss of original capital may occur. Opinions expressed in this document are subject to change without notice. Neither Platinum Broking Company Limited, nor any of its holding or
affiliated companies, nor any of its or their directors or employees (collectively, the “Platinum Group”), represent or warrant the accuracy, timeliness or completeness of the information in this
document, and will not accept any responsibility or liability for any use of or reliance upon any of the contents of this document. The Platinum Group is under no obligation to update the information
in this document. The use of any information herein is at the sole discretion and risk of investors. This document has not been reviewed or authorised by any regulatory authority in Hong Kong or
elsewhere.
Any opinions expressed in this document may differ or be contrary to opinions or investment strategies expressed orally or in written form by sales persons, dealers and other professional executives of
the Platinum Group. The Platinum Group may from time to time have positions in, and may effect transactions in, securities mentioned in this document.
This document is produced and published by Platinum Broking Company Limited
Hong Kong Office: 21/F LHT Tower, 31 Queen’s Road Central, Hong Kong
Telephone: 852-2841-7000 Fax: 852-2522-3500
Website: www.Platinum-Asia.com/ and http://www.accessfunds.com/
© 2019 Platinum Broking Company Limited. All rights reserved. This publication may not be reproduced, distributed or published by any person for any purpose without the prior express consent of
Platinum Broking Company Limited.