Why habitat/water quality models? To map/predict current and future species assemblages, status To...
26
Why habitat/water quality models? • To map/predict current and future species assemblages, status • To project future status of species and habitats under alternative management strategies, environmental conditions • To explore linkages between habitat condition, water quality, and species status Ruckelshaus, Tim Beechie, Lance Garrison, Josh Now
-
Upload
lucas-barton -
Category
Documents
-
view
214 -
download
0
Transcript of Why habitat/water quality models? To map/predict current and future species assemblages, status To...
Why habitat/water quality models?
• To map/predict current and future species assemblages, status
• To project future status of species and habitats under alternative management strategies, environmental conditions
• To explore linkages between habitat condition, water quality, and species status
Mary Ruckelshaus, Tim Beechie, Lance Garrison, Josh Nowlis
Habitat approaches to ecosystem(ish) modeling
• Statistical associations between species and habitats
• Spatial modeling of habitat-forming process functioning and potential impacts of toxics
• Linked mechanistic models of climate -->land use/hydrology-->species dynamics
• Under development: full ecosystem models including effects habitat change on other ecosystem components; linking watershed models to marine
Statistical associations between species and habitats
The primary goal of habitat modeling is to provide spatially explicitestimation of species occurrences to:
1) Improve accuracy and precision of abundance estimates
2) Predict occurrence outside of surveyed times and areas
3) Improve evaluation of risks due to human activities
4) Define habitat boundaries for the purposes of designation under ESA
Some applications of these approaches:What are the localized effects of military operations ?What are the risks of vessel-whale interactions in different areas ?Where are the areas of overlap between fisheries and mammals ?Where should protected areas be located?
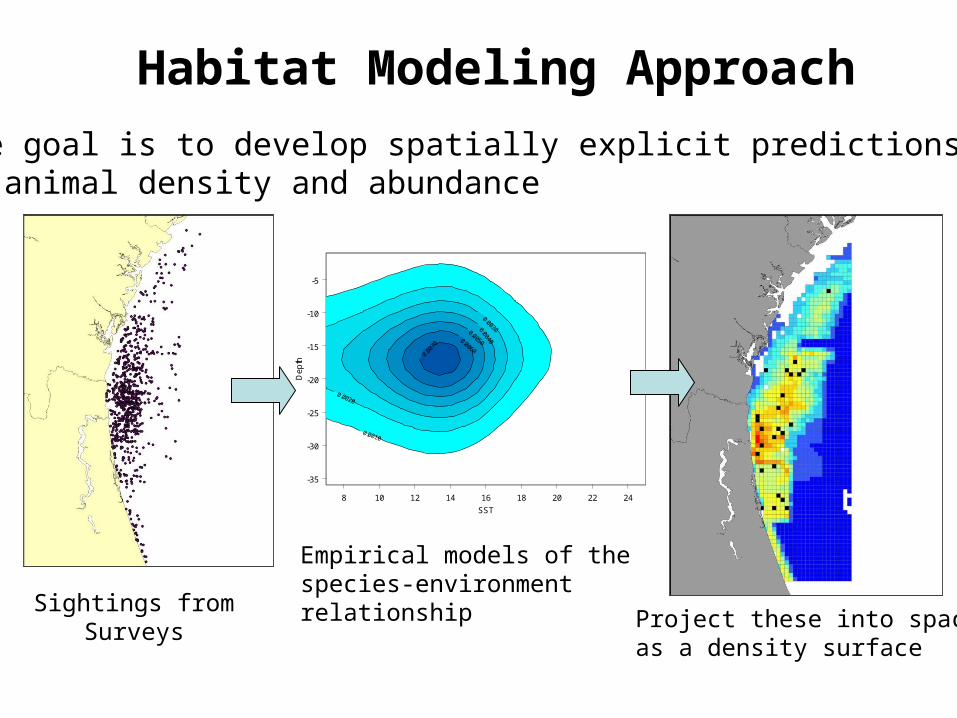
Habitat Modeling ApproachThe goal is to develop spatially explicit predictionsof animal density and abundance
8 10 12 14 16 18 20 22 24
SST
-35
-30
-25
-20
-15
-10
-5
De
pth
0.0010
0.0020
0.0030 0.0040
0.0050 0.0060
0.0
070
Sightings fromSurveys
Empirical models of the species-environmentrelationship Project these into space
as a density surface
Dec 1-15Dec 16-31Jan 1-15Jan 16-31Feb 1-14Feb 15-28Mar 1-15Mar 16-30
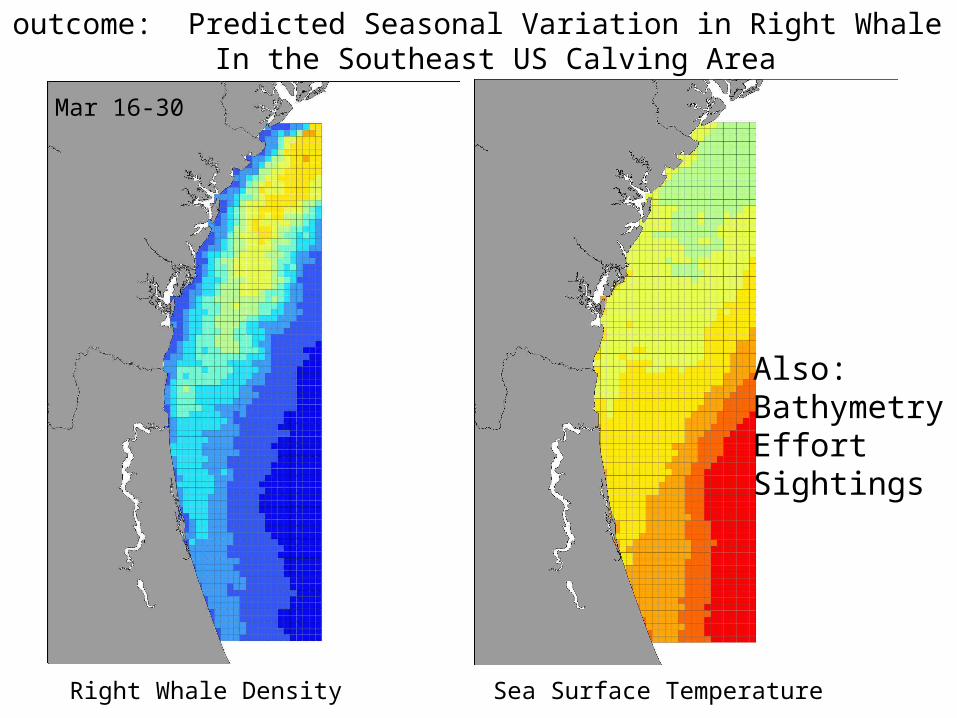
Example outcome: Predicted Seasonal Variation in Right Whale DensitiesIn the Southeast US Calving Area
Right Whale Density Sea Surface Temperature
Also: BathymetryEffortSightings
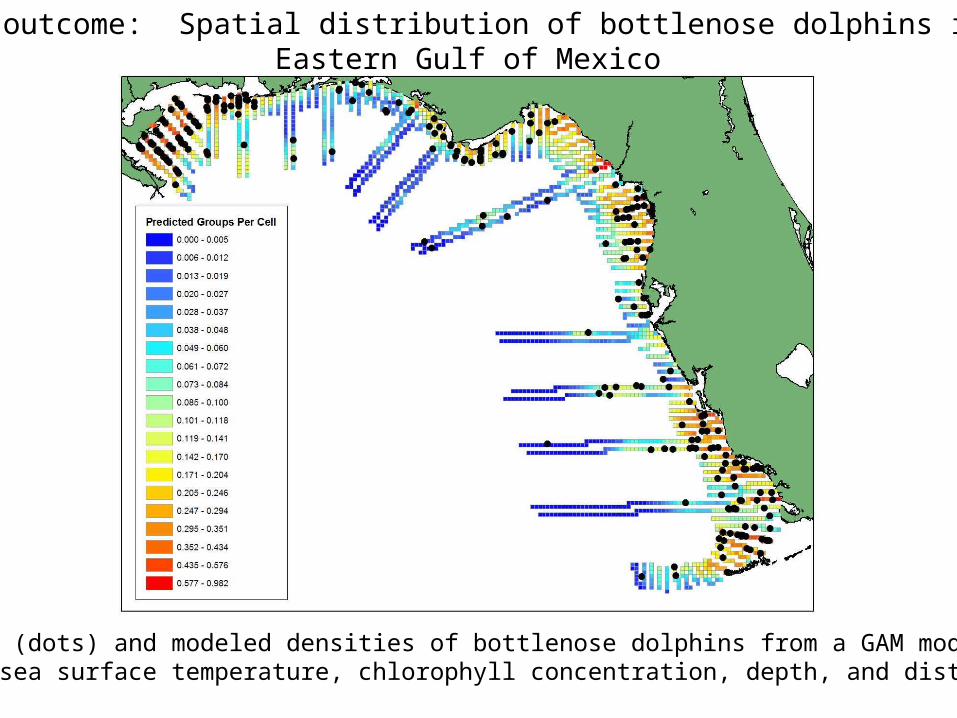
Example outcome: Spatial distribution of bottlenose dolphins in the Eastern Gulf of Mexico
Sightings (dots) and modeled densities of bottlenose dolphins from a GAM modelbased on sea surface temperature, chlorophyll concentration, depth, and distance from shore
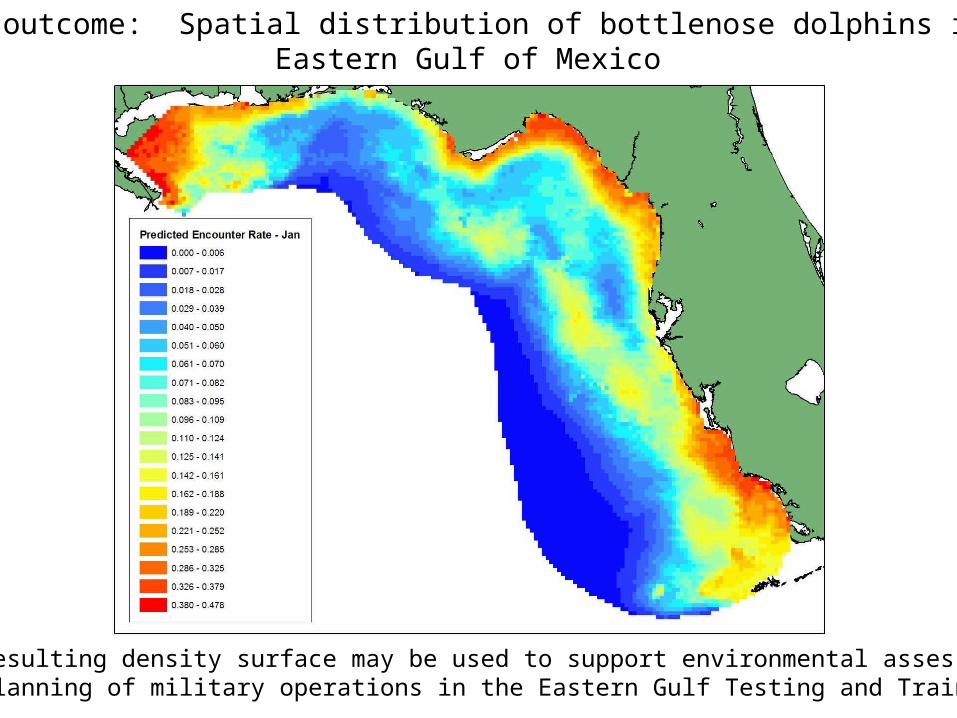
Example outcome: Spatial distribution of bottlenose dolphins in the Eastern Gulf of Mexico
The resulting density surface may be used to support environmental assessmentsand planning of military operations in the Eastern Gulf Testing and Training Range
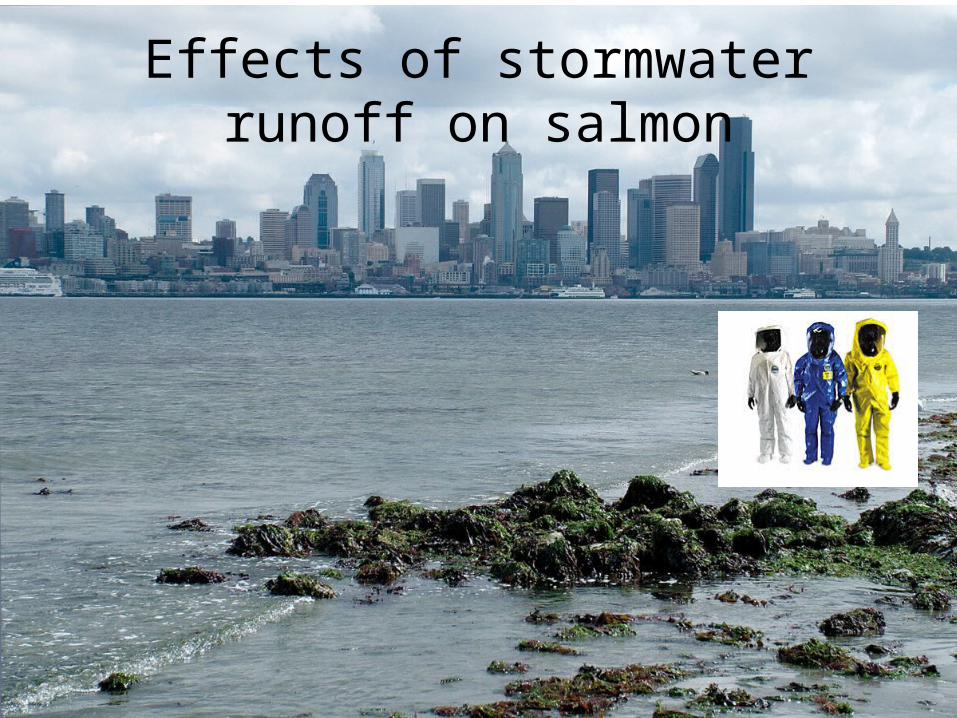
Effects of stormwater runoff on salmon
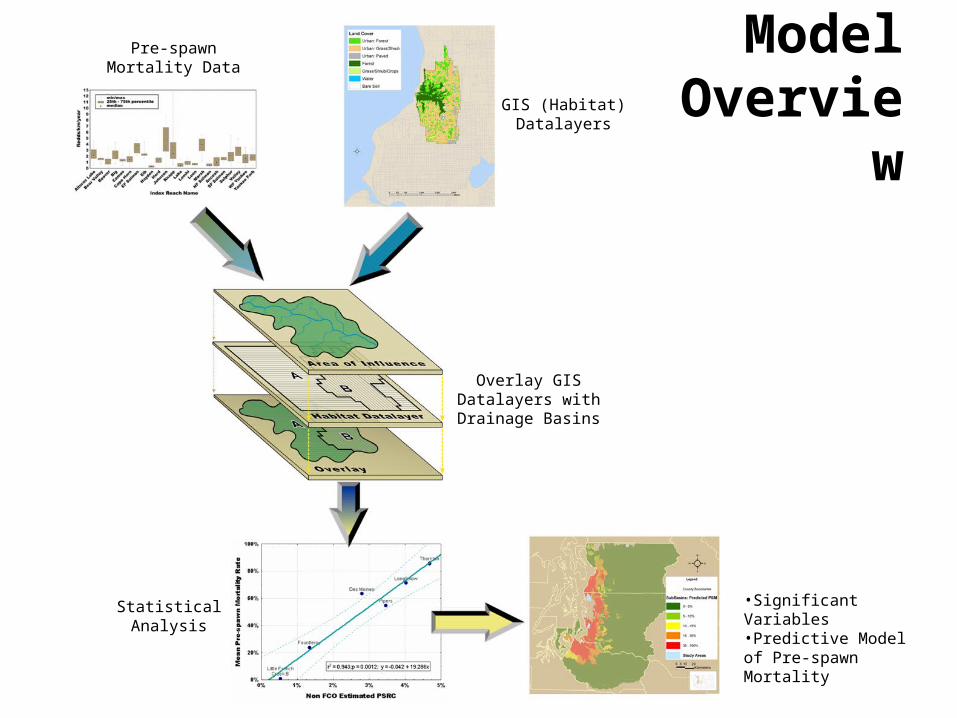
ModelOverview
Pre-spawnMortality Data
GIS (Habitat)Datalayers
Overlay GISDatalayers withDrainage Basins
StatisticalAnalysis
•Significant Variables•Predictive Model of Pre-spawn Mortality
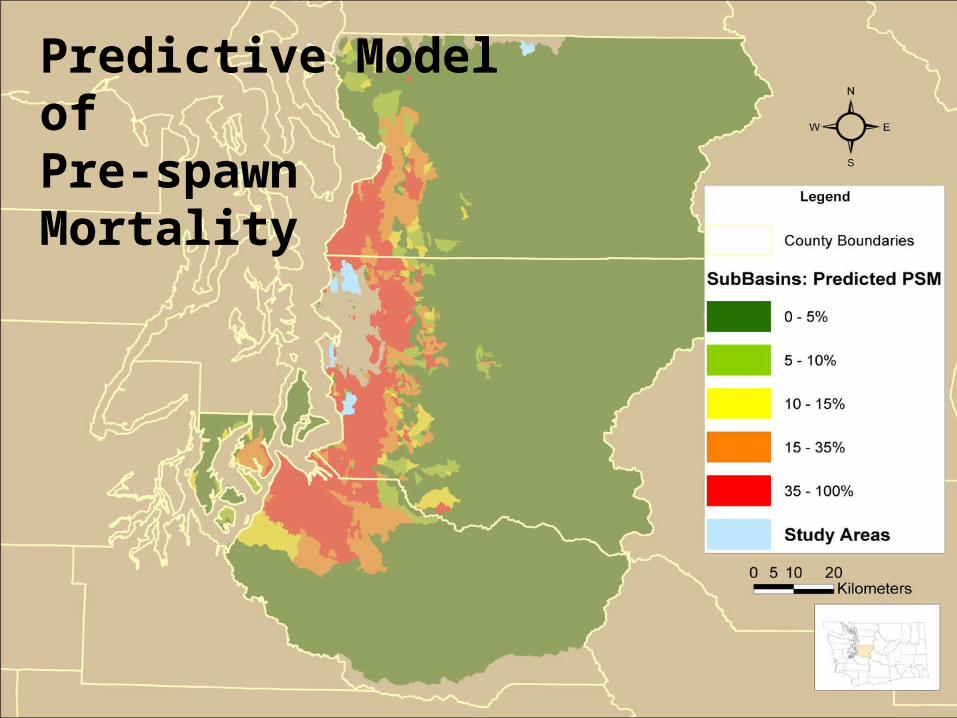
Predictive Model ofPre-spawn Mortality
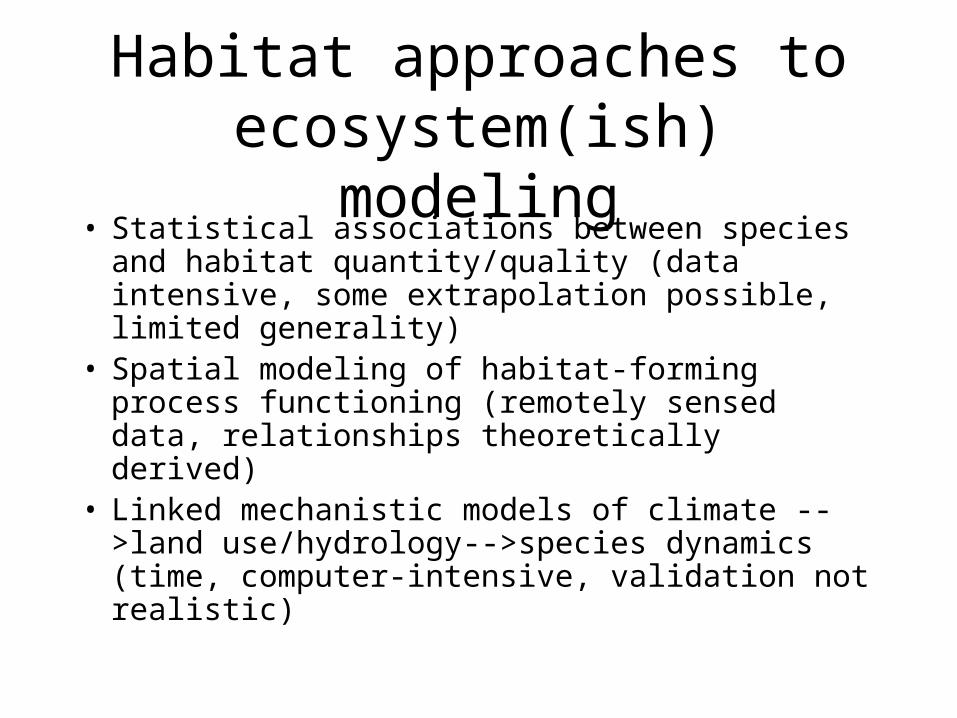
Habitat approaches to ecosystem(ish) modeling
• Statistical associations between species and habitat quantity/quality (data intensive, some extrapolation possible, limited generality)
• Spatial modeling of habitat-forming process functioning (remotely sensed data, relationships theoretically derived)
• Linked mechanistic models of climate -->land use/hydrology-->species dynamics (time, computer-intensive, validation not realistic)
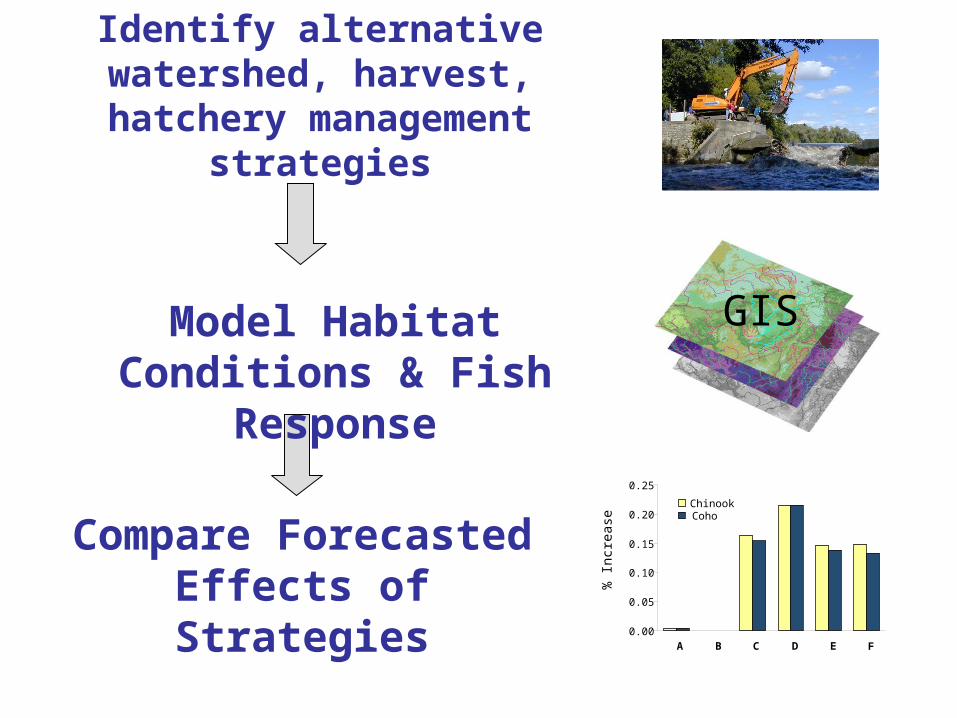
Identify alternative watershed, harvest,
hatchery management strategies
Compare Forecasted Effects of Strategies
0.00
0.05
0.10
0.15
0.20
0.25
A B C D E F
% In
crea
se
ChinookCoho
Model Habitat Conditions & Fish Response
GIS
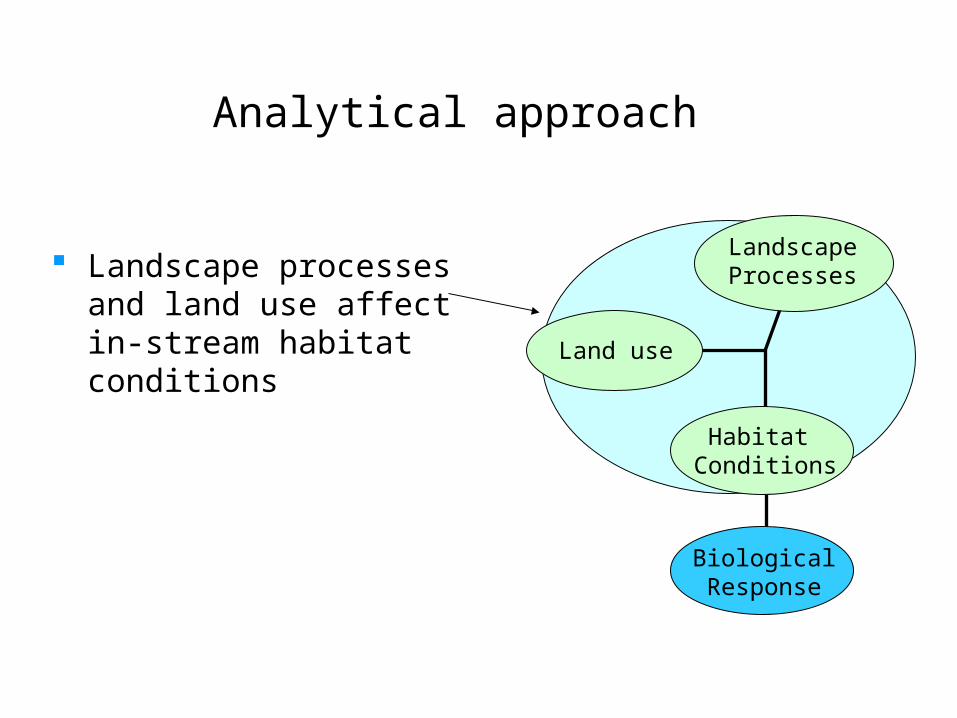
Analytical approach
Landscape processes and land use affect in-stream habitat conditions
LandscapeProcesses
Land use
Habitat Conditions
BiologicalResponse
100
100 100 100 100 94
97 96 95100
1001009998100
100 100 100 100 101
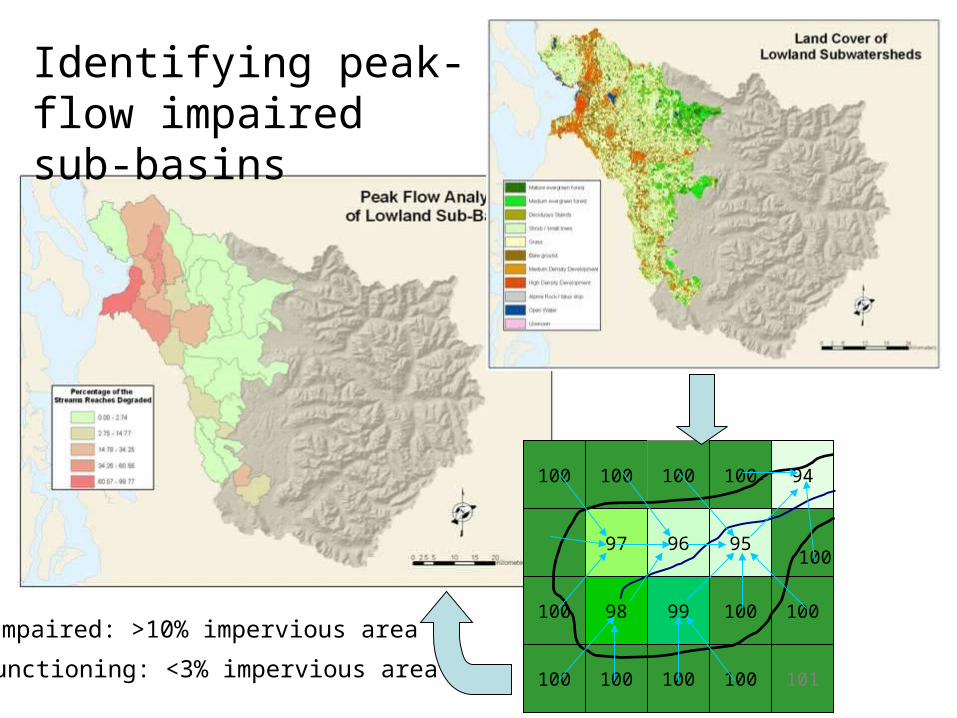
Identifying peak-flow impaired sub-basins
Impaired: >10% impervious area
Functioning: <3% impervious area
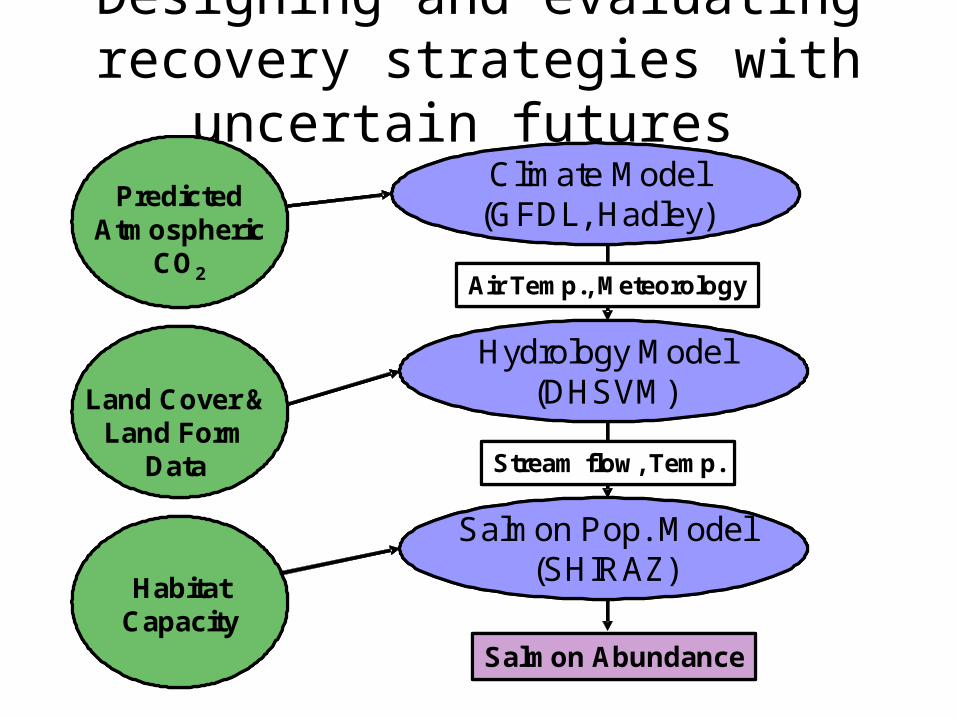
Designing and evaluating recovery strategies with uncertain futures
Climate Model(GFDL, Hadley)
Hydrology Model(DHSVM)
Air Temp., Meteorology
Salmon Pop. Model(SHIRAZ)
Stream flow, Temp.
Salmon Abundance
Land Cover & Land Form
Data
PredictedAtmospheric
CO2
Habitat Capacity
Climate Model(GFDL, Hadley)
Hydrology Model(DHSVM)
Air Temp., Meteorology
Salmon Pop. Model(SHIRAZ)
Stream flow, Temp.
Salmon Abundance
Land Cover & Land Form
Data
PredictedAtmospheric
CO2
Habitat Capacity
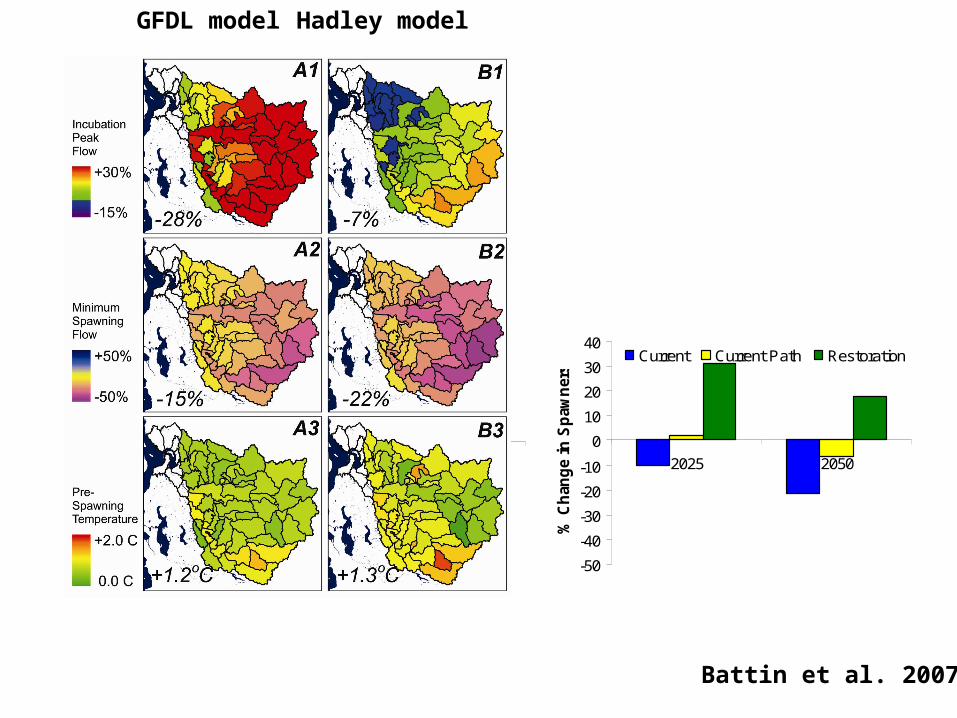
GFDL model Hadley model
Battin et al. 2007
-50
-40
-30
-20
-10
0
10
20
30
40
2025 2050
% C
han
ge
in S
paw
ner
s
Current Current Path Restoration
-50
-40
-30
-20
-10
0
10
20
30
40
2025 2050
% C
han
ge
in S
paw
ner
s
Current Current Path Restoration
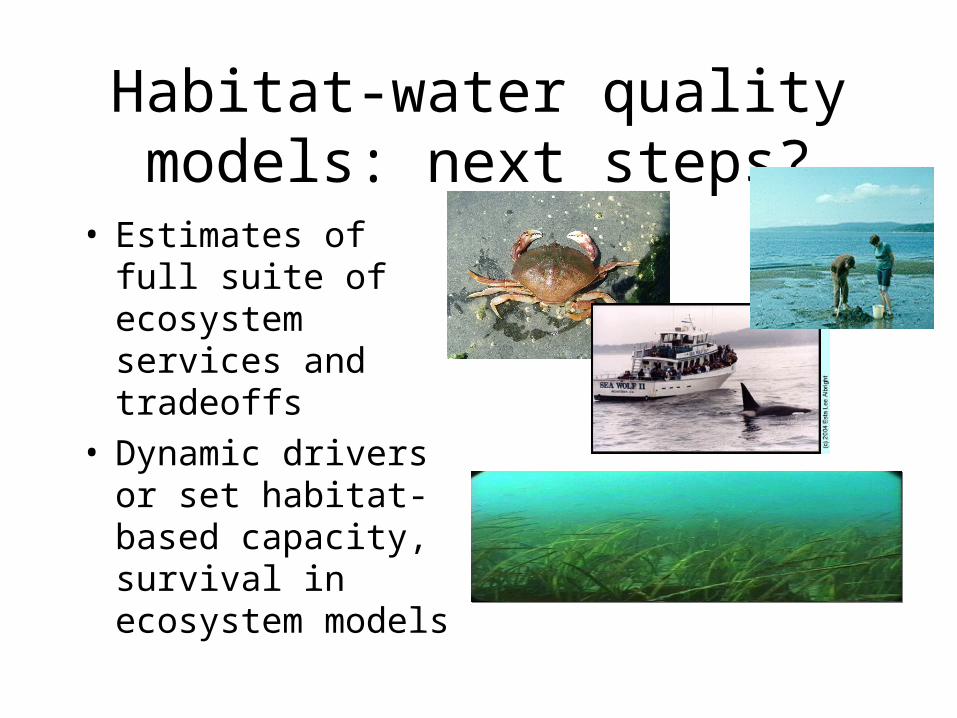
Habitat-water quality models: next steps?
• Estimates of full suite of ecosystem services and tradeoffs
• Dynamic drivers or set habitat-based capacity, survival in ecosystem models

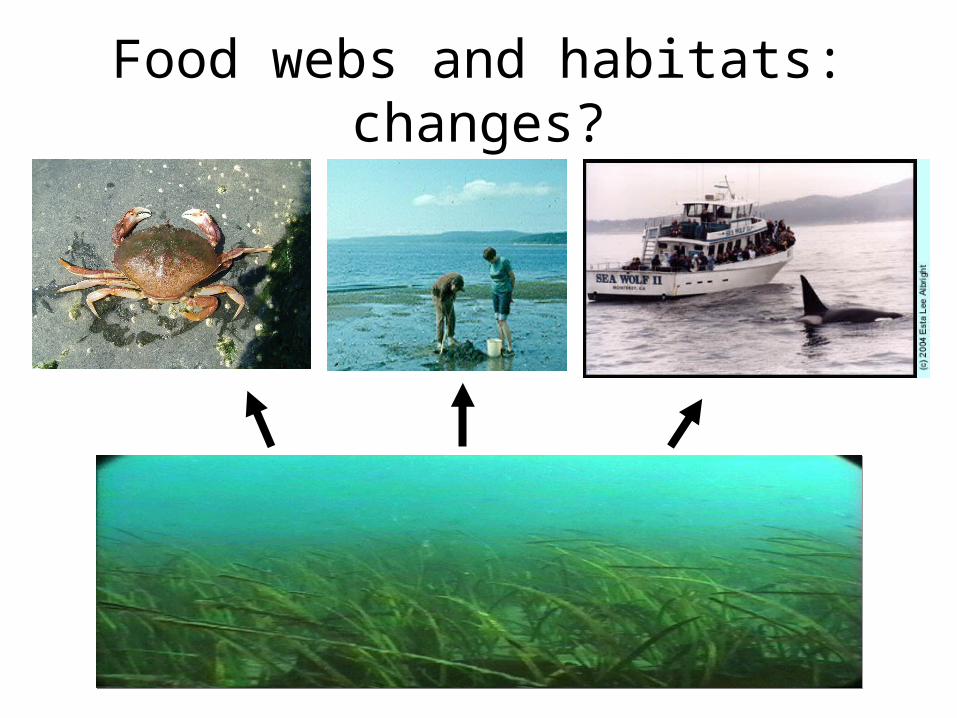
Food webs and habitats: changes?
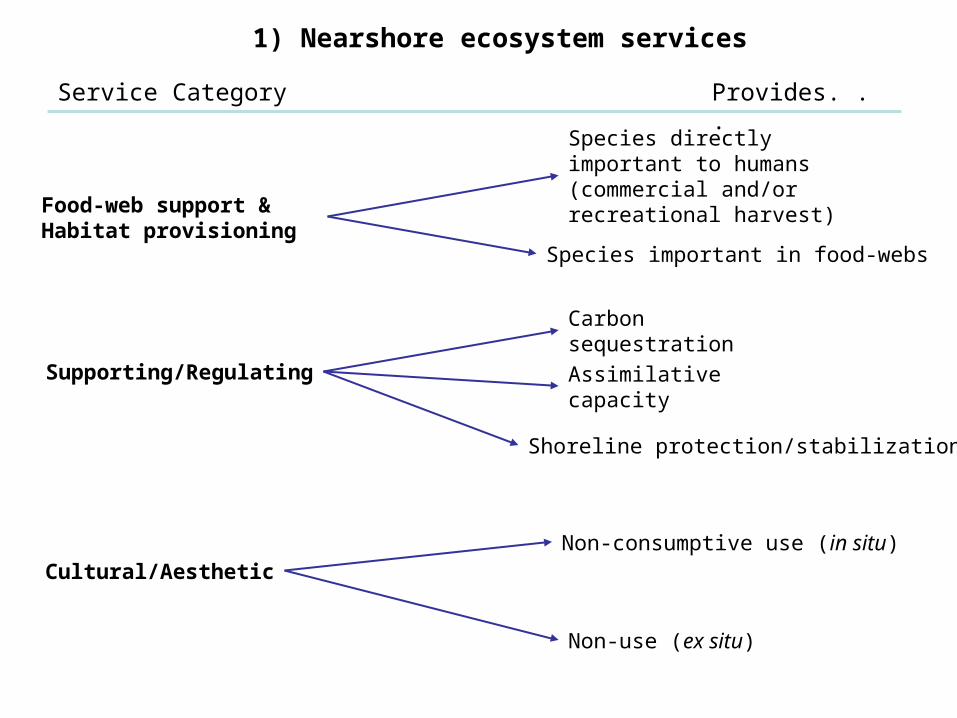
1) Nearshore ecosystem services
Food-web support & Habitat provisioning
Species directly important to humans (commercial and/or recreational harvest)
Species important in food-webs
Supporting/Regulating
Cultural/Aesthetic
Carbon sequestration
Non-consumptive use (in situ)
Non-use (ex situ)
Service Category Provides. . .
Shoreline protection/stabilization
Assimilative capacity
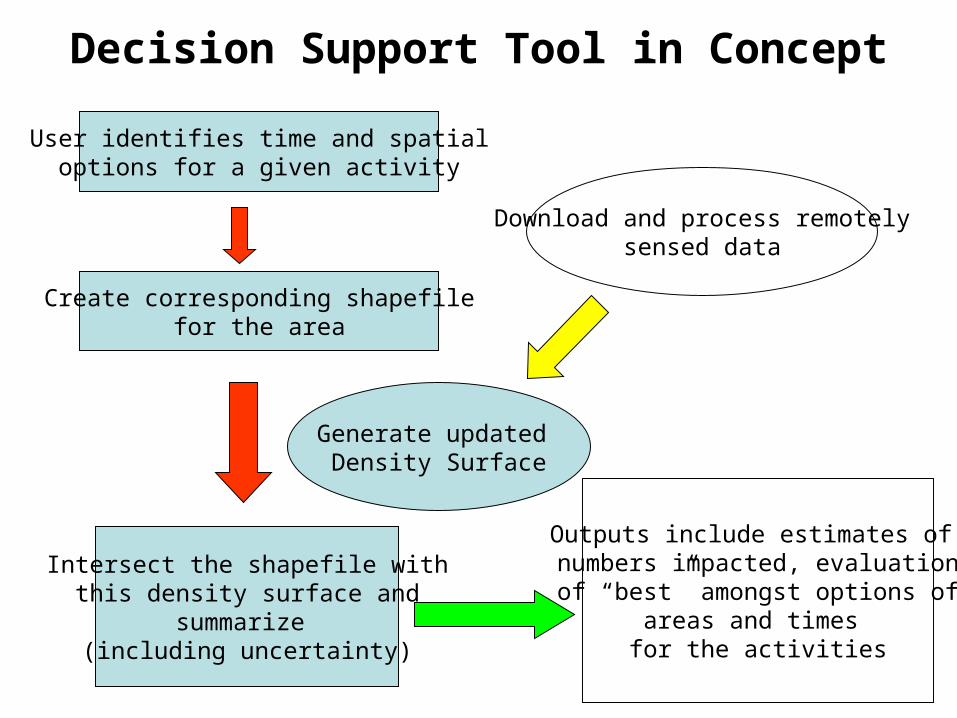
Decision Support Tool in Concept
User identifies time and spatialoptions for a given activity
Download and process remotelysensed data
Create corresponding shapefilefor the area
Generate updated Density Surface
Intersect the shapefile withthis density surface and
summarize (including uncertainty)
Outputs include estimates of numbers impacted, evaluationof “best” amongst options of
areas and times for the activities
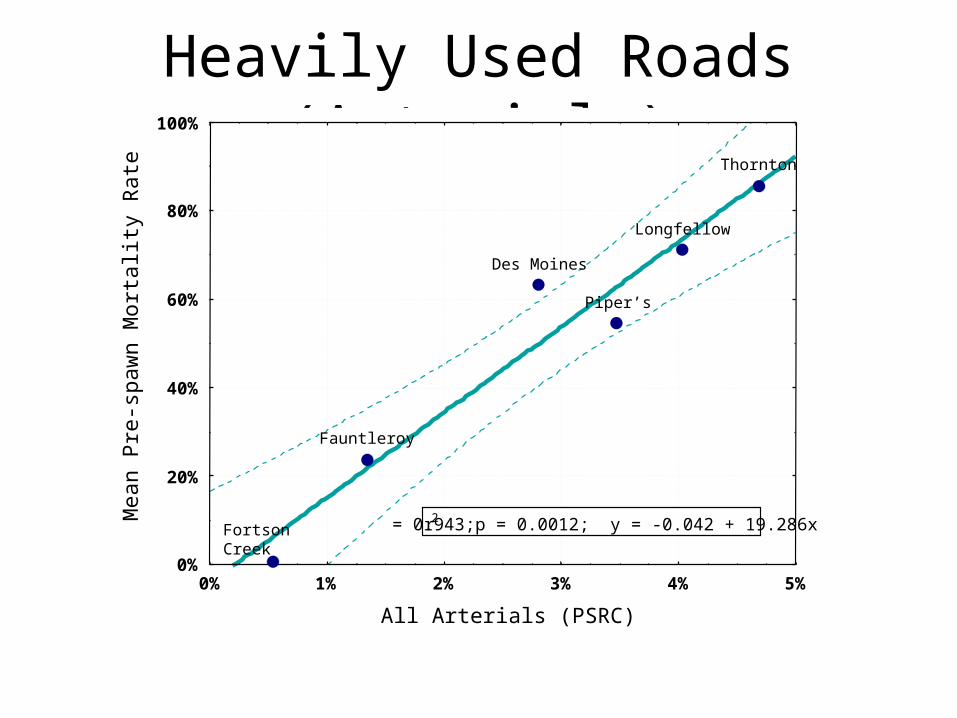
Heavily Used Roads (Arterials)
0% 1% 2% 3% 4% 5%
All Arterials (PSRC)
0%
20%
40%
60%
80%
100%M
ean P
re-s
paw
n M
ort
alit
y R
ate
r2 = 0.943;p = 0.0012; y = -0.042 + 19.286xFortsonCreek
Fauntleroy
Piper’s
Des Moines
Longfellow
Thornton

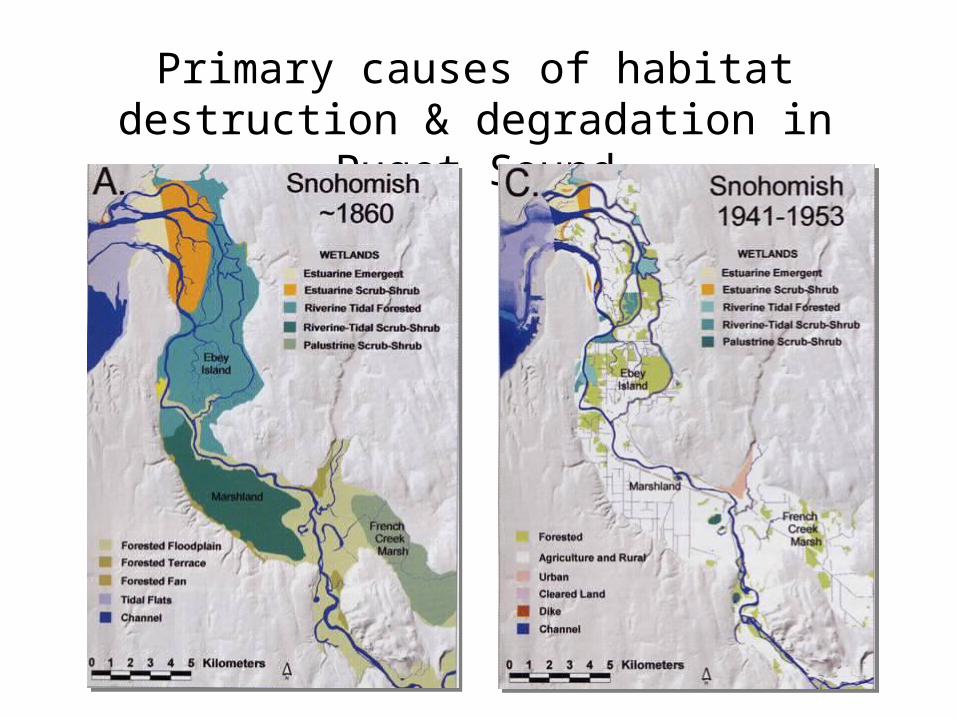
Primary causes of habitat destruction & degradation in Puget Sound
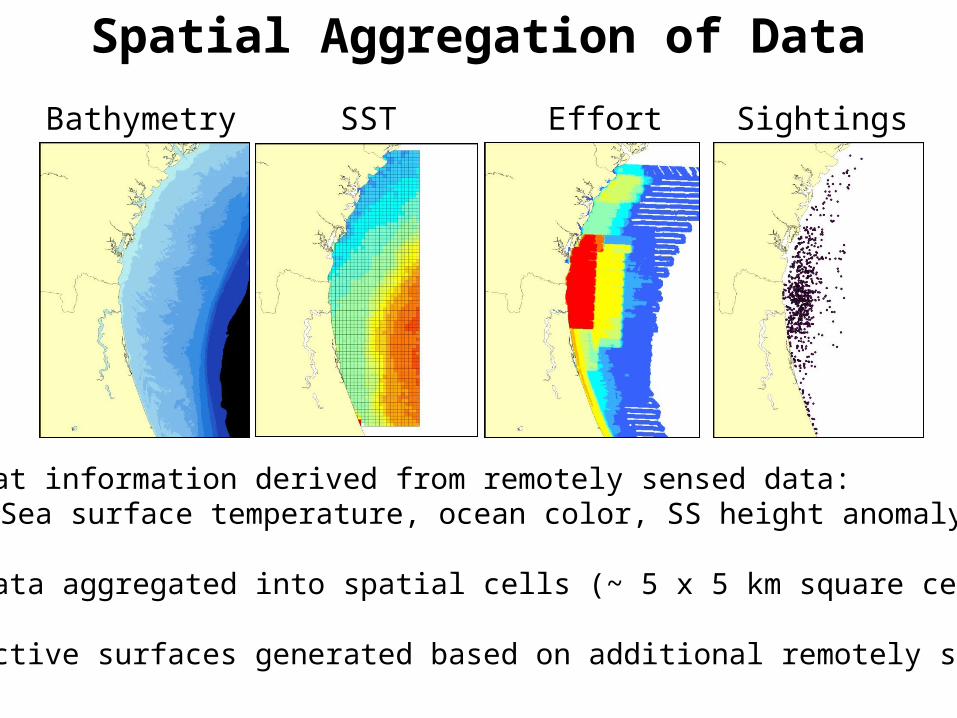
Spatial Aggregation of Data
Bathymetry SST Effort Sightings
Habitat information derived from remotely sensed data: Sea surface temperature, ocean color, SS height anomaly, winds
All data aggregated into spatial cells (~ 5 x 5 km square cells)
Predictive surfaces generated based on additional remotely sensed data
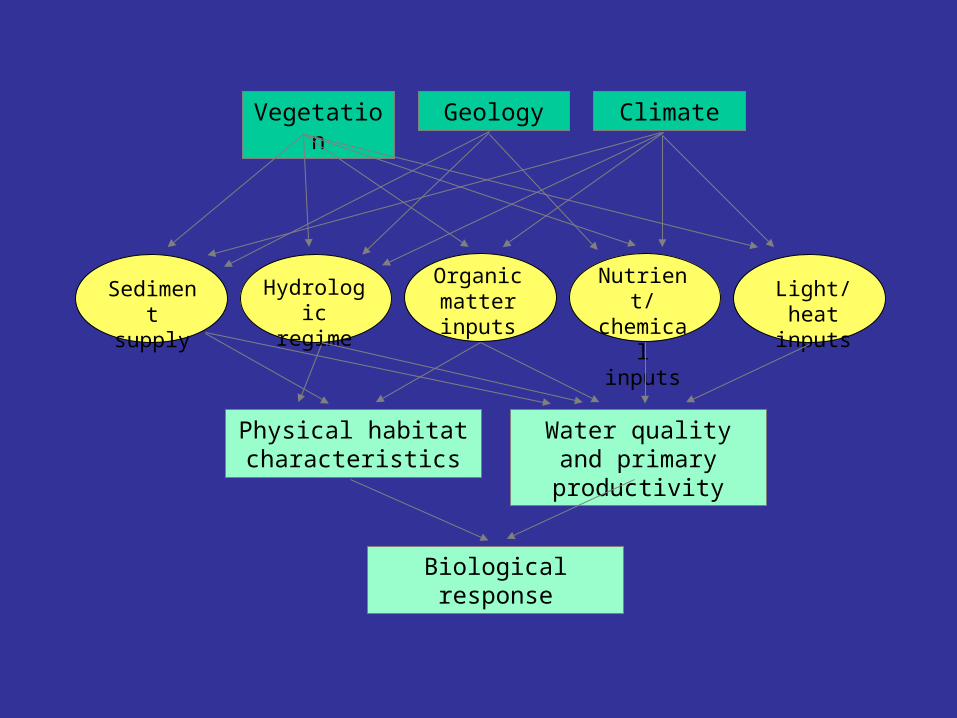
Vegetation Geology Climate
Light/heat inputs
Nutrient/chemical
inputs
Organic matter inputs
Hydrologic regime
Sediment supply
Physical habitat characteristics
Water quality and primary productivity
Biological response