Why does subsequence time-series clustering produce sine waves?
25
| 2006/09/19 | PKDD 2006 Tokyo Research Laboratory © Copyright IBM Corporation 2006 Why does subsequence time-series clustering produce sine waves? IBM Tokyo Research Lab. Tsuyoshi Idé
-
Upload
sigourney-sandoval -
Category
Documents
-
view
40 -
download
1
description
Why does subsequence time-series clustering produce sine waves?. IBM Tokyo Research Lab. Tsuyoshi Idé. Contents. What is subsequence time-series clustering? Describing the dependence between subsequences Reducing k-means to eigen problem Deriving sine waves Experiments - PowerPoint PPT Presentation
Transcript of Why does subsequence time-series clustering produce sine waves?

| 2006/09/19 | PKDD 2006
Tokyo Research Laboratory
© Copyright IBM Corporation 2006
Why does subsequence time-series clustering produce sine waves?
IBM Tokyo Research Lab.Tsuyoshi Idé
| 2006/09/19 | PKDD 2006Page 2
Tokyo Research Laboratory
© Copyright IBM Corporation 2006
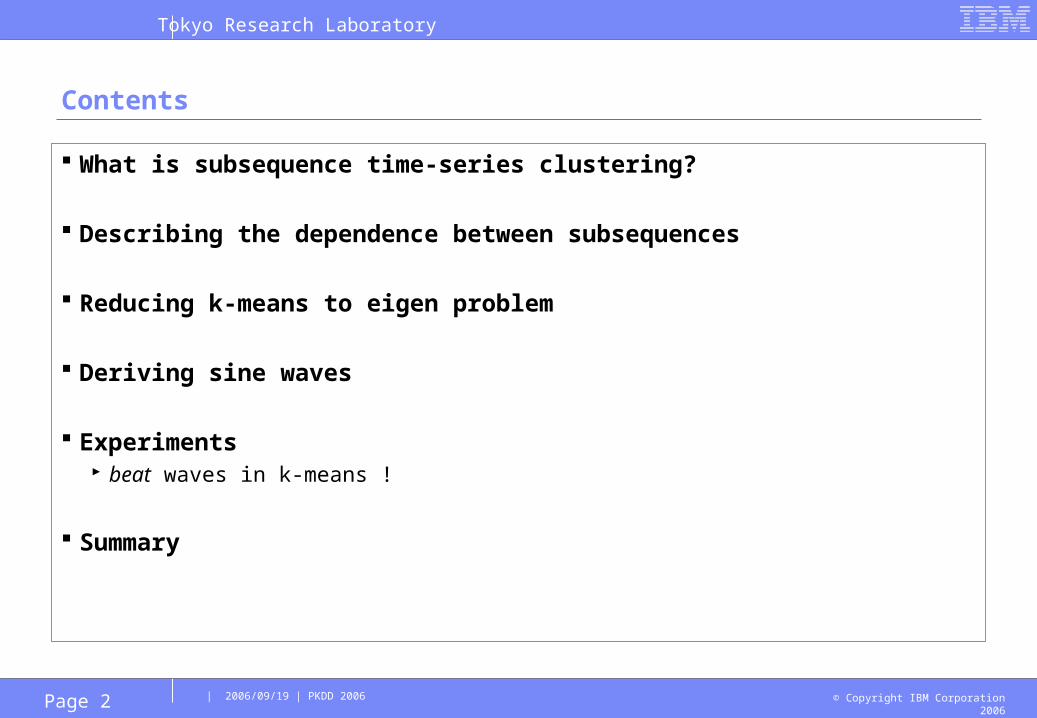
Contents
What is subsequence time-series clustering?
Describing the dependence between subsequences
Reducing k-means to eigen problem
Deriving sine waves
Experiments beat waves in k-means !
Summary
| 2006/09/19 | PKDD 2006Page 3
Tokyo Research Laboratory
© Copyright IBM Corporation 2006
What is subsequence time-series clustering (STSC)?

| 2006/09/19 | PKDD 2006Page 4
Tokyo Research Laboratory
© Copyright IBM Corporation 2006
What’s STSC : k-means clustering of subsequences generated from a time series. Cluster centers are patterns discovered.
subsequences generated by sliding window techniques
subsequences are treated as independent data objects in k-means clustering
Cluster centers (centroids)(the average of cluster members)
extracted pattern
......
...

| 2006/09/19 | PKDD 2006Page 5
Tokyo Research Laboratory
© Copyright IBM Corporation 2006
What’s sinusoid effect : unexpectedly, cluster centers in STSC become sinusoids. The reason is unknown.
Shocking report Keogh-Lin-Truppel, “Clustering of time series s
ubsequences is meaningless”, ICDM ’03
k-means STSC almost always produces sinusoid cluster centers
almost independent of the input time series almost no relation to the original patterns
concatenate to produce a long time series
k-means STSC
Sinusoid cluster centers !
Explaining why is an open problem
We focus on explaining why.
Example
| 2006/09/19 | PKDD 2006Page 6
Tokyo Research Laboratory
© Copyright IBM Corporation 2006
Describing the dependence between subsequences

| 2006/09/19 | PKDD 2006Page 7
Tokyo Research Laboratory
© Copyright IBM Corporation 2006
In reality, the subsequences are NOT independent at all. We need to describe the dependence.
subsequences generated by sliding window techniques
subsequences are treated as independent data objects in clustering
Let us study how the subsequences are dependent.
?

| 2006/09/19 | PKDD 2006Page 8
Tokyo Research Laboratory
© Copyright IBM Corporation 2006
Theoretical model for time series: Think of a time series as a “state” on a periodic ring.
1t 2t nt
nx
},..,2,1|{ ntxt
1x 2x
Artificially assume the periodic boundary condition (PBC)
•Assign the value xl on each lattice points (sites) l.
•Attach the orthonormal basis to the sites.
•Think of the time series as an n-D vector.
2e1e
Whole time series
2e1e ne

| 2006/09/19 | PKDD 2006Page 9
Tokyo Research Laboratory
© Copyright IBM Corporation 2006
Each subsequence sp is concisely expressed using the translation operator
1n
ne
Definition of the translation operator
Ex. shifts e2 with l steps
“Make p steps backward and take the sites from 1st thru w-th”
we
1e w-dim vector w: window size

| 2006/09/19 | PKDD 2006Page 10
Tokyo Research Laboratory
© Copyright IBM Corporation 2006
Reducing k-means to eigen problem
Easer to analyze theoretically
Simple but theoretically a little difficult to handle

| 2006/09/19 | PKDD 2006Page 11
Tokyo Research Laboratory
© Copyright IBM Corporation 2006
Rewriting the objective of k-means using the indicator and the density matrix.
centroid
The objective function of k-means clustering
“density matrix”
We finally get
objective to find m (j)
Inserting the def of the centroid, and introducing an indicator u(j) as
otherwise
for
0
||/1)(T jjjp
CpC
us
objective to find u (j).

| 2006/09/19 | PKDD 2006Page 12
Tokyo Research Laboratory
© Copyright IBM Corporation 2006
So what? Minimizing E is equivalent to eigen equation. Our goal is to solve it and to show the solution to be sinusoidal.
Minimizing E is equivalent to the eigen equation:
Let us study the sinusoid effect as ’s eigen equation.
From the definition, it can be shown
centroideigenvector
H = …

| 2006/09/19 | PKDD 2006Page 13
Tokyo Research Laboratory
© Copyright IBM Corporation 2006
Deriving sine waves
By solving the eigen equation

| 2006/09/19 | PKDD 2006Page 14
Tokyo Research Laboratory
© Copyright IBM Corporation 2006
Mathematical feature of . The expression based on implies a translational symmetry. Fourier basis will simplify the problem.
By using , the rho matrix can be written as
This form suggests a (pseudo-) translational symmetry of the problem.
wave number
Translational invariant basis would be more natural
So, use the Fourier representation instead of the site representation
orthogonal transform
Window size
Summation of shifted ones

| 2006/09/19 | PKDD 2006Page 15
Tokyo Research Laboratory
© Copyright IBM Corporation 2006
When represented in the Fourier basis, is almost diagonal. Thus, the eigenstate is almost pure sinusoid.
Will be small when a fq is dominant.
power of a Fourier component fq
TheoremWhen a |fq| is dominant, the eigen state is well approximated by the sine waves with the wavelength of w/|q|, irrespective of the details of the input time series data.
If we take { fq } as the basis, it follows (after straightforward calculations)
| 2006/09/19 | PKDD 2006Page 16
Tokyo Research Laboratory
© Copyright IBM Corporation 2006
Experiments

| 2006/09/19 | PKDD 2006Page 17
Tokyo Research Laboratory
© Copyright IBM Corporation 2006
Let us see the correspondence between the two formulations using standard data sets.
k-means STSC
spectral STSC
k-means STSC
1. eigenvectors minimize the SoS objective
2. eigenvector centroid
3. dominant F.c. governs the eigenvectors

| 2006/09/19 | PKDD 2006Page 18
Tokyo Research Laboratory
© Copyright IBM Corporation 2006
[1/2] For data with no particular periodicities, the power concentrates at the longest wavelength w. Only this peak does matter in the centroids.
DFTK-means STSC centroids (k=3, w=128)
Spectral STSC centroids
The resulting centroids are almost independent of the tail of the spectrum.

| 2006/09/19 | PKDD 2006Page 19
Tokyo Research Laboratory
© Copyright IBM Corporation 2006
[2/2] STSC centroids become beat waves when a few neighboring |q| are dominant (k=2, w=60).
Concatenate 100 instances for each to make a long time series
|q| = 4, 5, 6 are dominant
Resulting sine waves exhibit beat wave by interference
K-means STSC centroids (k=2, w=60)
Spectral STSC centroids

| 2006/09/19 | PKDD 2006Page 20
Tokyo Research Laboratory
© Copyright IBM Corporation 2006
Summary
| 2006/09/19 | PKDD 2006Page 21
Tokyo Research Laboratory
© Copyright IBM Corporation 2006
Summary
The sinusoid effect is an important open problem in data mining.
The pseudo-translational symmetry introduced by the sliding window technique is the origin of the sinusoid effect.
In particular, if there is no particular periodicities within the window size, the clustering centers will be the sine waves of wavelength of w, irrespective of the details of the data.
Thank you.
| 2006/09/19 | PKDD 2006Page 22
Tokyo Research Laboratory
© Copyright IBM Corporation 2006
Appendix

| 2006/09/19 | PKDD 2006Page 23
Tokyo Research Laboratory
© Copyright IBM Corporation 2006
STSC can produce useful results IF some of the conditions of the sinusoid effect are NOT satisfied.
For example, if STSC is done locally…
t
time
Cluster center at presentCluster centers in the past
comparison to get the CP score
A STSC-based change-point detection method (singular spectrum transformation [Ide, SDM’05])

| 2006/09/19 | PKDD 2006Page 24
Tokyo Research Laboratory
© Copyright IBM Corporation 2006
In this case, the locality of STSC leads to the loss of (pseudo) translational symmetry , resulting non-meaningless results.
0 200 400
2
4
6(a) original signal
(b) CP score
w=5
w=10
w=25
SST can produce useful CP detection results, which do depend on the input signal.
“Break the pseudo-translational symmetry”
One general rule could be…
| 2006/09/19 | PKDD 2006Page 25
Tokyo Research Laboratory
© Copyright IBM Corporation 2006
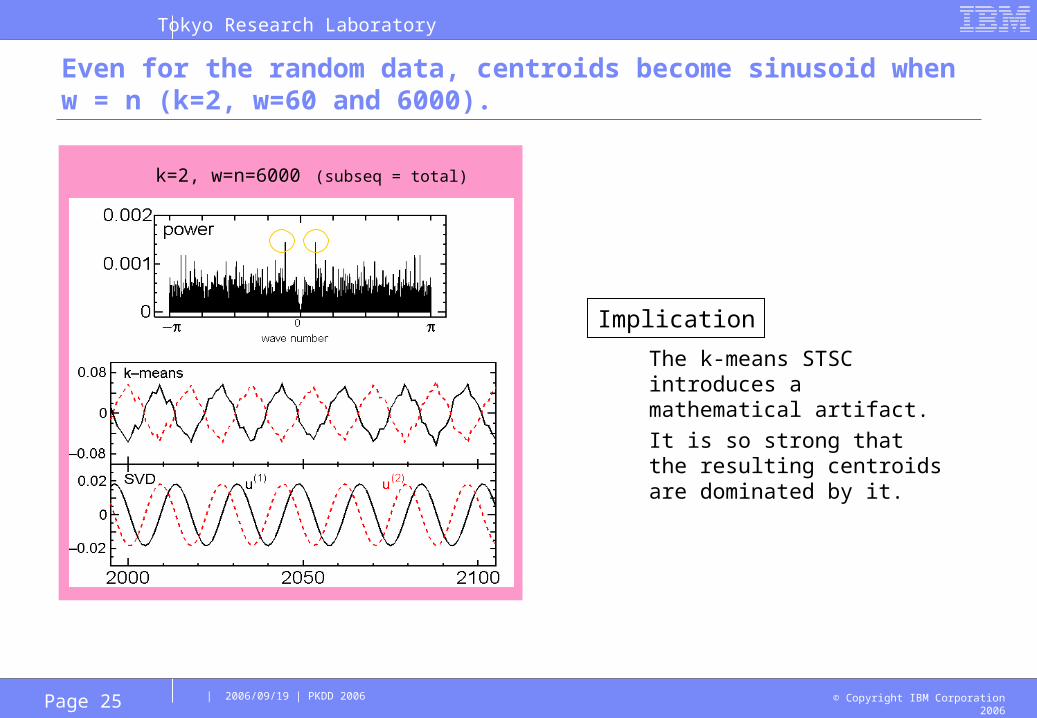
Even for the random data, centroids become sinusoid when w = n (k=2, w=60 and 6000).
k=2, w=n=6000 (subseq = total)
The k-means STSC introduces a mathematical artifact.
It is so strong that the resulting centroids are dominated by it.
Implication


![CSCI 136 Data Structures & Advanced ProgrammingLongest Increasing Subsequence •Given an array a[] of positive integers, find the length of the largest subsequence of (not necessary](https://static.fdocuments.in/doc/165x107/5e4f6838365d5e1d8e31902f/csci-136-data-structures-advanced-programming-longest-increasing-subsequence.jpg)


![KV-match: A Subsequence Matching Approach Supporting … · 2018. 9. 11. · arXiv:1710.00560v3 [cs.DB] 10 Sep 2018 KV-match: A Subsequence Matching Approach Supporting Normalization](https://static.fdocuments.in/doc/165x107/60d14038e701f2713104964f/kv-match-a-subsequence-matching-approach-supporting-2018-9-11-arxiv171000560v3.jpg)