CHOOSING THE LEVEL OF RANDOMIZATION. Unit of Randomization: Individual?

Why Does Software Cost So Much? March 20–23, 2017 © 2017 Carnegie Mellon University
[Distribution Statement A. This material has been approved for public release and unlimited distribution] 1
Software Solutions Symposium 2017
Software Engineering InstituteCarnegie Mellon UniversityPittsburgh, PA 15213
Why Does Software Cost So Much? © 2017 Carnegie Mellon University
[[Distribution Statement A] This material has been approved for public release and unlimited distribution.
Why Does Software Cost So Much? Toward a Causal ModelRobert Stoddard, SEIMike Konrad, SEIBill Nichols, SEIDavid Danks, CMUKun Zhang, CMU

Why Does Software Cost So Much? March 20–23, 2017 © 2017 Carnegie Mellon University
[Distribution Statement A. This material has been approved for public release and unlimited distribution] 2
Software Solutions Symposium 2017
Copyright 2017 Carnegie Mellon University
This material is based upon work funded and supported by the Department of Defense under Contract No. FA8721-05-C-0003 with Carnegie Mellon University for the operation of the Software Engineering Institute, a federally funded research and development center.
Any opinions, findings and conclusions or recommendations expressed in this material are those of the author(s) and do not necessarily reflect the views of the United States Department of Defense.
References herein to any specific commercial product, process, or service by trade name, trade mark, manufacturer, or otherwise, does not necessarily constitute or imply its endorsement, recommendation, or favoring by Carnegie Mellon University or its Software Engineering Institute.
NO WARRANTY. THIS CARNEGIE MELLON UNIVERSITY AND SOFTWARE ENGINEERING INSTITUTE MATERIAL IS FURNISHED ON AN “AS-IS” BASIS. CARNEGIE MELLON UNIVERSITY MAKES NO WARRANTIES OF ANY KIND, EITHER EXPRESSED OR IMPLIED, AS TO ANY MATTER INCLUDING, BUT NOT LIMITED TO, WARRANTY OF FITNESS FOR PURPOSE OR MERCHANTABILITY, EXCLUSIVITY, OR RESULTS OBTAINED FROM USE OF THE MATERIAL. CARNEGIE MELLON UNIVERSITY DOES NOT MAKE ANY WARRANTY OF ANY KIND WITH RESPECT TO FREEDOM FROM PATENT, TRADEMARK, OR COPYRIGHT INFRINGEMENT.
[Distribution Statement A] This material has been approved for public release and unlimited distribution. Please see Copyright notice for non-US Government use and distribution.
This material may be reproduced in its entirety, without modification, and freely distributed in written or electronic form without requesting formal permission. Permission is required for any other use. Requests for permission should be directed to the Software Engineering Institute at [email protected].
Carnegie Mellon® is registered in the U.S. Patent and Trademark Office by Carnegie Mellon University.
DM-0004586

Why Does Software Cost So Much? March 20–23, 2017 © 2017 Carnegie Mellon University
[Distribution Statement A. This material has been approved for public release and unlimited distribution] 3
Software Solutions Symposium 2017
Agenda
Introduction
Why do We Care about Causal Modeling?
What is Causal Learning and Modeling?
Case Studies exemplifying Causal Learning
Practical Tooling
Conclusions
Questions

Why Does Software Cost So Much? March 20–23, 2017 © 2017 Carnegie Mellon University
[Distribution Statement A. This material has been approved for public release and unlimited distribution] 4
Software Solutions Symposium 2017
FY17 Project Approach and Objectives
To answer: “Why does software cost so much?” • We will quantify causal drivers of Software Size and Effort that are
more applicable across programs
• We will reconfirm, within the software cost domain, that causal models are more accurate and efficient than traditional models
This project will help: • Improve contract incentives for software intensive programs
• Increase competition using effective criteria related to software cost
• Inform “could/should cost” analysis and price negotiations
• Enhance program control of software cost throughout the development and sustainment lifecycles

Why Does Software Cost So Much? March 20–23, 2017 © 2017 Carnegie Mellon University
[Distribution Statement A. This material has been approved for public release and unlimited distribution] 5
Software Solutions Symposium 2017
SEI Long-Term Initiative Focused on Cost
SEI has a long track record of cost related research.
20122011 2013 2014 2015 2018 - 2020
2012-13: F-22: SEI-led “should cost” analysis of software modernization
2013-14:Investment model for software sustainment
2014-15 NAVAIR adoption of investment model for sustainment
2011-2016: QUELCE reducing uncertainty in early lifecycle software cost estimation
Rese
arch
& D
evel
opm
ent
Proo
f of
Conc
ept
Prog
ram
2014: QUELCE workshop with JSpOC Space Program
Future Activity:
2016
FY18-20: An Integrated
Causal Model for Software
Cost Prediction
and Control (SCoPe)
Causal Sensitivity Dashboard Prototype
Service & DoD Cost Centers;
NAVAIR and USAF Logistic
Sites
2017
2016-17:Why Does SWCost So Much? Causality

Why Does Software Cost So Much? March 20–23, 2017 © 2017 Carnegie Mellon University
[Distribution Statement A. This material has been approved for public release and unlimited distribution] 6
Software Solutions Symposium 2017
Method, Approach, Validity
COCOMO Data
Vendor 1 Data
Vendor 2 Data
Vendor 3 Data
SRDR Data
TSP/PSP Data
CSIAC Data
CMU TetradLearning
Actionable Causal Models
~ 60 uniquecost factors;
15+ costrelationshipsto evaluate
Compare
Integrate
Estimate Strength
Agile Cost = f(factor1, factor2, factor3)Incremental Cost = g(factor1, factor4, factor5)Waterfall Cost = h(factor4, factor6, factor7)
Compressed Schedule
Language
Tools
Experience
Effort
Compressed Schedule
Language
Tools
Experience
Effort
Compressed Schedule
Language
Tools
Experience
Effort

Why Does Software Cost So Much? March 20–23, 2017 © 2017 Carnegie Mellon University
[Distribution Statement A. This material has been approved for public release and unlimited distribution] 7
Software Solutions Symposium 2017
Initial Results: PSP Program 9 (975 programmers)
Defect Injection
Effort
Defect Removal
ProgrammerCapabilities
Outcomes

Why Does Software Cost So Much? March 20–23, 2017 © 2017 Carnegie Mellon University
[Distribution Statement A. This material has been approved for public release and unlimited distribution] 8
Software Solutions Symposium 2017
Agenda
Introduction
Why do We Care about Causal Modeling?
What is Causal Learning and Modeling?
Case Studies exemplifying Causal Learning
Practical Tooling
Conclusions
Questions
Why Does Software Cost So Much? March 20–23, 2017 © 2017 Carnegie Mellon University
[Distribution Statement A. This material has been approved for public release and unlimited distribution] 9
Software Solutions Symposium 2017
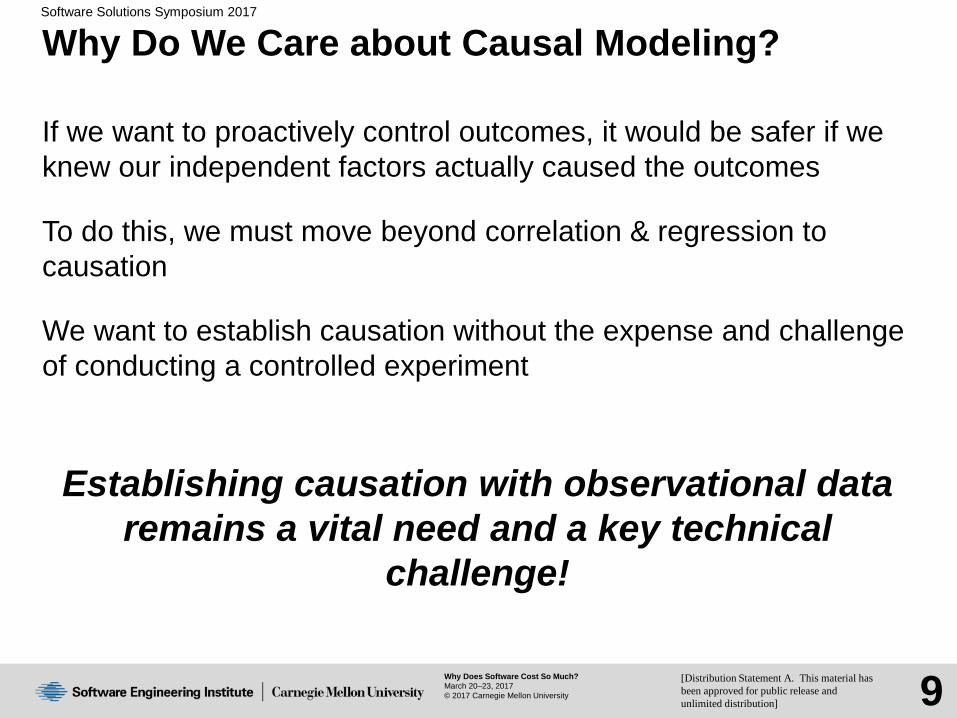
Why Do We Care about Causal Modeling?
If we want to proactively control outcomes, it would be safer if we knew our independent factors actually caused the outcomes
To do this, we must move beyond correlation & regression to causation
We want to establish causation without the expense and challenge of conducting a controlled experiment
Establishing causation with observational data remains a vital need and a key technical
challenge!

Why Does Software Cost So Much? March 20–23, 2017 © 2017 Carnegie Mellon University
[Distribution Statement A. This material has been approved for public release and unlimited distribution] 10
Software Solutions Symposium 2017
Correlation is Insufficient
From TylerVigen.com. Retrieved March 14, 2017. Available under a Creative Commons Attribution NonCommercial Share Alike 4.0 International License

Why Does Software Cost So Much? March 20–23, 2017 © 2017 Carnegie Mellon University
[Distribution Statement A. This material has been approved for public release and unlimited distribution] 11
Software Solutions Symposium 2017
Correlation and Regression Can Mislead!
Does Foreign Investment in 3rd World Countries inhibit Democracy?
Timberlake, M. and Williams, K. (1984). Dependence, political exclusion, and government repression: Some cross-national evidence. American Sociological Review 49, 141-146.
N = 72 data points
PO is degree of political exclusivity (repression outcome)CV is lack of civil libertiesEN is energy consumption per capita (economic development)FI is level of foreign investment
Reused from Dr. Richard Schienes, Center for Causal Discovery: Summer Short Course/Datathon, June 13-18, 2016, Carnegie Mellon University

Why Does Software Cost So Much? March 20–23, 2017 © 2017 Carnegie Mellon University
[Distribution Statement A. This material has been approved for public release and unlimited distribution] 12
Software Solutions Symposium 2017
Traditional Regression Result
PO = .227*FI - .176*EN + .880*CVTraditional Interpretation: Foreign Investment (FI) and lack of civil liberties (CV) increase political repression (PO) while energy consumption (EN) reduces political repression (PO)
PO is degree of political exclusivity (repression outcome)CV is lack of civil libertiesEN is energy consumption per capita (economic development)FI is level of foreign investment
Reused from Dr. Richard Schienes, Center for Causal Discovery: Summer Short Course/Datathon, June 13-18, 2016, Carnegie Mellon University

Why Does Software Cost So Much? March 20–23, 2017 © 2017 Carnegie Mellon University
[Distribution Statement A. This material has been approved for public release and unlimited distribution] 13
Software Solutions Symposium 2017
Causal Modeling refutes Regression Result!
.217
FI
PO
CV En
Regression
.88 -.176
FI
PO
CV En
Tetrad - PC
FI
PO
CV En
Fit: df=2, χ2=0.12, p-value = .94
.31 -.23
.86 -.48
FI
PO
CV En
Tetrad - FCI
There is no model with testable constraints (df > 0) that is not rejected by the data, in which FI has a positive effect on PO.
Reused from Dr. Richard Schienes, Center for Causal Discovery: Summer Short Course/Datathon, June 13-18, 2016, Carnegie Mellon University

Why Does Software Cost So Much? March 20–23, 2017 © 2017 Carnegie Mellon University
[Distribution Statement A. This material has been approved for public release and unlimited distribution] 14
Software Solutions Symposium 2017
Regression Cannot be Trusted without a DAG!
Just as correlation may be fooled by spurious association, so can regression!
Before jumping into regression, we need to discover causal relationships or formulate our hypotheses in the form of a Directed Acyclic Graph (DAG)
Then we need to apply causal identification and determine which paths are causal and which are spurious.
Lastly, we must block spurious paths and develop a resulting regression with the causal factors.
Remember, the same regression equation mapped to two different Directed Acyclic Graphs can have very different suitability!

Why Does Software Cost So Much? March 20–23, 2017 © 2017 Carnegie Mellon University
[Distribution Statement A. This material has been approved for public release and unlimited distribution] 15
Software Solutions Symposium 2017
Agenda
Introduction
Why do We Care about Causal Modeling?
What is Causal Learning and Modeling?
Case Studies exemplifying Causal Learning
Practical Tooling
Conclusions
Questions

Why Does Software Cost So Much? March 20–23, 2017 © 2017 Carnegie Mellon University
[Distribution Statement A. This material has been approved for public release and unlimited distribution] 16
Software Solutions Symposium 2017
Causality via Matching and Experimentation
Prior to 1935, causal conclusions were made by matching data of different conditions and comparing the outcomes
This was deemed too expensive, slow and often prohibitive
As a result, Sir Ronald Fisher devised statistically-designed experiments, with randomization and orthogonal arrays, to more quickly intervene and draw conclusions about causality
Since 1935, an evolving body of knowledge surrounding matching matured to what we now know as Directed Acyclic Graphs Causal Modeling, Counterfactual Reasoning, Instrumental Variables and Propensity Scoring.
So, we now have causal methods other than controlled experiments!

Why Does Software Cost So Much? March 20–23, 2017 © 2017 Carnegie Mellon University
[Distribution Statement A. This material has been approved for public release and unlimited distribution] 17
Software Solutions Symposium 2017
Landscape of Causal Learning
Causal Discoveryusing CMU Tetrad
which implements a variety of algorithms
Formulate Hypotheses
using domain knowledge and prior scholar
publication
Prior Knowledge
& Observational Data
Directed Acyclic Graph Model
E
F
D
B
C
A
Y
Estimated SEM Model
F
DC
A
Y
-2.75
+3.19+1.02
+6.51

Why Does Software Cost So Much? March 20–23, 2017 © 2017 Carnegie Mellon University
[Distribution Statement A. This material has been approved for public release and unlimited distribution] 18
Software Solutions Symposium 2017
Causal Discovery using Data & Prior Knowledge
Does the correlation reflect causal association?
Can we ascertain the direction of causation?
Do we just have spurious correlation?• If so, what other known factors are the real cause(s)?• Do we have an unknown causal factor(s) to continue hunting for?
TETRAD (CMU)
Compares residuals to determine causal direction
Y
X
X
Y
Why Does Software Cost So Much? March 20–23, 2017 © 2017 Carnegie Mellon University
[Distribution Statement A. This material has been approved for public release and unlimited distribution] 19
Software Solutions Symposium 2017
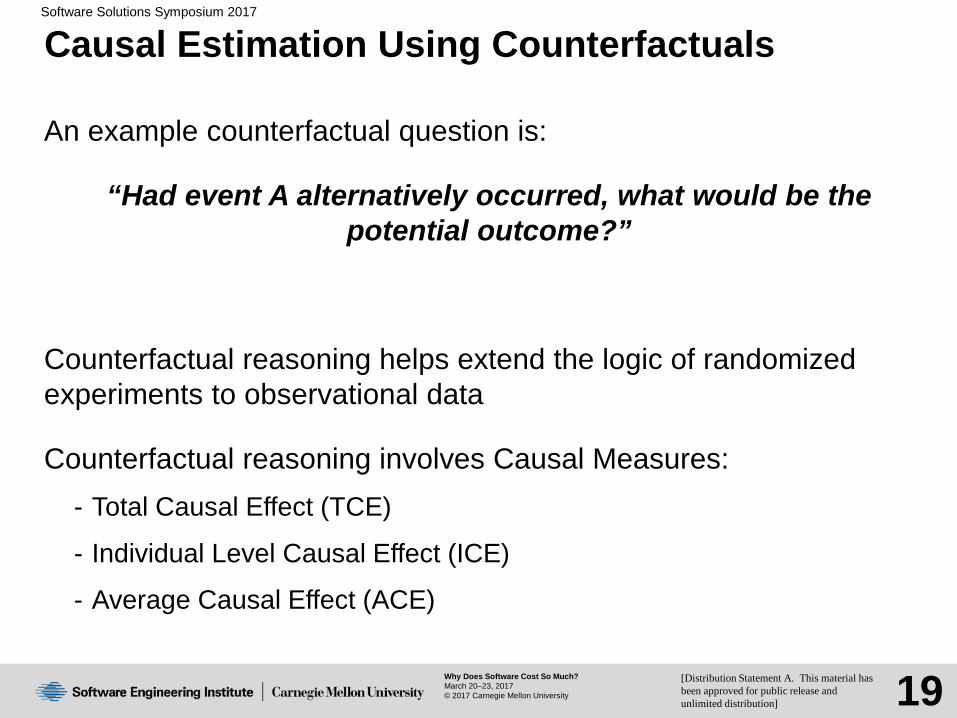
An example counterfactual question is:
“Had event A alternatively occurred, what would be the potential outcome?”
Counterfactual reasoning helps extend the logic of randomized experiments to observational data
Counterfactual reasoning involves Causal Measures:- Total Causal Effect (TCE)
- Individual Level Causal Effect (ICE)
- Average Causal Effect (ACE)
Causal Estimation Using Counterfactuals

Why Does Software Cost So Much? March 20–23, 2017 © 2017 Carnegie Mellon University
[Distribution Statement A. This material has been approved for public release and unlimited distribution] 20
Software Solutions Symposium 2017
Amazing Progress in the Past 17 Years!
1930 1960 1980 1990 2000 2010 2015
Structural Equation Models (1930’s)
Pearl’s Probabilistic Reasoning (1988)
Social Science Path Models (1960’s)
Bayesian Networks (1980’s)
Pearl’s 1st Edition Book on Causality (2000)
Pearl’s 2nd Edition Book on Causality (2009)
Glymour & Spirtes et al 2nd Edition Book on Causality (2001)
Glymour & Spirtes et al 1st Edition Book on Causality (1988)
Morgan Handbook Social Science Causal Inference (2014)
Morgan Counterfactuals & Causality (2014)
Morgan Counterfactuals & Causality (2007)
Sewall Wright Path Models (1920’s)

Why Does Software Cost So Much? March 20–23, 2017 © 2017 Carnegie Mellon University
[Distribution Statement A. This material has been approved for public release and unlimited distribution] 21
Software Solutions Symposium 2017
Agenda
Introduction
Why do We Care about Causal Modeling?
What is Causal Learning and Modeling?
Case Studies exemplifying Causal Learning
Practical Tooling
Conclusions
Questions

Why Does Software Cost So Much? March 20–23, 2017 © 2017 Carnegie Mellon University
[Distribution Statement A. This material has been approved for public release and unlimited distribution] 22
Software Solutions Symposium 2017
Example: Foreign Investment Benefits
Causal pattern of 19 FDI related variables, estimated with Tetrad IV for 61 Developing Countries; GDP, trade, and educational expenditure are the three direct causal variables to FDI. GDP and trade have a positive impact on FDI, whereas educational expenditure affects FDI negatively. GDP is a typical indicator used to measure a country’s economic health and thus higher GDP signals opportunity and attracts FDI.
Li, Y., Woodard, J. D., & Leatham, D. J. (2013). Causality among foreign direct investment and economic growth: A directed acyclic graph approach. Journal of Agricultural and Applied Economics, 45(04), 617-637.

Why Does Software Cost So Much? March 20–23, 2017 © 2017 Carnegie Mellon University
[Distribution Statement A. This material has been approved for public release and unlimited distribution] 23
Software Solutions Symposium 2017
Example: Energy Economics
US governments …favor …different energy modes and fossil fuels, due to different interest group pressures. Yet this lack of substitutability among main fossil fuels points to potentially very distortionary impacts of such policies since no obvious replacements emerge in energy use when one source of energy becomes overregulated. Hence …advisable to link, from policy standpoint, the sources of energy with the users based on source..
Miljkovic, D., Dalbec, N., & Zhang, L. (2016). Estimating dynamics of US demand for major fossil fuels. Energy Economics, 55, 284-291.

Why Does Software Cost So Much? March 20–23, 2017 © 2017 Carnegie Mellon University
[Distribution Statement A. This material has been approved for public release and unlimited distribution] 24
Software Solutions Symposium 2017
Example: Energy/Agriculture Linkage in Context of Renewable Fuel Policy
“This study shows a significant linkage between agriculture and energy market through corn. The results …suggest that at contemporaneous time corn causes soybeans price and ethanol price. Renewable fuel standards requirements and rise in ethanol for demand affect the agriculture market. Corn price and soybeans price together count for about 12 and 18 percent of change in cattle and hog prices.”

Why Does Software Cost So Much? March 20–23, 2017 © 2017 Carnegie Mellon University
[Distribution Statement A. This material has been approved for public release and unlimited distribution] 25
Software Solutions Symposium 2017
Examples All Around!!!
Do you hear of preliminary research outcomes with surprising, if not provocative results? (e.g. journals, NPR)
Have you heard of research results that can not be replicated?
Do you hear results that seem to be correlated but no one is sure of the causal direction?
Do you hear conclusions about what is going on but you suspect an unmeasured, third factor is really the culprit?
Drawing correct inferences in such situations requires rigorous causal modeling; testing
hypotheses in context of a Probabilistic Graphical Model!

Why Does Software Cost So Much? March 20–23, 2017 © 2017 Carnegie Mellon University
[Distribution Statement A. This material has been approved for public release and unlimited distribution] 26
Software Solutions Symposium 2017
Agenda
Introduction
Why do We Care about Causal Modeling?
What is Causal Learning and Modeling?
Case Studies exemplifying Causal Learning
Practical Tooling
Conclusions
Questions

Why Does Software Cost So Much? March 20–23, 2017 © 2017 Carnegie Mellon University
[Distribution Statement A. This material has been approved for public release and unlimited distribution] 27
Software Solutions Symposium 2017
Tetrad is a CMU Open Source Product
May be found at:http://www.phil.cmu.edu/tetrad/
Code located at github:https://github.com/cmu-phil/tetrad
Video Tutorials from 2016 Summer Short Coursehttp://www.ccd.pitt.edu/training/presentation-videos/
User Manual

Why Does Software Cost So Much? March 20–23, 2017 © 2017 Carnegie Mellon University
[Distribution Statement A. This material has been approved for public release and unlimited distribution] 28
Software Solutions Symposium 2017
Using Tetrad for Causal Discovery and Estimation -1
Step 1: Open a new Tetrad session; Insert a Data box to open and load a CSV file that holds your dataset.

Why Does Software Cost So Much? March 20–23, 2017 © 2017 Carnegie Mellon University
[Distribution Statement A. This material has been approved for public release and unlimited distribution] 29
Software Solutions Symposium 2017
Using Tetrad for Causal Discovery and Estimation -2
Step 2: Configure the loading of your data so as to address the type of data, missing data, etc.

Why Does Software Cost So Much? March 20–23, 2017 © 2017 Carnegie Mellon University
[Distribution Statement A. This material has been approved for public release and unlimited distribution] 30
Software Solutions Symposium 2017
Using Tetrad for Causal Discovery and Estimation -3
Step 3: Check the results of the loading.Note that 6 continuous variables have been loaded.

Why Does Software Cost So Much? March 20–23, 2017 © 2017 Carnegie Mellon University
[Distribution Statement A. This material has been approved for public release and unlimited distribution] 31
Software Solutions Symposium 2017
Using Tetrad for Causal Discovery and Estimation -4
Step 4: Initiate a causal search by inserting a Search box with a connection from the Data box.Select from over a dozen different algorithms for causal discovery. The PC algorithm, named for Peter Spirtes and Clark Glymour (CMU), its creators, is one of the most widely used and known causal search algorithms.
Why Does Software Cost So Much? March 20–23, 2017 © 2017 Carnegie Mellon University
[Distribution Statement A. This material has been approved for public release and unlimited distribution] 32
Software Solutions Symposium 2017
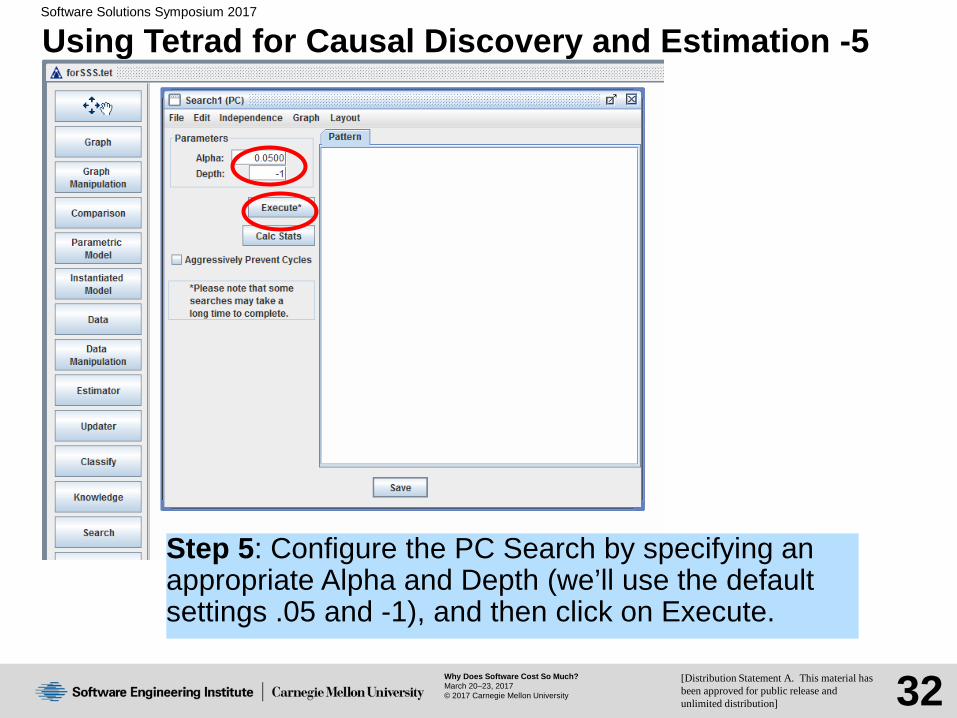
Using Tetrad for Causal Discovery and Estimation -5
Step 5: Configure the PC Search by specifying an appropriate Alpha and Depth (we’ll use the default settings .05 and -1), and then click on Execute.

Why Does Software Cost So Much? March 20–23, 2017 © 2017 Carnegie Mellon University
[Distribution Statement A. This material has been approved for public release and unlimited distribution] 33
Software Solutions Symposium 2017
Using Tetrad for Causal Discovery and Estimation -6
Step 6: Review the resulting search graph by scanning connections to see if they make sense.

Why Does Software Cost So Much? March 20–23, 2017 © 2017 Carnegie Mellon University
[Distribution Statement A. This material has been approved for public release and unlimited distribution] 34
Software Solutions Symposium 2017
Using Tetrad for Causal Discovery and Estimation -7
Step 7: Build a parametric model (PM) by inserting a PM box and running an arrow from the Search box into the PM box.

Why Does Software Cost So Much? March 20–23, 2017 © 2017 Carnegie Mellon University
[Distribution Statement A. This material has been approved for public release and unlimited distribution] 35
Software Solutions Symposium 2017
Using Tetrad for Causal Discovery and Estimation -8
Step 8: Note the numbered parameters of the parametric model, and click on Save.

Why Does Software Cost So Much? March 20–23, 2017 © 2017 Carnegie Mellon University
[Distribution Statement A. This material has been approved for public release and unlimited distribution] 36
Software Solutions Symposium 2017
Using Tetrad for Causal Discovery and Estimation -9
Step 9: Instantiate the parametric model by inserting an Estimator box, hanging it off the Parametric Model box and the original Data box. Double click the Estimator box to initiate the appropriate estimation algorithm.

Why Does Software Cost So Much? March 20–23, 2017 © 2017 Carnegie Mellon University
[Distribution Statement A. This material has been approved for public release and unlimited distribution] 37
Software Solutions Symposium 2017
Using Tetrad for Causal Discovery and Estimation -10
Step 10: Examine the resulting estimated model to assess model fit.

Why Does Software Cost So Much? March 20–23, 2017 © 2017 Carnegie Mellon University
[Distribution Statement A. This material has been approved for public release and unlimited distribution] 38
Software Solutions Symposium 2017
Agenda
Introduction
Why do We Care about Causal Modeling?
What is Causal Learning and Modeling?
Case Studies exemplifying Causal Learning
Practical Tooling
Conclusions
Questions

Why Does Software Cost So Much? March 20–23, 2017 © 2017 Carnegie Mellon University
[Distribution Statement A. This material has been approved for public release and unlimited distribution] 39
Software Solutions Symposium 2017
Conclusions
Causal learning has come of age from both a theoretical and practical tooling standpoint
Causal learning may be performed on data whether it be derived from experimentation or passive observation
Causal models help separate true causes from spuriously-correlated factors
Causal models help identify when unknown causes may likely exist
Causal models have been shown to be more accurate than traditional models that contain spuriously-correlated factors
We seek to drive cost estimation to a new level with actionable, controllable causal models,
and position the SEI as a preferred source for inquiries on “should cost” and “could cost” estimation.

Why Does Software Cost So Much? March 20–23, 2017 © 2017 Carnegie Mellon University
[Distribution Statement A. This material has been approved for public release and unlimited distribution] 40
Software Solutions Symposium 2017
Agenda
Introduction
Why do We Care about Causal Modeling?
What is Causal Learning and Modeling?
Case Studies exemplifying Causal Learning
Practical Tooling
Conclusions
Questions

Why Does Software Cost So Much? March 20–23, 2017 © 2017 Carnegie Mellon University
[Distribution Statement A. This material has been approved for public release and unlimited distribution] 41
Software Solutions Symposium 2017
Contact Information
Points of ContactSEMA Measurement Team
Robert [email protected]
Mike [email protected]
William [email protected]
David [email protected]
U.S. MailSoftware Engineering InstituteCustomer Relations4500 Fifth AvenuePittsburgh, PA 15213-2612, USA
Webwww.sei.cmu.eduwww.sei.cmu.edu/contact.cfm
Customer RelationsEmail: [email protected]: +1 412-268-5800SEI Phone: +1 412-268-5800SEI Fax: +1 412-268-6257

Why Does Software Cost So Much? March 20–23, 2017 © 2017 Carnegie Mellon University
[Distribution Statement A. This material has been approved for public release and unlimited distribution] 42
Software Solutions Symposium 2017
Why Does Software Cost So Much? © 2017 Carnegie Mellon University
[[Distribution Statement A] This material has been approved for public release and unlimited distribution.
Backup Slides

Why Does Software Cost So Much? March 20–23, 2017 © 2017 Carnegie Mellon University
[Distribution Statement A. This material has been approved for public release and unlimited distribution] 43
Software Solutions Symposium 2017
Example: Environmental Causes
Which environmental factors directly influence growth/biomass of Spartina grass (in Cape Fear)?Chemical, mechanical, radiation, etc.
Causal learning yields: only pH mattersOther factors indirectly matter, mediated by pH levels
Subsequent greenhouse study randomly varyingpH & salinity yields: only pH matters
Taken from “Why Causal Discovery and Modeling Should be in Your Research Design”, SEI Presentation, by Dr. David Danks, CMU, 2016.

Why Does Software Cost So Much? March 20–23, 2017 © 2017 Carnegie Mellon University
[Distribution Statement A. This material has been approved for public release and unlimited distribution] 44
Software Solutions Symposium 2017
Example: Premature Death
“Chlamydia rate, violent crime or homicide, and liquor store density are three important factors that cause low birth weight, though in our discussion we note that two latter factors may proxy for correlated unobserved variables.”
Figure 1; Final directed graph for YPLL. Note: …Obtained with the PC search algorithm using as input the correlations between premature death rate (YPLL) and 24 potential risk factors.“…only (factors), adult smoking, obesity, the motor vehicle crash death rate, the percent of children in poverty, and violent crime rate, are causal factors of premature death.
Rettenmaier, A. J., & Wang, Z. (2013). What determines health: a causal analysis using county level data. The European Journal of Health Economics, 14(5), 821-834.

Why Does Software Cost So Much? March 20–23, 2017 © 2017 Carnegie Mellon University
[Distribution Statement A. This material has been approved for public release and unlimited distribution] 45
Software Solutions Symposium 2017
1. DAGs consist of:a) nodes (variables),
b) directed arrows (possible causal relationships ordered by time), and
c) missing arrows (confident assumptions about absence of causal effects)
2. DAGs are nonparametrica) No distributional assumptions
b) Linear and/or nonlinear
3. DAGs have both causal paths and non-causal (spurious) paths
Basic Concepts of Directed, Acyclic Graphs

Why Does Software Cost So Much? March 20–23, 2017 © 2017 Carnegie Mellon University
[Distribution Statement A. This material has been approved for public release and unlimited distribution] 46
Software Solutions Symposium 2017
1. Indirect Connection
2. Common Cause
3. Common Effect (Collider)
Fundamental Structures in a Directed, Acyclic Graph

Why Does Software Cost So Much? March 20–23, 2017 © 2017 Carnegie Mellon University
[Distribution Statement A. This material has been approved for public release and unlimited distribution] 47
Software Solutions Symposium 2017
1. Derive testable implications of a causal model to evaluate if the model is correct
2. Understand causal identification requirements to confirm whether causality may be inferred from the data- Separating causal from spurious associations in the data
3. Inform use of traditional statistical techniques such as regression- Deciding which control variables to include versus not to include
in the analysis to achieve identification of causality
Use of Directed, Acyclic Graphs

Why Does Software Cost So Much? March 20–23, 2017 © 2017 Carnegie Mellon University
[Distribution Statement A. This material has been approved for public release and unlimited distribution] 48
Software Solutions Symposium 2017
1. Uses a technique such as d-Separation
a) Algorithm to help determine which paths are causal versus non-causal
b) Uses concept of blocking a path (see next slide) to stop transmission of non-causal association
2. Additional techniques that may be employed include
a) Graphical identification
b) Adjustment Criterion
c) Backdoor Criterion
d) Frontdoor Criterion
e) Pearl’s do-Calculus
Deriving Testable Implications

Why Does Software Cost So Much? March 20–23, 2017 © 2017 Carnegie Mellon University
[Distribution Statement A. This material has been approved for public release and unlimited distribution] 49
Software Solutions Symposium 2017
1. Controlling a variable
2. Stratifying a variable
3. Setting evidence on a variable
4. Observing (or conditioning on) a variable
5. Matching a variable (eg making distributions of sub-populations as similar as possible for estimating effect size)
These techniques critically inform which factors to put into the regression equation and which
ones to keep out!
Blocking or Adjusting Paths

Why Does Software Cost So Much? March 20–23, 2017 © 2017 Carnegie Mellon University
[Distribution Statement A. This material has been approved for public release and unlimited distribution] 50
Software Solutions Symposium 2017
Causal Modeling is the Real Destination
Why Does Software Cost So Much? March 20–23, 2017 © 2017 Carnegie Mellon University
[Distribution Statement A. This material has been approved for public release and unlimited distribution] 51
Software Solutions Symposium 2017
Quotes by Judea Pearl
“… I see no greater impediment to scientific progress than the prevailing practice of focusing all of our mathematical resources on probabilistic and statistical inferences while leaving causal considerations to the mercy of intuition and good judgment.”Pearl, J. (2009). Causality. Cambridge university press. (Preface to 1st Edition)
“The development of Bayesian Networks, so people tell me, marked a turning point in the way uncertainty is handled in computer systems. For me, this development was a stepping stone towards a more profound transition, from reasoning about beliefs to reasoning about causal and counterfactual relationships.”Judea Pearl: From Bayesian Networks to Causal and Counterfactual ReasoningKeynote Lecture at the 2014 BayesiaLab User ConferenceRecorded on September 24, 2014, in Los Angeles.

Why Does Software Cost So Much? March 20–23, 2017 © 2017 Carnegie Mellon University
[Distribution Statement A. This material has been approved for public release and unlimited distribution] 52
Software Solutions Symposium 2017
Causal Modeling – Dr. Stephen Morgan

Why Does Software Cost So Much? March 20–23, 2017 © 2017 Carnegie Mellon University
[Distribution Statement A. This material has been approved for public release and unlimited distribution] 53
Software Solutions Symposium 2017
CMU Causal Modeling Researchers-01

Why Does Software Cost So Much? March 20–23, 2017 © 2017 Carnegie Mellon University
[Distribution Statement A. This material has been approved for public release and unlimited distribution] 54
Software Solutions Symposium 2017
CMU Causal Modeling Researchers-02

Why Does Software Cost So Much? March 20–23, 2017 © 2017 Carnegie Mellon University
[Distribution Statement A. This material has been approved for public release and unlimited distribution] 55
Software Solutions Symposium 2017
Dr. Felix Elwert, Univ of Wisconsin
Available through two channels:
Statistical Horizons www.statisticalhorizons.com
BayesiaLabhttp://www.bayesia.us/causal-inference-course-fairfax
Causal Inference with Directed Graphs and Treatment Effects

Why Does Software Cost So Much? March 20–23, 2017 © 2017 Carnegie Mellon University
[Distribution Statement A. This material has been approved for public release and unlimited distribution] 56
Software Solutions Symposium 2017
Notes on Tetrad Screenshots -1
Step 1: A few words about Tetrad: Tetrad is free and maintained by an open-source community led Dr. Joe Ramsey at CMU. Like many statistical tools, Tetrad takes CSV files as input, so you if work in Excel, you should Save As Type: CSV (Comma Delimited).Step 2: Note that you can specify other types of input, delimiters, comment tags, missing value tags, etc. Also, note that there is a default way to specify which variables are categorical vs. ordinal; but if a column has numbers and at least one of them is a decimal number, it is treated as Continuous by default. When you have configured the loading the way you want, click on “Load.”Step 5 (Using the default settings): When there aren’t too many cases in your dataset, these default settings are very reasonable. As the number of cases increase, your tolerance for False Positives drops, or the graph gets too bushy, you might want to reduce Alpha by one or more magnitudes. Also, if you have a very large dataset and a lot of variables (e.g., tens of thousands) so that execution is slow, you might want to limit the size of subsets entering conditional independence testing by changing the Depth from -1 (representing unlimited size) to something small (e.g., positive < 10).

Why Does Software Cost So Much? March 20–23, 2017 © 2017 Carnegie Mellon University
[Distribution Statement A. This material has been approved for public release and unlimited distribution] 57
Software Solutions Symposium 2017
Notes on Tetrad Screenshots -2
Step 5 (Executing search): It is tempting at this stage to move the variables around so that causation moves in the same direction, say left to right, or top to bottom. But the default organization of the variables around a circle is a pretty good default as it makes each edge potentially visible and gauge graph bushiness.If you find some edge orientations to be incorrect, you can specify such information about orientation (or temporality) in a Knowledge box, which will then guide/constrain the causal search. You connect a Knowledge box into your Tetrad session by running an arrow from the Data Box to the Knowledge box. You then specify the information by opening the box to map the variables of your dataset into tiers (layers) and white-list/black-list particular dependencies. Then having specified such knowledge, you connect the Knowledge box to the Search box (which must separately be connected to the Data box) and then run your search. The resulting graph will conform to the knowledge you specified.

Why Does Software Cost So Much? March 20–23, 2017 © 2017 Carnegie Mellon University
[Distribution Statement A. This material has been approved for public release and unlimited distribution] 58
Software Solutions Symposium 2017
Notes on Tetrad Screenshots -3
Step 7: Had the Search box indicated that there were undirected edges, you would first need to modify the search graph before connecting the Search box to the Parametric Model box by inserting a Graph Manipulation box between the two to convert undirected edges into bi-directed edges.
Selecting the Generalized SEM option allows specification of more complex functions and error terms than ordinary SEM.
You can directly build a parametric model for a graph that includes bi-directed edges. For a bi-directed edge, the assumption is that there is a common latent cause and thus the error terms at both ends must be correlated to each other. To address a bi-directed edge, the graph produced by the Parametric Model box will show the edge as running between the associated error terms rather than the variables themselves.

Why Does Software Cost So Much? March 20–23, 2017 © 2017 Carnegie Mellon University
[Distribution Statement A. This material has been approved for public release and unlimited distribution] 59
Software Solutions Symposium 2017
Notes on Tetrad Screenshots -4
Step 8: Error terms are assumed to be independent, but in the case of a bidirectional edge, the edge is between the error terms, as mentioned. If our variables were Discrete rather than Continuous, the Parametric Model box menu would offer a Bayesian parametric model.
Note the default labeling of Bn for edge weights and Mn for mean value of a variable (node). There’s also a parameter for the variance (standard deviation) of the error term.
Step 9: Depending on the dataset, complexity of the search graph (number of bi-directed edges), etc., the estimation algorithm might take a while.
Note that from the same dataset, you can hang other search boxes (e.g., with different Alpha settings), parametric models, and estimator boxes, all stemming from the same dataset. You can also hang a Data Manipulation box to subset the data further before proceeding with search, etc.

Why Does Software Cost So Much? March 20–23, 2017 © 2017 Carnegie Mellon University
[Distribution Statement A. This material has been approved for public release and unlimited distribution] 60
Software Solutions Symposium 2017
Notes on Tetrad Screenshots -5
Step 10: Examine the resulting estimated model (now with instantiated parameters) for anything unusual, specifically: unnatural edge weights, stability of solution, quality of model fit.
Because our original graph was cyclic, a statistical regression (each variable against its parents) is not an appropriate optimizer.
One of the iterative approximating algorithms (e.g., Powell) had to be used instead. Click on Estimate Again, to see whether the instantiated model is sensitive somehow to the random seed. Repeat several times and in the Model Statistics view, if the chi square is about the same value each time, then the convergence to the particular configuration of parameter estimates is pretty robust convergence.
This particular result, from our PSP dataset subset, turned out to be robust.