Why do students study Economics
33
1 Faculty of Business and Law Why do students study economics? Andrew Mearman, Aspasia Papa and Don J. Webber Department of Accounting, Economics and Finance, University of the West of England, Bristol, UK Economics Working Paper Series 1303
Transcript of Why do students study Economics
1
Faculty of Business and Law
Why do students study economics?
Andrew Mearman, Aspasia Papa and Don J. Webber Department of Accounting, Economics and Finance,
University of the West of England, Bristol, UK
Economics Working Paper Series 1303
2
Why do students study economics?
Andrew Mearman, Aspasia Papa and Don J. Webber Department of Accounting, Economics and Finance,
University of the West of England, Bristol, UK
Abstract
This paper presents a chronological, adaptive and reflective investigation
into students’ perceptions of and motivations for choosing to study
economics. Applications of multiple techniques to student-level primary
data reveal the following. First, students’ perceptions of economics are on
average somewhat negative, although there is considerable variation.
Second, they regard economics as having value, in terms of providing
insight, specialist knowledge, and skills of argumentation (all of which are
perceived to be superior to peers). Third, they recognise the subject yields
financial and other career advantages and has kudos. Fourth, they suggest
that the relevance and usefulness of economics is important and
consequently that excessive theorisation and a lack of practicality are
problematic. These findings have considerable implications for how
economics is taught, and for the nature of the subject itself.
Acknowledgements: The authors gratefully acknowledge The Economics Network of
the Higher Education Academy, UK for part-funding the data collection process. The
authors thank Peter Earl, Tim Wakeley and Gamila Shoib for their help in designing
the questionnaire and Paul Downward, Paul Dunne and Mary Hedges for useful
detailed comments. A version of this paper was presented at the workshop on
Systematic Mixed-Methods Research at the University of Manchester, June 2010.
Comments received there, and from Wendy Olsen in particular, were most useful. The
usual disclaimer applies.
JEL codes: A11; A20
Keywords: Mixed-methods; UK student perceptions; Realisticness; Focus groups;
Survey
Corresponding author: Don Webber, Bristol Business School, University of the
West of England, Bristol, BS16 1QY, UK. E-mail: [email protected]

3
1. Introduction
Academic economics represents a paradox. As a discipline it is dominated by a focus
on the allocation and distribution of productive and consumptive resources with a
particular concern with how these resources can be affected in order to increase
income, satisfaction, welfare, wellbeing or change behaviour within an interactive or
market setting. However, most academic economics departments do not possess
knowledge about how they can allocate resources and influence the market in order to
increase the demand for their own services: we don’t know why students study
economics! Yet, as recruitment slumps in the 1980s and 1990s showed, academic
economists have a profound need to understand their market.
This paper aims to begin to address this lack of understanding. It draws on the
fine strands of literature about academic departments and their students, offers
economics departments information on why students may study economics at their
universities, and suggests that economics departments could benefit from knowing
their market better. It presents a chronology of adaptation and reflection in mixed-
methods research undertaken to illuminate this topic.
We began by employing a questionnaire to seek answers to seemingly simple
questions, such as which topics do students dis/like?, which teaching
methods/approaches do students dis/like?, do students like the nature of the subject or
is it the way it is taught that is crucial? and thus how should economics departments
market their subject? We briefly disclose answers that are constructively critical of the
subject. Areas are revealed that are worthy of further investigation.
In order to deal with the limitations of the questionnaire a number of focus
groups are established to further explore issues related to what economics students
consider to be the strengths of the subject, whether they perceive they have benefited
from their lessons and whether they perceive they could have benefited more from a
reorientation of the subject and if so what that reorientation should be. Answers to
these questions and understanding of these issues are vital pieces of information for
economics departments’ knowledge of what their current consumers want, for their
impending student recruitment rounds, and for the future of the subject. However, the
focus groups generated issues that questioned the usefulness of the generalities
identified using the questionnaire, and this made us revisit and re-estimate models
using the questionnaire data.
These analyses contribute to the literature by improving our understanding of
students’ perceptions of economics, emphasising the perceived strengths and
weaknesses of the subject, and suggesting a reshaping of the subject to respond to
students’ demand for a more useful and relevant subject that retains its kudos amongst
their peers and beyond. Accordingly, this paper highlights students’ negative
perceptions to and contemporaneously high values of the subject, a corollary of which
is the need to refocus research attention onto topics that are deemed most important to
students and therefore more pertinent for student recruitment and retention. These are
pertinent issues because of increasing costs for students of university places in many
countries and increasing competition for student recruitment between disciplines
especially when disciplines are considered by entering students as potential
substitutes.
4
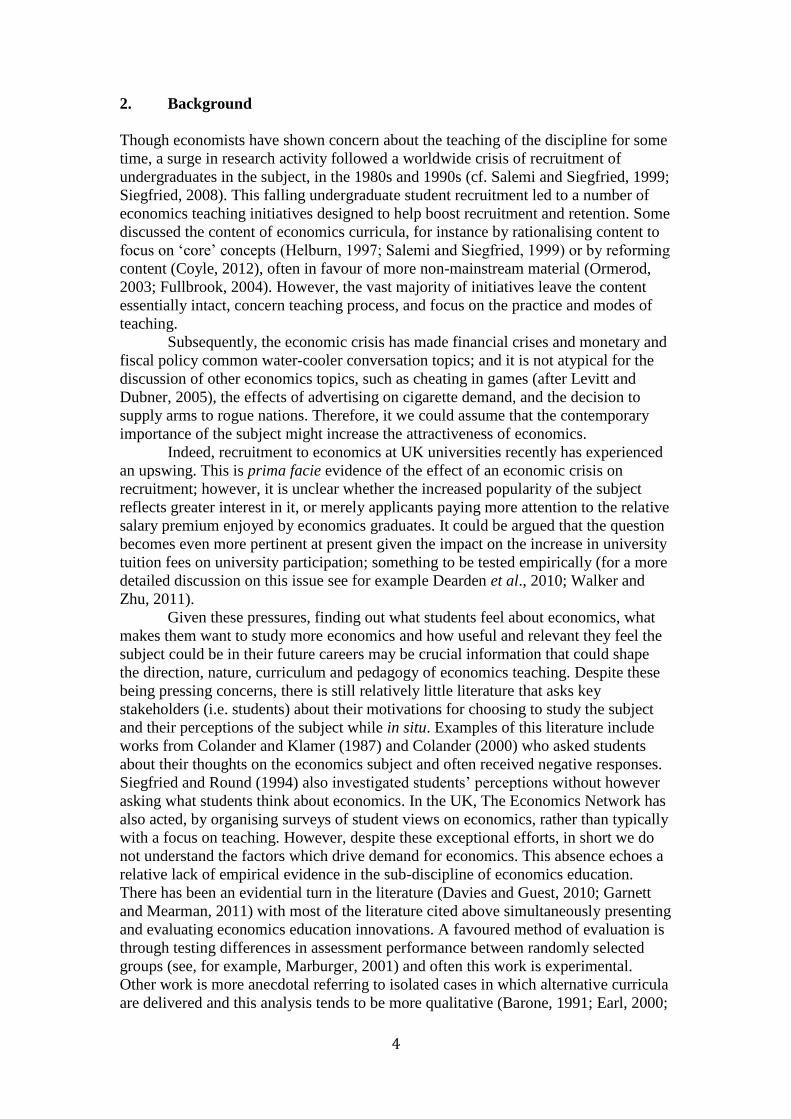
2. Background
Though economists have shown concern about the teaching of the discipline for some
time, a surge in research activity followed a worldwide crisis of recruitment of
undergraduates in the subject, in the 1980s and 1990s (cf. Salemi and Siegfried, 1999;
Siegfried, 2008). This falling undergraduate student recruitment led to a number of
economics teaching initiatives designed to help boost recruitment and retention. Some
discussed the content of economics curricula, for instance by rationalising content to
focus on ‘core’ concepts (Helburn, 1997; Salemi and Siegfried, 1999) or by reforming
content (Coyle, 2012), often in favour of more non-mainstream material (Ormerod,
2003; Fullbrook, 2004). However, the vast majority of initiatives leave the content
essentially intact, concern teaching process, and focus on the practice and modes of
teaching.
Subsequently, the economic crisis has made financial crises and monetary and
fiscal policy common water-cooler conversation topics; and it is not atypical for the
discussion of other economics topics, such as cheating in games (after Levitt and
Dubner, 2005), the effects of advertising on cigarette demand, and the decision to
supply arms to rogue nations. Therefore, it we could assume that the contemporary
importance of the subject might increase the attractiveness of economics.
Indeed, recruitment to economics at UK universities recently has experienced
an upswing. This is prima facie evidence of the effect of an economic crisis on
recruitment; however, it is unclear whether the increased popularity of the subject
reflects greater interest in it, or merely applicants paying more attention to the relative
salary premium enjoyed by economics graduates. It could be argued that the question
becomes even more pertinent at present given the impact on the increase in university
tuition fees on university participation; something to be tested empirically (for a more
detailed discussion on this issue see for example Dearden et al., 2010; Walker and
Zhu, 2011).
Given these pressures, finding out what students feel about economics, what
makes them want to study more economics and how useful and relevant they feel the
subject could be in their future careers may be crucial information that could shape
the direction, nature, curriculum and pedagogy of economics teaching. Despite these
being pressing concerns, there is still relatively little literature that asks key
stakeholders (i.e. students) about their motivations for choosing to study the subject
and their perceptions of the subject while in situ. Examples of this literature include
works from Colander and Klamer (1987) and Colander (2000) who asked students
about their thoughts on the economics subject and often received negative responses.
Siegfried and Round (1994) also investigated students’ perceptions without however
asking what students think about economics. In the UK, The Economics Network has
also acted, by organising surveys of student views on economics, rather than typically
with a focus on teaching. However, despite these exceptional efforts, in short we do
not understand the factors which drive demand for economics. This absence echoes a
relative lack of empirical evidence in the sub-discipline of economics education.
There has been an evidential turn in the literature (Davies and Guest, 2010; Garnett
and Mearman, 2011) with most of the literature cited above simultaneously presenting
and evaluating economics education innovations. A favoured method of evaluation is
through testing differences in assessment performance between randomly selected
groups (see, for example, Marburger, 2001) and often this work is experimental.
Other work is more anecdotal referring to isolated cases in which alternative curricula
are delivered and this analysis tends to be more qualitative (Barone, 1991; Earl, 2000;
5
Garnett and Mearman, 2011). We chose to follow the latter path and set out to
investigate the characteristics of economics as perceived by students with particular
emphasis on why students choose economics.
However, we suspect that one of the crucial factors in attracting students will
be relevance and realisticness.1 Developments in experiential and service-learning
(see Ziegert and McGoldrick, 2008) and problem-based learning (see Forsythe, 2010)
highlight the importance of relevance for engaging students. Specifically, our tenets
are that realistic theories may be superior to unrealistic ones and that greater
realisticness means more learning potential. However, at the same time, economics
may be dominated by people who do mathematics and statistics and do not understand
the economy (Colander and Klamer, 1987); and the distance from economics to
realisticness may be growing. Yet, Colander and Klamer showed further that a large
majority of students chose their PhD dissertation in order to understand some
economic phenomenon – underlining a desire for relevance. Thus, even committed
graduate students may become frustrated with too much mathematics and not enough
relevance. One of the research questions driving this study was to ask whether
students found either realisticness or relevance important in affecting their perceptions
of economics.
We now proceed to discuss the data collection carried out, and the analysis.
These develop in stages, as parts of an evolving structure of the study. The first
element was the deployment of an international online survey.
3. Deployment of an online survey
We start from the premise that the objects under study (economics and student
perceptions of it) are both complex. Students’ perception of economics are likely to be
affected by many factors, including the characteristics of economics, the way it is
taught, their perceived chances of success in it, and wider cultural norms of good
education.
As an initial step, we designed a questionnaire (see Appendix) containing
semi-closed questions (with closed answers, plus an option to comment), with Likert
scale responses quantified ex post. However, the final two questions are open, inviting
creation of free lists. The quantitative questions were of two types: biographical and
perceptual. Biographical questions addressed dimensions such as nationality, course
of study and career aspirations. Perceptual questions addressed students’ views of
economics. The questionnaire was predicated on the presumption that students regard
the relevance of economics to them as important in forming their view of the
discipline. Although the emphasis was placed around understanding why students do
economics, the questionnaire had several motivations and central research questions.
We use as a proxy for ‘wanting to do economics’ the question ‘I would do more
economics if possible’ (hereafter called ‘MoreEcon’).
Drawing on Webber and Mearman (2012), the study employed a range of
statistical analyses including ordered and binary logistic regression, factor analysis
and different types of cluster analyses. Webber and Mearman’s analysis suggested
that students found economics frustrating and limitedly useful, unless they had prior
1 This, perhaps awkward, term is used instead of realism. Realism is the simple philosophical tenet
that there exists a reality (somehow) independent of our conception of it. Most economists
subscribe to this belief. Realisticness is the demand that theory be realistic, i.e. grounded in the
reality, rather than based on fictional or purely instrumental concepts. Friedman (1953) is the
seminal modern rejection of realisticness.
6
work experience. Indeed, those students who think economics will help with their
future career, and help them make better decisions and understand others, want to
study more economics. However, these results are the product of empirically
analysing the whole data set which contains responses from students across the world.
However, because it seemed reasonable a priori that students in different countries
might act differently this study focuses on students studying in only one country: the
UK.
The online questionnaire employed convenience sampling2 and thus no claims
are made of representativeness or fully-generalizable results, even within the UK; but
general conclusions are drawn in the spirit of case-based methods (see Byrne and
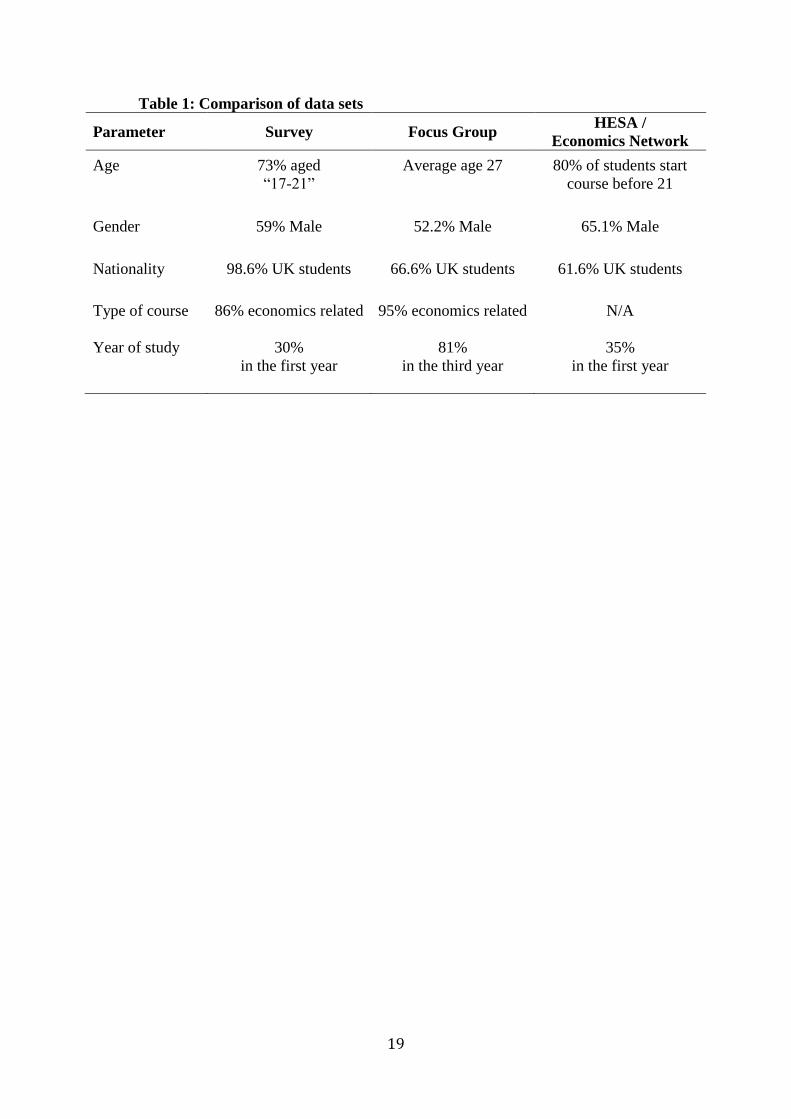
Ragin, 2009). While we would not expect the sample to be representative completely,
it is worth considering whether it indeed was. Although this is difficult to assess
because the questionnaire does not map directly on to any data source, UK Higher
Education Statistics Agency (HESA, 2007) data do offer some basis for comparison
which is summarized in Table 1.3 From this comparison, it could be deduced that in
our online survey there are slightly more females, more UK students and less first
year students than in the HESA Network data.
{Insert Table 1 about here}
The principal advantage of the survey tool was to be able to capture a snapshot
of economics and students’ perceptions of it, and to assess relationships between the
different perceptions and the biographical details of students. For this purpose the
analysis of the survey responses was structured in three parts including descriptive
statistics, ordered logistic regression analysis and cluster analysis.
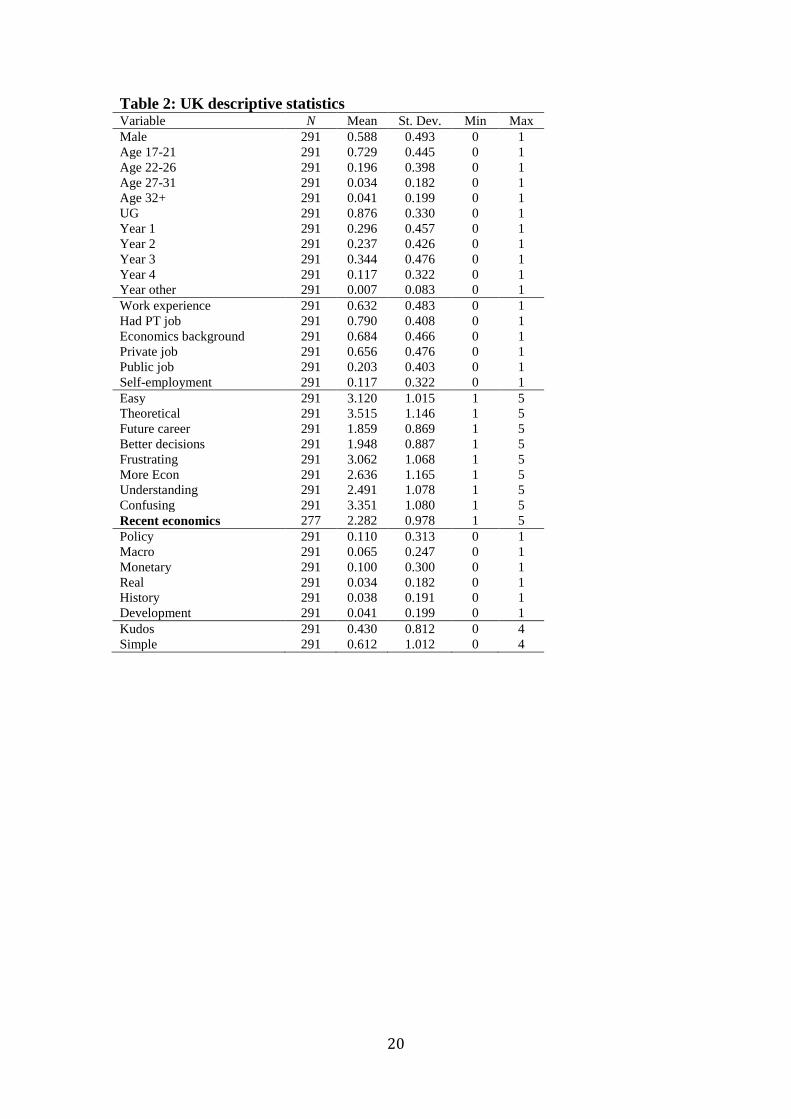
Table 2 presents descriptive statistics from the survey’s (ex post) quantified
questions. The sample is comprised of students who can be characterised generally as
studying for an undergraduate degree, having work experience, a part-time job and
wishing to work in the private sector. On average students find economics somewhat
easy, theoretical and confusing but do not think that it will help their future career,
help them make better decisions or improve their understanding.
{Insert Table 2 about here}
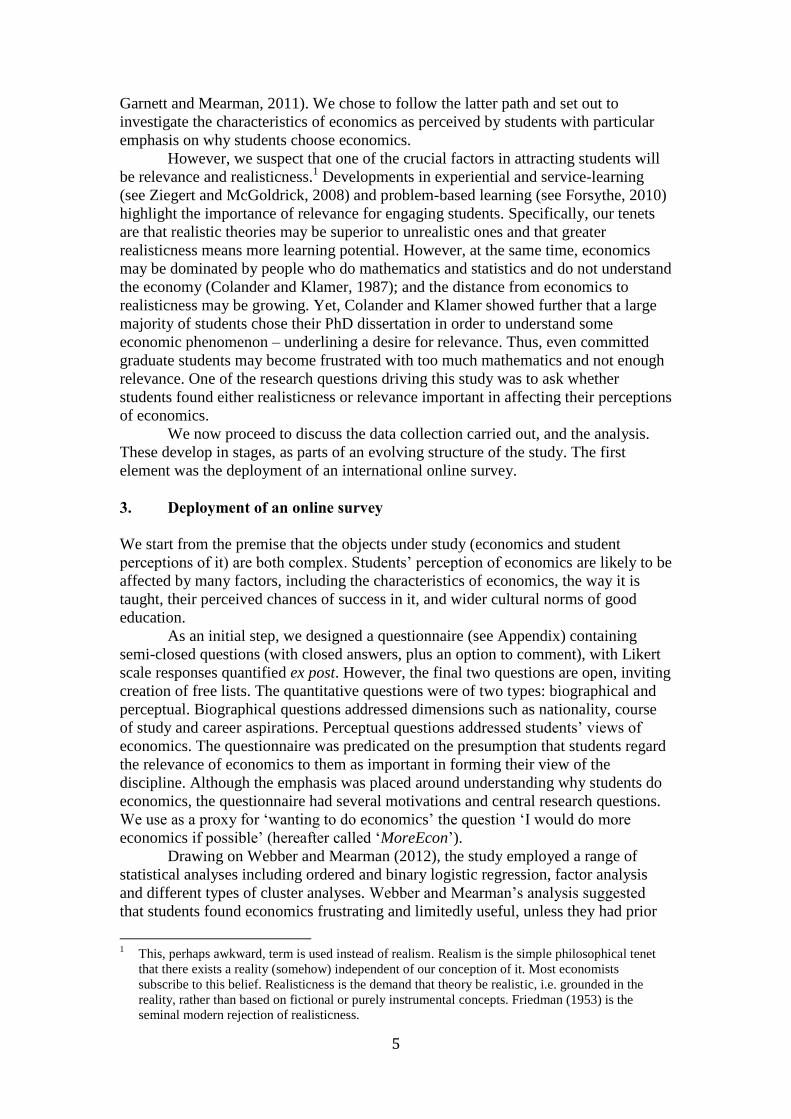
Of immediate note is that the mean score for MoreEcon is about 2.6, i.e.
indicating that economics students are, on average, weakly against studying more
economics. However, the variation of response is high (MoreEcon has the highest
standard deviation of all general discipline variables); as such it is worth exploring the
data more closely, partly due to the desire to examine what factors affect MoreEcon.
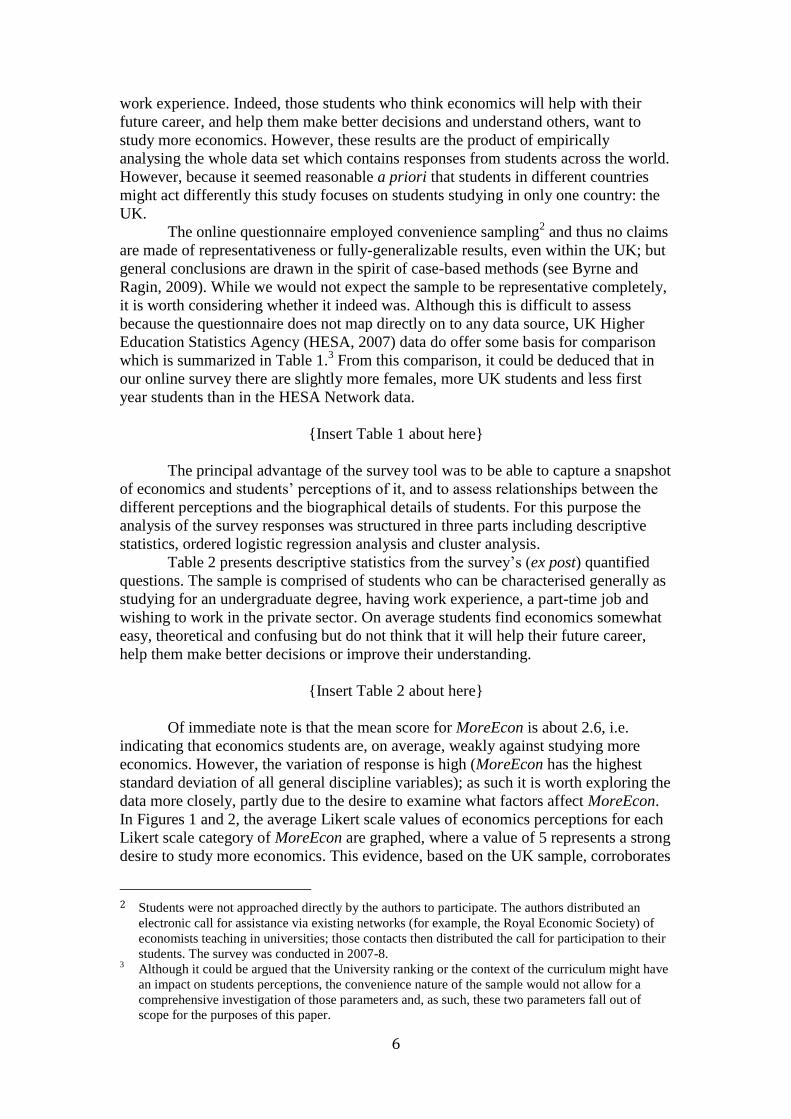
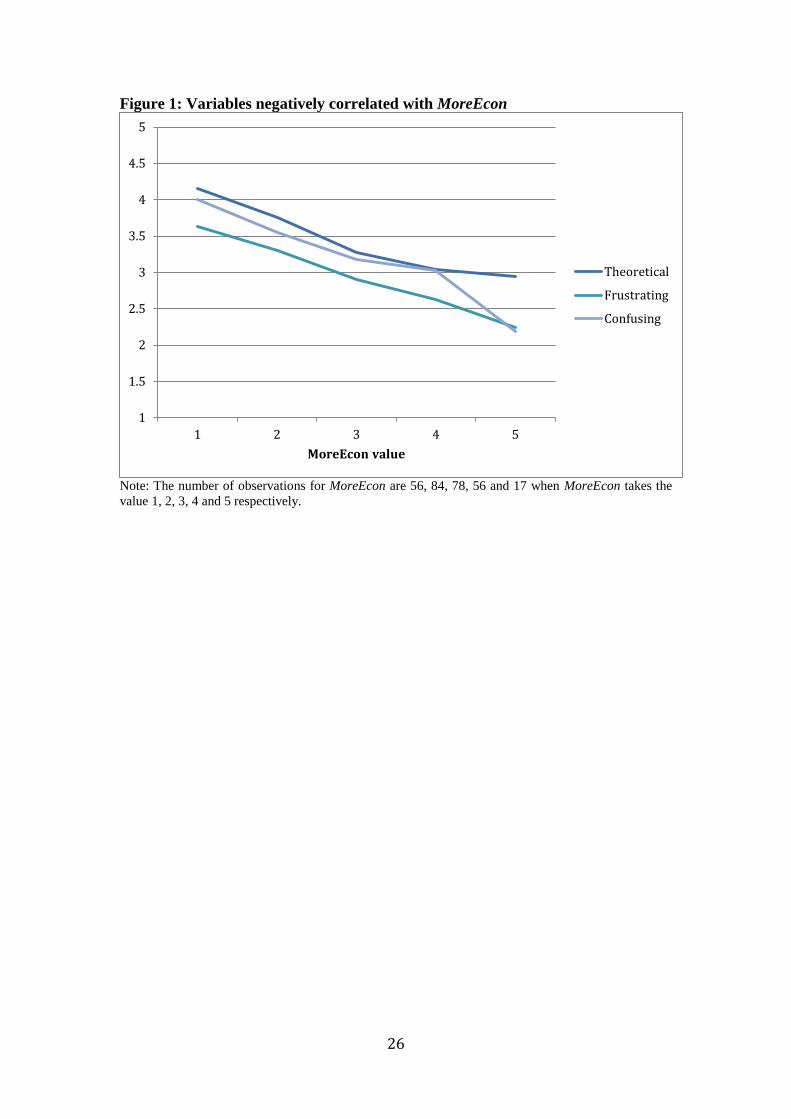
In Figures 1 and 2, the average Likert scale values of economics perceptions for each
Likert scale category of MoreEcon are graphed, where a value of 5 represents a strong
desire to study more economics. This evidence, based on the UK sample, corroborates
2 Students were not approached directly by the authors to participate. The authors distributed an
electronic call for assistance via existing networks (for example, the Royal Economic Society) of
economists teaching in universities; those contacts then distributed the call for participation to their
students. The survey was conducted in 2007-8. 3 Although it could be argued that the University ranking or the context of the curriculum might have
an impact on students perceptions, the convenience nature of the sample would not allow for a
comprehensive investigation of those parameters and, as such, these two parameters fall out of
scope for the purposes of this paper.
7
the international results in Webber and Mearman (2012). Figure 1 presents those
perceptions that are associated with a negative correlation between each perception
and MoreEcon: stronger perceptions that economics is theoretical, frustrating and
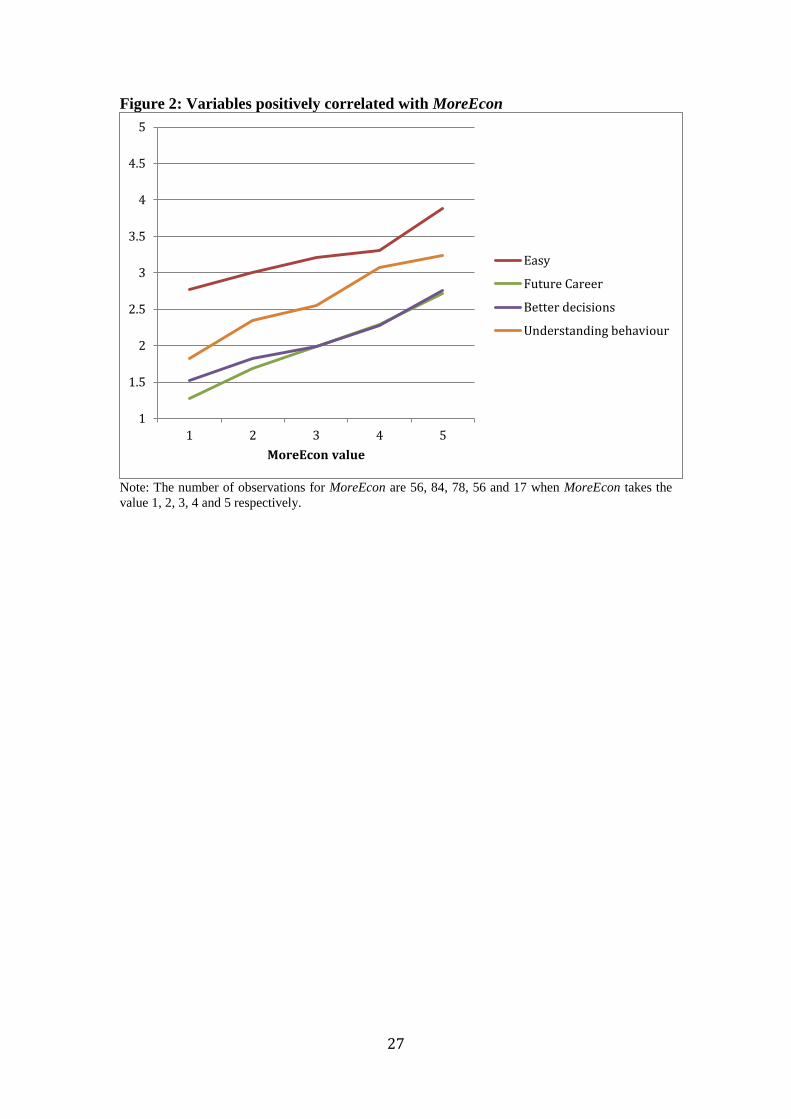
confusing are associated with lower desires for more economics study. Figure 2
illustrates that the perceptions that economics is easy, is helpful in their future career,
helps the student make better decisions and improves the student’s understanding of
other’s behaviour are all associated with greater desires for more economics.
{Insert Figure 1 about here}
{Insert Figure 2 about here}
It appears that highlighting usefulness and relevance by stressing how
economics can help future careers and improve decision making and understanding of
the world may enhance the likelihood that a student will want to study more
economics. Presenting economics in an abstract, theoretical manner where the
complexities of the issue are confusing and, potentially, frustrating for the student,
especially if they are unable to identify the relevance of the information, may result in
students being less likely to want to study more economics. We will return to these
issues below. At this point, it is worth examining the relationships between
perceptions more closely, and for this we employ cluster analysis.
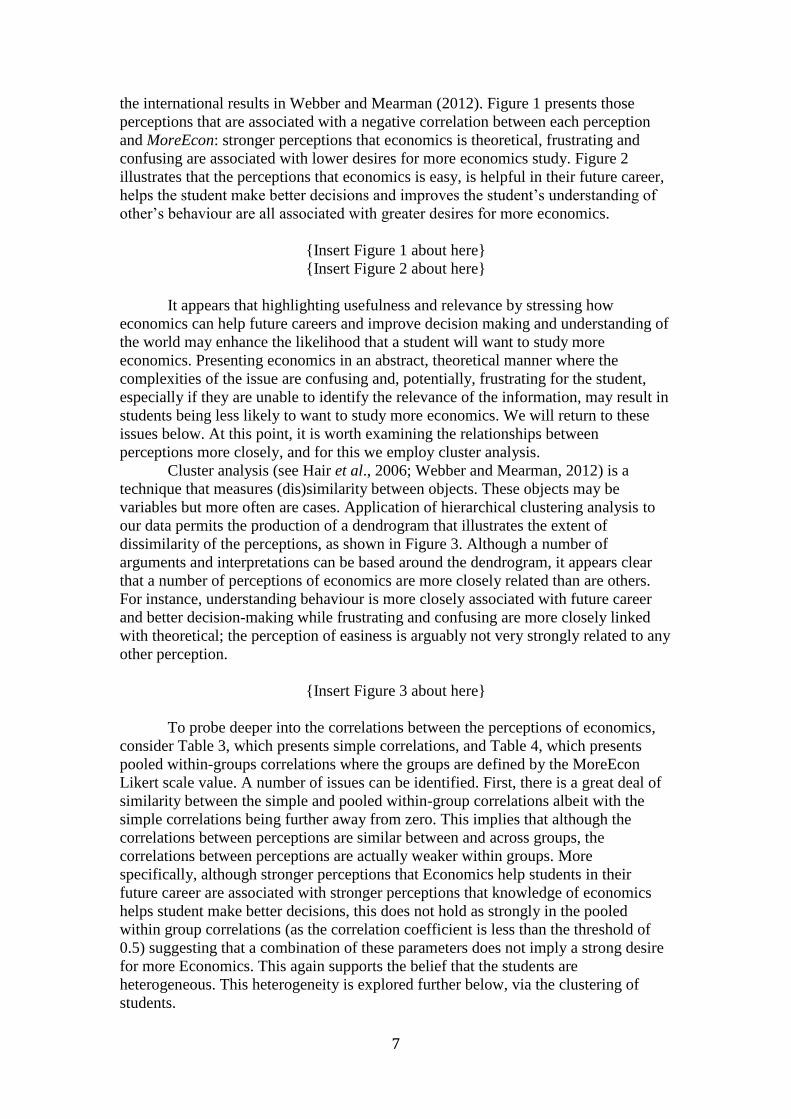
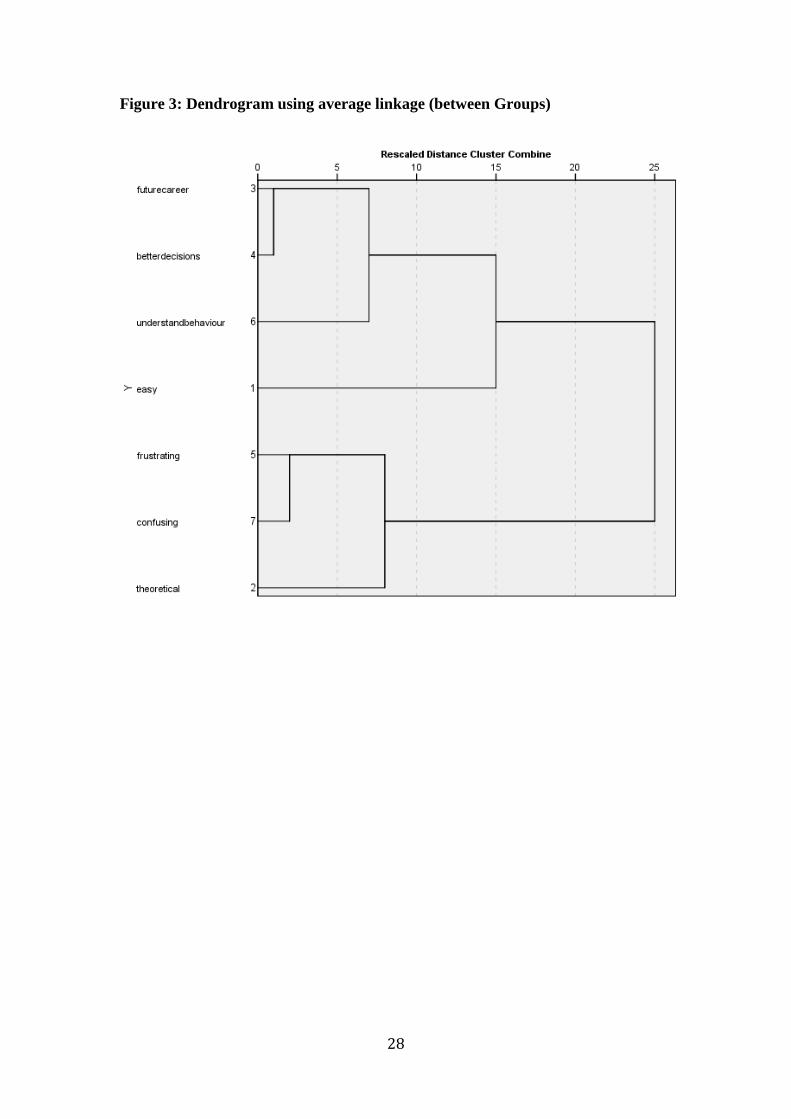
Cluster analysis (see Hair et al., 2006; Webber and Mearman, 2012) is a
technique that measures (dis)similarity between objects. These objects may be
variables but more often are cases. Application of hierarchical clustering analysis to
our data permits the production of a dendrogram that illustrates the extent of
dissimilarity of the perceptions, as shown in Figure 3. Although a number of
arguments and interpretations can be based around the dendrogram, it appears clear
that a number of perceptions of economics are more closely related than are others.
For instance, understanding behaviour is more closely associated with future career
and better decision-making while frustrating and confusing are more closely linked
with theoretical; the perception of easiness is arguably not very strongly related to any
other perception.
{Insert Figure 3 about here}
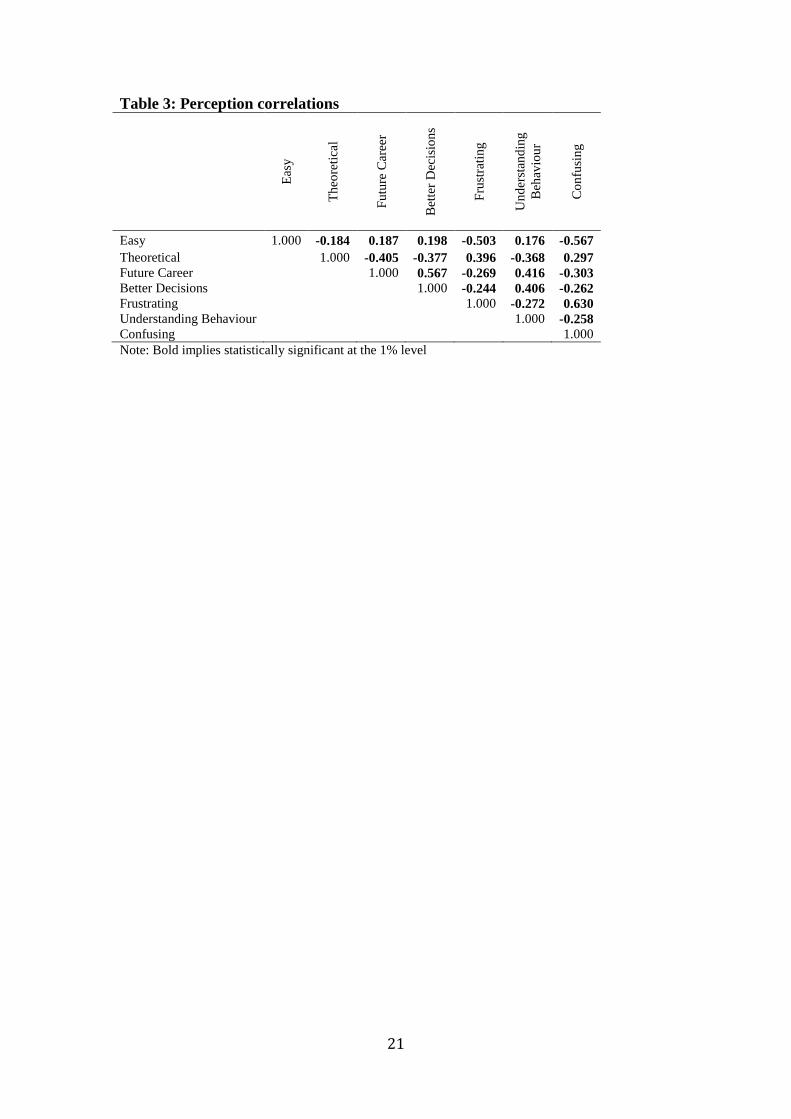
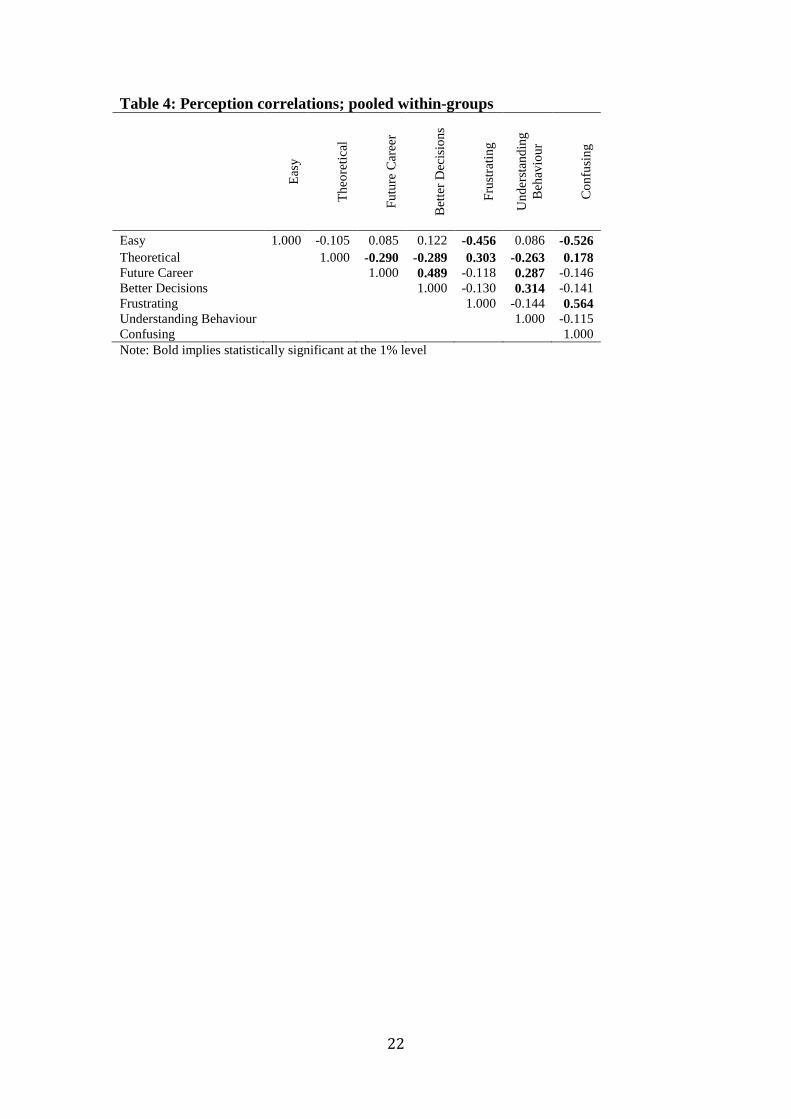
To probe deeper into the correlations between the perceptions of economics,
consider Table 3, which presents simple correlations, and Table 4, which presents
pooled within-groups correlations where the groups are defined by the MoreEcon
Likert scale value. A number of issues can be identified. First, there is a great deal of
similarity between the simple and pooled within-group correlations albeit with the
simple correlations being further away from zero. This implies that although the
correlations between perceptions are similar between and across groups, the
correlations between perceptions are actually weaker within groups. More
specifically, although stronger perceptions that Economics help students in their
future career are associated with stronger perceptions that knowledge of economics
helps student make better decisions, this does not hold as strongly in the pooled
within group correlations (as the correlation coefficient is less than the threshold of
0.5) suggesting that a combination of these parameters does not imply a strong desire
for more Economics. This again supports the belief that the students are
heterogeneous. This heterogeneity is explored further below, via the clustering of
students.
8
{Insert Table 3 about here}
{Insert Table 4 about here}
First though, as in Webber and Mearman (2012), we apply ordered logistical
analysis to the whole UK sample, to explore any general associations between
MoreEcon and some of our hypothesised influencing factors. The results of regression
analysis, as shown in Table 5, with MoreEcon as the dependent variable performed on
the UK survey, shows that students who have undertaken work experience, would like
to find work in the private sector, believe that economics will help their future careers
and help their understanding of others are more likely to want to study more
economics than those who have not. Overall, these results show that students who
find economics useful or illuminating want to do more of it. However, those students
who find economics frustrating or confusing are less likely to want to study more
economics. These results corroborate those in Webber and Mearman. This is
unsurprising, as the UK data are a subsample of their international data.
{Insert Table 5 about here}
These results highlight that students who have undertaken work experience are
2.164 times more likely, respectively, to want to study more economics than those
who have not. The odds-ratio is substantially greater (and the latter slightly smaller)
than the comparable statistics generated under the full sample. Students who believe
that economics has helped their future careers (help them make better decisions) are
1.979 (1.028) times more likely to want to study more economics relative to those
who believe the opposite, while those students who suggest that economics has helped
their understanding of others are 1.546 times more likely to study more economics
relative to those who do not suggest this is the case. However, those students who find
economics frustrating (confusing) are 1.307 (1.605) times less likely to want to study
more economics than the reverse.
To summarise our findings so far, our statistical analysis suggests that students
have an overall ambivalent or even somewhat negative view of economics; that there
is apparent association between perceptions of economics as being on the one hand,
useful and illuminating, but on the other hand overly theoretical and frustrating.
Further, we have some evidence that those students who perceive economics to be
useful want to do more of it, whereas those who find it frustrating do not. These
results are perhaps not surprising, but are of interest nonetheless. However, they do
not explain why economics is perceived in these different ways.
4. Focus groups
The quantitative analysis reported in section 3 offers some interesting results.
However, they are subject to several caveats. Principal amongst these is that the
analysis is strictly quantitative and does not allow the deeper exploration of the topic
area, although it does suggest patterns for deeper exploration using other data. It is
difficult using the data we have to draw any stronger conclusions about the meanings
of students’ responses or indeed about the reasons why they chose to study
economics. Thus, after reflection on the questionnaire methodology, we decided to
develop a follow-up qualitative analysis. This is consistent with the methodology of
9
mixed-methods research (see, for example, Downward and Mearman, 2007; Byrne
and Ragin, 2009).
The knowledge obtained from preliminarily investigating the UK sample led
to further exploratory investigation through focus groups. Focus groups allow group
dynamics to generate debate and some degree of consensus. Further, a series of focus
groups allows themes to be explored and for theoretical positions grounded in the data
to emerge.4 The focus group was semi-structured around a single open question:
‘How effective is economics in creating understanding of real-world issues?’ The
responses from focus groups have been maintained in their raw form apart from being
coded into qualitative groups. They have then been subjected to various qualitative
analyses, such as narrative analysis, thematic analysis, open and in vivo coding, and
analysis of key words.
Consistent with qualitative analysis, to some extent themes were allowed to
emerge in and from the focus groups. However, inevitably some priors did affect both
the conduct and analysis of the focus groups. Many of these flowed from the
questionnaire. Overall, the analysis of focus groups has generated three key themes,
namely valuable education, the prestige of difficulty, and realisticness and relevance.
Valuable education
Somewhat surprisingly, while our survey data report generally low satisfaction with
economics, our focus groups are more positive. The explanation for this could be
fourfold. It could be attributable to self-selection bias and social desirability bias,
given that the focus group moderator was one of the authors. Another explanation
could be the publicity the economic crisis attracted during the conduct of the focus
group discussions. A further explanation for the positive reaction to MoreEcon in
focus groups is that students want to feel that their education has been valuable, or at
least not wasted. Indeed, our students may be engaged in ex post rationalisation of
their choice. Education can be valuable in many senses: clearly it can generate
financial rewards. The graduate wage premium is well established (BBC, 2009) and
there is an additional wage premium for economics graduates relative to some other
subjects. The regression results above for our ‘Future career’ variable corroborate
that this is a concern for students, as those who believe economics will assist their
careers are more likely to demand more of it. With UK tuition fees rising, these are
likely to be growing concerns of students.
Other meanings of value emerged from the focus groups: economics must
offer deep, non-trivial insight into the world (implying that it must be applicable) and
it must enhance career prospects (which relates to the financial value of education).
Of these two aspects, the value of insights offered by economics is of particular
interest. We shall discuss below the importance to students of application and
relevance within economics, but first it is useful to illustrate how students feel that
economics confers on them special wisdom and insight. Moreover, it appears that
4 Focus group participants were identified via contacts made from the responses to the call for
participants in the survey. Focus group members sometimes knew each other, sometimes not. Focus
groups always involved students from the same university in each case. Students were paid 20
pounds Sterling for their participation. Summary statistics about the composition of the focus
groups are shown in Table 1. There is a priori reasoning to think that country-specific data would
exhibit less heterogeneity, because economics and attitudes to it may be somewhat culturally-
specific.
10
students feel that economics provides understanding not available to other students.
The insight comes in two forms.
First, economics confers distinct benefits pertaining to the understanding of
real events, for instance through policy analysis. As one student commented:
“I see the whole world very differently now to what I did before I did the economics
because I always think there's economics behind that, why markets are failing, why
things aren’t working.” (Male, 30, British)
Second, economics confers analytical and critical faculties within them which
are not found in other subjects. Mearman et al. (2011) discuss how pluralistic
curricula might generate critical and other cognitive faculties more effectively than
monist curricula. However, the critical capacities developed by economics appear to
be seen by students as inherent to it. Students often made favourable comparisons
between economics and other disciplines in terms of the intellectual development they
enjoy:
“Economics has helped me at the personal level as well, in understanding things that
I would not otherwise recognise or even take into consideration before I started
studying economics, it is probably the reason why I dropped management and started
doing pure economics” (Male, 22, Norwegian)
Students may well be consoling themselves that their choice of subject has
been a wise one. Several discuss having opted for economics at a crucial juncture
while others express regret that they opted for joint degrees in which economics is
downplayed. These students feel inferior to single honours economics students: many
of them make pointed use of examples of areas of economics of which they know
little or nothing and that the kudos available to students is not exploited fully.
Significantly, many of these areas are technical. Some students worry that their
mathematical training is inferior to some of their peers as they worry that they are
inadequately trained. It is noteworthy that this complaint is made even when students
express concern that mathematics is itself problematic (see below).
Perceiving economics as having kudos is important for a number of reasons.
One relates to financial value, as discussed. Another reason relates to social status.
Many students imply that they are intellectually superior to their friends. More often,
participants cited their ability to argue more effectively with their parents. They
clarified that this new empowerment was specifically a feature of their having studied
economics, rather than merely reflecting their greater maturity:
“I think it did make me think again about a lot of things that I took for granted, I
started disagreeing maybe with some of the things that my parents were saying, that,
you know, this is the first thing that shows you that something’s changing. Age could
be one factor, but another factor is definitely, I think, you know, studying that subject
gives you these skills.” (Male, 21, French)
So, for our students, economics confers social status and distinction; an
interesting question is: why? As already discussed, students see economics as
providing insight into real world issues. Additionally, economics provides skills of
argumentation and judgement, which allows them to understand and negotiate often
very complex debates. This suggests that students see economics as making them
11
better decision-makers. Note that the questionnaire survey results (Table 5) suggested
that the perception that economics helps in making decisions was associated with
students wanting more economics study.
One focus group discussion concluded that people skilled in economics would
be able to manage their lives better than people without economics training. Even if
having knowledge of economics would not have changed the decision made,
participants held that they would have understood it better and perhaps been more
efficient in how they made it. Here, arguably, students engage in ex post
rationalisation of past decisions, even efficient ones.5
However, the students see economics as able to provide purchase in bigger
decisions. Some participants cited the access to power which economics provides.
Recent discussion of the value of the PPE degree would reinforce that view.6 One
student mentioned that the then Prime Minister, Gordon Brown, had some training in
economics. Macroeconomics and policy was found to be generally more popular in
focus groups. One of the reasons for this is that policy analysis allows access to
powerful decisions and thereby the ability to influence real events. Having said that,
focus group participants were torn as to whether the knowledge of economics as
taught improved this influence; in some senses they did not like the potential conflict
and confusion between policies and they preferred a definite answer; but equally they
did want economics to be ‘scientific’.7
The prestige of difficulty
We argue here that, as perceived by students, the value or kudos of economics resides
in multiple dimensions: as we have seen, improved decision-making and
understanding is one angle; employability is another; relevance and realisticness is yet
another (see below). However, another aspect of the kudos of economics is that it is
perceived to be difficult. But, difficulty has many dimensions, some of which conflict
with the kudos of relevance and application. As discussed above, one dimension is
that economics can involve confusing debates. Our students felt that it is the skill of
the economist that they can negotiate these debates. This finding appears to run
contrary to the generally negative role of confusion in the questionnaire survey data.
Another dimension of prestige is that economics may be considered a science.
In two of the five focus groups, participants discussed (unprompted by the moderator)
whether economics is a science. In both cases, the final conclusion was that indeed it
is a science, albeit not the same as, say, physics. Indeed, in one discussion, it was
considered evidence of the kudos of economics that it is scientific in a unique way:
“…so it’s true like it’s an endless debate to call it a science, or an art, that’s what
makes it special I think. That’s what makes it interesting…” (Male, 21, French)
5 There is debate as to whether economics students do make better decisions (cf. Carter and Irons,
1991). Cadsby and Maynes (1998) argue that economics students are more rational; Miller (1999)
said students learned what was supposed to be appropriate behaviour. Frank et al. (1993) showed
that students who do institutional economics were less selfish than standard economics students.
This finding may be due to self-selection. 6 BBC, ‘Why does PPE rule Britain?’, 1 September 2010. Available at
http://www.bbco.co.uk/news/magazine-11136511. Accessed at 14:05 GMT on 9 September 2010. 7 An issue which was not discussed in the focus groups was whether the students’ training had
reinforced this desire for scientificity: that is a question for further research.
12
Yet another dimension of difficulty (and indeed of traditional scientificity) is
the mathematical content of economics. Focus group participants were highly
ambivalent about mathematics. On the one hand, drawing on the association of
mathematics with science, and also reflecting the perception of mathematics as
difficult, the mathematical content in economics is seen by many students as
conveying prestige. It is part of the distinctive tool kit of economists, and something
which separates them from softer social science, humanities or even business
disciplines. It is interesting to note that the prejudice, commonly held to exist, that
business subjects are intellectually inferior to economics, is evident in these focus
groups. Most of the focus group participants (see Table 1) were doing some
combination of economics on its own or with another subject, often a business
discipline such as marketing. Where a preference was expressed, students favoured
economics over their other discipline.8
So, mathematics confers prestige on economics by being perceived as
difficult, both by students of economics and (some) other disciplines. This difficulty
confers two psychological benefits, of impressing the students’ friends, and of
generating a sense of achievement within the students themselves. This feeling, allied
with the others aforementioned, gives economics a powerful attractiveness. Further,
students who were on joint degrees often complained that they were not proper
economists because they had not had sufficient mathematical (and/or statistical)
training.
However, students often offered strong objections to mathematics, in line with
other research conducted into students’ satisfaction with economics (see Economics
Network, 2010). In particular, participants objected to what they considered excessive
mathematics. It becomes excessive when it is divorced from reality and is extremely
abstract. Such a complaint lies behind successive calls by students for better use of
examples in teaching, and behind advocacy to teach mathematics and statistics for
economists via examples:
“Now, to make it a mathematical problem and make it elegant, neo-classical is just...
is lovely, but the reality is it's not how the real world works” (Male, age not provided,
British).
Realisticness and relevance
The above findings highlight the perceived strengths and weaknesses of economics
that may shape the desire to study more economics; they relate to the importance of
economics study, as perceived improvements in both understanding and future career
prospects are associated with the desire to study more economics. Of much less
significance is the ease of passing or gaining the certificate, as the easy perception
appears to be much less important. Further, they underscore the relevance of
economics (had work experience, aiming for a private job or self-employment,
already had a part-time job) to the real world. As discussed in section 2, one of the
main drivers of this study was to investigate the role of relevance and realisticness in
rendering economics attractive to students.
The above discussion also suggests that if students regard the subject matter as
excessively mathematical, or too theoretical or abstract in other ways, it becomes
8 This finding may reflect that the students recognise the moderator was an economist; however, the
accompanying comments were consistent with a genuine belief that economics is perceived as
superior.

13
unattractive. It has also been argued that (non)usefulness is a key element in
economics being (un)attractive. These two findings suggest the importance of
grounding economics teaching in real world situations. ‘Real-world’ can mean at least
two things: realisticness, and relevance. This question is evident in the survey
questions on ‘theoretical’ and ‘realworld’, as well as in the single question set for the
focus groups.
In discussing realisticness, we are veering into well-trodden methodological
territory. Realisticness would imply that assumptions, models, theories, etc. should be
anchored in reality and endeavour to reflect features of reality, as they are understood.
However, a reading of Friedman’s (1953) highly influential essay is that realisticness
does not matter. Critics of his position suggest that realistic theories are more likely to
be true (Lawson, 1997), and therefore, more illuminating. What are the implications
of these arguments on teaching economics?
For advocates of greater realisticness, it would have several benefits for
teaching economics. First, if realisticness increases the truth content of theories,
teaching realistic economics will furnish students with extra economic knowledge.
Second, if these theories are more illuminating, they will be more attractive to
students. Third, realistic theories are also more accessible to students because they
appear grounded in a plausible reality. An interpretation of Sutton (2000) is that a
central problem for economics is that inquisitive students have their curiosity quashed
by increasing levels of abstraction and the repeated engagement with models of
increasing technicality but decreasing realisticness or relevance to them. It is clear
from Bloom (1956) that engagement (and application) is necessary for learning. Thus,
more realistic economics will lead to improved learning.
Other literature focuses on the related claim that relevance is related to
learning; the Problem-Based Learning (PBL) literature claims this. Results of other
student surveys (see Economics Network student surveys) consistently report that
students emphasise that the relevance of the subject is important. One interpretation of
this is that the subject is too distant from reality to be of interest. Indeed, our
questionnaire survey results support this finding: when economics is perceived as too
theoretical then it makes it less attractive. Further, our focus groups support this
finding and our participants report that extreme abstraction can be a real problem:
“I think it’s [perfect competition]… it’s not too important but there is, obviously
there’s parts of it that are, you know, are still relevant to today, but it’s not, well just
the ideas behind it are not that, you know, not that important I don’t think, very much,
very realistic.” (Female, 21, British)
Generally, microeconomics tends to be less popular than macroeconomics (as
the questionnaire survey data found – results not reported for brevity) because it is
regarded as less realistic, less applicable and therefore less useful (and hence does not
have the power to illuminate specialist areas of interest) than macroeconomics:
“It’s probably because you can apply macro to the problems you see” (Female, 20,
British).
Perhaps students have not been doing as much microeconomic policy; perhaps
microeconomics is taught differently from macroeconomics with less emphasis on
policy. Crucially, microeconomics is also less popular because the abstraction is
regarded as making it overly-simplified, i.e. making things too simple, whereas
14
complexity is regarded as being difficult and therefore having kudos. Participants also
suggested that in this context, mathematics may be regarded as a problem. If
mathematics gets in the way of realisticness or application, it is regarded as unhelpful
and this is something which turns people off economics. Important elements from
other disciplines ought to be included, perhaps at the expense of mathematics. There
is a tension between wanting something which is realistic, applicable and relevant,
and the desire to achieve kudos of the subject.
5. On reflection, let’s return to the quantitative data
The focus group data generated a number of significant findings. Economics is held in
a more positive light than in the survey. Regard for economics seems to come from
students’ beliefs that studying it offers them an education which is valuable in terms
of financial benefits, but perhaps more significantly in terms of the insights it can
provide, the critical faculties it cultivates, and a general kudos of the subject, some of
which is attached to its scientificity, and its difficulty. However, one of the principal
sources of difficulty, mathematics, plays an ambiguous role: it can also turn students
against economics if it removes them too far from realisticness, and thereby
relevance. Significantly, some of the findings were suggested in the questionnaire
survey data, but the focus groups uncovered new findings, and deepened our
understanding much more.
However, the focus group findings are also subject to a number of caveats. As
noted earlier they may have suffered from self-selection and social desirability biases.
Further, the heterogeneity of the sample which (despite its strengths, also)
complicated the analysis of the survey data is also present in the focus groups. As
Table 1 shows, the composition of the focus groups makes it unlikely that we have a
representative sample. Finally, on a more positive note, we can say that the focus
group data point to further opportunities to analyse the survey data.
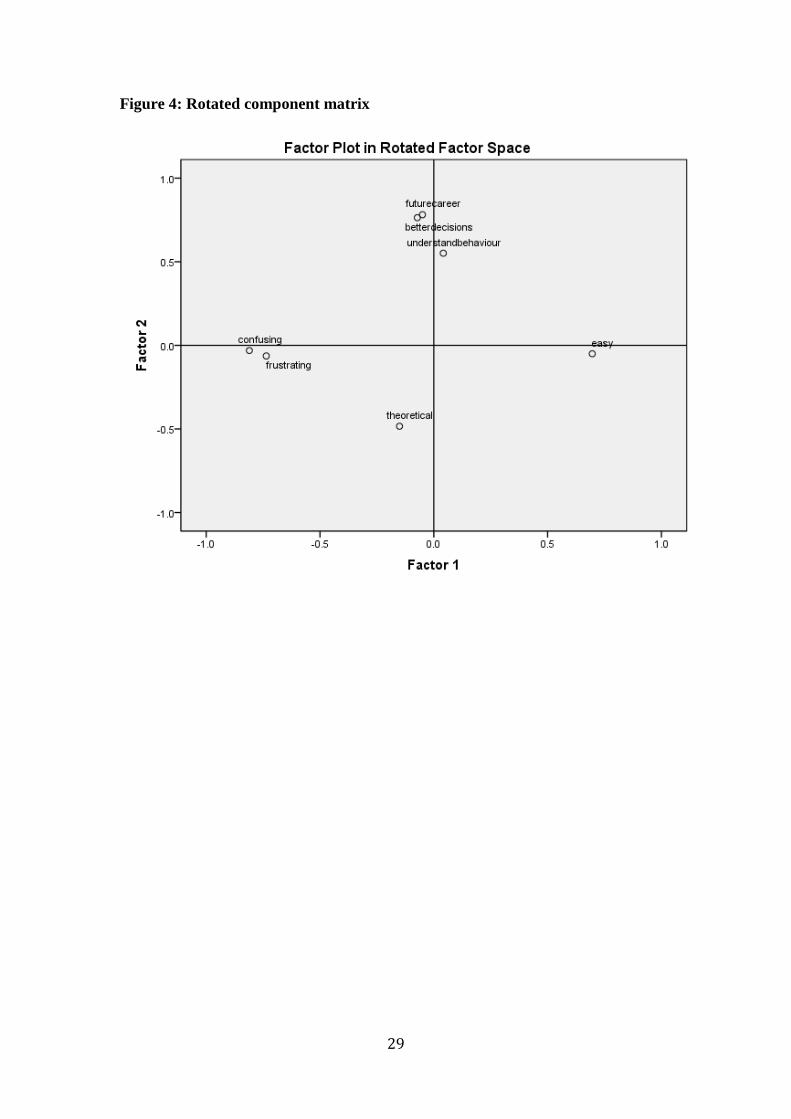
Accordingly, the perception variables (easy, theoretical, future-careers,
better-decisions, frustrating, understanding-behaviour and confusing) were analysed
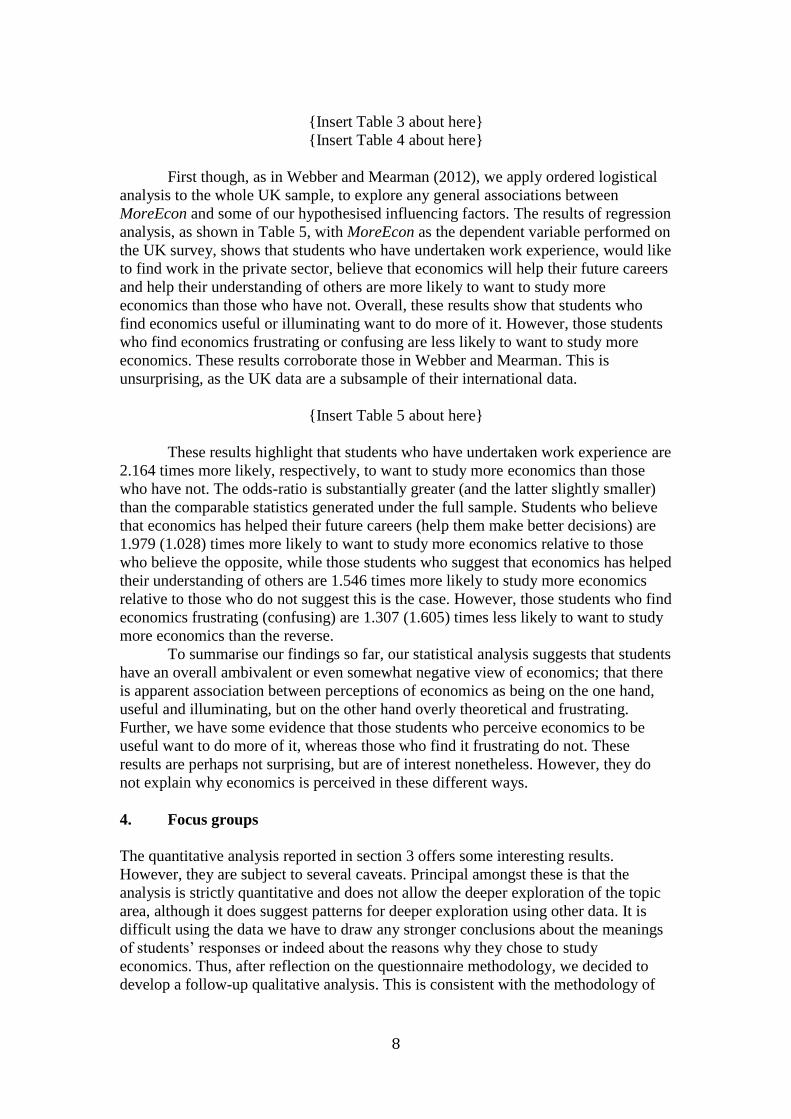
to generate a dimensions reduction and produce corresponding factors. The output
generated a Kaiser-Meyer-Olkin (KMO) value is 0.788, which is an acceptable value
to continue the analysis, and a Bartlett’s test of sphericity value with p=0.000.
According to these results, the sample size of the survey is sufficient for analysis and
there are 2 factors that can be extracted from the data, suggesting that these
perceptions can be summarised as being two dimensional. The values of the
component after an Oblimin with Kaiser Normalization rotation are presented in
Table 6 and the accompanying rotated component plot is presented in Figure 4. Factor
1 can be seen as representing a useful or valuable continuum, with better-decision,
understanding-behaviour and future-career having a diametrically opposite effect
from theoretical. Note that easy, confusing and frustrating play little part in
influencing this continuum. Factor 2 can be seen as representing a challenge
continuum, with it being dominated by perceptions of confusion, frustration and
easiness.
{Insert Table 6 about here}
{Insert Figure 5 about here}
The identification of these two factor continuums corroborate the correlations
above and point us towards revisiting the regression presented in Table 5 in two ways.
15
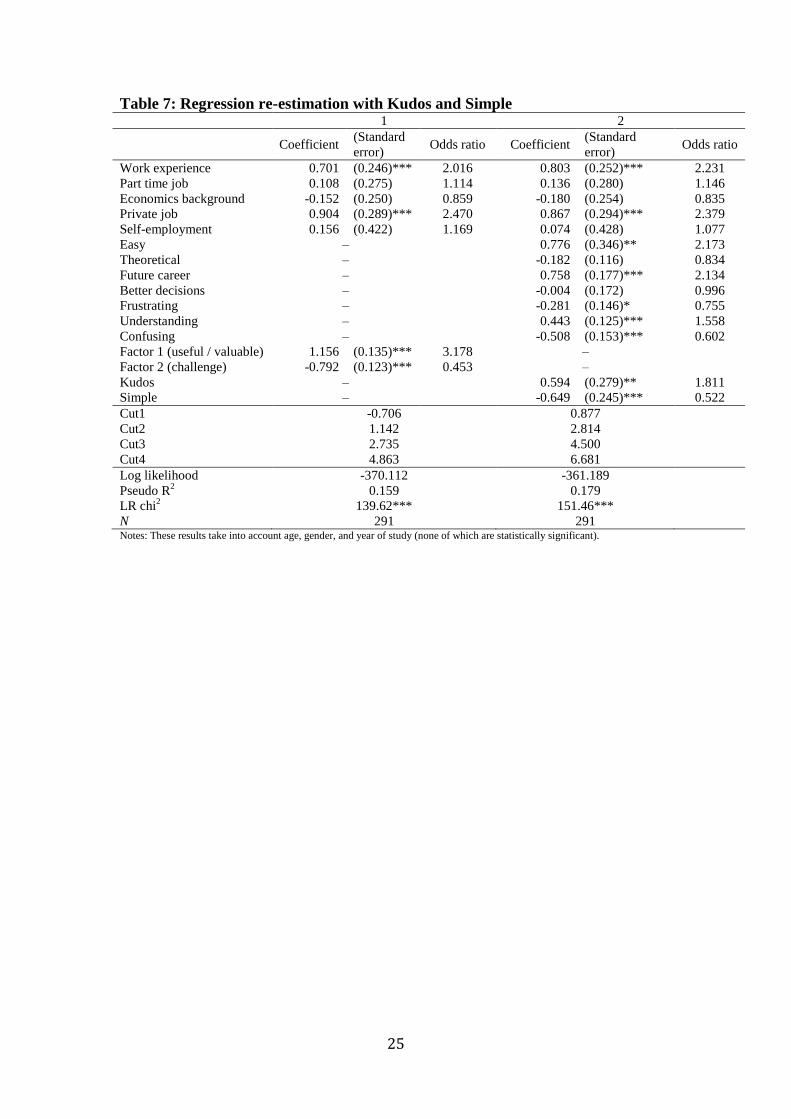
Our first option is to use these perception continuums to replace the individual
perception variables; these results are presented in column 1 of Table 7. These results
suggest that the more useful and valuable economics is perceived to be by the student
then the greater likelihood that the student will want to study more economics.
Similarly, the more challenging economics is perceived to be by the student then the
lower the likelihood that the student will want to study more economics. Qualitatively
similar results are maintained for the other variables in the model.
{Insert Table 7 about here}
Second, because of the reported importance of the kudos of economics in the
focus groups, we wished to explore this element in the questionnaire survey data.
Therefore, we constructed two new variables, called kudos and simple. The easy
variable, which originally was coded 1 (strongly disagree) to 5 (strongly agree)
according to the extent that the student agrees with the statement that “I find
economics easy,” was recoded to generate kudos (which takes a value of zero if easy
originally had values of 3, 4 or 5, and has a value of 4 and 1 if easy was originally
coded 1 and 2, respectively) and simple (which takes a value of zero if easy originally
had values of 3, 2 or 1, and now has a value of 1 and 4 if easy was originally 4 and 5,
respectively). Table 5 suggested that the perception that economics is easy has no
effect on the desire for more economics study. This may be surprising because of the
expectation that students who like the subject may also think that they are good at it.
Separating the easy variable into three may be opportune if the variable is actually
capturing three distinct dimensions: i) a reflection that if it is, in fact, easy, ii) a
reflection that the perception of difficulty is associated with kudos, and iii) a reflection
that it has no real value because it trivializes the real world down to inappropriately
simple models. A re-estimation of the regression presented in Table 5 but now
including Simple and Kudos is presented in column 2 of Table 7. It can be seen that
all variables (excluding easy) that were in the original regression in Table 5 are stable
to the inclusion of these extra two variables. The only main differences are the
following: first, the easy variable is now suggesting that if economics is indeed
perceived to be easy then students will be 2.173 times more likely to want to study
more of it; second, if economics is perceived to bring kudos then students will be
1.811 times more likely to want to study more of it; third, if economics is perceived to
be simple then students will be 1.916 times less likely to want to study more of it.
These findings are in line with the results of the focus groups.
The final stage of the quantitative analysis is to investigate any patterns in the
questionnaire survey data that were suggested either in its qualitative open questions
or by the findings of the focus groups. Several areas were mentioned comparatively
frequently as useful traits of economics: policy, macro, monetary, real, history and
development. We applied ordinary logistic regression with the dichotomous
dependent variable being whether the student cited a specific term – for example,
‘policy’ – in each of the two open questions relating to what students found useful
(Q14) and what they would have liked more of (Q15). These results revealed the
following.9 First, students who had work experience were less likely to discuss
‘monetary’ issues. Second, students who found economics to be theoretical were less
likely to discuss ‘real’ issues, thereby suggesting these students could not see the
relevance of the theory. Third, students who found economics to help their
9 Table not provided for brevity.
16
understanding of behaviour were more likely to discuss ‘real.’ Fourth, interestingly,
students who found economics to be confusing were more likely to discuss ‘real’
issues; this may be because they recognise that the real world can be complex and
confusing.
Perceptions of how easy or theoretical economics should be are of immense
interest to economics departments. Our results presented in Table 7 suggest that those
students who find economics to be easy were 2.173 times10
more likely to want to
study more economics while those students who report that they perceive economics
to be theoretical were 1.199 times11
less likely to want to study more economics, all
relative to students who do not report these traits.
5. Conclusions
This paper has presented findings from a research project into UK economics
students’ perceptions of the subject using a combination of data collected via an
online questionnaire and focus groups, and involving a range of statistical and
qualitative analyses. The data collection in the focus groups was somewhat informed
by the analysis of the questionnaire data. Throughout the research process, there has
been unambiguous interaction between the different data collection and analysis
processes. Thus the research can be said to be located in the tradition of mixed-
methods research, and to some extent in case-based research. However, as our
chronological, reflective paper demonstrates, the research design was adaptive and
emergent: whilst the original intention was to collect data from a survey, and then
from focus groups, the exact mixing was not pre-determined. Moreover, while the
purpose of the research was to develop a picture of students’ perceptions of
economics, and in particular to explore the role of relevance and realisticness in that,
the final set of research questions and findings were not determined a priori.
The paper has identified several interesting findings. Students appear to value
economics for several reasons, namely its ability to confer superior understanding of
world issues, rigour, improved decision making, enhance career prospects and,
crucially, difficulty. Difficulty confers kudos on economics which emphasises
difficulty somewhat for its own sake. However, where difficulty involves excessive
theorisation and abstraction which conflicts too strongly with the usefulness of the
subject, students regard economics more negatively. These findings support the
common anecdotal observation that students tend to prefer macroeconomics, with its
greater root in history and policy, to microeconomics, which can be abstract and
ahistorical.
These findings, though tentative, suggest several implications for economics
curricula and teaching. As students value difficulty, there is no immediate need to
strip out such material from curricula (even if this were possible given the nature of
economics). However, students appear to demand difficulty plus application. This
finding supports recent moves towards greater use of examples and, say, the
embedding of mathematics into economics modules (see METAL, Economics
Network, 2012); however, it suggests that these moves should be accelerated. Our
findings support those of Colander and Klamer (1987) who suggest that economics
can be perceived as too technical and divorced from reality. Our findings support
10
Corresponding figure in Webber and Mearman (2012) was 1.21. Their low figure may reflect the
whole sample being comprised of students from across the world. 11
Corresponding figure in Webber and Mearman (2012) was 1.15, thereby emphasising the external
validity of our UK results.
17
greater use of policy analysis, as this is seen by students as offering important insight
and even access to power, even if that power is limited to students impressing their
immediate social spheres.
Overall we find that students rationalise their choice of economics by
emphasising that they want their education to be valuable, where value has many
dimensions. The implications for teaching and curriculum design are that relevance,
usefulness and realisticness but also perceived difficulty are sine qua non for
attracting students to economics. Significantly, because our data was collected (in
2007) before the economic crisis, we can claim that it does not merely reflect that
crisis. We would surmise that data collected more recently than ours would stress
even more strongly the importance of the perceived (by students) power of economics
to be relevant, illuminating and prestigious.
References
BBC (2009) http://news.bbc.co.uk/1/hi/education/8401267.stm
Barone, C. (1991). ‘Contending perspectives: curricular reform in economics’, Journal of Economic
Education, 22 (1), 15-26.
Bloom, B. (1956) Taxonomy of Educational Objectives, The Classification of Educational Goals –
Handbook I: Cognitive Domain New York: McKay
Byrne, D. and Ragin, C. (2009). Sage Handbook of Case-Based Methods, London: Sage.
Cadsby, C. and Maynes, E. (1998). ‘Laboratory experiments in corporate and investment finance: a
survey’, Managerial and Decision economics, 19 (4-5): 277-298.
Carter, J. and Irons, M. (1991). ‘Are Economists Different, and If So, Why?’ The Journal of Economic
Perspectives, 5(2): 171-177.
Colander, D. and Klamer, A. (1987). ‘The Making of an Economist’, Journal of Economic
Perspectives, 1 (2): 95-111.
Colander, D. (2000). ‘Telling Better Stories in Introductory Macro,’ American Economic Review 90:
76-80
Coyle, D. (2012) (ed.) What’s the use of economics? Teaching economics after the crisis, London:
London Publishing Partnership.
Davies, P. And Guest, R. (2010) ‘What effects do we really have on students’ understanding and
attitudes? How do we know?’, International Review of economics Education, 9 (1): 6-9.
Dearden, L., Fitzsimons, E. and Wyness, G. (2010) ‘The Impact of Higher Education Finance on
University Participation’, Department for Business, Innovation and Skills Research Paper No.
11(http://dera.ioe.ac.uk/479/)
Downward, P. and Mearman, A. (2007). ‘Retroduction as mixed-methods triangulation in economic
research: reorienting economics back into social science’, Cambridge Journal of economics 31
(2): 77-99.
Earl, P. (2000). ‘Indeterminacy in the economics Classroom’, in Earl, P.E. and Frowen, S.F. (Eds.):
economics as an Art of Thought: Essays in Memory of G.L.S. Shackle, pp. 25-50, London:
Routledge.
Economics Network (2010). Student Survey available at http://www.economicsnetwork.ac
.uk/projects/stud_survey2010
Economics Network (2012). Mathematics for Economics: enhancing teaching and learning (METAL)
project http://www.metalproject.co.uk/
Forsythe, F. (2010). ‘Problem-based learning’, Handbook for economics Lecturers, Bristol: economics
Network. http://www.economicsnetwork.ac.uk/handbook/pbl/
Frank, R., Gilovich, D. and Regan, T. (1993). ‘Does studying economics inhibit cooperation? Journal
of Economic Perspectives, 7 (2): 159-171.
Friedman, M. (1953). ‘The methodology of positive economics’, Essays in Positive economics,
Chicago: University of Chicago Press.
Fullbrook, E. (2004) (ed.) A Guide to what’s wrong with economics, London: Anthem.
Garnett, R. and Mearman, A. (2011). ‘Contending Perspectives Twenty Years on: What have our
Students Learned?’, International Journal of Pluralism and economics Education, forthcoming.
Hair, J., Anderson, R. Babin, B., Black, W. and Tatham, R (2006). Multivariate Data Analysis, New
York:.
18
Helburn, S. (1997). ‘ECON 12 and the New Social Studies: Love’s Labour’s Lost?’, The Social
Studies. 88 (6): 268-76.
HESA (2007). Heidi database, London: Higher Education Statistics Agency.
Lawson, T. (1997). Economics and reality, London: Routledge.
Levitt, S. and Dubner, S. (2005). Freakonomics: A Rogue Economist explores the Hidden Side of
Everything, Penguin.
Marburger, D. R. (2001). ‘Absenteeism and Undergraduate Exam Performance’, Journal of Economic
Education 37 (Spring): 148-155.
McGoldrick, K.-M. and Ziegert, A. (2002) (eds). Putting the Invisible Hand to Work: Concepts and
Models of Service Learning in Economics. Ann Arbor, MI: The University of Michigan Press. Mearman, A., Shoib, G, Wakeley, T. and Webber, D. (2012). ‘Does pluralism in economics education
make better educated, happier students?, International Review of Economic Education.
Miller, (1999). ‘The norm of self-interest’, American Psychologist, 54: 1053–1060.
Ormerod, P. (2003). ‘Turning the Tide: Bringing economics Teaching into the Twenty-First Century’,
International Review of economics Education, 1 (1): 71-79.
Salemi, M. and Siegfried, J. (1999). ‘The State of Economic Education’, American Economic Review,
Papers and Proceedings, 89 (2): 355-61.
Siegfried, J. (2008). ‘Trends in Undergraduate Economics Degrees Through June 2007,’ Journal of
Economic Education 39 (3): 297-301.
Siegfried, J. and Round, D. (1994). ‘The Australian Undergraduate economics Degree: Results from a
Survey of Students’, Economic Record, 70 (209): 192-203.
Sutton, J. (2000). Marshall’s Tendencies: what can economists know?, Cambridge, MA: MIT Press.
Walker, I. and Zhu, Y., 2010, 'Differences by Degree: Evidence of the Net Financial Rates of Return to
Undergraduate Study for England and Wales', Lancaster University Working Paper
Webber, D. J. and Mearman, A. (2012) “Students’ perceptions of economics: identifying demand for
further study,” Applied economics 44(9): 1121-1132.
19
Table 1: Comparison of data sets
Parameter Survey Focus Group HESA /
Economics Network
Age
73% aged
“17-21”
Average age 27
80% of students start
course before 21
Gender
59% Male
52.2% Male
65.1% Male
Nationality
98.6% UK students
66.6% UK students
61.6% UK students
Type of course
86% economics related
95% economics related
N/A
Year of study
30%
in the first year
81%
in the third year
35%
in the first year
20
Table 2: UK descriptive statistics Variable N Mean St. Dev. Min Max
Male 291 0.588 0.493 0 1
Age 17-21 291 0.729 0.445 0 1
Age 22-26 291 0.196 0.398 0 1
Age 27-31 291 0.034 0.182 0 1
Age 32+ 291 0.041 0.199 0 1
UG 291 0.876 0.330 0 1
Year 1 291 0.296 0.457 0 1
Year 2 291 0.237 0.426 0 1
Year 3 291 0.344 0.476 0 1
Year 4 291 0.117 0.322 0 1
Year other 291 0.007 0.083 0 1
Work experience 291 0.632 0.483 0 1
Had PT job 291 0.790 0.408 0 1
Economics background 291 0.684 0.466 0 1
Private job 291 0.656 0.476 0 1
Public job 291 0.203 0.403 0 1
Self-employment 291 0.117 0.322 0 1
Easy 291 3.120 1.015 1 5
Theoretical 291 3.515 1.146 1 5
Future career 291 1.859 0.869 1 5
Better decisions 291 1.948 0.887 1 5
Frustrating 291 3.062 1.068 1 5
More Econ 291 2.636 1.165 1 5
Understanding 291 2.491 1.078 1 5
Confusing 291 3.351 1.080 1 5
Recent economics 277 2.282 0.978 1 5
Policy 291 0.110 0.313 0 1
Macro 291 0.065 0.247 0 1
Monetary 291 0.100 0.300 0 1
Real 291 0.034 0.182 0 1
History 291 0.038 0.191 0 1
Development 291 0.041 0.199 0 1
Kudos 291 0.430 0.812 0 4
Simple 291 0.612 1.012 0 4
21
Table 3: Perception correlations
Eas
y
Th
eore
tica
l
Fu
ture
Car
eer
Bet
ter
Dec
isio
ns
Fru
stra
tin
g
Un
der
stan
din
g
Beh
avio
ur
Co
nfu
sin
g
Easy 1.000 -0.184 0.187 0.198 -0.503 0.176 -0.567
Theoretical 1.000 -0.405 -0.377 0.396 -0.368 0.297
Future Career 1.000 0.567 -0.269 0.416 -0.303
Better Decisions 1.000 -0.244 0.406 -0.262
Frustrating 1.000 -0.272 0.630
Understanding Behaviour 1.000 -0.258
Confusing 1.000
Note: Bold implies statistically significant at the 1% level
22
Table 4: Perception correlations; pooled within-groups
Eas
y
Th
eore
tica
l
Fu
ture
Car
eer
Bet
ter
Dec
isio
ns
Fru
stra
tin
g
Un
der
stan
din
g
Beh
avio
ur
Co
nfu
sin
g
Easy 1.000 -0.105 0.085 0.122 -0.456 0.086 -0.526
Theoretical 1.000 -0.290 -0.289 0.303 -0.263 0.178
Future Career 1.000 0.489 -0.118 0.287 -0.146
Better Decisions 1.000 -0.130 0.314 -0.141
Frustrating 1.000 -0.144 0.564
Understanding Behaviour 1.000 -0.115
Confusing 1.000
Note: Bold implies statistically significant at the 1% level

23
Table 5: Ordered logistic regression results Coefficient (Standard error) Odds ratio
Work experience 0.765 (0.252)*** 2.164
Part time job 0.128 (0.280) 1.121
Economics background -0.160 (0.253) 0.852
Private job 0.902 (0.294)*** 2.399
Self-employment 0.150 (0.426) 1.131
Easy -0.054 (0.138) 0.952
Theoretical -0.181 (0.116) 0.833
Future career 0.695 (0.175)*** 1.979
Better decisions 0.014 (0.173) 1.028
Frustrating -0.295 (0.148)** 0.765
Understanding 0.437 (0.125)*** 1.546
Confusing -0.470 (0.152)*** 0.623
Cut1 -1.514
Cut2 0.380
Cut3 2.021
Cut4 4.212
Log likelihood -364.284
Pseudo R2 0.172
LR chi2 151.27***
N 291 Notes: These results take into account age, gender, and year of study (none of which are statistically significant).

24
Table 6: Rotated pattern matrix
1 2
Confusing -0.810
Frustrating -0.736
Easy 0.696
Future career 0.781
Better decisions 0.763
Understanding behaviour 0.551
Theoretical 0.151 -0.484 Notes: Extraction method: maximum likelihood. Rotation method: Oblimin with Kaiser Normalization.
Rotation converged in 6 iterations.
25
Table 7: Regression re-estimation with Kudos and Simple 1 2
Coefficient
(Standard
error) Odds ratio Coefficient
(Standard
error) Odds ratio
Work experience 0.701 (0.246)*** 2.016 0.803 (0.252)*** 2.231
Part time job 0.108 (0.275) 1.114 0.136 (0.280) 1.146
Economics background -0.152 (0.250) 0.859 -0.180 (0.254) 0.835
Private job 0.904 (0.289)*** 2.470 0.867 (0.294)*** 2.379
Self-employment 0.156 (0.422) 1.169 0.074 (0.428) 1.077
Easy – 0.776 (0.346)** 2.173
Theoretical – -0.182 (0.116) 0.834
Future career – 0.758 (0.177)*** 2.134
Better decisions – -0.004 (0.172) 0.996
Frustrating – -0.281 (0.146)* 0.755
Understanding – 0.443 (0.125)*** 1.558
Confusing – -0.508 (0.153)*** 0.602
Factor 1 (useful / valuable) 1.156 (0.135)*** 3.178 –
Factor 2 (challenge) -0.792 (0.123)*** 0.453 –
Kudos – 0.594 (0.279)** 1.811
Simple – -0.649 (0.245)*** 0.522
Cut1 -0.706 0.877
Cut2 1.142 2.814
Cut3 2.735 4.500
Cut4 4.863 6.681
Log likelihood -370.112 -361.189
Pseudo R2 0.159 0.179
LR chi2 139.62*** 151.46***
N 291 291 Notes: These results take into account age, gender, and year of study (none of which are statistically significant).
26
Figure 1: Variables negatively correlated with MoreEcon
Note: The number of observations for MoreEcon are 56, 84, 78, 56 and 17 when MoreEcon takes the
value 1, 2, 3, 4 and 5 respectively.
1
1.5
2
2.5
3
3.5
4
4.5
5
1 2 3 4 5
MoreEcon value
Theoretical
Frustrating
Confusing
27
Figure 2: Variables positively correlated with MoreEcon
Note: The number of observations for MoreEcon are 56, 84, 78, 56 and 17 when MoreEcon takes the
value 1, 2, 3, 4 and 5 respectively.
1
1.5
2
2.5
3
3.5
4
4.5
5
1 2 3 4 5
MoreEcon value
Easy
Future Career
Better decisions
Understanding behaviour
28
Figure 3: Dendrogram using average linkage (between Groups)
29
Figure 4: Rotated component matrix
30
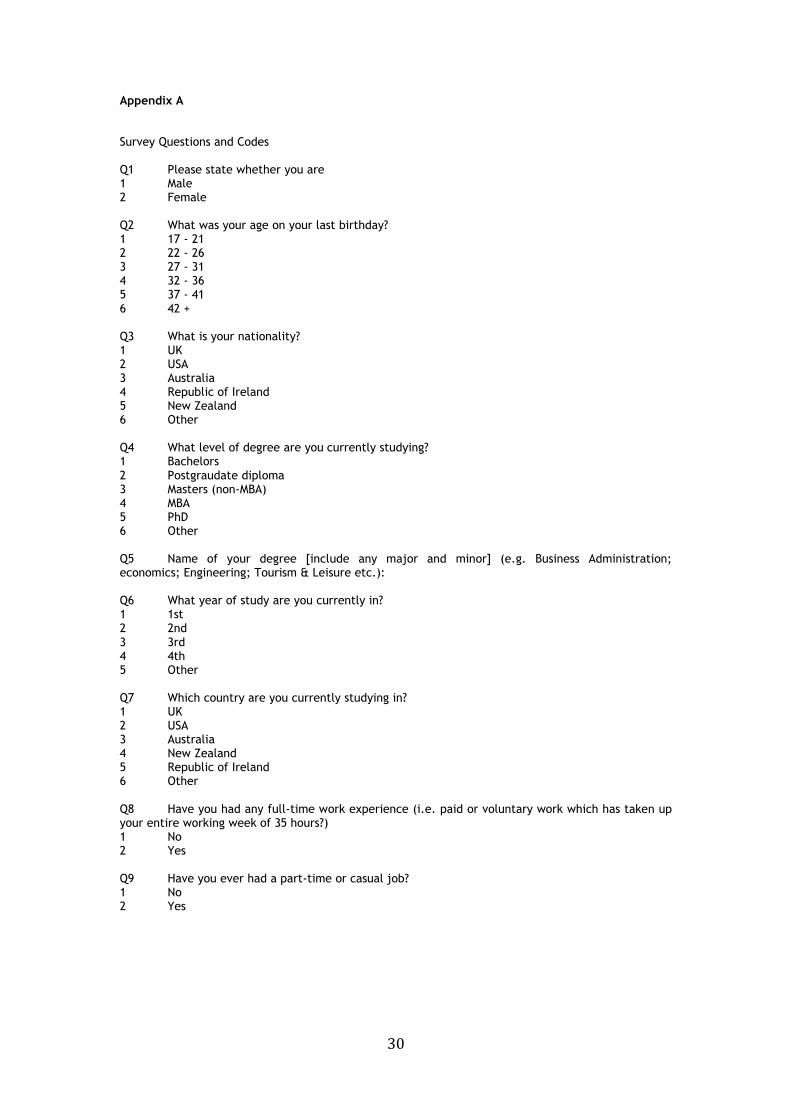
Appendix A
Survey Questions and Codes Q1 Please state whether you are 1 Male 2 Female Q2 What was your age on your last birthday? 1 17 - 21 2 22 - 26 3 27 - 31 4 32 - 36 5 37 - 41 6 42 + Q3 What is your nationality? 1 UK 2 USA 3 Australia 4 Republic of Ireland 5 New Zealand 6 Other Q4 What level of degree are you currently studying? 1 Bachelors 2 Postgraudate diploma 3 Masters (non-MBA) 4 MBA 5 PhD 6 Other Q5 Name of your degree [include any major and minor] (e.g. Business Administration; economics; Engineering; Tourism & Leisure etc.): Q6 What year of study are you currently in? 1 1st 2 2nd 3 3rd 4 4th 5 Other Q7 Which country are you currently studying in? 1 UK 2 USA 3 Australia 4 New Zealand 5 Republic of Ireland 6 Other Q8 Have you had any full-time work experience (i.e. paid or voluntary work which has taken up your entire working week of 35 hours?) 1 No 2 Yes Q9 Have you ever had a part-time or casual job? 1 No 2 Yes
31
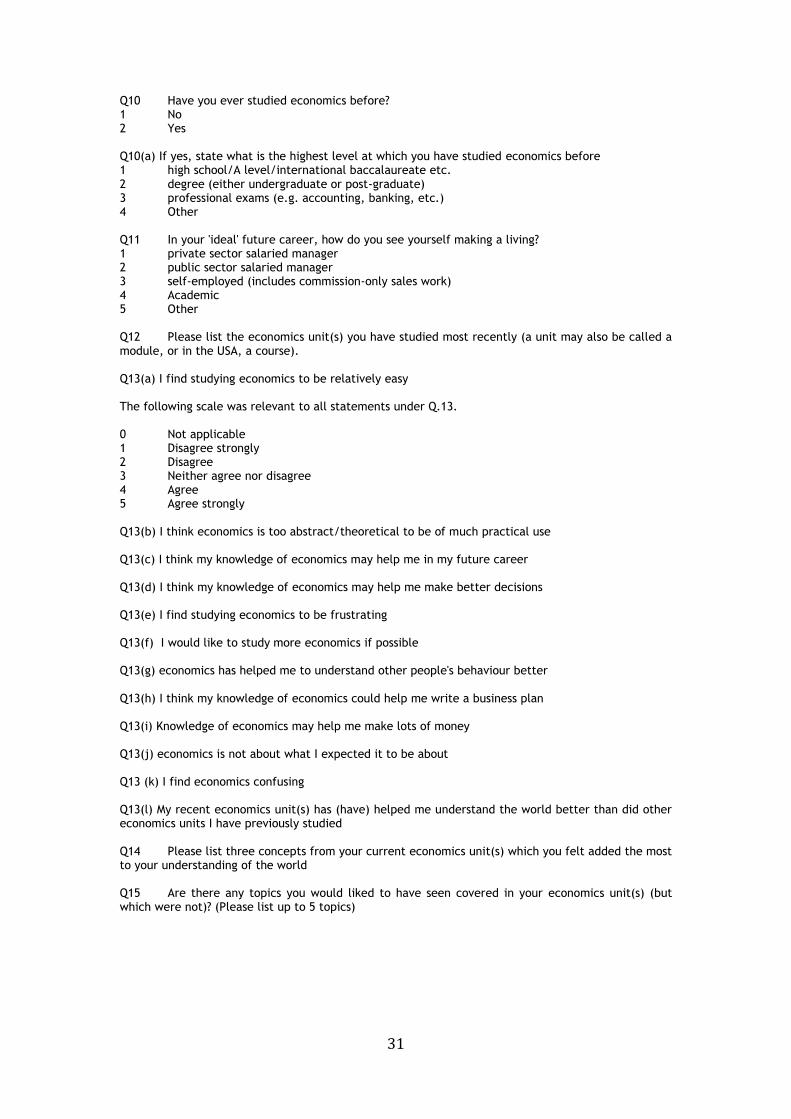
Q10 Have you ever studied economics before? 1 No 2 Yes Q10(a) If yes, state what is the highest level at which you have studied economics before 1 high school/A level/international baccalaureate etc. 2 degree (either undergraduate or post-graduate) 3 professional exams (e.g. accounting, banking, etc.) 4 Other Q11 In your 'ideal' future career, how do you see yourself making a living? 1 private sector salaried manager 2 public sector salaried manager 3 self-employed (includes commission-only sales work) 4 Academic 5 Other Q12 Please list the economics unit(s) you have studied most recently (a unit may also be called a module, or in the USA, a course). Q13(a) I find studying economics to be relatively easy The following scale was relevant to all statements under Q.13. 0 Not applicable 1 Disagree strongly 2 Disagree 3 Neither agree nor disagree 4 Agree 5 Agree strongly Q13(b) I think economics is too abstract/theoretical to be of much practical use Q13(c) I think my knowledge of economics may help me in my future career Q13(d) I think my knowledge of economics may help me make better decisions Q13(e) I find studying economics to be frustrating Q13(f) I would like to study more economics if possible Q13(g) economics has helped me to understand other people's behaviour better Q13(h) I think my knowledge of economics could help me write a business plan Q13(i) Knowledge of economics may help me make lots of money Q13(j) economics is not about what I expected it to be about Q13 (k) I find economics confusing Q13(l) My recent economics unit(s) has (have) helped me understand the world better than did other economics units I have previously studied Q14 Please list three concepts from your current economics unit(s) which you felt added the most to your understanding of the world Q15 Are there any topics you would liked to have seen covered in your economics unit(s) (but which were not)? (Please list up to 5 topics)
32
Recent UWE Economics Papers See http://www1.uwe.ac.uk/bl/bbs/bbsresearch/economics/economicspapers.aspx for a full list
2013
1303 Why do students study economics?
Andrew Mearman, Aspasia Papa and Don J. Webber
1302 Estimating regional input coefficients and multipliers: The use of the FLQ is
not a gamble
Anthony T. Flegg and Timo Tohmo
1301 Liquidity and credit risks in the UK’s financial crisis: How QE changed the
relationship
Woon Wong, Iris Biefang-Frisancho Mariscal, Wanru Yao and Peter Howells
2012
1221 The impact of the quality of the work environment on employees’ intention to quit
Ray Markey, Katherine Ravenswood and Don J. Webber
1220 The changing influence of culture on job satisfaction across Europe: 1981-2008
Gail Pacheco, De Wet van der Westhuizen and Don J. Webber
1219 Understanding student attendance in Business Schools: an exploratory study Andrew Mearman, Don J. Webber, Artjoms Ivļevs, Tanzila Rahman & Gail Pacheco
1218 What is a manufacturing job?
Felix Ritchie, Andrew D. Thomas and Richard Welpton
1217 Rethinking economics: Logical gaps – empirical to the real world
Stuart Birks
1216 Rethinking economics: Logical gaps – theory to empirical
Stuart Birks
1215 Rethinking economics: Economics as a toolkit
Stuart Birks
1214 Rethinking economics: Downs with traction
Stuart Birks
1213 Rethinking economics: theory as rhetoric
Stuart Birks
1212 An economics angle on the law
Stuart Birks
1211 Temporary versus permanent employment: Does health matter?
Gail Pacheco, Dominic Page and Don J. Webber
1210 Issues in the measurement of low pay: 2010
Suzanne Fry and Felix Ritchie
33
1209 Output-based disclosure control for regressions
Felix Ritchie
1208 Sample selection and bribing behaviour
Timothy Hinks and Artjoms Ivļevs
1207 Internet shopping and Internet banking in sequence
Athanasios G. Patsiotis, Tim Hughes and Don J. Webber
1206 Mental and physical health: Reconceptualising the relationship with
employment propensity
Gail Pacheco, Dom Page and Don J. Webber
1205 Using student evaluations to improve individual and department teaching
qualities Mary R. Hedges and Don J. Webber
1204 The effects of the 2004 Minority Education Reform on pupils’ performance in
Latvia Artjoms Ivļevs and Roswitha M. King
1203 Pluralist economics curricula: Do they work and how would we know?
Andrew Mearman
1202 Fractionalization and well-being: Evidence from a new South African data set
Timothy Hinks
1201 The role of structural change in European regional productivity growth
Eoin O’Leary and Don J. Webber
2011
1112 Trusting neighbours or strangers in a racially divided society: Insights from
survey data in South Africa Dorrit Posel and Tim Hinks
1111 A comment on Tobias Kronenberg’s “Construction of regional input-output
tables using nonsurvey methods: The role of cross-hauling”
Anthony T. Flegg and Timo Tohmo
1110 Measuring the policymaker’s credibility: The Bank of England in ‘nice’ and
‘not-so-nice’ times Iris Biefang-Frisancho Mariscal, Woon Wong and Peter Howells
1109 Paradigm shift? A critique of the IMF’s new approach to capital controls
Daniela Gabor
1108 Happiness, meaning of life and income
Lois Duff and Artjoms Ivlevs
1107 The effect of monetary policy on investors’ risk perception: Evidence from
the UK and Germany
Dan Luo, Iris Biefang-Frisancho Mariscal and Peter Howells