Why Do Scientists in Public Research Institutions ...
52
www.druid.dk DRUID Working Paper No. 10-27 Why Do Scientists in Public Research Institutions Cooperate with Private Firms? By David B. Audretsch, Werner Bönte and Stefan Krabel
Transcript of Why Do Scientists in Public Research Institutions ...

www.druid.dk
DRUID Working Paper No. 10-27
Why Do Scientists in Public Research Institutions Cooperate with Private Firms?
By
David B. Audretsch, Werner Bönte and Stefan Krabel

www.druid.dk
Why Do Scientists in Public Research Institutions Cooperate with
Private Firms?
David B. Audretsch Indiana University Bloomington, USA
Werner Bönte
University of Wuppertal Schumpeter School of Business and Economics Gaussstrasse 20, D-42119 Wuppertal, Germany
Tel: +49 202 439 2246 E-mail: [email protected]
Stefan Krabel
University of Kassel Germany
August 31, 2010
Abstract: As public research institutions are increasingly pressured to transfer research results to industry, evaluation of their performance is not only based on their scientific output but also on their commercialization success. Although it is well known that research cooperation activities are an important channel of knowledge transfer, the knowledge about factors driving research cooperation is limited. This paper explicitly focuses on scientist perspective and investigates the relevance of academic values and perceived costs and benefits of cooperation for a scientist's decision to cooperate with private firms. Our analysis is based on two survey waves performed with scientists in the Max Planck Society in Germany which is a publicly funded research organization focusing on basic research. Our empirical results suggest that open science identity is an important determinant of scientist fundamental decision to cooperate with private firms at all. The decision to keep on cooperating with private firms is directly influenced by cost sharing incentives and by firms' confidentiality requirements. Besides these direct effects, our results suggest that perceived reputational reward, monetary benefits, and time costs associated with cooperation influence cooperation behavior indirectly through their impact on the attractiveness of cooperation. The latter is a strong and robust predictor of cooperation behavior. Keywords: Jel codes:
ISBN 978- 87-7873-309-2

1 Introduction
In facing stiffening economic competition policymakers have called on universities and pub-
lic research institutions to transfer knowledge more effectively in order to make the best
societal use of academic research (Cohen et al., 2002, 1998; Buenstorf, 2009). For this rea-
son, university administrators, deans and scientists, thereby, face the task of transforming
universities and public research labs into more entrepreneurial organizations incorporating
knowledge transfer to the private sector as part of the mission science has to fulfill. The suc-
cess of knowledge transfer, however, depends on scientists’ willingness to commercialize their
research findings, as scientists can hardly be forced to do so. Therefore, leaders of research or-
ganizations, who want to improve the commercialization performance of their organizations,
should understand the individual benefits and drawbacks associated with commercialization
activities which determine the scientists’ decision to commercialize their research findings.
Due to the changing role of public research institutions and the task of advancing com-
mercial research, over the past few decades scholarly literature has increasingly focused on
scientists’ commercialization activities. However, this strand of literature focuses for the
most part on academic entrepreneurship (see e.g. Powers and McDougall, 2005; Bercovitz
and Feldman, 2008; Stuart and Ding, 2006) and academic patenting (see e.g. Azoulay et al.,
2007; Henderson et al., 1998; Thursby and Thursby, 2002). While providing interesting and
important insights, studies on academic entrepreneurship and university patenting do not
reveal a complete picture. The founding of a new firm based on university inventions is a
rare event and patent data has limited explanatory power as both firms and scientists ac-
knowledge that patents account for a relatively small proportion of knowledge transfer to the
private sector (Agrawal and Henderson, 2002; Cohen et al., 2002). In contrast, collaborative
research with private firms represents the most frequently used form of knowledge transfer
(Gulbrandsen and Smeby, 2005; Sellenthin, 2009). Furthermore, firms value transfer via di-
rect interaction with academic scientists as the most important source of knowledge (Cohen
et al., 2002). In view of this evidence it is surprising that cooperative research projects have
1

not been studied to the same extent as entrepreneurship or patenting. Cooperative research
projects allow the flow of tacit knowledge which is often described as being of crucial im-
portance in the successful commercialization of science (Zucker et al., 1998; Pavitt, 1998;
Fleming and Sorenson, 2004).
The present study aims to examine why scientists decide to cooperate with private firms
in order to improve our understanding of this relevant transfer channel. Even at face value
an individual scientist’s decision to perform cooperative research projects with private firms
is not straightforward. Scientists need to weigh up the benefits and the drawbacks of com-
mercializing scientific results. Therefore values relating to the scientific reward system are
likely to be a crucial factor in shaping scientists’ decision about whether or not to cooperate
with private firms at all. Apart from the question why scientists cooperate with private firms
at all, it is also important to assess why scientists with cooperation experience engage in
further cooperation. In the present study we propose that reputation, monetary incentives
and time constraints influence the subsequent cooperation behavior of those scientists with
cooperation experience.
In order to examine cooperation behavior empirically, we make use of a dataset obtained
through survey interviews conducted with scientists of the Max Planck Society (MPS) in
Germany. Scientists were interviewed by phone in two survey waves. An initial survey was
implemented with the aim of identifying the group of scientists with cooperation experience
and examining scientists’ appeal of research cooperation with private firms. In a follow-
up survey, those scientists with cooperation experience were interviewed again six to seven
months later. The data obtained in the initial survey allows us to examine how scientists’
attitude towards open science as well as the reputational reward associated with commer-
cial research relate to scientists’ cooperation experience. In order to assess the impact of
cooperation attractiveness on cooperation, we also focus on the attractiveness of research
cooperation as identified by individual scientists. Using the information from the follow-up
survey, we are able to analyze how private benefits such as the monetary gains and rep-
2

utational award associated with cooperative research with private firms and the perceived
drawbacks in terms of time costs influence scientists subsequent cooperation behavior. In
our empirical analysis the inclusion of attractiveness allows us to investigate both the direct
and indirect (mediated by cooperation attractiveness) effects of explanatory variables on
cooperation behavior.
Our results suggest that reputational rewards from commercialization and open science
identity are important factors in explaining why some scientists cooperate and others do not.
Both cooperation experience and subsequent cooperation behavior are highly influenced by
individual attractiveness of cooperation. Among scientists who already have cooperation
experience financial benefits, reputational reward and time demand associated with cooper-
ation activities influence individual attractiveness of cooperation but do not directly influence
individual decision on subsequent cooperation. Thus, time and monetary aspects have an
indirect influence on cooperation behavior mediated by cooperation attractiveness. The se-
crecy requirements of firms have a negative direct effect on the probability of engaging in
future cooperations.
The remainder of this paper is structured as follows. The theory and hypotheses are
derived in section 2. Section 3 describes the framework of our study, which is based on two
survey waves conducted with scientists within the Max Planck Society. In order to provide
the reader with necessary background information, the institutional setting of Max Planck
Society Institutes is introduced followed by a description of the research methodology. In
section 4, the variables of interest are introduced and descriptive statistics as well as sample
characteristics are presented. The empirical analysis and estimation results are presented in
section 5. Section 6 discusses the results and section 7 concludes.
3

2 Theoretical framework
The Entrepreneurial University: Criteria of Evaluating Work in
Science
The transition from research universities and public labs to entrepreneurial organizations has
gained increasing attention among strategic management and industrial economics scholars
over the past few decades. Research groups in universities are becoming “quasi-firms” who
potentially commercialize their research results (Etzkowitz, 2003). Existing studies high-
light that since the early 1980’s policymakers reacted to economic studies and government
reports which highlighted the importance of knowledge and scientific advances in industrial
innovation and, consequently, in economic growth. Thus, policy assigned research organi-
zations the role of economic actors and demanded scientists to fulfill multiple tasks. Apart
from performing research and education faculty is increasingly required to transfer scientific
results more effectively to the private sector (Cohen et al., 2002; Lee, 1996).
In order to support commercial research, technology transfer offices were installed in
many US and European universities with the aim of providing support for scientists in
filing patent applications, to assists scientists in start-up activities and to connect scientists
with private actors. Observing this (external) effort to enhance scientists’ commercialization
activities, scholarly concern on commercial research activities and work practices within
scientific institutions evolved. One of the key questions hereby is to what extent changing
evaluation criteria of scientific work lead scientists to alter their work practices toward higher
emphasis on bridging knowledge to the private sector.
According to organizational theory it is essential to examine the evaluation criteria of
scientific work in order to assess what incentives and determinants lead scientists to commer-
cialize their research findings. Theoretical works argue that the important features in the
transformation process of organizations are changing values and conflicting internal interests
leading to a reconsideration of work routines (see e.g. Greenwood and Hinings, 1996; Oliver,
4

1992). Existing organizational change models emphasize that the transformation of work
evaluation criteria occurs at the individual level but is significantly influenced by organi-
zational values, norms and cultures (Whelan-Berry et al., 2003; Kanter et al., 1992; Dacin
et al., 2002). Therefore, the adoption of new work criteria is especially difficult in institutions
with traditions and well-established norms (DiMaggio and Powell, 1983; Kraatz and Moore,
2002). In the spirit of Merton (1957) the institution of science has such traditional academic
norms. For this reason the intended transformation of scientific institutions into key actors
in modern economies represents a challenge to leaders and deans of research institutions as
well as policymakers in providing a research climate which stimulates scientists to transfer
their knowledge to the private sector.
An ongoing discussion in the literature deals with the interrelation of changing aca-
demic values and scientists’ efforts to transfer research results to private partners. Critics
of the concept of the entrepreneurial university fear that engagement with industry shifts
researchers’ agendas toward applied, industry-relevant topics at the expense of academic
freedom, the traditional norm of open science and the focus on basic research (Florida and
Cohen, 1999). Yet, collaborative research projects between academic scientists and industry
employees often yield new academic insights and ideas despite the applied nature of research
aims (D’Este and Perkmann, 2010). As a result, scientists may well face both benefits and
drawbacks when having to decide whether it is beneficial for them to engage in collaborative
work with private firms.
To cooperate or not to cooperate – a fundamental decision
Scientists’ cooperation behavior with private firms is comprised of two different important
stages of analysis. The first stage of analysis deals with scientists’ fundamental decision
as to whether or not to cooperate with firms at all. Academic researchers who have not
collaborated with private partners cannot rely on past experience when having to decide
whether or not to cooperate with private firms. It is difficult for these scientists to assess to
5
what extent private benefits arise from cooperation with private firms. We, therefore, argue
that the fundamental decision to cooperate with private firms relates to scientists’ views on
the academic values of open science and reputational reward.
The value of open science
Within the discussion of values in academic science there is the view that scientific knowledge
is a public good as knowledge does not deplete when shared with others (Arrow, 1962;
Scherer, 1982). Distinguishing scientific research from technological research, Dasgupta and
David (1987) claim that scientists are thought to devote their efforts to the accumulation of
freely available knowledge. This view of open science with free dissemination of knowledge
is often shared by researchers for two reasons. Firstly, the seminal work on the sociology
of science by Merton (1957) describes the norm of communism. According to the norm of
communism scientists are incentivized to give up intellectual property rights in exchange for
recognition and esteem (Merton, 1973, p.273). This incentive leads to communist activity
in the sense that scientists share their work with the community for the common good.
Essentially, Merton’s complex set for the ethos of science included that progress in science
comes by means of cooperation and collaboration between individual scientists. Scientists
identify science as open and freely distribute their knowledge and findings to the entire
scientific community.
Moreover, researchers are incentivized to publish the outcome of their research results as
priority in discovery is the key to scientific recognition (Stephan, 1996; Stephan and Levin,
1992). When researchers communicate an advance in knowledge, they are rewarded by the
scientific community for being first. Scientists striving for recognition will, therefore, publish
new findings as soon as possible after their discovery. In the publication business, the time
of submission or publication makes the claim of priority more convincing (Stephan and
Levin, 1992). Thus, academic science developed institutions for rewarding the production
and dissemination of knowledge where scientists receive recognition for being the first to
6

demonstrate discovery to the scientific community (David, 2003; Hong and Walsh, 2009).
Yet, esteem from colleagues is not limited to its own rewards. Over the course of a scientific
career, recognition from colleagues potentially translates into pecuniary rewards in terms of
well-paid research positions, well-funded research projects or laboratories (Stephan, 1996).
When cooperating with private firms, knowledge is often appropriated by firms. In R&D
cooperation, novel results are concealed and meant to secure firms a competitive advantage.
In this case, it is evident that academic scientists’ incentives are in conflict to the goals of
industrial firms. Hall (2002) argues that scientific research and commercial innovation can
be seen as two worlds with respect to the twin goals of appropriating or diffusing knowledge.
Similarly, Hong and Walsh (2009) argue that appropriation of knowledge can become an
important obstacle to science-industry cooperations. While firms intend to appropriate new
knowledge, scientists are incentivized to make their research results freely available to anyone.
From this line of reasoning, we predict that the identity of open science represents a key
obstacle for scientists in engaging in cooperation with private firms.
HYPOTHESIS 1: If scientists believe in the concept of open science and the free avail-
ability of research results, they are less likely to cooperate with private firms at all.
Reputational Rewards
While the open and free distribution of scientific results in the spirit of Merton (Merton,
1957, 1973) has dominated academia over decades, there is an ongoing debate that has
increasingly diminished this view since the late 1980’s. Currently, there is widespread belief
among academics that the institution of science is facing ever more demand to become further
intertwined with commercial activity (Owen-Smith and Powell, 2004; Hong and Walsh, 2009).
Science is increasingly demanded to provide innovative results with commercial potential
in the private sector. Starting in the early 1990s, a stream of literature evolved addressing
the changing culture of science and the emergence of a second competing point of view. This
view suggests that science is under increasing pressure to provide research results relevant to
7

industry (Cohen et al., 1998; Hong and Walsh, 2009). With the increasing relevance of scien-
tific excellence in global economic competition and the diminishing proportion of university
research being publicly supported, science must in part fulfil the tasks of commercial research
towards advancements in technology. Therefore, Hackett (1990) and Owen-Smith and Powell
(2003) argue that scientific success is increasingly measured in commercial success.
The commercialization of research results may lead to greater scientific reputation among
researchers. Owen-Smith and Powell (2003) argue, that commercialization success and the
attention of corporate partners make scientists visible in their research field. These scientists
are often able to attract attention and funding, which, in turn, leads to greater reputation.
Such feedback loops seem plausible, as researcher quality and commercial success are comple-
ments (Thursby et al., 2001). The latter study and Buenstorf (2009) find that higher quality
faculty results in higher license income and more sponsored research. In the case of venture
creation, scientist research productivity and entrepreneurial activity are complements (Lowe
and Gonzalez-Brambila, 2007). Moreover, firm collaboration choices are influenced by sci-
entists’ expertise. This pattern is shown by Audretsch and Stephan (1996) who detect that
firms cluster around star scientists in the biotechnology industry. Firms seemingly profit
from the expertise of reputable scientists, as Zucker et al. (2002) show that the higher a
scientist’s research quality, the more important the scientist is for firms’ commercial success.
Breakthrough discoveries often involve the joint work of firms with top scientists. Thus, the
increasing commercialization of science in general may shift scientists’ evaluation of com-
mercialization activities. As scientists may perceive there to be an increase in academic
reputation in successfully commercializing research, we hypothesize:
HYPOTHESIS 2a: If scientists’ perceive the commercialization of research as leading to
high reputational reward, they are more likely to cooperate with private firms at all.
8

Scientists’ motivation to engage in further cooperation
In light of the relevance of science-industry cooperation as an important knowledge transfer
channel, scientists’ cooperation behavior should not be restricted to the fundamental deci-
sion whether or not to cooperate with firms at all. Apart from determinants disentangling
cooperators from non-cooperators it is also crucial to understand why scientists with coop-
eration experience decide to engage in further cooperation with private firms. While the
fundamental decision to cooperate with private firms tends be driven by scientists’ attitudes
towards commercialization in general, the decision of scientists with cooperation experience
to engage in subsequent cooperation is likely to be driven by scientists’ perception of the
benefits and drawbacks of cooperating with industry.
Private benefits: Recognition and monetary gains
One of the potential private benefits of cooperation relates to the aforementioned argumen-
tation on the fundamental decision to cooperate. Scientists may expect reputational reward
from cooperating with private firms. Firms choose, in general, to collaborate with ’star’ sci-
entists as they wish to come close to the scientific frontier. Thus, as noted above, scientists
may signify research quality when cooperating with private firms. We, consequently, argue
that reputational reward may not only drive scientists’ fundamental decision to cooperate
with private firms or not, but also cooperators’ decision to engage in further collaboration.
HYPOTHESIS 2b: If scientists with cooperation experience perceive there to be high rep-
utational rewards from cooperation of research, they are more likely to engage in subsequent
cooperation with private firms.
Monetary returns may represent a further important driver for scientists to cooperate with
private firms. By surveying science and engineering faculty in the US Lee (2000) finds that
a key motivation of scientists to collaborate with private partners is the access to resources
which secure the funding of research. We argue that – beyond the want to secure research
funding – scientists with cooperation experience may be attracted by financial benefits. If
9

scientists with cooperation experience regard collaboration with private firms as financially
lucrative, such cooperation represents a second source of income.
Furthermore, several studies find that scientists have a preference for research (Stern,
2004) and that the most interesting research is often complete before private companies
begin showing interest in commercial applications (Aghion et al., 2005; Jensen and Thursby,
2001). These findings suggest that scientists may only work with industrial partners if
high monetary incentives compensate scientists for less interesting work. Prior evidence of
commercializing research via disclosure indicates that scientists’ will not commercialize their
findings unless adequate royalty payments are paid to incentivize scientists to commercialize
their research (Jensen et al., 2003; Thursby et al., 2001). We expect this finding to hold in
the context of research cooperation, such that high financial benefits influence subsequent
cooperation behavior in the subgroup of scientists with cooperation experience. cooperation
experience
HYPOTHESIS 3: If scientists with cooperation experience perceive there to be high fi-
nancial benefits in cooperation, they are more likely to engage in subsequent cooperation with
private firms.
Time costs
The allocation of time for commercializing research may represent an important drawback
of scientists’ engagement in commercialization activities. Stern (2004) argues that scientists
have a preference for doing research rather than working on possible industrial applications.
Therefore, it seems reasonable that scientists would prefer to allocate as much time as pos-
sible to academic research. Several empirical studies analyze whether commercialization
activities crowd out basic research. Most existing studies analyzing the relationship of re-
search output and commercialization efforts detect a complementary relationship. Empirical
evidence, which is mostly based on U.S. data, suggests that the patenting and disclosure
of inventions have a positive impact on publication output (Agrawal and Henderson, 2002;
10

Azoulay et al., 2006). This result is also confirmed by empirical studies based on European
data (Breschi, 2007). Hence, patents and licenses may be complementary to fundamental
research as conflicts between research and commercialization time are not prevalent. More-
over, time demanding tasks associated with patenting are often carried out by technology
transfer offices.
When considering research cooperation activities, the allocation of time for commer-
cialization is likely to be a more relevant obstacle compared to patenting and licensing.
Cooperative research with private firms often requires scientists to allocate time to meetings
with industry researchers in order to coordinate research. Thus, time demands in research
cooperation are relatively high compared to other transfer channels. If scientists cooperate
with private firms and experience high demands on their time, then further cooperation with
private partners is unattractive and the scientist will refrain from joint work with industry.
In view of that the following is hypothesized:
HYPOTHESIS 4: If scientists with cooperation experience perceive there to be high time
costs in cooperating with private firms research, they are less likely to engage in subsequent
cooperation with private firms.
3 Research Method
Framework of our study: The Max Planck Society
In order to analyze scientists’ cooperation behavior, a survey of scientists within the MPS was
conducted. The MPS is an independent, publicly funded research organization in Germany.
Scientists from this society were chosen as the unit of analysis as MPS Institutes seek research
excellence and promote academic freedom without obligation to attract external funding.
Since research in the MPS is mostly basic and given the society’s demand for excellent
research, scientists work at the frontiers of research without regard for commercial potential.
Thereby, MPS research can be described as pursuing ground-breaking new results, but not
11

necessarily with the goal of application. Thus, scientists’ incentives to commercialize research
are hardly affected by external pressure.
As of January, 2010, the MPS employed more than 9,000 scientists working at 78 in-
stitutes. Each institute focuses on a special, specific, statutory task, be it to research the
structure of matter, the function of our nervous system, or the birth and development of
stars and galaxies. The Max Planck Institutes are classified by the Society in three different
sections: the Biology and Medicine Section, the Chemistry, Physics and Technology Section
and the Humanities Section.
Although the MPS consists of many different institutes, the institutional setting is con-
sistent throughout. All institutes select and carry out their research autonomously and
independently within the aforementioned scope of the MPS. Each institute administers its
own budget and is free to set their research agenda. The consistent structure of MPS insti-
tutes allows us to analyze the cooperation behavior of scientists under a similar institutional
setting although scientists work in differing fields of research.
Max Planck Scientist Surveys
Initial Survey: Commercialization Activities and Attitudes towards Commer-
cialization
In order to analyze scientists’ commercialization activities and attitudes towards commer-
cialization, a survey capturing possible stimuli and barriers to the commercialization of
scientific results was developed. The questionnaire contains questions with regard to sci-
entists’ knowledge transfer via engagement in research cooperation, patenting and nascent
entrepreneurship. Furthermore, scientists’ attitudes towards commercialization activities
as well as questions on industrial work experience, education, demographics, and time in
research were included. Survey questions were developed with the aim of quantitatively
analyzing the commercialization activities of scientists on the individual level. Questions
were improved during a pilot study conducted in August and September 2007. The pilot
12

study was performed with randomly selected scientists at German research organizations,
excluding MPS scientists. With respect to cooperation behavior the initial survey allows us
to identify scientists who have any cooperation experience. Moreover, scientists assessed the
attractiveness of cooperation activities with private firms.
Before interviewing scientists of the Max Planck Society, we contacted the executive
directors and heads of administration of all MPS institutes and asked for permission to
survey the scientists in their institute. Out of the entire Society, 67 institutes allowed us
to perform our survey and provided us with the contact phone numbers of their scientists,
if these were not publicly available. Our sample population for the survey consisted of
7,808 scientists working for these 67 MPS institutes. Prior to the survey interviews, we
emailed scientists and informed them about our study. Interviews were conducted by phone
and implemented by TNS Emnid GmbH, a professional opinion research institute. Trained
interviewers from TNS Emnid GmbH contacted scientists between mid-October and mid-
December 2007. The dataset includes data from 2,604 interviews, a response rate of 33.35
percent.
Follow-Up Survey: Cooperation Behavior and Attitudes towards Cooperation
In June to July, 2008, we performed an additional survey wave with those scientists, who had
reported cooperation experience in the initial survey. This survey was designed to get more
explicit information on scientists’ cooperation behavior as we asked whether or not they had
cooperated with private firms before their time at Max Planck, during their time in Max
Planck, during the last 6 months, and if they had concrete plans to cooperate with private
firms in the next two years. As this survey was performed six to eight months after the first
interview, we are able to analyze whether scientists cooperation attractiveness – reported in
the initial survey – influences scientists’ subsequent cooperation behavior and their intent to
cooperate with firms in the near future. Furthermore, we asked the cooperators explicitly
about the benefits and drawbacks associated with cooperation.
13

The second step of the survey analysis was also conducted by professional interviewers of
TNS Emnid GmbH. In the initial survey we asked scientists if they were willing to participate
in a second survey. This wish was respected, so that only those scientists who agreed to
further participation were contacted again. Out of the 813 cooperating scientists identified
in the initial survey wave, 624 researchers agreed to be available for a follow-up interview.
Therefrom, we were able to conduct follow-up interviews with 476 researchers, denoting a
response rate of 76.28 per cent.
Sample Selection: Senior Scientists
Our empirical analysis focuses on senior scientists. We exclude PhD students from our
investigation because our analysis on cooperation behavior in relation to the scientific reward
system may be heavily biased when including doctorates. Though they were given the same
survey as senior researchers, results may be biased when including doctoral students. These
researchers usually do not decide whether or not they engage in collaboration with private
firms but rather follow the decision of their supervisor. Moreover, a large share of doctoral
students in Germany make career track changes to the private sector after receiving their
doctorate Schomburg and Teichler (2006).
Excluding doctoral students reduces the sample of analysis. Furthermore, we excluded
all scientists who did not answer any question relating to a variable of interest, such that
the descriptive information capture the information of the reduced sample which is used in
the econometric analysis. Due to this exclusion our sample of analysis captures 1176 senior
scientists interviewed in the initial survey wave. Within the follow-up survey we capture 240
senior scientists which completed the interview and, thus, are used in the empirical analysis.
14

4 Measurement of Variables
Initial Survey
Dependent variables
In order to identify scientists with cooperation experience the surveyed scientists were
asked the following question: “Have you ever cooperated or are you currently cooperating
on research with or for firms in the private sector?” In our empirical analysis cooperation
experience is a dichotomous dependent variable which takes on the value one if a scientist
reports that he or she has cooperation experience and zero otherwise. Scientists’ cooperation
attractiveness is measured by the answer to the following question: “To what degree is
cooperative research with private firms an attractive idea to you?”. This dependent variable
is an ordinal variable which takes on values between 1 (not attractive at all) and 5 (highly
attractive).
Explanatory variables
In order to examine the determinants of scientists’ fundamental decision whether or
not to cooperate with firms we included in the questionnaire several statements associated
with commercialization activities in general. These statements refer to reputational reward
from commercialization, open science identity, and commercialization of research within a
scientist’s research group as well as within his or her scientific community. In this way,
scientists were asked to what degree they agree or disagree with these statements, given a
5-point Likert-type scale ranging from 1 (strongly disagree) to 5 (strongly agree). In the
empirical analysis these statements are used in two ways. Firstly we use ordinal variables
reflecting the Likert-type scale ranging from 1 to 5. Secondly, we used the change from value
3 (neutral) to 4 (agree) as the cut-off-level and induced binary variables taking a value of 1 if
scientists either agreed or strongly agreed to the statements given. Statements are presented
in Table 1.
***************************
15

insert Table 1 about here
***************************
Further explanatory variables reflect scientists’ socio-demographic characteristics. Differ-
ent binary variables account for scientists work experience in industry, gender and German
citizenship. Additionally we account for scientists’ age, the length of their time at Max
Planck and scientists’ research field and their research position. To provid a control for
research field we use several binary variables indicating whether scientists are group leaders,
directors or postdoctoral researchers. Similarly, binary variables indicate whether or not
scientists belong to the Life Science Section of the MPS, the Natural Science Section or
Humanities.
Follow-Up Survey
Dependent Variables
In the follow-up survey we asked scientists with cooperation experience whether they
had cooperated with private firms during the last six months and whether they had concrete
plans to cooperate with private firms within the next two years. The dependent variable
subsequent cooperation takes on the value one if a scientist reports that she or he has
cooperated with private firms during the last six months and zero otherwise. The dependent
variable planned cooperation takes on the value one if a scientist reports that she or he
has concrete plans for cooperation in the next two years and zero otherwise. In addition,
scientists were asked whether they cooperated with private firms during their time at Max
Planck – not counting the last six months. As a result, we are able to distinct scientists’
cooperation before their employment at Max Planck and during their time at Max Planck.
Explanatory Variables
Our explanatory variables reflect whether scientists perceive there to be benefits and
drawbacks related to cooperation. We explicitly provided statements to interviewees re-
flecting to what degree they perceived academic reputation, income opportunity and time
16

constraints as benefits or drawbacks of cooperation. Furthermore, we included statements
capturing to what extent scientists regarded cost sharing, confindentialyity problems of re-
search outcome and different research approaches as being associated with cooperating with
private firms. Again, scientists were asked to agree or disagree to these statements given a
5-point Likert-type scale (see Table 2). Statements are designed such that our investigation
may complement the initial survey analysis.
***************************
insert Table 2 about here
***************************
Descriptive Statistics
Descriptive statistics for senior scientists’ cooperation behavior are given in Table 3. The
upper half of the table reports on the proportion of scientists with cooperation experience
identified in the initial screening survey. Both, the cooperation shares as well as the attrac-
tiveness levels are given for the entire sample and separately reported for each MPS section.
The lower half of Table 3 refers to the 240 interviewed cooperators in the follow-up survey.
The table summarizes the percentage of scientists who had cooperation experience before
their MPS employment, during their engagement at MPS - not counting the last six months
- and during the last half year. Again, the shares are given separately for the entire follow-up
sample and separately reported for each MPS section.
********************
insert Table 3 about here
********************
Summary statistics for all variables are provided in Table 4. Information is again reported
separately for the 1176 interviewed scientists in the initial screening survey and the 240
cooperators examined in the follow-up survey. Forty percent of the 1176 scientists looked at in
the initial sample have cooperation experience with private firms. Comparing the individual
17

perceptions of scientists in the initial survey, it can be seen that scientists attach much
importance to the value of open science reflected by the statement on free accessibility of
research results. Regarding the follow-up survey it can be observed that reputational reward
and the opportunity to share research costs are considered as relatively more important
cooperation benefits than income opportunity.
********************
insert Table 4 about here
********************
5 Econometric Specification
Cooperation Behavior
In a first step we analyze how scientists’ views on scientific rewards as well as commercial-
ization attitudes and their research field are related to the individual decision to cooperate
or not to cooperate. To do so, we use the data of the initial survey in which scientists were
asked whether they had cooperated with firms or not, irrespective of the time of cooperation.
The dependent variable of the empirical analysis is a dummy variable that takes the value
one if a scientist has cooperation experience and zero otherwise. This analysis is provided
in Model 1a which is estimated by using a logit regression model (see Appendix A1). As
our baseline model we estimate scientists’ likelihood of having cooperation experience as
dependent on attractiveness of cooperation and further control variables (relevance of com-
mercialization in one’s research field, PhD discipline and personal characteristics). We then
include the measures of scientists’ attitudes towards the free availability of scientific results
and reputational rewards as further variables.
As explained in Section 2 it can be expected that the decision to engage in further
cooperation is determined by other factors than just the decision to cooperate at all. In order
to analyze scientists’ subsequent cooperation behavior we examine scientists cooperation
18

activities subsequent to the first interview. To do this we rely on the information provided
in the follow-up survey as cooperators identified in the initial survey were asked whether
they had cooperated with firms in the past six months subsequent cooperation.
However, we cannot exclude the possibility that results may be affected by endogeneity
problems. As causation is a central issue in strategy research recent studies by (Durand and
Vaara, 2009) and (Hamilton and Nickerson, 2003) point out statistical analysis can suffer
from biased coefficient estimates when potential endogeneity problems are not taken into
account. With respect to our empirical analysis of the fundamental decision to cooperate
or not (Model Ia) concerns may be raised about reverse causality, as it could be that co-
operation experience may affect the perceived attractiveness of cooperation or vice versa.
Further cooperation and attractiveness of cooperation may both be influenced by an unob-
served (omitted) variable causing endogeneity. Such endogeneity problems would not arise
if the attractiveness of cooperation were more or less constant over time, e.g. attractiveness
was already high before a scientist decided to cooperate. As time invariance of perceived
cooperation attractiveness is a strong assumption, we acknowledge that the possibility of
endogeneity cannot be completely ruled out in Model 1a. Thereby, we can only refer to cor-
relations rather than causation. For the empirical analysis of subsequent cooperation (Model
1b), however, potential endogeneity should be a lesser problem for two reasons: Firstly, all
scientists of the subsample of cooperators have cooperation experience, so that no bias can
result from not having cooperation experience. Secondly, the attractiveness measure is taken
from the screening survey which was conducted six to eight months before the follow-up sur-
vey wave was implemented – and the indicator for subsequent cooperation activities does
not cover the time of the initial survey.
Moreover, endogeneity may hardly arise when analyzing to what extent explanatory vari-
ables predict planned cooperation behavior in the next two years. Thus, in order to provide
a comprehensive and reliable analysis on scientists’ cooperation behavior we test whether
the personal benefits and drawbacks associated with science-industry cooperation affected
19

scientists’ intention to engage in cooperation with private firms in the near future. To do this
we rely on the data obtained in the follow-up survey since questions on cooperation benefits
were provided only to scientists’ with cooperation experience (in the follow-up survey wave).
In Model 1c we estimate to what extent private benefits, research field and demographics
influence scientists’ planned cooperation behavior.
Attractiveness of Cooperation
In order to provide a full picture of scientists’ cooperation behavior, we analyze what fac-
tors shape scientists’ appeal (expressed attractiveness) to cooperation in a second step. We
thereby analyze the relationship between the perceived attractiveness of cooperation and
open science identity, reputational rewards, financial benefits, and time demand of com-
mercialization activities in general and cooperation in particular. This second step is done
to investigate whether the relationship between cooperation behavior and these factors is
mediated by the attractiveness of cooperation. It is possible, for instance, that there is no
direct relationship between these variables and cooperation behavior but that they influence
the attractiveness of cooperation which in turn is related to cooperation behavior. Since
our dataset contains measures of cooperation as well as an indicator for the attractiveness
of cooperation we are able to analyze this indirect link. Again, we analyze attractiveness
indicators in both the initial and the follow-up survey results. The analysis of Model 2a is
based on data obtained in the initial survey. We investigate to what extent the perception
of open science and reputational benefits associated with commercialization in general relate
to the attractiveness of cooperation. Using the data obtained in the follow-up survey, we
are able to estimate how the private benefits and drawbacks associated with research co-
operation activities with private firms relate to the perceived attractiveness of cooperation
(Model 2b). Since the dependent variable is an ordinal variable, we make use of an ordered
logit model (see Appendix A1).
20

6 Estimation Results
Cooperation Behavior
Cooperation Experience
In Table 5 the results of Model 1a – the analysis on determinants of scientists’ cooperation
experience – are presented. Both, coefficients and marginal effects for the baseline and the
extended model are presented. In columns (5) and (6) all ordinal explanatory variables are
included as binary variables which take a value 1 if the ordinal variable takes a value of
4 or 5. These results suggest that cooperation experience is significantly positively related
to cooperation attractiveness. Furthermore, our measure of open science is significantly
negatively related to cooperation experience which can be observed in the estimation results
presented in columns (3) to (6). This evidence is in support of our hypothesis H1. The more
scientists agree that their research results should be freely available, the less likely it is that
these scientists have cooperation experience. With respect to reputational reward we do not
find any evidence in Model 1a that reputation is directly related to scientists cooperation
experience (as predicted in hypothesis H2a).
********************
insert Table 5 about here
********************
Moreover, apart from cooperation attractiveness and open science identity we find that
scientists’ perceived commercial potential of their research relates to their cooperation expe-
rience. The coefficients and marginal effects of the two measures reflecting the basic research
focusing of a scientist’s research group and the extent of commercialization in a scientist’s
research community are significant and respectively negatively and positively related to co-
operation experience. Further, German scientists, group leaders and scientists with work
experience in industry are more likely to have cooperation experience.
Subsequent cooperation
21

We turn now to the results of Model 1b – the estimation of a logit model based on
the data of the follow-up survey where the dependent variable is subsequent cooperation
denoting cooperation activity in the past six months. The results are presented in Table 6
which reports the coefficients and marginal effects for the baseline and the extended model.
In columns (5) and (6) we again include all ordinal explanatory variables as binary variables
which take on the value 1 if the ordinal variable takes a value of 4 or 5 in order to check the
robustness of our results.
********************************
insert Table 6 about here
********************************
As can be seen from the Table 6 the estimated coefficient and the estimate of the aver-
age marginal effect of attractiveness of cooperation are statistically significant and positive.
However, this effect does not remain significant when restricting the analysis to the binary
variables (see columns (5) and (6)). With respect to the reputational benefits associated with
cooperation we do not find evidence in support of H2b, which predicted a direct link between
perceived reputational reward and cooperation behavior. Regarding financial benefits from
cooperation our results point to a negative effect of income opportunities associated with
cooperation. This effect is, however, only statistically significant if ordinal measure is used
(Columns 3 and 4) but not if we include the respective dummy variable (Columns 5 and 6).
Hence, hypothesis H3 is not supported by our results.
Furthermore, we find weak evidence in support of our hypothesis H4, as time costs
are negatively related to probability of being engaged in subsequent cooperation activities.
The effect is significant at the 10 percent level in models presented in columns (3),(4) and
(6). Moreover, those scientists who agree that cooperaton helps to increase their research
budget are more likely to engage in subsequent cooperation activities whereas scientists who
believe that their results are not applicable for industrial purposes are less likely to cooperate.
Estimated coefficients and marginal effects are significant at the 1 percent level (see Columns
22

(3)-(6)). In addition, directors are more likely to engage in subsequent cooperation activities.
Planned Cooperation
In order to test to what extent the private benefits associated with cooperation effect
scientists’ cooperation behavior we additionally examine scientists’ plans to cooperate in
the next two years. Similar to the previous models we provide estimates using coopera-
tion attractiveness, the perceived relevance of commercialization in scientists’ research field,
PhD discipline and demographic measures as explanatory variables (columns (1) and (2)).
Measures regarding benefits and drawbacks associated with cooperation are included in es-
timations reported in columns (3) to (6).
Results are shown in Table 7. The estimation results suggest that attractiveness of coop-
eration predicts planned cooperation behavior. The estimated coefficient of attractiveness of
cooperation as well as the average marginal effect are statistically significant throughout all
regressions. Scientists reporting in the initial survey that they find cooperation attractive or
highly attractive have a 12.9 percentage points higher probability of having concrete plans for
cooperation activities with private firms within the next two years than other scientists (see
Column 6). In contrast, expected reputational rewards, financial benefits or time demand of
cooperation activities with private firms are not significantly related to planned cooperation
activities. Hence, the results do not point to a direct link between planned cooperation and
perceived personal benefits and drawbacks of cooperation. The probability of having con-
crete plans for cooperation activities is, however, negatively affected by perceived problems
due to confidentiality requirements by firms and by perceived non-applicability of scientists’
own research for industrial purposes. Scientists who are of the opinion that confidentiality
is a problem have a 20.7 percentage points lower probability of having concrete plans for
cooperation activities (see Column 6).
********************************
insert Table 7 about here
********************************
23

To sum up, our results suggest that academic values are directly related to cooperation
experience whereas there is only very weak evidence for a direct link between cooperation
behavior and the individual benefits and drawbacks of cooperation. The perceived attrac-
tiveness of cooperation, however, is directly linked to cooperation experience, subsequent
cooperation activities, and planned cooperation activities. The marginal effects of attrac-
tiveness of cooperation on the probability of cooperation are presented graphically in Figure
1. As pointed out by (Wiersema and Bowen, 2009) the assessment of marginal effects and
their respective z-statistic values is best done graphically and we therefore plot these values
against the predicted value of the outcomes, i.e. cooperation experience, subsequent coop-
eration, and planned cooperation. Marginal effects and z-statistics are computed for each
observation using the results of logit estimations presented in Column (1) of Tables 5, 6 and
7. As can be seen from Figure 1 the marginal effects of the attractiveness of cooperation
are positive for all observations (1176 for cooperation experience and 240 for subsequent
and planned cooperation). Moreover, the estimates are statistically significant for all ob-
servations in the case of cooperation experience. For subsequent and planned cooperation
activities z-statistic is below 1.96 in absolute value at high or low probabilities of subsequent
and planned cooperation activities. Hence, the relationship between cooperation behavior
and attractiveness of cooperation is positive and statistically significant. This suggests that
individual motivation of scientists is important for establishing and maintaining cooperation
activities with private firms.
********************************
insert Figure 1 about here
********************************
Attractiveness of Cooperation
Initial Survey
Although we do not find much evidence for a direct link between cooperation behavior
24

and reputational awards, financial benefits, and time costs associated with cooperation ac-
tivities, there might be an indirect link mediated by the attractiveness of cooperation. We
therefore turn now to the second step of the empirical analysis of Model 2a where the depen-
dent variable is the attractiveness of cooperation and explanatory variables are scientists’
attitudes towards commercialization in general. By using data gathered in the initial sur-
vey, we investigate empirically whether scientists’ attitudes towards commercialization affect
cooperation behavior indirectly through their influence on the attractiveness of cooperation.
Table 8 reports on the estimation results of ordered logit regressions where the attitudes
towards commercialization are the explanatory variables. In columns (1) and (2) the baseline
is presented, which only includes open science identity and reputational rewards associated
with commercialization activities as independent variables. Extended models are presented
in columns (3) and (4) which also include commercialization relevance in scientists’ research
field, PhD discipline and demographic variables. Again, we use scientists perceptions as both
ordinal explanatory variables – referring to 5-point-scales: see columns (1) and (3) – and as
binary variables which take on the value 1 if the ordinal variable takes a value of 4 or 5 – see
columns (2) and (4). The fit statistics suggest that the attitudes towards commercialization
have explanatory power and that the fit is improved when controls are included.1
********************************
insert Table 8 about here
********************************
Two striking results are that scientists attitudes toward free accessibility of research re-
sults are negatively while reputational reward are positively related to scientists’ cooperation
attractiveness. In all four models presented the effect of both variables is statistically sig-
nificant at the 1 percent level. Combining these results with the strong positive effect of
attractiveness of cooperation on cooperation behavior, this result suggests that there are
1Statistical tests suggest that cut-points are statistically significant and therefore using the 5 point Likert-type scale of the dependent variable is appropriate. Robust standard errors are reported which correct forclustering effects at the institute level.
25

indirect effects of open science identity and reputational reward on cooperation behavior
which supports our hypotheses H1 and H2a.
Follow-Up Survey
The second analysis of cooperation attractiveness is based on the sample of cooperators
and includes scientists’ attitudes towards cooperation as explanatory variables. We acknowl-
edge that this analysis requires the assumption that the scientists’ perceived attractiveness
of cooperation has not changed considerably between the initial and the follow-up survey,
since the attractiveness of cooperation was measured in the initial survey while some of the
explanatory variables stem from the follow-up survey. However, only scientists with cooper-
ation experience participated in the follow-up survey and it is not very likely that scientists
who already knew the benefits and drawbacks of cooperation activities with private firms
would quickly change their mind. Table 9 reports the results of Model 2b. Similar to the
aforementioned analysis our baseline model captures solely the variables reflecting scien-
tists’ personal benefits of cooperation and its drawbacks, while extended models use further
explanatory variables as controls.
********************************
insert Table 9 about here
********************************
As seen in Table 9 the estimated coefficient of reputational reward is positive and statis-
tically significant. This result indicates that within the subsample of cooperating scientists
reputational reward indirectly affect scientists’ subsequent cooperation behavior. This indi-
rect effect supports our hypothesis H2b, which states that scientists with cooperation expe-
rience are more likely to engage in further cooperation if they find cooperation is increases
their scientific reputation. Moreover, with respect to financial benefits we find that the vari-
able reflecting scientists’ opportunity to gain personal income is significantly and positively
related to scientists’ cooperation attractiveness. Given the strong positive effect of cooper-
ation attractiveness and cooperation behavior we find a further indirect effect – of income
26

opportunity on cooperation behavior. Moreover, we find that time costs are an important
barrier to cooperation behavior as the reduction of time for own research due to cooperation
with private firms is significantly and negatively related to cooperation attractiveness in all
four models presented.
7 Discussion
Our survey of scientists working at Max Planck Institutes in Germany shows that research
cooperation is a frequently used channel of knowledge transfer. This result is in line with
the findings of other studies (Gulbrandsen and Smeby, 2005; Sellenthin, 2009). Roughly 40
percent of the surveyed scientists reported that they had cooperation experience and most of
the surveyed scientists with cooperation experience reported that they gathered cooperation
experience when working at Max Planck institutes. Moreover, among the surveyed scien-
tists with cooperation experience roughly 43 percent are engaged in subsequent cooperation
activities and more than 50 percent plan to cooperate with private firms in the next two
years.
Against the background of complete public funding of Max Planck Institutes and their
focus on basic research, the strong involvement of Max Planck scientists in cooperation
activities with private firms is striking and our results suggest that individual motivation
is important for establishing and maintaining cooperation activities with private firms. In
particular, our empirical analysis provides answers to two basic questions: Why do scientists
cooperate with private firms at all? Why do some scientists proceed to cooperate with
private firms while others abandon their cooperation activities?
Our results indicate that scientists face various trade-offs between scientific and com-
mercial incentives. Reputational rewards are a main determinant of scientists’ fundamental
decision to cooperate with private firms at all, since they make cooperation more attractive
and thereby increase the probability of cooperation with private firms. If, however, scientists
believe in the concept of open science it is less likely that they will be engaged in research
27

cooperation activities.
Once the fundamental cooperation decision is made and a scientist has gathered coop-
eration experience he or she has to decide whether or not to engage in further cooperation
activities. We find that subsequent cooperation behavior and planned cooperation activi-
ties are positively related to an expected increase in income and reputational rewards from
cooperation while being negatively related to expected time demand. However, expected rep-
utational rewards, income and time demand do only indirectly affect subsequent cooperation
behavior and planned cooperation activities via their influence on cooperation attractive-
ness but not directly. In other words, the effects are mediated by cooperation attractiveness.
Furthermore, the probability of future engagement in cooperation activities is influenced by
firms’ confidentiality requirements. Scientists with cooperation experience who agree that
confidentiality is a problem – because industrial partners wish or contractually enforce that
results will not be published – are less likely to engage in future cooperation activities.
Implications for leaders and managers of scientific institutions
Successful technology transfer has become an important element in the evaluation of the
performance of scientific institutions. For leaders of scientific institutions who aim at increas-
ing knowledge transfer to the private sector, it is essential to account for scientists’ trade-off
between the expected benefits from cooperation and the cost associated with cooperation.
Our results show that both monetary and reputational rewards positively affect the at-
tractiveness of cooperation which in turn increases the probability of cooperating with private
firms. Hence, our results indicate that there are two ways for managers of scientific insti-
tutions to motivate scientists to engage in cooperation and compensate them for the cost
of cooperation. First, monetary benefits that are directly related to cooperation with pri-
vate firms tend to lead to more cooperation. Therefore management of scientific institutions
may advertise rewards for successful cooperation activities. Second, non-monetary repu-
tation effects that are directly related to cooperation activities are also likely to motivate
scientists, e.g. honors for successful cooperation activities. One may ask, however, whether
28

such monetary and non-monetary rewards will reduce scientist incentives to conduct basic
research. Theoretical results suggest that commercial rewards may not only induce the re-
searcher to develop more and to reduce research efforts but may also affect the choice of the
research project. Banal-Estanol and Macho-Stadler (2010, p.187) show theoretically “that
the introduction of commercial rewards prompts researchers to increase the search for (ex
post) high quality ideas, which are more likely to be generated through (ex ante) to riskier
research programs”. If basic research is associated with high uncertainty this may imply
that commercial incentives do not necessarily lead to a reduction in basic research.
Moreover, the management of scientific institutions has to deal with problems accruing
from the confidentiality requirements of private firms. On the one hand these requirements
may be in conflict with individual open science identity and may therefore reduce the at-
tractiveness of cooperation. On the other hand many scientific institutions have strict pub-
lication requirements, i.e. research results have to be published. In such a case a scientist
may fall between two stools. While private partners require confidentiality, publication rules
of scientific institutions typically demand the diffusion of knowledge.
From the point of view of firms this may imply that especially those firms which accept
the open science paradigm and are willing to engage in an open, non-exclusive exchange
of knowledge are more likely to cooperate with scientists in public research institutions.
This is confirmed by the results reported by Hong and Walsh (2009) examining university-
industry collaboration. They find that collaboration with academics is more frequent in
firms if customization of information is more important than exclusivity. In turn, our results
suggest that firms need to be aware that the form of contract is likely to matter. While
firm scientists can be forced to keep results secret, public researchers are often more likely to
refrain from cooperation in case of secrecy clauses. Hence, R&D managers in private firms
intending to establish cooperation activities with scientists in public research institutes have
to make sure that open science norm is not undermined by the cooperation.
Thus, in sum our results suggest that publication requirements of scientific institutions,
29

confidentiality demands of private firms and time demand of cooperation may hamper sci-
entists’ willingness to cooperate with private firms. In order to incentivize scientists to such
cooperation, monetary gains or reputational rewards need to be high enough to compensate
for the costs of cooperation.
Implications for future research
Our examination suggests that future analysis on scientists’ cooperation behavior needs
to distinguish between the fundamental decision of whether or not to cooperate with pri-
vate firms and the decision of scientists with cooperation experience to engage in subsequent
cooperation activities with private firms. Moreover, our results suggest that the expected
benefits and cost of cooperation affect scientists’ cooperation behavior directly or indirectly
via their influence on cooperation attractiveness. Consequently, studies which investigate the
effects of scientists’ private benefits and cost of commercialization – as income, reputation
or time demand – need to account for the possibility of mediated relationships. When only
analyzing direct effects one may erroneously conclude that such private benefits do not or
only hardly affect commercialization activities. Moreover, there is a lack of theoretical re-
search with respect to scientist cooperation behavior. While there are numerous theoretical
studies that investigate scientist patenting, licensing and entrepreneurial behavior, cooper-
ation activities between scientists and industry have been largely overlooked in theory. We
believe that our results provide several suggestions for future theoretical work, as the link
between cooperation behavior and cooperation attractiveness could be further analyzed.
Finally, we acknowledge that our study has (at least) two limitations. First, the Max
Planck Society represents an institutional setting similar to research universities in the US.
Further studies in different academic settings would strengthen our understanding of scien-
tists’ individual motivation to commercialize research. Second, our empirical analyses are
based on two survey waves which do not really allow us to investigate the development of
individual cooperation behavior. Therefore, we encourage further longitudinal studies on
the topics addressed.
30

Appendix
A1: Econometric Techniques
For the econometric analysis of Model 1a, Model 1b, and Model 1c we employ a logit model.
We assume that scientist i’s propensity to engage in cooperation activities y∗i , which cannot
be observed, is linearly related to the observable variables xi:
y∗i = x′
iβ + ui (1)
where ui is an error term and β is a vector of unknown parameters of the explanatory
variables. We assume that the observed cooperation dummy variable yi – whether scientist
i engages in cooperation activities or not – takes the value one if y∗ > 0 and zero otherwise.
If the cumulative distribution of ui is logistic, the probability of cooperation is given by
Pi = P (yi = 1) = F (x′
iβ) =exp(x
′iβ)
1 + exp(x′iβ)
(2)
which is known as the logit model. Note that the estimated coefficients of the logit model
must be interpreted with care as they reflect the rate of change in the log-odds as xij changes.
The explanation of these coefficients is therefore not very intuitive compared to the marginal
effects of explanatory variable on a scientist’s probability of having cooperation activities.
Such marginal effects are given by the following computation.
∂Pi
∂xij= βjPi (1 − Pi)
Hence, the marginal effect on the probability of cooperation has the same sign as the
estimated coefficient βj. However, the value of this marginal effect is not the same for all
observations but depends on the values of all explanatory variables. Moreover, the signif-
icance of this marginal effect is not identical with the significance level of the estimated
coefficient. Following Hoetker (2007), we therefore also present estimates of the average
31

marginal effects. Moreover, we provide two measures of model fit: McFadden’s pseudo-R2
and the adjusted Count R2. The former represents a percental increase in the log-likelihood
function, while the latter reflects the proportion of correct predictions adjusted for the most
frequent outcome (Hoetker, 2007).
The dependent variable of Model 2a and Model 2b, the attractiveness of cooperation,
is an ordinal variable with five categories (5 point scale). Therefore, we make use of an
ordered logit model and assume a linear relationship between the unobserved latent variable
attractiveness of cooperation a∗i and the vector of explanatory variables zi:
a∗i = z′
iα + εi (3)
where the vector α is a vector of unknown parameters and εi are the logistically dis-
tributed errors reflecting stochastic attractiveness differences. The relationship between the
unobserved attractiveness of cooperation, a∗i , and the observed ordinal scale Ai can be ex-
pressed as follows
Ai = 1 if a∗i ≤ µ1
= 2 if µ1 < a∗i ≤ µ2
...
= 5 if µ4 ≤ a∗i
where µj are unknown parameters (cut-points) to be estimated. These parameters must
satisfy µ1 < µ2 < . . . < µ5 in order for the probability of each category to be positive.
As for the binary logit model, the marginal effects of the explanatory variables on the
probabilities are not equal to the estimated coefficient. The estimated coefficient of an
explanatory variable reflects the change of the log odds ratio of two categories if the respective
variable changes by one unit. In contrast, the marginal effect of an variable on the probability
32

of a certain category does not only depend on the estimate of the respective parameter but
also on the estimates of the cut-points and the other parameters as well as on the values of
all explanatory variables. However, the sign of a coefficient in an ordered logit model does
at least provide information about the sign of the effect of the respective variable on the end
response categories.2
A2: Robustness Checks
We conduct several additional estimations to check the robustness of our results.3 Since sci-
entists were asked in the follow-up survey whether they cooperated with private firms during
their time at Max Planck – not counting the last six months –, this allows us to distinguish
between scientists who cooperated solely before their employment at Max Planck Institutes
and scientists who cooperated when working for Max Planck Society. We use this informa-
tion to construct a dummy variable which takes on the value one if a scientist cooperated
when working for Max Planck Society – not counting the last six months – and zero other-
wise. This dummy variable is included as an additional explanatory variables in Model 1c
to control for unobserved effects which may influence the individual intentions to cooperate
in the future. This does further reduce potential endogeneity problems. Estimation results
confirm our previous findings and suggest that the marginal effect of the attractiveness of co-
operation on planned cooperation is still positive and statistically significant. This indicates
that cooperation attractiveness is a strong and robust predictor of cooperation behavior.
Again, we find no evidence for direct effects of reputational reward, income opportunity, and
time demand on planned cooperation activities whereas problems arising from private firms’
confidentiality requirements and assumed non-applicability of research results for industrial
purposes significantly reduce the probability of future cooperation activities with private
firms.
2Yet, it does not provide information about the sign of the effect on any other particular category andabout the magnitude of marginal effects. Therefore, marginal effects have to be calculated for each categoryseparately.
3In order to save space we will only briefly describe these checks and their results.
33

Several scientists who participated in the initial survey have not been surveyed in the
Follow-Up survey. Some refused to participate in the follow-up survey while others where
not accessible. In order to deal with a potential self-selection problem , i.e. probability
of response depends on scientists’ characteristics, which may result in biased results, we
follow Heckman (1979) and estimate a selection equation where the probability of response
is explained by scientists’ personal characteristics. Based on these regressions we calculated
Mills ratio and used it as an explanatory variable for the probability of having ongoing
cooperation activities. The estimated coefficient of mills ratio is statistically insignificant
which suggests that self-selection is not a major problem.
LIT: [A1] Heckman, J. (1979). Sample selection bias as a specification error. Economet-
rica, 47(1), p. 153–161.
34

References
Aghion, P., Dewatripont, M., and Stein, J. (2005). Academic freedom, private-sector focus,
and the process of innovation. NBER Working Paper, 11542:1–40.
Agrawal, A. and Henderson, R. (2002). Putting patents in context: Exploring knowledge
transfer from MIT. Management Science, 48(1):44–60.
Arrow, K. (1962). The rate and direction of inventive activity: Economic and social fac-
tors, chapter Economic welfare and the allocation of resources for invention. Princenton
University Press.
Audretsch, D. and Stephan, P. (1996). Company-scientist locational links: The case of
biotechnology. The American Economic Review, 86(3):641–652.
Azoulay, P., Ding, W., and Stuart, T. (2006). The impact of academic patenting on the rate,
quality, and direction of (public) research output. NBER working paper, 11917:1–49.
Azoulay, P., Ding, W., and Stuart, T. (2007). The determinants of faculty patenting behav-
ior: Demographics or opportunities? Journal of Economic Behavior and Organization,
63(4):599–623.
Banal-Estanol, A. and Macho-Stadler, I. (2010). Scientific and commercial incentives in r&d:
Research versus development? Journal of Economics & Management Strategy, 19:185–221.
Bercovitz, J. and Feldman, M. (2008). Academic entrepreneurs: Organizational change at
the individual level. Organization Science, 19(1):69–89.
Breschi, S. (2007). The scientific productivity of academic inventors: New evidence from
italian data. Economics of Innovation and New Technology, 16(2):101–118.
Buenstorf, G. (2009). Is commercialization good or bad for science? Individual-level evidence
from the Max Planck Society. Research Policy, 38(2):281–292.
35
Cohen, W., Nelson, R., and Walsh, J. (2002). Links and Impacts: The Influence of Public
Research on Industrial R&D. Management science, 48(1):1–23.
Cohen, W. M., Florida, R., Randazzese, L., and Walsh, J. (1998). R. Noll: Challenges to the
Research University, chapter Industry and the Academy: Uneasy Partners in the Cause
of Technological Advance, pages 171–198. Brookings Institution, Washington D.C.
Dacin, M., Goodstein, J., and Scott, W. (2002). Institutional theory and institutional change:
Introduction to the special research forum. Academy of Management Journal, 45(1):45–57.
Dasgupta, P. and David, P. (1987). Arrow and the Ascent of Modern Economic Theory,
chapter Information Disclosure and the Economics of Science and Technology. New York
University Press, New York.
David, P. (2003). The economic logic of open science and the balance between private prop-
erty rights and the public domain in scientific data and information: A primer. Stanford
Institute for Economic Policy Research Discussion Paper, 02-30:1–17.
D’Este, P. and Perkmann, M. (2010). Why do academics engage with industry? The en-
trepreneurial university and individual motivations. The Journal of Technology Transfer,
page forthcoming.
DiMaggio, P. and Powell, W. (1983). The iron cage revisited: Institutional isomorphism and
collective rationality in organizational fields. American sociological review, 48(2):147–160.
Durand, R. and Vaara, E. (2009). Causation, counterfactuals and competitive advantage.
Strategic Management Journal, 30(12):1245–1264.
Etzkowitz, H. (2003). Research groups as quasi-firms: the invention of the entrepreneurial
university. Research Policy, 32(1):109–121.
Fleming, L. and Sorenson, O. (2004). Science as a map in technological search. Strategic
Management Journal, 25(89):909–928.
36

Florida, R. and Cohen, W. (1999). Industrializing Knowledge: University-Industry Linkages
in Japan and the United States, chapter Engine or Infrastructure? The University Role in
Economic Development, pages 589–610. London: The MIT press.
Greenwood, R. and Hinings, C. (1996). Understanding radical organizational change: Bring-
ing together the old and the new institutionalism. Academy of Management Review,
36(5):1022–1054.
Gulbrandsen, M. and Smeby, J. (2005). Industry funding and university professors research
performance. Research Policy, 34(6):932–950.
Hackett, E. J. (1990). Science as a vocation in the 1990s: The changing organizational
culture of academic science. The Journal of Higher Education, 61(3):241–279.
Hall, B. H. (2002). On Copyright and Patent Protection for Software and Databases: A Tale
of Two Worlds. Paper for Grandstand Volume, pages 1–16.
Hamilton, B. and Nickerson, J. (2003). Correcting for endogeneity in strategic management
research. Strategic Organization, 1:51–78.
Henderson, R., Jaffe, A., and Trajtenberg, M. (1998). Universities as a source of commercial
technology: A detailed analysis of university patenting, 1965-1988. Review of Economics
and Statistics, 80(1):119–127.
Hoetker, G. (2007). The use of logit and probit models in strategic management research:
Critical issues. Strategic Management Journal, 28(4):331.
Hong, W. and Walsh, J. (2009). For money or glory? commercialization, competition, and
secrecy in the entrepreneurial university. Sociological Quarterly, 50(1):145–171.
Jensen, R. A., Thursby, J. G., and Thursby, M. C. (2003). Disclosure and licensing of
university inventions: The best we can do with the s**t we get to work with. International
Journal of Industrial Organization, 21(9):1271–1300.
37

Jensen, R. A. and Thursby, M. C. (2001). Proofs and prototypes for sale: The licensing of
university inventions. American Economic Review, 91(1):240–259.
Kanter, R., Stein, B., and Jick, T. (1992). The challenge of organizational change. Free
Press New York.
Kraatz, M. and Moore, J. (2002). Executive migration and institutional change. Academy
of Management Journal, 45(1):120–143.
Lee, Y. (2000). The sustainability of university-industry research collaboration: an empirical
assessment. The Journal of Technology Transfer, 25(2):111–133.
Lee, Y. S. (1996). Technology transfer and the research university: a search for the boundaries
of university-industry collaboration. Research Policy, 25:843–863.
Lowe, R. and Gonzalez-Brambila, C. (2007). Faculty entrepreneurs and research productivity.
The Journal of Technology Transfer, 32(3):173–194.
Merton, R. (1957). Priorities in scientific discovery: A chapter in the sociology of science.
American Sociological Review, 22(6):635–659.
Merton, R. (1973). The Sociology of Science: Theoretical and Empirical Investigations.
University of Chicago Press.
Oliver, C. (1992). The antecedents of deinstitutionalization. Organization studies, 13(4):563.
Owen-Smith, J. and Powell, W. (2003). The expanding role of university patenting in the
life sciences: assessing the importance of experience and connectivity. Research Policy,
32(9):1695–1711.
Owen-Smith, J. and Powell, W. (2004). Careers and contradictions: Faculty responses to
the transformation of knowledge and its uses in the life sciences. Sociologie du travail,
46(3):347–377.
38

Pavitt, K. (1998). The social shaping of the national science base. Research Policy, 27(8):793–
805.
Powers, J. and McDougall, P. (2005). University start-up formation and technology licensing
with firms that go public: a resource-based view of academic entrepreneurship. Journal
of Business Venturing, 20(3):291–311.
Scherer, F. (1982). Inter-industry technology flows and productivity measurement. Review
of Economics and Statistics, 64(4):627–634.
Schomburg, H. and Teichler, U. (2006). Higher education and graduate employment in Eu-
rope: results from graduates surveys from twelve countries. Springer, Dordrecht.
Sellenthin, M. (2009). Technology transfer offices and university patenting in Sweden and
Germany. The Journal of Technology Transfer, 34(6):603–620.
Stephan, P. (1996). The economics of science. Journal of Economic Literature, 34(3):1199–
1235.
Stephan, P. and Levin, S. (1992). Striking the Mother Lode in Science. Oxford University
Press.
Stern, S. (2004). Do scientists pay to be scientists? Management Science, 50(6):835.
Stuart, T. and Ding, W. (2006). When do scientists become entrepreneurs? the social
structural antecedents of commercial activity in the academic life sciences 1. American
Journal of Sociology, 112(1):97–144.
Thursby, J. and Thursby, M. (2002). Who is selling the ivory tower? Sources of growth in
university licensing. Management Science, pages 90–104.
Thursby, J. G., Jensen, R., and Thursby, M. (2001). Objectives, characteristics and outcomes
of university licensing: A survey of major us universities. The Journal of Technology
Transfer, 26(1):59–72.
39

Whelan-Berry, K. S., Gordon, J. R., and Hinings, C. (2003). Strengthening Organizational
Change Processes: Recommendations and Implications From a Multilevel Analysis. The
Journal of Applied Behavioral Science, 39(2):186.
Wiersema, M. and Bowen, H. (2009). The use of limited dependent variable techniques in
strategy research: issues and methods. Strategic Management Journal, 30(6):679 – 692.
Zucker, L., Darby, M., and Armstrong, J. (2002). Commercializing knowledge: University
science, knowledge capture, and firm performance in biotechnology. Management Science,
48(1):139.
Zucker, L., Darby, M., and Brewer, M. (1998). Intellectual human capital and the birth of
us biotechnology enterprises. American Economic Review, 88(1):290–306.
40

24
68
10z_
stat
0.0
5.1
.15
Pre
dict
ion
0 .2 .4 .6 .8 1
1.5
22.
53
3.5
z_st
at
0.0
5.1
.15
Pre
dict
ion
0 .2 .4 .6 .81.
52
2.5
3z_
stat
.04
.06
.08
.1.1
2Pr
edic
tion
0 .2 .4 .6 .8 1
Figure 1: Marginal Effects of Attractiveness of Cooperation on Cooperation Experience,Subsequent Cooperations, and Planned Cooperations
41
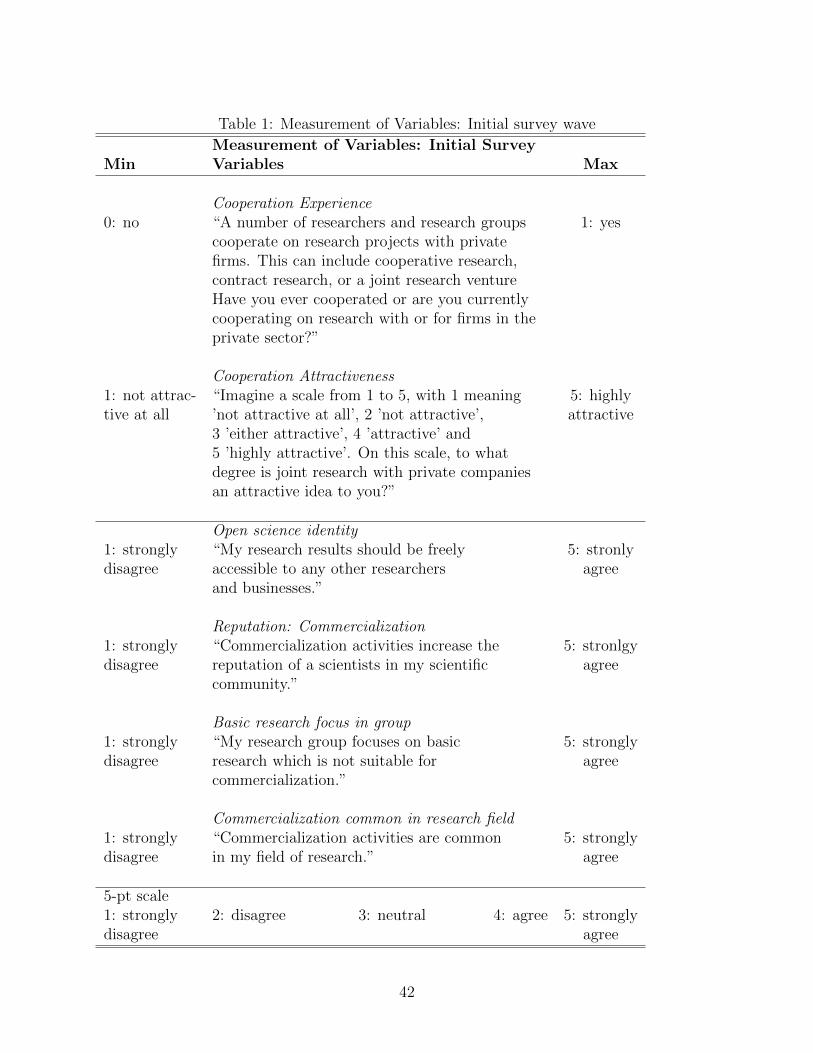
Table 1: Measurement of Variables: Initial survey wave
Measurement of Variables: Initial SurveyMin Variables Max
Cooperation Experience0: no “A number of researchers and research groups 1: yes
cooperate on research projects with privatefirms. This can include cooperative research,contract research, or a joint research ventureHave you ever cooperated or are you currentlycooperating on research with or for firms in theprivate sector?”
Cooperation Attractiveness1: not attrac- “Imagine a scale from 1 to 5, with 1 meaning 5: highlytive at all ’not attractive at all’, 2 ’not attractive’, attractive
3 ’either attractive’, 4 ’attractive’ and5 ’highly attractive’. On this scale, to whatdegree is joint research with private companiesan attractive idea to you?”
Open science identity1: strongly “My research results should be freely 5: stronlydisagree accessible to any other researchers agree
and businesses.”
Reputation: Commercialization1: strongly “Commercialization activities increase the 5: stronlgydisagree reputation of a scientists in my scientific agree
community.”
Basic research focus in group1: strongly “My research group focuses on basic 5: stronglydisagree research which is not suitable for agree
commercialization.”
Commercialization common in research field1: strongly “Commercialization activities are common 5: stronglydisagree in my field of research.” agree
5-pt scale1: strongly 2: disagree 3: neutral 4: agree 5: stronglydisagree agree
42

Table 2: Measurement of Variables: Follow-up survey wave
Measurement of Variables: Follow-up surveyMin Variables Max
Subsequent Cooperation0: no “Have you been engaged in research cooperation 1: yes
during the last six months?”Cooperation during Max Planck
0: no “Have you been engaged in research cooperation 1: yesduring your time at Max Planck, not countingthe last six months?”Planned Cooperation
0: no “Do you have concrete plans to engage in 1:yesresearch cooperation in the next 2 years?”
Benefits and obstacles of cooperation (2nd wave)Reputation: Cooperation
1: strongly “Experience in research cooperation increases 5: stronglydisagree the scientific reputation of a researcher.” agree
Income opportunity1: strongly “Research cooperations greatly increase personal 5:stronglydisagree income opportunities of researchers.” agree
Time costs1: strongly “Doing cooperative research is time-consuming and 5: stronglydisagree therefore reduces the time for my personal scientific agree
research.”Cost sharing
1: strongly “Research cooperations already helped me 5: stronglydisagree to share the costs of research project with agree
private firms.”Confidentiality
1: strongly “In research cooperations confidentiality is a problem 5: stronglydisagree for researchers since industrial partners wish or agree
contractually enforce that results will not get published.”Different approaches: academia – industry
1: strongly “Coordination in research cooperations is problematic 5: stronglydisagree since research approaches and methods of private firms agree
differ from my research approaches and methods.”No commercial application
1: strongly “My current research is not applicable for industrial 5: stronglydisagree purposes.” agree5-pt scale1: strongly 2: disagree 3: neutral 4: agree 5: stronglydisagree agree
43

Table 3: Sample Descriptives on Scientists’ Cooperation Behavior
Initial SurveyCooperator Cooperators Non-cooperators
Share Mean att. value Mean att. value Differencecooperation cooperation t-test
Total Sample (1176) 39.97% (470) 3.672 3.086 ***
MPS SectionLife Science (501) 42.71% (214) 3.710 3.3366 ***Chemistry, Physics (570) 40.71% (232) 3.668 2.964 ***& TechnologyHumanities (105) 22.86% (24) 3.375 2.605 **
Follow-Up SurveyCooperation planned
before MPS during MPS last 6 months cooperationCooperator Sample (240) 49.58% (119) 78.33% (188) 43.75% (105) 52.08% (125)
MPS SectionLife Science (115) 44.35% (51) 73.04% (84) 44.35% (51) 52.17% (60)Chemistry, Physics (111) 54.95% (61) 84.68% (94) 43.24% (48) 52.25% (58)& TechnologyHumanities (14) 50.00% (7) 71.43% (10) 42.85% (6) 50.00% (7)
Notes: The total sample of the initial screening survey comprises 1176 scientists. The follow-up samplecontains 240 scientists. In column 1 the number of scientists belonging to each section is given in brackets.The t-test presented in the sample of the initial screening survey compares whether the attractiveness levelsof scientists having cooperated in the past and scientists without cooperation experience are statistiticallysignificant. The asterisks ***,**,* indicate respectively a significant difference at the 1, at the 5 and at the10 per cent level.
44

Table 4: Summary Statistics: Independent Variables
Total Sample Cooperators(Initial survey) (Follow-Up survey)
Mean St. Dev. Mean St. Dev.Variables
Individual Perceptions oncommercialization(5-pt. scales)Reputation: commercialization 2.985 1.060Open science identity 3.964 0.994Basic research focus in group 3.327 1.150Commercialization is common 2.560 1.048in research field
Benefits and obstacles ofcooperation(5-pt. scales)Reputational reward 3.392 1.033Income opportunity 2.029 1.080Cost sharing 3.320 1.310Time costs 2.800 1.032Confidentiality 3.538 1.116Different approaches 3.104 1.052(academia-industry)No commercial application 2.554 1.327
Demographic characteristicsage (years) 38.941 9.769 42.621 10.208industry work experience (yes-no) 0.162 0.390 0.221 0.415german citizenship 0.567 0.496 0.763 0.426female 0.237 0.426 0.121 0.327years worked for MPS 6.717 7.649 9.433 8.723
Research PositionPost-doctoral researcher 0.688 0.464 0.475 0.500Group leader 0.263 0.440 0.450 0.499Director 0.049 0.217 0.075 0.264
Research FieldLife Science Section 0.426 0.495 0.479 0.501Chemistry, Physics 0.485 0.500 0.463 0.500and Technology SectionHumanities Section 0.089 0.285 0.058 0.235
Notes: The total sample (initial survey) comprises 1176 scientists. The sample of the cooperators (Follow-Upsurvey) comprises 240 scientists.
45

Table 5: Cooperation Behavior: Cooperation Experience – Model 1a
(1) (2) (3) (4) (5) (6)coeff. marg. eff. coeff. marg.eff. coeff.(D) marg. eff. (D)
Cooperation attractiveness 0.625*** 0.111*** 0.630*** 0.111*** 0.818*** 0.154***(0.089) (0.014) (0.095) (0.015) (0.165) (0.033)
Reputation: commercial. -0.071 -0.013 -0.092 -0.017(0.079) (0.014) (0.166) (0.030)
Open science identity -0.196** -0.035** -0.676*** -0.131***(0.078) (0.014) (0.178) (0.033)
Basic research focus -0.157** -0.028** -0.133** -0.024** -0.611*** -0.117***in group (0.066) (0.012) (0.065) (0.012)* (0.117) (0.021)Commercialization 0.301*** 0.054*** 0.294*** 0.053*** 0.562*** 0.107***common in research field (0.078) (0.013) (0.077) (0.013) (0.175) (0.034)Age (log of years) 1.286*** 0.233*** 1.324*** 0.238*** 1.299*** 0.239***
(0.412) (0.075) (0.407) (0.074) (0.406) (0.075)Time at MPS/age 1.592** 0.288** 1.669** 0.300** 1.358* 0.250*
(0.744) (0.131) (0.751) (0.131) (0.749) (0.136)Industry work experience 0.617*** 0.115*** 0.602*** 0.112*** 0.601*** 0.115***(yes-no) (0.181) (0.035) (0.181) (0.034) (0.188) (0.037)German citizenship 0.668*** 0.123*** 0.641*** 0.117*** 0.514*** 0.096***
(0.150) (0.029* (0.147) (0.028) (0.147) (0.029)Female -0.239 -0.043 -0.250 -0.045 -0.271 -0.050
(0.200) (0.036) (0.203) (0.036) (0.196) (0.035)Group leader 0.689*** 0.130*** 0.676*** 0.127*** 0.638*** 0.123***
(0.179) (0.034) (0.178) (0.034) (0.170) (0.033)Director 0.530* 0.099* 0.534* 0.099* 0.512* 0.097*
(0.296) (0.056) (0.298) (0.056) (0.291) (0.056)Constant -8.776*** -8.001*** -6.128***
(1.518) (1.529) (1.456)PhD dummies yes yes yesSection dummies yes yes yesLog likelihood - 633.04 -629.14 -644.78McFadden’s R2 0.200 0.205 0.185Adjusted Count R2 0.315 0.334 0.302
Notes: Robust standard errors which are adjusted for intracluster correlation within Max Planck institutesare reported in parentheses. The asterisks *, ** and *** denote significance at the 10, 5 and 1 percent levelrespectively. Number of observations 1176.
46

Table 6: Cooperation Behavior: Subsequent Cooperation – Model 1b
(1) (2) (3) (4) (5) (6)coeff. marg. eff. coeff. marg. eff. coeff.(D) marg.eff.(D)
Cooperation attractiveness 0.535*** 0.112*** 0.478* 0.087* 0.517 0.105(0.193) (0.035) (0.276) (0.044) (0.336) (0.069)
Reputational reward -0.035 -0.006 0.274 0.055(0.175) (0.032) (0.331) (0.068)
Income opportunity -0.372** -0.068** -0.167 -0.033(0.187) (0.031) (0.516) (0.103)
Time costs -0.248* -0.045* -0.502 -0.101*(0.131) (0.024) (0.316) (0.061)
Cost sharing 0.370*** 0.067*** 0.709*** 0.143***(0.108) (0.017) (0.252) (0.052)
Confidentiality -0.151 -0.028 -0.649* -0.133*(0.157) (0.029) (0.352) (0.070)
Different approaches 0.189 0.035 0.111 0.022(academia – industry) (0.169) (0.030) (0.379) (0.076)No commercial application -0.544*** -0.099*** -1.277*** -0.252***
(0.163) (0.026) (0.454) (0.075)Basic research focus -0.036 -0.008 0.198 0.036 0.204 0.041in group (0.135) (0.029) (0.146) (0.026) (0.242) (0.049)Commercialization 0.375*** 0.079*** 0.368** 0.067** 0.560* 0.115*common in research field (0.134) (0.027) (0.164) (0.029) (0.327) (0.068)Age (log of years) -1.749* -0.373* -1.972* -0.361* -1.989* -0.400*
(1.053) (0.214) (1.141) (0.196) (1.061) (0.206)Time at MPS/age 1.459 0.311 1.748 0.320 1.851 0.372
(1.507) (0.317) (1.595) (0.285) (1.467) (0.293)Industry work experience 0.117 0.025 0.473 0.087 0.228 0.046(yes-no) (0.318) (0.068) (0.342) (0.063) (0.393) (0.080)German citizenship 0.562 0.118 0.212 0.039 0.344 0.069
(0.349) (0.075) (0.431) (0.079) (0.381) (0.078)Female -0.128 -0.027 -0.169 -0.031 -0.085 -0.017
(0.576) (0.122) (0.636) (0.116) (0.529) (0.106)Group leader 0.521* 0.110* 0.281 0.052 0.289 0.058
(0.313) (0.066) (0.315) (0.058) (0.338) (0.069)Director 1.421** 0.295*** 1.267* 0.229* 1.560** 0.301***
(0.635) (0.112) (0.752) (0.120) (0.652) (0.107)Constant 2.886 5.357 6.620*
(-3.629) (-4.303) (-3.939)PhD dummies yes yes yesSection dummies yes yes yesLog likelihood -147.59 -130.23 -140.57McFadden’s R2 0.103 0.208 0.145Adjusted Count R2 0.219 0.381 0.210
Notes: Robust standard errors which are adjusted for intracluster correlation within Max Planck institutesare reported in parentheses. The asterisks *, ** and *** denote significance at the 10, 5 and 1 percent levelrespectively. Number of observations: 240. 47

Table 7: Cooperation Behavior: Planned Cooperation – Model 1c
(1) (2) (3) (4) (5) (6)coef. marg.eff. coef. marg.eff. coef.(D) marg.eff.(D)
Cooperation attractiveness 0.466*** 0.101*** 0.360** 0.071** 0.630** 0.129**(0.168) (0.033) (0.184) (0.034) (0.317) (0.062)
Reputational reward -0.106 -0.021 0.103 0.021(0.141) (0.028) (0.265) (0.054)
Income opportunity -0.149 -0.029 0.348 0.070(0.172) (0.034) (0.618) (0.121)
Time costs -0.109 -0.022 -0.207 -0.042(0.160) (0.032) (0.352) (0.072)
Cost sharing 0.141 0.028 0.289 0.059(0.120) (0.024) (0.280) (0.057)
Confidentiality -0.328** -0.065*** -0.984*** -0.207***(0.133) (0.025) (0.286) (0.059)
Different approaches -0.056 -0.011 -0.299 -0.061(academia–industry) (0.163) (0.032) (0.261) (0.053)No commercial application -0.401*** -0.079*** -1.299*** -0.273***
(0.147) (0.028) (0.433) (0.081)Basic research focus 0.078 0.017 0.266* 0.053* 0.556 0.109*in group (0.152) (0.033) (0.148) (0.028) (0.348) (0.066)Commercialization 0.437*** 0.095*** 0.464** 0.091*** 0.532 0.109common in research field (0.151) (0.030) (0.183) (0.033) (0.341) (0.068)Age (log of years) -0.505 -0.111 -0.735 -0.145 -0.864 -0.176
-1.173 (0.257) -1.214 (0.240) -1.184 (0.241)Time at MPS/age 0.463 0.102 0.821 0.162 1.070 0.218
-1.392 (0.304) -1.350 (0.265) -1.316 (0.263)Industry work experience -0.302 -0.066 -0.209 -0.041 -0.277 -0.056(yes-no) (0.347) (0.076) (0.401) (0.079) (0.409) (0.083)German citizenship 0.517* 0.114* 0.288 0.057 0.398 0.082
(0.293) (0.066) (0.329) (0.066) (0.320) (0.065)Female 0.348 0.076 0.348 0.068 0.436 0.088
(0.384) (0.081) (0.415) (0.079) (0.408) (0.078)Group leader 0.683** 0.149** 0.522 0.103 0.505 0.103
(0.341) (0.071) (0.342) (0.065) (0.334) (0.065)Director 1.083 0.222 1.008 0.191* 1.334** 0.251**
(0.730) (0.128) (0.664) (0.113) (0.650) (0.103)Constant -1.863 1.827 2.553
(-4.224) (-4.352) (-4.511)PhD dummies yes yes yesSection dummies yes yes yesLog likelihood -150.69 -138.83 -141.69McFadden’s R2 0.093 0.164 0.147Adjusted Count R2 0.235 0.365 0.330
Notes: Robust standard errors which are adjusted for intracluster correlation within Max Planck institutesare reported in parentheses. The asterisks *, ** and *** denote significance at the 10, 5 and 1 percent levelrespectively. Number of observations: 240. 48

Table 8: Cooperation Attractiveness: Attitudes towards Commercialization – Model 2a
(1) (2) (3) (4)baseline baseline (D) extended extended (D)
Reputation: 0.593*** 1.119*** 0.455*** 0.865***commercialization (0.059) (0.124) (0.058) (0.125)Open science identity -0.283*** -0.658*** -0.144*** -0.498****
(0.055) (0.139) (0.053) (0.265)Basic research focus -0.346*** -0.840***in group (0.068) (0.141)Commercialization 0.197*** 0.187common in research field (0.055) (0.129)Age (log of years) -0.422 -0.388
(0.372) (0.352)Time at MPS /age -0.005 -0.011
(0.012) (0.011)Industry work experience 0.425*** 0.425***(yes-no) (0.147) (0.151)German citizenship -0.561*** -0.576***
(0.155) (0.151)Female -0.163 -0.163
(0.124) (0.128)Group leader -0.152 -0.168
(0.149) (0.151)Director 0.006 -0.040
(0.286) (0.278)PhD dummies yes yes yes yesSection dummies yes yes yes yesLog likelihood -1625.28 -1643.79 -1535.77 -1553.91McFadden’s R2 0.050 0.040 0.103 0.092AIC 2.774 2.806 2.651 2.682
Notes: Robust standard errors which are adjusted for intracluster correlation within Max Planck institutesare reported in parentheses. The asterisks *, ** and *** denote significance at the 10, 5 and 1 percent levelrespectively. AIC: Akaike Information Criterion. Number of observations: 1176.
49
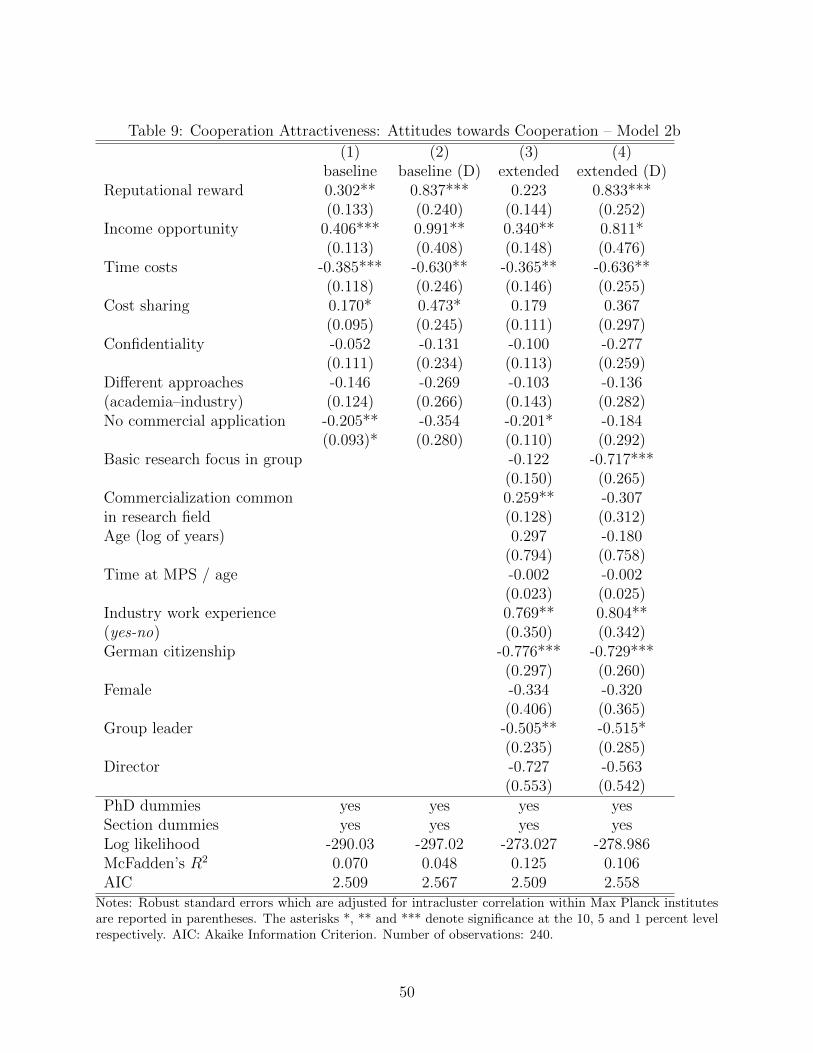
Table 9: Cooperation Attractiveness: Attitudes towards Cooperation – Model 2b
(1) (2) (3) (4)baseline baseline (D) extended extended (D)
Reputational reward 0.302** 0.837*** 0.223 0.833***(0.133) (0.240) (0.144) (0.252)
Income opportunity 0.406*** 0.991** 0.340** 0.811*(0.113) (0.408) (0.148) (0.476)
Time costs -0.385*** -0.630** -0.365** -0.636**(0.118) (0.246) (0.146) (0.255)
Cost sharing 0.170* 0.473* 0.179 0.367(0.095) (0.245) (0.111) (0.297)
Confidentiality -0.052 -0.131 -0.100 -0.277(0.111) (0.234) (0.113) (0.259)
Different approaches -0.146 -0.269 -0.103 -0.136(academia–industry) (0.124) (0.266) (0.143) (0.282)No commercial application -0.205** -0.354 -0.201* -0.184
(0.093)* (0.280) (0.110) (0.292)Basic research focus in group -0.122 -0.717***
(0.150) (0.265)Commercialization common 0.259** -0.307in research field (0.128) (0.312)Age (log of years) 0.297 -0.180
(0.794) (0.758)Time at MPS / age -0.002 -0.002
(0.023) (0.025)Industry work experience 0.769** 0.804**(yes-no) (0.350) (0.342)German citizenship -0.776*** -0.729***
(0.297) (0.260)Female -0.334 -0.320
(0.406) (0.365)Group leader -0.505** -0.515*
(0.235) (0.285)Director -0.727 -0.563
(0.553) (0.542)PhD dummies yes yes yes yesSection dummies yes yes yes yesLog likelihood -290.03 -297.02 -273.027 -278.986McFadden’s R2 0.070 0.048 0.125 0.106AIC 2.509 2.567 2.509 2.558
Notes: Robust standard errors which are adjusted for intracluster correlation within Max Planck institutesare reported in parentheses. The asterisks *, ** and *** denote significance at the 10, 5 and 1 percent levelrespectively. AIC: Akaike Information Criterion. Number of observations: 240.
50