Why do retailers offer financial services? - Welcome to Cenfricenfri.org/documents/Retail...
39
Making financial markets work for the poor Why do retailers offer financial services? NOVEMBER 2013
Transcript of Why do retailers offer financial services? - Welcome to Cenfricenfri.org/documents/Retail...
Making financial markets work for the poor
Why do retailers offer financial services?
NOVEMBER 2013

Agenda
Overview of case study retailers
Primary motivation for offering financial services
Mapping the financial services landscape
Project objectives and scope

Agenda
Overview of case study retailers
Primary motivation for offering financial services
Mapping the financial services landscape
Project objectives and scope
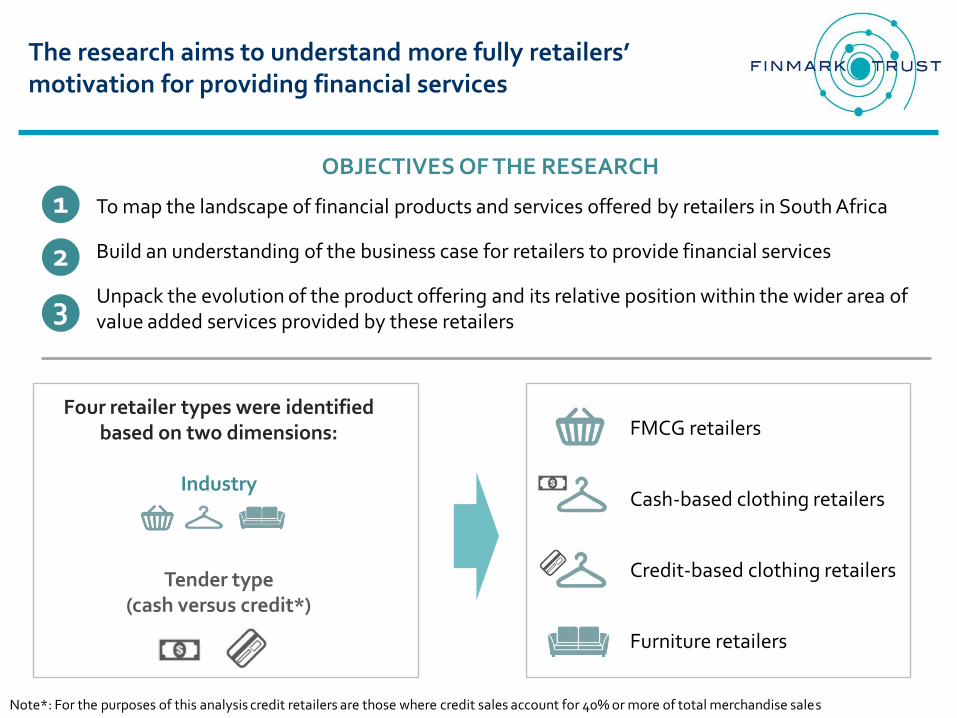
The research aims to understand more fully retailers’ motivation for providing financial services
To map the landscape of financial products and services offered by retailers in South Africa
Build an understanding of the business case for retailers to provide financial services
Unpack the evolution of the product offering and its relative position within the wider area of value added services provided by these retailers
OBJECTIVES OF THE RESEARCH
1
2
3
Four retailer types were identified based on two dimensions:
Industry
Tender type (cash versus credit*)
FMCG retailers
Cash-based clothing retailers
Credit-based clothing retailers
Furniture retailers
Note*: For the purposes of this analysis credit retailers are those where credit sales account for 40% or more of total merchandise sales

Agenda
Overview of case study retailers
Primary motivation for offering financial services
Mapping the financial services landscape
Project objectives and scope

As a first step, large retailers in South Africa were identified. FMCG retailers with more than 500 000 customers in LSM 1-7 were included in the market map
10%
20%
30%
40%
50%
60%
20% 40% 60% 80% 100%
SHOPRITE (20.1 m)
PICK N PAY (13.5 m)
SPAR (13.2 m)
SPAZA (12.1 m)
CHECKERS (6.3 m)
TOWNSHIP SUPERMARKET (4.1 m)
BOXER STORES (3.5 m)
CLICKS (2.8 m)
WOOLWORTHS (1.1 m)
U SAVE (810 000)
DISCHEM (710 000)
MAKRO (454 000)
7 ELEVEN (268 000)
POP IN (206 000)
Source: AMPS 2012A. Note: Total Pick n Pay Group customers (Pick n Pay and Boxer): 16.4 million. Total Shoprite Holdings customers (Shoprite, Checkers, OK and Usave): 24.7 million Note*: “From which store or stores do you usually do your food and grocery shopping?”
% LSM 1-7
Included in market map
Not included in market map
Size of bubble: number of customers
TOP FMCG RETAILERS*

TOP CLOTHING AND SHOE RETAILERS*
Clothing retailers with more than 200 000 customers in LSM 1-7 were included in the market map
0%
10%
20%
30%
40%
50%
60%
0% 20% 40% 60% 80% 100%
JET/ JET MART (5.6 m)
DUNNS (248 000)
PEP STORES (2.9 m)
ACKERMANS (3.1 m)
MR PRICE (4.6 m)
WOOLWORTHS (2.7 m)
TRUWORTHS (2.0 m)
FOSCHINI (887 000)
TOTALSPORTS (846 000)
IDENTITY (692 000)
SPORTSCENE (552 000)
MR PRICE SPORT (409 000)
MILADY’S (384 000)
FASHION EXPRESS! (291 000)
SPITZ (310 000)
STUDIO 88 (248 000)
EDGARS (4.2 m)
LEGIT (710 000)
Source: AMPS 2012A. Note: Total Edcon customers (Edgars, Jet and Legit): 8.9 million. Total Foschini Group customers (Foschini, Exact!, Fashion Express, Markham, Sportscene, Totalsports and Due South): 3.1 million. Total Truworths Group customers (Truworths and Identity): 2.5 million Note*: Bought clothing or shoes from this store in the past 3 months
% LSM 1-7
Included in market map
Not included in market map
Size of bubble: number of customers
EXACT! (340 000)
MARKHAM (1.1 m)
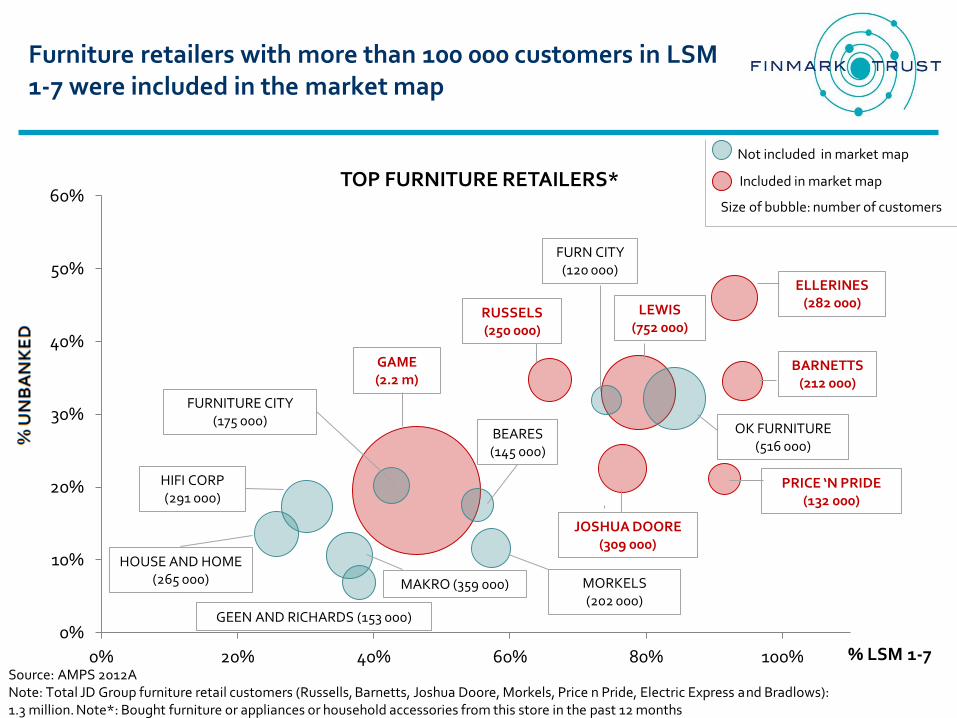
Furniture retailers with more than 100 000 customers in LSM 1-7 were included in the market map
0%
10%
20%
30%
40%
50%
60%
0% 20% 40% 60% 80% 100%
GAME (2.2 m)
LEWIS (752 000)
BARNETTS (212 000)
JOSHUA DOORE (309 000)
ELLERINES (282 000)
RUSSELS (250 000)
OK FURNITURE (516 000)
MORKELS (202 000)
MAKRO (359 000)
HIFI CORP (291 000)
FURNITURE CITY (175 000)
HOUSE AND HOME (265 000)
BEARES (145 000)
GEEN AND RICHARDS (153 000)
PRICE ‘N PRIDE (132 000)
FURN CITY (120 000)
TOP FURNITURE RETAILERS*
Source: AMPS 2012A Note: Total JD Group furniture retail customers (Russells, Barnetts, Joshua Doore, Morkels, Price n Pride, Electric Express and Bradlows): 1.3 million. Note*: Bought furniture or appliances or household accessories from this store in the past 12 months
Included in market map
Not included in market map
Size of bubble: number of customers
% LSM 1-7

In total 25 retailers were included in the market map including six FMCG retailers, three cash-based clothing retailers, nine credit-based clothing retailers and seven furniture retailers
FMCG RETAILERS
CLOTHING RETAILERS
FURNITURE RETAILERS
Shoprite Checkers Pick n Pay Boxer Spar Clicks
Pep Ackermans Mr Price
Truworths Identity Foschini Markham Legit Woolworths Dunns Edgars Jet
Joshua Doore Barnetts Price n Pride Russells Lewis Ellerines Game
CASH BASED
CREDIT BASED

There is a clear clustering around dominant payment mechanism (cash versus credit) and purchase frequency
FREQUENCY OF CLIENT
INTERACTION
PAYMENT TENDER
CREDIT
CASH
CALENDAR
DAILY/MONTHLY SEASONALLY CALENDAR
(BI) ANNUALLY
Boxer Checkers Clicks Shoprite Pick n Pay Spar Pep
Dunns Ackermans Mr Price (19%)
Woolworths (clothing)
Edcon (51%)
Identity (55%)
Foschini (61%)
Truworths (76%)
Lewis (71%)
JD Group (64%) Ellerines (63%)
OK furniture (31%)
Game
Payments switches Retail servicing
activities (such as scanning barcodes)
FOCUS ON TRANSACTIONAL
FOCUS ON CREDIT AND INSURANCE
Strong customer relationships
Rich internal customer databases
Monthly instalment collections platforms

Agenda
Overview of case study retailers
Primary motivation for offering financial services
Mapping the financial services landscape
Project objectives and scope

Five retailers were selected for more detailed case studies
FMCG RETAILERS CASH-BASED CLOTHING RETAILER
CREDIT-BASED CLOTHING RETAILER
FURNITURE RETAILER

According to AMPS 2012, Pick n Pay has 13.5 million customers. Over one fifth are unbanked and 55% are in LSMs 1-7
FINANCIAL SERVICES
Mobile Money Bank Account
Retail Savings Bonds
Cash withdrawal Bill payments SASSA grant pay-outs
Go Banking credit card
STORES
CUSTOMERS
% UNBANKED
% LSM 1-7
CLUB
MEMBERSHIP
174 corporate 282 franchise
13.5 million
Smart Shopper
Anyone can join (7.1 million members
as at September 2013)
JOIN!
22%
55%
Source: AMPS 2012A
SERVICING MODEL Till point

According to AMPS 2012, 37% of Shoprite’s customers are unbanked and the vast majority (85%) are in LSMs 1-7
FINANCIAL SERVICES
Checkers Business Card (niche product)
Savings book
Cash withdrawal Bill payments SASSA grant pay-outs Money transfer
Funeral insurance Accident insurance
Source: AMPS 2012A. Note: Total number of customers that shop at Shoprite or Checkers: 23.9 million
STORES
CUSTOMERS
% UNBANKED
% LSM 1-7
CLUB
MEMBERSHIP
JOIN!
SERVICING MODEL
339 162 Checkers
28 Checkers Hyper
20.1 million 6.3 million
37% 18%
Money Market counter
Money Market counter
85% 43%
N/A
N/A
N/A
N/A

Pep stores has the widest physical footprint of the case study retailers with approximately 1 200 stores
FINANCIAL SERVICES
Personal loan
Lay-bye
Cash withdrawal Bill payments Money transfer Cross-border money transfer
Funeral insurance (off the shelf) Free funeral cover with Pep Club
Source: AMPS 2012A
JOIN!
STORES
CUSTOMERS
% UNBANKED
% LSM 1-7
CLUB
MEMBERSHIP
SERVICING MODEL
+/- 1 200
2.9 million
86%
40%
Till point
Pep Club
Must purchase a sim card at Pep

Edcon is the largest non-food retailer in South Africa. The Group’s two largest retail brands are Edgars and Jet
STORES
CUSTOMERS
% UNBANKED
% LSM 1-7
CLUB
MEMBERSHIP FEE
CLUB MAGAZINE
4.2 million 5.6 million
Edgars Club (Over 1 million
members)
Jet Club (Over 1 million
members)
R29.00 – R49.50 R22.50
1.6 million readers 4.25 million readers
JOIN!
Source: Edcon Annual Report 2012, AMPS 2012A. Note: total customers that shop at Edgars or Jet: 8.6 million
19% 30%
56% 84%
175 (additional 55 Edgars
Active stores)
318 (additional 121 Jet
Mart stores)

Edcon is the largest provider of credit in South Africa by number of customers with 3.8 million credit accounts
Store credit
Funeral Travel Accident Home owners Household contents Vehicle Hospital cash plans Credit life Legal Dental accident
3.8 million credit accounts
5.6 million insurance policies
FINANCIAL SERVICES
In FY 2012 the credit and financial services business generated
R1 311 million profit
(R541 million from the insurance joint-venture)
25% OF TOTAL PROFITS

The JD Group is made up of 7 South African furniture retail brands serving a total of 1.3 million customers
STORES CUSTOMERS % UNBANKED % LSM 1-7
133
97
132
160
113
149
219
212 000
88 000
169 000
309 000
202 000
132 000
250 000
94%
42%
68%
77%
57%
91%
66%
35%
13%
15%
23%
12%
21%
35%
72% 24% 1 003 1.3 million
Source: AMPS 2012A

The JD Group offers customers both secured and unsecured credit as well as a range of insurance products. JD Financial Services accounts for over half of the Group’s operating profit
Secured fixed term credit Unsecured personal
loans
Credit life Asset insurance Funeral insurance
FINANCIAL SERVICES
Lay-bye
The JD Group also offers long term vehicle rentals and other credit products sold
through its Cash Retail and Automotive Retail divisions
In FY 2012 the JD Group generated an operating profit of
R 1 445 million
JD Financial Services contributed R760 million
21%
53%
26%
CONTRIBUTION TO PROFIT
Financial services
Furniture retail
Other

Agenda
Overview of case study retailers
Primary motivation for offering financial services
Mapping the financial services landscape
Project objectives and scope

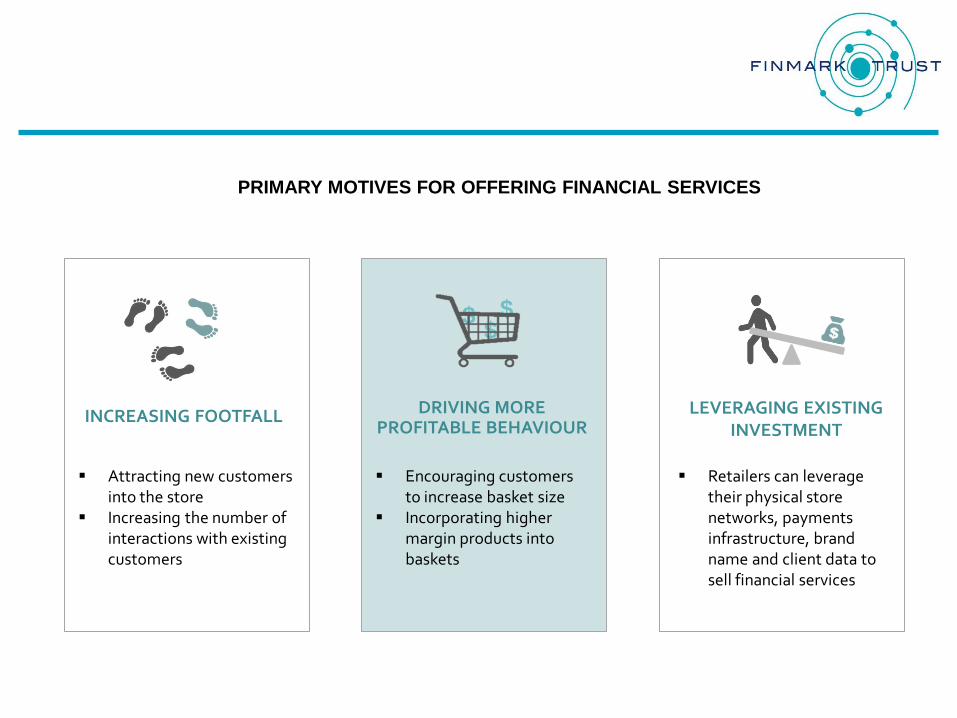
Aside from the direct profitability, there are three primary drivers for retailers to offer financial services
$ $ $
INCREASING FOOTFALL DRIVING MORE PROFITABLE BEHAVIOUR
LEVERAGING EXISTING INVESTMENT
Attracting new customers into the store
Increasing the number of interactions with existing customers
Encouraging customers to increase basket size
Incorporating higher margin products into baskets
Retailers can leverage their physical store networks, payments infrastructure, brand name and client data to sell financial services
PRIMARY MOTIVES FOR OFFERING FINANCIAL SERVICES

Retailers can increase footfall by increasing client acquisition or by increasing the number of interactions with existing customers
INCREASE FOOTFALL
1. Increase client acquisition
2. Increase the number of interactions with clients
Retailers offer financial services that are in demand within their target markets in order to draw more customers into the retail environment more frequently
STORE
STORE
Retailers offer financial services that require customers to come into store monthly to pay premiums and instalments
Transactional services offered by FMCG retailers and Pep
Credit and insurance products that require customers to go in-store monthly to pay premiums
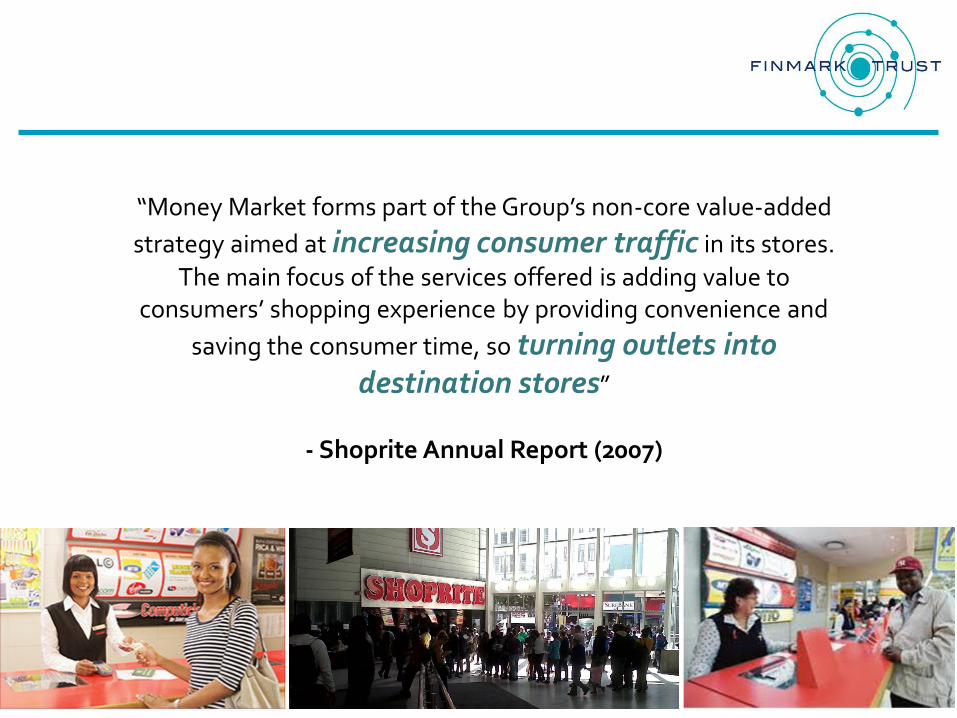
“Money Market forms part of the Group’s non-core value-added
strategy aimed at increasing consumer traffic in its stores.
The main focus of the services offered is adding value to consumers’ shopping experience by providing convenience and
saving the consumer time, so turning outlets into destination stores”
- Shoprite Annual Report (2007)

In-store servicing models for convenience-based services differ. There is a clear trade-off between delivering high convenience to the financial services client by offering services at till point, and negatively impacting the shopping experience of the ‘next in line’ customer
Negatively impact on the shopping
experience of other customers
Offering high convenience for
financial services
CONVENIENCE AND IN-STORE SERVICING MODELS
Retailers offer services at the till point (Pick n Pay and Pep, or at a separate financial services counter (Shoprite)

Increasing footfall: When being a destination store backfires

Facilitating SASSA grant pay-outs ensures feet in-store; Pick n Pay capitalises on this by offering direct incentives for grant recipients to spend in store

Facilitating SASSA grant pay-outs ensures feet in-store; Pick n Pay capitalises on this by offering direct incentives for grant recipients to spend in store
$ $ $
INCREASING FOOTFALL DRIVING MORE PROFITABLE BEHAVIOUR
LEVERAGING EXISTING INVESTMENT
Attracting new customers into the store
Increasing the number of interactions with existing customers
Encouraging customers to increase basket size
Incorporating higher margin products into baskets
Retailers can leverage their physical store networks, payments infrastructure, brand name and client data to sell financial services
PRIMARY MOTIVES FOR OFFERING FINANCIAL SERVICES

Retailers have adopted various approaches to drive behaviour using financial services
DRIVE MORE PROFITABLE BEHAVIOUR
1. Increase basket size
2. Sale of higher margin products
Retailers incorporate thresholds that customers must meet before they can use financial services
Access to financial services is conditional on purchase of a specific good
Pep customers must spend R50 in-store to withdraw cash from the till
Pep Club’s free funeral cover is dependent on air time usage
The provision of credit allows customers to purchase goods and pay back over time
Furniture and credit-based clothing retailers facilitate sales through credit

CLUB
Example: Pep Club
Pep Club’s free funeral cover is specifically linked to the
customer’s purchase of airtime and the length of time that the
sim card has been active
To encourage take up of the club only club
members are able to make use of the money
transfer services
To join the Pep Club customers must
purchase a sim card at Pep

Example: Pep Club
Pep Club’s free funeral cover is specifically linked to the
customer’s purchase of airtime and the length of time that the
sim card has been active
To encourage take up of the club only club
members are able to make use of the money
transfer services
Average airtime usage
Months sim activated
R0-R50 R50-R75 R75-R150 R150-R500 R500+
0-6 months Accident cover of R500 only
Accident cover of R500 only
Accident cover of R500 only
Accident cover of R500 only
Accident cover of R500 only
7-12 months R0 R750 R1 000 R1 250 R1 500
13-24 months R0 R1 500 R2 000 R2 500 R3 000
25-36 months R0 R2 500 R3 00 R3 500 R4 000
37 months + R0 R3 500 R4 500 R5 500 R6 500
Drives persistency and higher spend

$ $ $
INCREASING FOOTFALL DRIVING MORE PROFITABLE BEHAVIOUR
LEVERAGING EXISTING INVESTMENT
Attracting new customers into the store
Increasing the number of interactions with existing customers
Encouraging customers to increase basket size
Incorporating higher margin products into baskets
Retailers can leverage their physical store networks, payments infrastructure, brand name and client data to sell financial services
PRIMARY MOTIVES FOR OFFERING FINANCIAL SERVICES
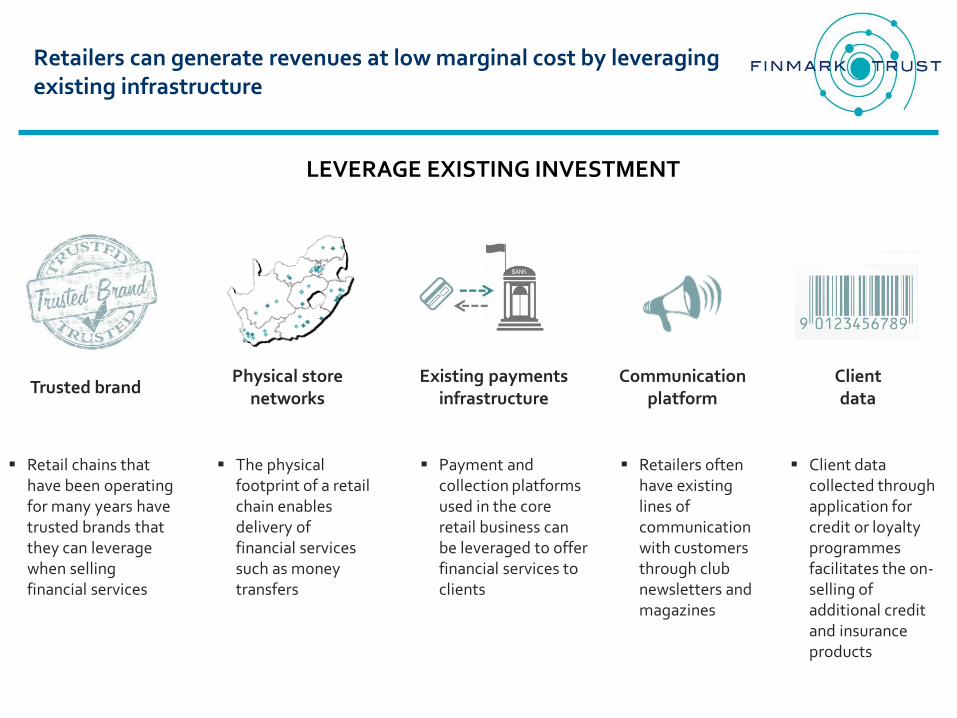
Retailers can generate revenues at low marginal cost by leveraging existing infrastructure
Physical store networks
LEVERAGE EXISTING INVESTMENT
Trusted brand Existing payments
infrastructure Client data
Communication platform
The physical footprint of a retail chain enables delivery of financial services such as money transfers
Retail chains that have been operating for many years have trusted brands that they can leverage when selling financial services
Client data collected through application for credit or loyalty programmes facilitates the on-selling of additional credit and insurance products
Payment and collection platforms used in the core retail business can be leveraged to offer financial services to clients
Retailers often have existing lines of communication with customers through club newsletters and magazines

Retailers can generate revenues at low marginal cost by leveraging existing infrastructure
LEVERAGE EXISTING INVESTMENT
Client data
Client data collected through application for credit or loyalty programmes facilitates the on-selling of additional credit and insurance products
Client Data
Client Data
Informs
Generates Informs
Generates
Merchandise
Financial services

Examples:
PICK N PAY PEP
Pep uses its extensive physical footprint to facilitate its money transfer service Many Pep stores are located in rural areas with limited access to banking infrastructure
Pick n Pay was the first retailer in South Africa to introduce secure, PIN-based Electronic Funds Transfer at Point-of-Sale (POS) in 1989
This enabled customers to use their debit cards to purchase groceries
This technology has been leveraged to offer cash withdrawals at POS and SASSA withdrawals

Edcon has utilised client data and credit infrastructure to offer a wide range of insurance products. The Edgars and Jet Club magazines are the perfect communications platforms to advertise these insurance products
Edcon has 3.8 million credit accounts…
… as well as payment and collections platforms required for credit
Client data
Existing payments infrastructure
The Edgars and Jet Club magazines have a combined readership of 5.4 million*
10 insurance products
5.6 million active policies
R541 million in profits
Communication platform
EDCON
Source*: AMPS 2012

Questions?

Making financial markets work for the poor
Thank you