Why Do Migrants Remit? Empirical Evidence from Kenyasdiarticle4.com/prh/doc/Ms_JEMT_51784.pdf · 14...
18
1 Why Do Migrants Remit? Empirical Evidence from Kenya 1 2 Abstract 3 Aims: Remittances both external and internal are very important to the Kenyan economy. In view of this, 4 this study improves the understanding of the drivers of remittances in Kenya. In addition, the study 5 empirically tests the main theories of remittances namely altruism, self interest and implicit contractual 6 agreement. 7 Methodology: This paper analyzes migrant’s remittance behaviour in Kenya using household survey 8 data from World Bank 2009 African Migration Project. Since a large share of migrants does not remit, 9 Heckman sample selection model is suggested and estimated using Limited Information Maximum 10 Likelihood. 11 Results: The results show that external migrants have a higher probability to remit and, on average send 12 higher levels of remittances back home relative to internal migrants. Internal and external migrants with 13 higher levels of education prior to migration and employed migrants remit more both at extensive and 14 intensive margins. External migrants have a higher probability to remit and send larger amounts of money 15 to higher-income households while internal migrants have a higher probability to remit and send higher 16 levels to lower-income households. 17 Conclusion: Therefore, the empirical results suggest that internal and external remittances are motivated 18 by altruism and inter-temporal contractual agreement between a migrant and the household. The results 19 also provide support for external remittances as being motivated by self-interest. 20 Key words: Migrant, Remittance, Selection bias, Heckman, Kenya 21 1.0 INTRODUCTION 22 External remittances have become a vital source of financial flows to the Kenyan economy for the last 23 one decade. External remittances through the formal channels increased from US$0.61 billion in 2009 to 24 US$1.72 billion in 2016 [1]. The official recorded inward remittances flows to Kenya in 2018 were 25 estimated at US$ 2.7 billion [1]. The principal source of external remittances to Kenya is North America 26 (51.54%) followed by Europe (32.31%) and the Rest of the World constitutes the remaining 16.14% of the 27 total inflows [1]. It is important to note that, the true level of external remittances inflows to Kenya is likely 28 to be much higher because the official figures fail to account for money transferred through informal 29 channels such as hawala as well as friends and relatives. 30 Previous studies attribute the rapid growth in levels of external remittances to Kenya to several factors. 31 First, is an increase in the number of external migrants investing money back in Kenya due to the 32 attractive investment opportunities in the real estate sector [2]. Second, the significant increase in number 33 of Kenyans living in the Diaspora and low rate of naturalization of emigrants in the high income countries 34 [3]. Third, is the current Kenya constitution which, allows for dual citizenship thus enabling Kenya citizens 35 to remit money back to the country. Finally is the improvement in data collection and proper classification 36 of remittances by commercial banks. 37 As a source of income to Kenya, external remittance is a more appealing source than other sources of 38 foreign financing. This is because remittances have several desirable properties. First, their magnitude is 39 large compared to foreign direct investment (FDI) and private debt and portfolio equity. External 40 remittances are the leading source of foreign currency to Kenya and surpass revenues from tea, 41 horticulture and tourism [2]. Second, external remittances are more stable and resilient to economic 42 downturns relative to other private capital flows such as FDI and well as private debt and portfolio equity. 43 Finally, external remittances have increased steadily over the years providing a steady source of income 44 [1]. 45 46 Turning to internal remittances, it is important to note that like in other countries, the true size of domestic 47 remittances in Kenya is not known. This is could be due to the lower recognition accorded to internal 48
Transcript of Why Do Migrants Remit? Empirical Evidence from Kenyasdiarticle4.com/prh/doc/Ms_JEMT_51784.pdf · 14...

1
Why Do Migrants Remit? Empirical Evidence from Kenya 1
2 Abstract 3 Aims: Remittances both external and internal are very important to the Kenyan economy. In view of this, 4 this study improves the understanding of the drivers of remittances in Kenya. In addition, the study 5 empirically tests the main theories of remittances namely altruism, self interest and implicit contractual 6 agreement. 7 Methodology: This paper analyzes migrant’s remittance behaviour in Kenya using household survey 8 data from World Bank 2009 African Migration Project. Since a large share of migrants does not remit, 9 Heckman sample selection model is suggested and estimated using Limited Information Maximum 10 Likelihood. 11 Results: The results show that external migrants have a higher probability to remit and, on average send 12 higher levels of remittances back home relative to internal migrants. Internal and external migrants with 13 higher levels of education prior to migration and employed migrants remit more both at extensive and 14 intensive margins. External migrants have a higher probability to remit and send larger amounts of money 15 to higher-income households while internal migrants have a higher probability to remit and send higher 16 levels to lower-income households. 17 Conclusion: Therefore, the empirical results suggest that internal and external remittances are motivated 18 by altruism and inter-temporal contractual agreement between a migrant and the household. The results 19 also provide support for external remittances as being motivated by self-interest. 20
Key words: Migrant, Remittance, Selection bias, Heckman, Kenya 21
1.0 INTRODUCTION 22 External remittances have become a vital source of financial flows to the Kenyan economy for the last 23 one decade. External remittances through the formal channels increased from US$0.61 billion in 2009 to 24 US$1.72 billion in 2016 [1]. The official recorded inward remittances flows to Kenya in 2018 were 25 estimated at US$ 2.7 billion [1]. The principal source of external remittances to Kenya is North America 26 (51.54%) followed by Europe (32.31%) and the Rest of the World constitutes the remaining 16.14% of the 27 total inflows [1]. It is important to note that, the true level of external remittances inflows to Kenya is likely 28 to be much higher because the official figures fail to account for money transferred through informal 29 channels such as hawala as well as friends and relatives. 30
Previous studies attribute the rapid growth in levels of external remittances to Kenya to several factors. 31 First, is an increase in the number of external migrants investing money back in Kenya due to the 32 attractive investment opportunities in the real estate sector [2]. Second, the significant increase in number 33 of Kenyans living in the Diaspora and low rate of naturalization of emigrants in the high income countries 34 [3]. Third, is the current Kenya constitution which, allows for dual citizenship thus enabling Kenya citizens 35 to remit money back to the country. Finally is the improvement in data collection and proper classification 36 of remittances by commercial banks. 37
As a source of income to Kenya, external remittance is a more appealing source than other sources of 38 foreign financing. This is because remittances have several desirable properties. First, their magnitude is 39 large compared to foreign direct investment (FDI) and private debt and portfolio equity. External 40 remittances are the leading source of foreign currency to Kenya and surpass revenues from tea, 41 horticulture and tourism [2]. Second, external remittances are more stable and resilient to economic 42 downturns relative to other private capital flows such as FDI and well as private debt and portfolio equity. 43 Finally, external remittances have increased steadily over the years providing a steady source of income 44 [1]. 45 46 Turning to internal remittances, it is important to note that like in other countries, the true size of domestic 47 remittances in Kenya is not known. This is could be due to the lower recognition accorded to internal 48

2
migration and also lack of recording of the remittances. Further, internal remittances are normally remitted 49 through informal channels therefore making it difficult to record remittances [4]. Nevertheless, the levels 50 of domestic remittances have increased in the last decade due to the rapid adoption of mobile-phone 51 money transfer service. 52
Due to their large size, the government of Kenya regards external remittances as a key contributor to 53 economic growth and development. The government has also crafted the Kenya Diaspora Policy to tap 54 Diaspora remittances to at least 5% of the Kenya’s GDP as outlined in the Second Medium Term Plan of 55 the Kenya’s Vision 2030 [5]. Existing literature shows that external remittances play an important role in 56 the Kenyan economy by stimulating economic growth [6, 7] and demand for housing construction [8]. 57 Empirical studies also reveal that domestic and external remittances supplement household income 58 [Johnson and Whitelaw, 9; Hoddinott, 10], increase household welfare [11], reduce income inequalities 59 [12] and boost accumulation of physical capital [13]. Past studies also show that remittances intensify 60 household investment on education, health and entrepreneurship [14] 61
Despite the prominence of remittances in the Kenyan economy, the determinants of internal and external 62 remittances have not been comprehensively studied. Existing studies on the determinants in Kenya do 63 not provide a comprehensive understanding. Some of the studies concentrate on internal remittances 64 particularly urban to rural remittances [9, 15, 10, 16) and yet external remittances has turn out to be an 65 important source of household income and foreign currency to the country. On the other hand, previous 66 studies investigating the determinants of external remittances apply aggregate data [8] which may 67 capture only a small fraction of total remittance since a substantial part of remittance is sent through 68 informal channels and thereby not recorded. This study thus uses a nationally representative household 69 survey dataset to empirically analyze the determinants of internal and external remittances in Kenya and 70 thus avoid the data issues experienced by previous studies and provide comprehensive analysis of 71 internal and external remittances using the same dataset. The study analyzes separately the 72 determinants of internal and external remittances due to the fact that the sources of the two types of 73 remittances are different. Therefore, the main objective of the study is to analyze the determinants of 74 internal and external remittances in Kenya. In carrying out the analysis, this study uses the Heckman two-75 step procedure to deal with problem of selection bias and therefore attain unbiased and consistent 76 estimates of the parameters estimates. Ignoring the conditional and unconditional marginal effects of 77 Heckman’s approach may lead to wrong interpretation of regressors on the dependent variable. 78
The findings of the study will be will be useful to Kenyan policy makers as it will provide comprehensive 79 information on the determinants of both internal and external remittances. Identification of the drivers of 80 remittances is crucial to policy makers striving to maximize benefits from the remittances. 81
The rest of the paper is organized as follows. The section 2 summarizes literature on remittances. Section 82 3 describe the methodology, data used in the analysis, presents and discusses the results. Finally, 83 section 4 provides summary and policy implications. 84
2.0 PREVIOUS STUDIES 85 This section provides a brief summary of the theoretical and empirical literature review on explanations as 86 to why migrants remit. From the seminal work of Lucas and Stark [17], there are three motives for why 87 migrants remit. These are pure altruism, self-interest and inter-temporal contractual agreement. On 88 altruistic motive, migrants care about the welfare of their family left back home and derive utility from their 89 own consumption and that of their family members. In this case, migrants remit without expecting any 90 reciprocation from their families. On self-interest motive, migrants remit for their own personal gains. For 91 instance, migrants may remit with the hope of inheriting, investment in assets, and in preparation for their 92 coming back home [see 18]. The contractual agreement motive comprises implicit agreement between 93 migrant and their family, which includes co-insurance, implicit loan-agreement and exchange motivation 94 [19]. Therefore, remittance may represent payment in exchange of services provided by migrant’s family 95 in the country of origin. Such services include taking care of migrant’s property or old parents [see 20, 96 18]. 97
Further, according to the new economics of labor migration theory, migration constitutes substitution for 98 imperfect markets in a migrant’s homeland [see 21, 22, 23, 24]. A household initially invests in human 99

3
capital of its members and then finance their migration to urban areas or into foreign countries [22]. When 100 a migrant starts working, he/she remits to the family during times of shock (such as death, sickness, poor 101 harvests), to increase consumption and augment household investment. On the other hand, if a migrant 102 faces shock such as unemployment at the destination, the family provides financial assistance to the 103 migrant. This way, remittance enables the family and migrant to co-insure one another. 104
Brown and Poirine [25] develop a different hypothesis of remittance known as weak altruism which is 105 based on parental behaviour. In this theory, investment in education is formulated within informal family 106 arrangement that enforce on children the task to return remittance to parents to reciprocate for investment 107 in human capital. A family invests in human capital of children. After effective migrant’s life abroad, a 108 migrant remit to compensate for investment in human capital. Parents use remittance to finance 109 consumption in their subsequent years just like other endowment or pension fund. 110
An alternative model developed by Glytsos [26] postulates that migrants have an objective to return home 111 quickly with a certain amount of savings (savings target). The ability of a migrant to remit is taken as the 112 supply side and the family claim as the demand side of the remittance function. The migrant and the 113 family embark on a tug-of-war governed by bargaining power of the two parties. While the migrant desires 114 to minimize income leakage through remittances and consumption and maximize on saving, the family 115 tries to maximize benefits from remittances, relative to that of its neighbours. The level of remittance 116 therefore varies with migrant’s income, per-capita income of the migrant sending country and the 117 bargaining power of the two-parties. 118
Motivations to remit are extended by Naiditch and Vranceanu [27] who theorize that if family members 119 and friends have less information regarding a migrant’s income abroad, the migrant may remit to signal 120 their success abroad in the eyes of household members and friends left behind. Migrants care about 121 status and prestige. Since remittance indicates migrant’s success abroad, less-successful migrants send 122 more remittances to hide their financial challenges and thus create the impression that they have 123 succeeded. But, the genuinely successful migrants remit more than the less-successful migrants to show 124 their actual booming economic situation in the host country. 125 126 Several empirical studies have been done to analyze the determinants of remittances using different 127 methodologies in their analysis. Some earlier empirical studies [see 9, 15, 17, 28] use OLS in the 128 estimation and thus overlook non remitters in their analysis. These studies overlook data censoring 129 problem of the dependent variable (remittances) and thus, may lead to biased and inconsistent estimates 130 of the determinants of remittances if scale of censorship (zero remittance observations) is significant [see 131 29]. The censored nature of the dependent variable (remittances) is due to the fact that some migrants do 132 not send any remittances in a given year [see, 30, 31]. 133
To address the problem of data censoring, previous studies [32, 33, 34, 35, 30] use Tobit/censored 134 normal regression model [Tobin, 36]. For instance, Banerjee [32] apply Tobit and two-stage selection 135 model to analyze the decision to remit and level of remittance sent by migrants in Delhi to their place of 136 origin. The study finds that levels of remittances sent are positively correlated to number of dependants in 137 a household and migrant’s level of education and negatively related to migrant’s length of stay abroad. 138 Brown [33] examines remittance behavior of Pacific Island migrants residing in Sydney and find that 139 migrants remit more if they have higher income, return intentions and if migration trip is financed by the 140 family. Cox et al. [34] use cross-sectional dataset from Peru to analyze the determinants of transfers from 141 offspring to parents and vice versa. The findings supports exchange motive and also reveal that levels of 142 remittance are positively correlated to family pre-transfer income. A key shortcoming of Tobit estimator in 143 addressing censorship is that it rests on strong distribution assumptions of homoskedasticity and 144 normality. Therefore, it yields inconsistent parameter estimates if error term is heteroskedastic or non-145 normal [see 29, 37]. To address the problems due to distributional assumption of the Tobit model, some 146 studies use Censored Least Absolute Deviation (CLAD) estimator developed by Powell [38]. 147
CLAD specification relies on weaker assumptions than Tobit model and produces robust and consistent 148 parameter estimates even in presence of heteroscedasticity and non-normality [29, 37]. de la Briere et al. 149 [39] and Gubert [40] apply CLAD estimator to analyze the determinants of internal and external 150

4
remittances in Dominican Sierra and Kayes region in Western Mali respectively. Specifically, de la Briere 151 et al. [39] test between insurance and investments motivations to remit. The estimates indicate that 152 motivation to remit vary with migration destination (domestic vs. external migration) and gender of a 153 remitter. Women migrants to US remit more when their parents are ill, while men fail to remit unless they 154 are the only migrants from the household. Gubert [40] supplements CLAD specification with Tobit 155 estimator and finds that remittances insure households against adverse shocks arising from drop in grain 156 output and death in a family. However, both de la Briere et al. [39] and Gubert [40] fails to address for 157 selection in receiving of remittances. Therefore, their parameter estimates may be biased. Furthermore, 158 CLAD estimator generates less-efficient estimates meaning that the computed standard errors are 159 inappropriate for drawing inferences [29]. Recent studies apply two-stage estimators: double-hurdle [41] 160 and Heckman [42] sample selection models to relax Tobit’s assumption that the decision to remit is a 161 single-step decision so that the probability to remit and level of remittance are determined simultaneously. 162
Heckman sample selection approach is used by several previous studies [see 10, 16, 43; 44; 45; 46, 31] 163 to investigate the drivers of remittances. For instance, Hoddinott (1992) finds that remittances to Central 164 Kenya from migrant sons increase with parental landholdings while inheritable land assets have a 165 stronger effect if a household has multiple migrant sons. Hoddinott [10] finds that migrant sons from 166 Western Kenya send more domestic remittances to wealthier parents with ability to offer reward for 167 remittances beyond a threshold, inform of inheritable land. Moreover, remittances increase with number 168 of adult sons in a family and migrant’s education. One drawback of empirical studies of Hoddinott [10, 16] 169 is that they use unrepresentative datasets from specific geographical area. The studies also consider 170 urban to rural remittances and investigate remittance behaviour of only one gender: sons. The authors fail 171 to include exclusion restriction in the sample selection model suggesting their parameter estimates are 172 likely to be biased and inconsistent. Further, the studies do not generate marginal effects that are 173 necessary to explain the effect of regressors on probability and level of remittances. 174
A similar econometric approach is applied by Garip [47] to explore the determinants of remittances in 175 Thailand. The author models remittance behaviour using an integrated approach that considers migration 176 as a mechanism for selection. The selection and outcome equations are measured as binary variables. 177 Thus, a variant of Heckman’s two-step specification known as censored bivariate probit estimator is 178 applied. Consistent with exchange theory of remittances, the estimated parameters shows that number of 179 migrants from the same household and presence of inheritable assets positively impacts on the 180 probability to remit. 181
Apart from methodological issues one may categorize remittances studies to various groups. First is that 182 most studies that focus on the determinants of internal remittances are based on cross-section data due 183 to lack of panel and time series data [see, 9, 15, 17, 28]. For instance, Johnson and Whitelaw [9] analyze 184 the determinants of urban to rural remittance using data gathered from Kenya and finds that the share of 185 migrant income remitted is negatively correlated with migrant’s wage. Another study on Kenya [15] finds 186 that the probability to remit varies with migrant’s intention to return home while amount remitted varies 187 with migrant’s level of income and that remittances are inversely related to duration of migration. Similar 188 studies on other African countries [17, 28] reveal that internal migrants with higher level of schooling remit 189 higher amounts. Their finding is consistent with loan repayment theory but refute altruism motivation. 190 Phan and Coxhead [46] find that the level of urban to rural remittance intensifies with migrant wages, 191 lower attachment with migration destination and lower rural household income. The studies further find 192 that migrant sons remit more to a household with large herd of cattle and large income. In line with 193 insurance motivation, results show that migrants send higher amounts of money to families facing higher 194 risk of losing cattle and crops due to drought. 195
Some studies focus on studying international remittances use time series, panel and cross-sectional data. 196 For example, Straubhaar [48] and Aydas et al. [49] use time series data to analyze the determinants of 197 external remittances in Turkey. Straubhaar [48] focuses on remittance from Germany to Turkey for the 198 period 1963 to 1982 and find a positive effect on remittances of economic situation in the host country, 199 migrant’s confidence in safety and liquidity of their investment in the home country. However, interest rate 200 and exchange rate does not affect remittances significantly. Building on ideas of Straubhaar [48], Aydas 201 et al. [49] study the determinants of aggregate remittances from abroad using data for the period 1979 to 202

5
1993. The findings suggests that inflation, military regime and black market premium has an adverse 203 effect on remittances while economic growth has a positive and significant effect on remittances. 204 205 Lueth and Ruiz-Arranz [50] use dataset of bilateral remittance flows to analyze the determinants of 206 remittances in eleven countries in Europe and Asia. Empirical results support mixed motives. As per 207 altruistic hypothesis, remittances are positively correlated to dependency ratio in the home country. 208 Surprisingly, remittances do not increase after natural disaster in the home country. Furthermore, 209 remittances are responsive to investment climate in home and host country and positively associated with 210 business cycle in the home country indicating that remittances are motivated by investments. Alleyne et 211 al. [51] investigates the determinants of remittances in English-speaking Caribbean countries and find 212 that they are influenced by altruism and investment motives. Frankel [52] uses dataset of Lueth and Ruiz-213 Arranz [50] and finds that remittances are countercyclical with regard to income in the home country and 214 cyclical with respect to income in the host country. Ahmed and Martinez-Zarzoso [53] use same approach 215 as Lueth and Ruiz-Arranz [50] to explore the link between transaction costs on bilateral remittances 216 inflows to Pakistan from 23 host countries. Results indicates that increase in transaction cost curtail 217 remittances suggesting that higher remittance transaction costs may deter remittances or encourage the 218 use of informal remittance channels. 219 220 Connell and Brown [54], and Holst and Schrooten [55] use household survey to analyze remittance 221 behaviour of migrants residing in Australia and Germany, respectively. Connell and Brown [54] find that 222 households with skilled workers remit more than households without skilled workers. Remittances sent by 223 households with skilled workers do not decline over time. However, remittances sent by households 224 without skilled workers diminish sharply after 15 years of migration. Holst and Schrooten [55] finds that 225 income has insignificant effect on remittances while migrant’s country of origin and degree of integration 226 in the host country are important determinants of remittances. Empirical studies based on cross-sectional 227 data are able to discriminate between different motivations to remit quite easily than studies using time 228 series data [56]. However, they are subject to estimation issue of selection bias because not all migrants 229 remit within a given time period. Failure to address for selection in the receipt of remittance may yield 230 biased estimates of the determinants of remittances [Adams, 57]. Empirical studies using cross-sectional 231 data also face the problem of reverse causality. For instance, investment made by remittances in the past 232 may increase current household income subsequently leading to a biased estimate on the positive effect 233 of household income on remittances [57]. 234
Several empirical studies use gendered approach to analyze the determinants of remittances [58; 30, 31]. 235 VanWey [58] use data from Nang Rong Thailand to scrutinize motivations to remit and finds that women 236 have a higher probability to remit than men. Decomposition analysis indicates that gender differences in 237 treatment are more significant than endowment differences in explaining the entire gender differences in 238 remittances. Estimated coefficients also indicate that women’s remittance behaviour is strongly motivated 239 by altruism while men behave more contractually. Dissimilar findings are reported by Niimi and Reilly [30] 240 in Vietnam. The authors find that women and men remit for altruistic and insurance reasons but women 241 are more reliable remitters than men. Another key finding is that endowment differences (associated with 242 household head status, labour market earnings and age differences) are more significant than treatment 243 differences in explaining the entire gender difference in remittances. In India, Mahapatro [31] finds a 244 positive and significant relationship between household income and levels of remittances sent by both 245 genders, suggesting migrants behave contractually. The study also finds gender differences in migrant’s 246 remittance behaviour. Specifically, education has a positive effect on women remittance behaviour but 247 does not have significant impact on men remittance decision. 248
Whilst empirical works of VanWey [58], Niimi and Reilly [30] and Mahapatro [31] emphasize how the 249 determinants of remittances are influenced by gender, their analyses have shortcomings. VanWey [58], 250 for instance, analyze the probability to remit and not levels of remittances. Niimi and Reiily [30] measure 251 remittance using money/goods sent home and/or money/goods given to relatives during migrant’s visits. 252 Thus, the dataset does not distinguish between the two actions as amount remitted is the overall value of 253 money/goods that migrant remitted/gave to their relatives in the area of origin during the one year period 254 before the survey. The authors use only migrant characteristics in the analysis as the survey fails to 255 collect information on households from which the migrant originated. This means that the parameter 256

6
estimates may be biased due to omitted variables [Adams, 57]. Furthermore, Mahapatro [31] focuses on 257 remittances without controlling for migration destination (internal or external migration). 258
Some studies test remittance theories to assess what motivates migrants to send money back home. For 259 instance, Agarwal and Horowitz [43] examine altruistic versus risk sharing motive in Guyana. Stemming 260 from differences in remittance behaviour of sole and multiple migrants, the study concludes that 261 remittances are altruistically motivated. Brown and Poirine [25] use data from Tongan and Samoan 262 households living in Australia to explore weak altruism theory. The hypothesis is supported by the study 263 and therefore the authors propose combining theories of private intergenerational transfers, human 264 capital investments and remittances when exploring migrant’s remittance behaviour. Despite the fact that 265 household income is potentially endogenous, the authors fails to use instrumental variable estimation 266 method and therefore their results may be biased. 267
Using Mexican data, Amuedo-Dorantes and Pozo [35] test between family-provided versus self-provided 268 insurance motives. The authors find that migrants exposed to higher income risk have higher probability 269 to remit and also send a larger fraction of income for insurance purposes, than migrants with lower 270 income risks. Naufal [59] use data from Nicaragua to examine altruism and self-interest motivations for 271 remitting. In line with Agarwal and Horowitz [43], the author finds empirical evidence in support of 272 altruism. Migrant remittance behaviour also exhibits heterogeneity as women migrants are more altruistic 273 relative to their men counterparts. Bouoiyour and Miftah [44] explore altruism and welfare hypothesis and 274 find dissimilar findings in Morocco. The estimates show that remittances are motivated by altruism since 275 migrants have a higher probability to remit and also send higher amounts if a household is in need of 276 financial support from the migrant. Additionally, migrants remit more if they are employed and if there are 277 fewer migrants in the family. The results also show that migrants remit more if the family had paid for 278 migration suggesting remittances are motivated by implicit family agreement. This study lends support to 279 mixed motivation fusing altruism and implicit family arrangements. 280
Also, some studies focuses only on internal or international remittance while others analyze both in the 281 same study. Our study analyzes the determinants of internal and international remittances using cross 282 section data and uses methodology that takes into account for reverse causation and selection in the 283 receipt of remittances. The study will also control for original household characteristics. 284 285 3.0 METHODOLOGY 286 Data on remittances are only available for remitters. This raises the possibility of bias in the data used to 287 estimate remittance equation. The potential for bias arises because remitters may be systematically 288 different from the non-remitters. Estimation of remittances that is restricted to the remitters may return 289 parameter estimates that are biased and inconsistent [37]. To address the problem of sample selection 290 bias this study uses the sample selection model [42], also known as the type-2 Tobit model [60]. The 291 Heckman model can be estimated using two-step procedure commonly known as Limited Information 292 Maximum Likelihood (LIML) method or using a one step Maximum Likelihood (MLE)/Full Information 293 Maximum Likelihood (FIML) approach. FIML is based on stronger distribution assumptions and its 294 estimates are less robust than those of Heckman two-step procedure [61]. Therefore, two-step procedure 295 is applied. Following Hoffmann and Kassouf [62], the first stage of Heckman’s procedure is given by 296 equation (1). 297 298
ii XD '*(1) 299
')|1Pr( ih XXD (2) 300
where, *
iD is the latent (non-observable) discrete migrant decision of whether to or not remit, D is the 301
observable discrete migrant decision of whether to or not remit so that 1iD if 0* iD and 0iD if 302
0* iD ; is a vector of parameters to be estimated,'
iX is a vector of exogenous explanatory variables 303
and i is the error term. Equation (1) is estimated using binary probit estimator as defined by equation 304
7
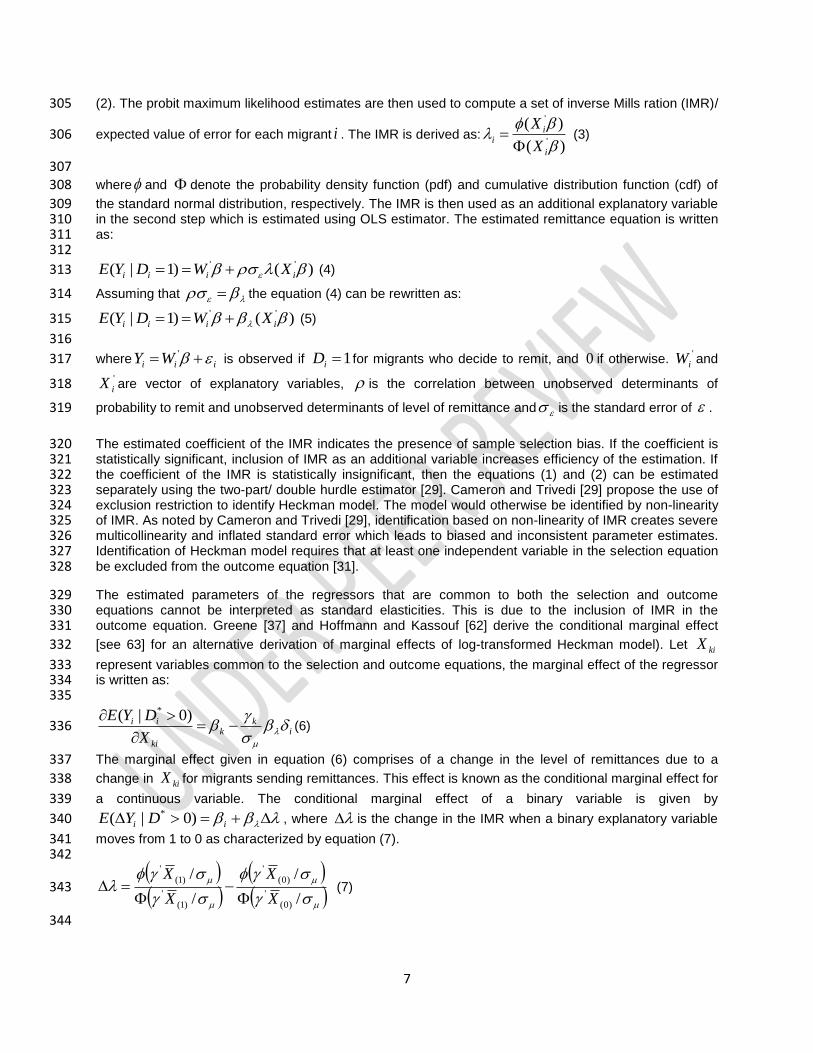
(2). The probit maximum likelihood estimates are then used to compute a set of inverse Mills ration (IMR)/ 305
expected value of error for each migrant i . The IMR is derived as:)(
)('
'
i
ii
X
X
(3) 306
307 where and denote the probability density function (pdf) and cumulative distribution function (cdf) of 308
the standard normal distribution, respectively. The IMR is then used as an additional explanatory variable 309 in the second step which is estimated using OLS estimator. The estimated remittance equation is written 310 as: 311 312
)()1|( '' iiii XWDYE (4) 313
Assuming that the equation (4) can be rewritten as: 314
)()1|( '' iiii XWDYE (5) 315
316
where iii WY ' is observed if 1iD for migrants who decide to remit, and 0 if otherwise.
'
iW and317 '
iX are vector of explanatory variables, is the correlation between unobserved determinants of 318
probability to remit and unobserved determinants of level of remittance and is the standard error of . 319
The estimated coefficient of the IMR indicates the presence of sample selection bias. If the coefficient is 320 statistically significant, inclusion of IMR as an additional variable increases efficiency of the estimation. If 321 the coefficient of the IMR is statistically insignificant, then the equations (1) and (2) can be estimated 322 separately using the two-part/ double hurdle estimator [29]. Cameron and Trivedi [29] propose the use of 323 exclusion restriction to identify Heckman model. The model would otherwise be identified by non-linearity 324 of IMR. As noted by Cameron and Trivedi [29], identification based on non-linearity of IMR creates severe 325 multicollinearity and inflated standard error which leads to biased and inconsistent parameter estimates. 326 Identification of Heckman model requires that at least one independent variable in the selection equation 327 be excluded from the outcome equation [31]. 328
The estimated parameters of the regressors that are common to both the selection and outcome 329 equations cannot be interpreted as standard elasticities. This is due to the inclusion of IMR in the 330 outcome equation. Greene [37] and Hoffmann and Kassouf [62] derive the conditional marginal effect 331
[see 63] for an alternative derivation of marginal effects of log-transformed Heckman model). Let kiX332
represent variables common to the selection and outcome equations, the marginal effect of the regressor 333 is written as: 334 335
ik
k
ki
ii
X
DYE
)0|( *
(6) 336
The marginal effect given in equation (6) comprises of a change in the level of remittances due to a 337
change in kiX for migrants sending remittances. This effect is known as the conditional marginal effect for 338
a continuous variable. The conditional marginal effect of a binary variable is given by339
ii DYE )0|( *, where is the change in the IMR when a binary explanatory variable 340
moves from 1 to 0 as characterized by equation (7). 341 342
/
/
/
/
)0(
'
)0(
'
)1(
'
)1(
'
X
X
X
X
(7) 343
344

8
iY is the natural logarithm of remittances and therefore, the conditional marginal effect given by equation 345
(6) and (7) corresponds to a relative change in levels of remittances. The estimated percentage level of 346
remittance due to a unit increase in kiX is 100]1)[exp( c , where c denotes the estimated value of the 347
conditional marginal effect. 348 349 Following Hoffmann and Kassouf [62], the unconditional relative marginal effect of continuous variables 350 common to both selection and outcome equation on the expected level of remittances is given by: 351
kii
ik
ki
ki
XXgE
X
'1
'
)(ln (8) 352
The first two terms on the right hand side )( Ie of equation (8) shows the effect associated with a change 353
in remittances for remitters and the last term )( IIe is the impact associated with the change in the 354
probability to remit. The percentage change in the level of remittances due to an increase in kiX is355
100)][exp( III ee . The unconditional marginal effect for a binary variable is given by: 356
357
)(ln)0|(ln)(ln *
ihi DgEgE (9) 358
where, the first term on the right hand side )( Ie and the second term )( IIe of equation (9) are defined 359
above. 360
The appropriateness of Heckman model over alternative two-part model can also be tested using the 361 procedure suggested by Puhani [64]. This method entails assessing the degree of collinearity of 362 Heckman’s lambda (IMR) with explanatory variables in the Heckman model using mean variance inflation 363 factor (VIF). A sufficient condition for the presence of collinearity for given explanatory variable is a high 364 VIF. Puhani [64] suggest that a value of 20 defines a high VIF. 365
It is important to note that household expenditure that proxy household income in this study is potentially 366 endogenous. Endogeneity may arise from reverse causality and due to the fact that remittances may 367 influence household income by affecting labour supply of the household members left behind. Following 368 Gubert [40] and Bouoiyour and Miftah [44], we use the predicted value of per-capita household 369 expenditure as an indicator of household income. The per-capita household expenditure is regressed on 370 a set of covariates which measures household’s human and physical capital: age, gender, household 371 head level of education and employment status, share of household members with formal education and 372 household ownership of land (See Table 2 in Appendix). Subsequently, the OLS estimates are used to 373 compute predicted/fitted values of household income. 374 375 3.1VARIABLE MEASUREMENT AND DESCRIPTIVE STATISTICS 376 The dependent variable (remittance sent) applied in the analysis is measured in two ways: as a binary 377 variable taking the value of 1 if a migrant remitted in the last one year and 0, if otherwise and secondly, 378 logarithm of amount remitted in Kenya shillings (Ksh). The explanatory variables included depend on the 379 variables identified in the literature and also dataset limitation. The variables include migrant’s age and 380 education prior to migration, current employment status, migrant’s gender and marital status, migration 381 destination and duration of migration. Explanatory variables relating to household in the migrant’s place of 382 origin included age and gender as well as employment status of household head, household location, 383 household income, household size and number of migrants from the household. Household demographic 384 variables included in the regression are household size and share of children in the household (that is 385 individuals less than 15 years). 386 387 Table 1 provides the summary statistics for key variables included in the analysis. The first, second and 388 third column reports the summary statistics for non-remitters, remitters and for the entire sample, 389 respectively. The last column outlines t-test for mean differences between remitters and non-remitters 390

9
Table 1 Descriptive Statistics for all Migrants, Non-remitters and Remitters 391 Variable Non-remitters
[N=1073] Mean s.d.
Remitters [N=1034] Mean s.d.
All migrants [N=2107] Mean s.d.
Difference in means
Amount remitted (Kshs ‘000’) 140.1 (920.7)
68.7 (648.6)
Age of migrant in years 30.503 (10.185)
34.703 (9.701)
32.564 (10.167)
-4.200***
Migrant has primary education 0.453 (0.498)
0.486 (0.500)
0.469 (0.499)
-0.123
Migrant has secondary education 0.080 (0.272)
0.094 (0.292)
0.087 (0.282)
-0.014
Migrant has tertiary education 0.406 (0.491)
0.365 (0.482)
0.386 (0.487)
0.042
Gender of the migrant 0.535 (0.499)
0.648 (0.478)
0.590 (0.492)
-0.113***
Marital status of migrant 0.413 (0.493)
0.643 (0.479)
0.5206 (0.499)
-0.230***
Migrant’s length of stay at the migration destination in years
5.986 (7.240)
6.414 (6.153)
6.196 (6.730)
-0.428
Migration destination 0.585 (0.493)
0.462 (0.499)
0.525 (0.499)
0.123***
Migrant’s employment status 0.468 (0.499)
0.922 (0.269)
0.691 (0.462)
-0.454***
Household size 4.154 (2.335)
4.375 (2.236)
4.237 (2.262)
-0.289**
Per capita household expenditure (Kshs ‘000’)
25.595 (81.066)
12.389 (28.111)
19.114 (61.452)
13.206* **
Location of household 0.467 (0.499)
0.587 (0.493)
0.526 (0.499)
-0.120***
Age of Household head in years 53.488 (17.705)
52.334 (18.966)
52.922 (18.340)
1.155
Gender of the Household head 0.295 (0.456)
0.424 (0.494)
0.358 (0.480)
-0.128***
Employment status of household head 0.815 (0.388)
0.789 (0.408)
0.803 (0.398)
-0.0256
Proportion of children <15 years in the household
21.804 (24.767)
26.787 (25.898)
24.249 (25.445)
-4.983***
Household has multiple migrants 0.736 (0.441)
0.557 (0.497)
0.648 (0.478)
0.179***
Source: Author’s computation. Note: ***, ** and * show significance difference at 1%, 5% and 10% 392 respectively. Standard deviations are in parenthesis. 393
A lower proportion (46.2%) of internal migrants remitted compared to international migrants (53.8%). 394 More remitters (92.2%) were employed than non-remitters (46.8%). Being employed increases migrant’s 395 incomes and hence their capacity to remit compared to unemployed migrants. The mean per capita 396 household expenditure for households receiving remittance was lower (12389) than for households 397 without remittance (25589). More migrants from rural areas (58.7%) remitted compared to migrants from 398 urban areas (41.3%). This suggests that migrants originating from rural areas could be more altruistic 399 than their counterparts from urban areas. It may also be the case that rural households are more 400 dependent on remittance income relative to urban households thus compelling migrants to remit more. A 401 lower proportion of non-remitters (29.5%) originated from women-headed households compared to men-402 headed households (70.5%). This result probably suggests that a migrant is more likely to remit to a 403 women-headed household than to a men-headed household. 404 405 3.2 DATA 406

10
The data used in this paper is drawn from the 2009 Migration and Remittances Household Survey for 407 Kenya. The survey is single-round, cross-sectional survey and gathers information concerning 408 households with domestic, external and without migrants. It was administered as part of the African 409 Migration Project to enhance understanding of migration, remittances and their impacts in Sub-Saharan 410 Africa. The African Migration Project applied a similar methodology developed by World Bank for all the 411 six countries studied (Kenya, Uganda, Nigeria, Senegal, Burkina Faso and South Africa). The Kenya 412 Household Survey was conducted by University of Nairobi. The household survey was based on two-413 stage sampling procedure drawn by the Kenya National Bureau of Statistics (KNBS). It adopted the 1999 414 Kenya Housing and Population Census to map out survey areas. To address population growth, 415 migration and changes in administrative units (such as boundary changes and new districts) that had 416 arisen since the 1999 population census, the 2005 Kenya Integrated Household Budget Survey, the 2006 417 Financial Services Deepening Survey, and existence of remittance service providers (for example M-418 PESA, Western Union and Money Gram) were also considered in blueprinting the sampling framework. 419 Officials from KNBS, village elders and administrative officers assisted in mapping out sampling clusters 420 with higher numbers of external migrants. 421
In total, 17 districts comprising 91 clusters were selected. In clusters having a high concentration of 422 migrants, there were insufficient households with migrants for the sample to be drawn randomly. The 423 selection of households to be interviewed entailed relisting households in each cluster to determine 424 internal, external and non-migrant households. Each of the three groups of households was considered 425 as an independent sub-frame and random sampling was consequently employed to select households 426 within each group. In total, 1,942 households in 17 districts spanning the eight regions of Kenya were 427 surveyed. Of the surveyed households, 51% were drawn from rural areas while 49% were based in urban 428 areas. Majority of the surveyed households had external migrants (37%), followed by internal (29%) while 429 34% had no migrants. Further, the data was gathered for 8,343 non-migrant and 2,245 migrants. 430
3.3 RESULTS 431 The first step of Heckman two-step approach is the selection equation, which estimates the drivers of 432 remittances, and the second step is the outcome model, which estimates the level of remittances. It is 433 worth noting that the inclusion of predicted values of household expenditure in the remittance equation 434 may cause bias in the standard error. Therefore, the parameter estimates are computed using 435 bootstrapped standard errors (5o replications). The parameter estimates of Heckman’s lambda/IMR for 436 the three remittance equations are positive and statistically significant. This indicates that there is sample 437 selection bias whose impact is addressed by inclusion of IMR. The VIF of IMR in the level/outcome 438 equation is well below threshold of 20 suggested by Puhani [64]. This means there is no severe 439 collinearity between IMR and regressors. As indicated earlier, the parameter estimates of the two-step 440 sample selection model cannot be interpreted as marginal effects. Therefore, we compute the marginal 441 effects of the selection equation, conditional and unconditional marginal effects to explore the impact of 442 covariates on the probability to remit (extensive margin)and amounts of remittances sent (extensive 443 margin), for all the models. 444 445 Empirical results for the determinants of remittances in general (regardless of the origin) are presented in 446 Table 2. The results show that most variables are significant and with expected sign. For instance, each 447 additional year of migrant’s age increases the probability to remit by 1.9 percentage points. Further, an 448 additional year of migrant’s age increases unconditional level of remittance by 108.0
1 percent. 449
Table 2 Heckman Regression Results of the Determinants of Remittances 450 Explanatory variables Selection
coefficient Level coefficient
Probability Cond. level
Uncond. level
Migrant age in years 0.0483** (0.0220)
0.1056** (0.0425)
0.0192*** (0.0088)
0.0587 (0.0436)
0.2164*** (0.0809)
Age squared -0.0005* (0.0003)
-0.0011** (0.0005)
-0.0002* (0.0001)
-0.0006 (0.0005)
-0.0023** (0.0010)
Migrant gender 0.0268 0.1999 0.0106 0.1738* 0.1854
1 )100*)]0587.00192.0([exp(

11
(0.0734) (0.1193) (0.0306) (0.1220) (0.2858) Marital status 0.2346***
(0.0787) 0.0932***
(0.0313) -0.2279*** (0.0759)
0.8127*** (0.2853)
Migrant has primary education -0.0090 (0.1112)
0.1159 (0.1735)
-0.0036 (0.0442)
0.1246 (0.1666)
0.0224 (0.4244)
Migrant has secondary education 0.2732** (0.1236)
0.3941* (0.2012)
0.1086** (0.0489)
0.1345 (0.1708)
1.1400** (0.4909)
Migrant has tertiary education 0.1595 (0.1117)
0.5906*** (0.1794)
0.0634 (0.0444)
0.4367*** (0.1557)
0.8360* (0.4432)
Duration of migration in years 0.0117 (0.0119)
0.0536*** (0.0201)
0.0047 (0.0047)
0.0422** (0.0200)
0.0656 (0.0449)
Duration of migration squared -0.0007* (0.0004)
-0.0014** (0.0007)
-0.0003 (0.0002)
-0.0007 (0.0006)
-0.0029 (0.0015)
Employment status of migrants 1.1653*** (0.1068)
1.2394** (0.4824)
0.4631*** (0.0418)
0.1074 (0.4657)
4.6127*** (0.4220)
Household head age in years -0.0019 (0.0019)
-0.0088*** (0.0030)
-0.0008 (0.0007)
-0.0069** (0.0028)
-0.0107* (0.0072)
Household head gender 0.2444*** (0.0773)
0.2214 (0.1483)
0.0956*** (0.0294)
-0.0133 (0.1440)
0.9505*** (0.2858)
Employment status of household head
-0.2441*** (0.0915)
-0.2596 (0.1687)
-0.0975*** (0.0318)
-0.0225 (0.1795)
-0.9662*** (0.3513)
Number of household members 0.0072 (0.0156)
0.0143 (0.0224)
0.0029 (0.0062)
0.0072 (0.0203)
0.0317 (0.0594)
Household income -0.2410*** (0.0550)
0.2310* (0.1408)
-0.0958*** (0.0218)
0.4651*** (0.1447)
-0.7272*** (0.2176)
Proportion of children <15 years living in household
0.0010 (0.0016)
0.0020 (0.0028)
0.0004 (0.0007)
0.0011 (0.0026)
0.0043 (0.0063)
Location of household 0.1681** (0.0663)
-0.2451** (0.1102)
0.0667 (0.0263)
-0.4085*** (0.1190)
0.4684* (0.2532)
International migrant
0.3748*** (0.0665)
1.7113*** (0.1772)
0.1490*** (0.0265)
1.3472*** (0.1747)
2.0941*** (0.2733)
Household has multiple migrants -0.3826*** (0.0659)
-0.6316*** (0.1852)
-0.1516*** (0.0258)
-0.2671 (0.1774)
-1.6312*** (0.2490)
Constant -1.5604** (0.6822)
0.2519 (1.8113)
Mills lambda 1.4825** (0.6244)
Rho 0.8264
Sigma 1.7940
Number of observations 2108 Censored observations 1074 Uncensored observations 1034 Wald chi2(20) 574
(0.0000)
Source: Author’s computation. Note: ***, ** and * show significance at 1%, 5% and 10% respectively. 451 Bootstrapped Standard errors are in parenthesis. 452
Men remit more at the extensive margin (level of remittance) than women. Specifically, being male 453 increases the conditional level of remittances by 19.0
2 percent. Highly educated migrants remit more than 454
illiterate migrants. Secondary education is positively related to the probability to remit and unconditional 455 level of remittance. Similarly, having tertiary level of education increases the conditional and unconditional 456 level of remittances. Employment has a positive effect on the conditional and unconditional level of 457
2 )100*])1)1738.0([exp(

12
remittances. Other significant determinants of remittances include duration of migration, household head 458 age and gender, household income and location and number of migrants. Migrants living outside Kenya 459 have 14.9 percentage points higher probability to remit than domestic migrants. Being an external migrant 460 has a positive and significant effect on the conditional and unconditional level of remittance. Similar result 461 is reported by Nwosu et al. [65]. This result underscores the importance of analyzing the determinants of 462 external and internal remittances separately as opposed to unrestricted sample. 463 464 465 Empirical results for the determinants of external remittances are reported in Table 3. The results indicate 466 that each year of migrant’s age increases the probability to remit by 1.7 percentage points and the 467 unconditional remittance by 106.0%. This means that older migrants have higher probability to remit and 468 send higher levels of remittances than younger migrants. This is not surprising since older migrants are 469 likely to earn more due to their higher work experience and thus remit more. The coefficient on the 470 quadratic term is negative indicating that the relationship between migrant’s age and remittances is 471 nonlinear 35]. Being a migrant with secondary (tertiary) education increases the probability to send 472 external remittance by 25.2 (15.5) percentage points relative to being an illiterate migrant. Secondary and 473 tertiary education is positively associated with unconditional external remittances. This result suggests 474 that highly educated migrants remit more to reimburse education loan advanced by the family and it is 475 consistent with contractual agreement [23]. 476
Migrant’s duration of stay at the host country is a significant predictor of level of external remittance sent. 477 All else equal, an additional year of migrant’s stay in foreign country increases the conditional level of 478 remittance by 6.0%. This effect appears to diminish with time as stipulated by the negative coefficient on 479 the squared term. This result implies that the level of external remittance do not follow inverted U-shaped 480 profile. Hence, our result is inconsistent with remittance decay hypothesis. As opposed to being 481 unemployed, employment increases the probability to remit from abroad by 47.3%. Employment has a 482 positive and significant effect on the unconditional external remittance. This implies that employed 483 migrants have a higher capacity to remit. This finding aligns with altruistic hypothesis [44]. 484
A large household in migrant’s place of origin is positively and significantly associated with probability to 485 remit. An additional household member increases the probability to send external remittance by 1.5 486 percentage points. The result suggests that external remittances are responsive to high dependencies in 487 the household and is compatible with altruistic hypothesis (Lucas and Stark, 1985). A unit increase 488 household income reduced the probability to send external remittance by 11.8 percentage points. One 489 unit increase in household income increases the conditional remittances by 106.1% and reduces the 490 unconditional level of external remittance by 183.2%. The negative relationship between household 491 income and remittances may indicate that remittances are motivated by altruism. The positive effect on 492 conditional level of remittances may suggest that remittances are motivated by self-interest [18]. 493
Compared to urban households, rural households receive lower amounts of external remittances. 494 Specifically, being a migrant from rural area reduces the conditional level of external remittances by 495 36.5%. The result may suggest that rural households participate less in external migration. This could be 496 due to the high costs associated with external migration. Having several migrants from the same 497 household at the area of origin reduces the probability to remit from abroad by 15.2 percentage point. 498 This result suggests that migrants share responsibility of supporting relatives left behinds. However, the 499 finding refutes the bequest motive that postulates that remittance should increase with number of 500 migrants [10, 43]. 501 502 503 Table 3 Heckman Regression Results of the Determinants of International Remittances 504 Explanatory variables Selection
coefficient Level coefficient
Probability Cond. level
Uncond. level
Migrant age in years 0.0432* (0.0267)
0.0844* (0.0512)
0.0171* (0.0105)
0.0410 (0.0448)
0.2067* (0.1134)
Age squared -0.0005 (0.0003)
-0.0009 (0.0007)
-0.0002 (0.0001)
-0.0004 (0.0006)
-0.0024 (0.0014)
13
Migrant gender -0.0137 (0.0943)
0.2533* (0.1500)
-0.0603 (0.0392)
0.2671* (0.1477)
0.0894 (0.3848)
Marital status 0.2882** (0.1142)
0.1140** (0.0451)
-0.2892** (0.1139)
1.0668** (0.4641)
Migrant has primary education 0.1622 (0.2296)
-0.0844 (0.3514)
0.0636 (0.0893)
-0.2444 (0.2719)
0.5415 (0.9620)
Migrant has secondary education 0.6716*** (0.2105)
0.2172 (0.4301)
0.2524*** (0.0732)
-0.4120 (0.3678)
2.4464*** (0.8119)
Migrant has tertiary education 0.3972** (0.2163)
0.2598 (0.3692)
0.1553* (0.0833)
-0.1335 (0.2904)
1.5962* (0.9048)
Duration of migration in years 0.0053 (0.0203)
0.0633* (0.0346)
0.0021 (0.0080)
0.0580* (0.0267)
0.0545 (0.0885)
Duration of migration squared -0.0001 (0.0007)
-0.0014 (0.0014)
-0.0000 (0.0003)
-0.0013 (0.0009)
-0.0011 (0.0032)
Employment status of migrants 1.1965*** (0.1094)
1.3021 (0.6813)
0.4731*** (0.0434)
0.1017 (0.6737)
5.1485*** (0.5042)
Household head age in years -0.0038 (0.0028)
-0.0014 (0.0045)
-0.0015 (0.0011)
0.0024 (0.0040)
-0.0148 (0.0120)
Household head gender 0.1531 (0.1000)
0.2542 (0.1842)
0.0603 (0.0392)
0.1022 (0.1880)
0.7072 (0.4150)
Employment status of household head
-0.1169 (0.1229)
-0.0291 (0.2214)
-0.0466 (0.0575)
0.1045 (0.1719)
-0.4486 (0.5283)
Number of household members 0.0368 (0.0258)
0.0268 (0.0429)
0.0146* (0.0102)
-0.0101 (0.0300)
0.1511 (0.1134)
Household income -0.2983*** (0.0819)
0.4241* (0.2777)
-0.1179*** (0.0324)
0.7234*** (0.2187)
-0.8694** (0.3512)
Proportion of children <15 years living in household
0.0002 (0.0030)
0.0070* (0.0040)
0.0001 (0.0012)
0.0068* (0.0038)
0.0045 (0.122)
Location of household 0.0578 (0.1081)
-0.3959** (0.1858)
0.0229 (0.0427)
-0.4539** (0.1911)
-0.0054 (0.4406)
Household has multiple migrants -0.4071*** (0.0987)
-0.7350*** (0.2360)
-0.1591*** (0.0376)
-0.3325 (0.2325)
-1.9057*** (0.4080)
Constant -0.5475 (0.9613)
1.7840 (2.2050)
Mills lambda 1.6541** (0.8340)
Rho 0.8941
Sigma 1.8500
Number of observations 1001 Censored observations 445 Uncensored observations 556 Wald chi2(20) 78.09
(0.0000)
Source: Author’s computation. Note: ***, ** and * show significance at 1%, 5% and 10% respectively. 505 Bootstrapped Standard errors are in parenthesis. 506
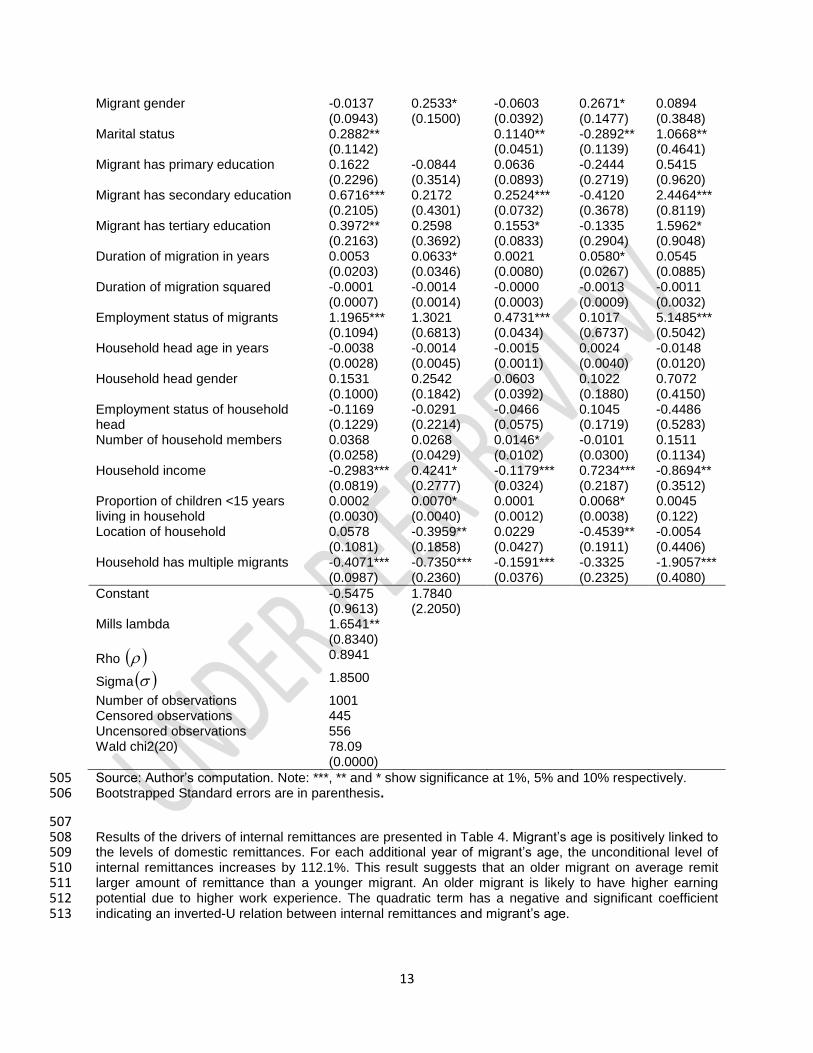
507 Results of the drivers of internal remittances are presented in Table 4. Migrant’s age is positively linked to 508 the levels of domestic remittances. For each additional year of migrant’s age, the unconditional level of 509 internal remittances increases by 112.1%. This result suggests that an older migrant on average remit 510 larger amount of remittance than a younger migrant. An older migrant is likely to have higher earning 511 potential due to higher work experience. The quadratic term has a negative and significant coefficient 512 indicating an inverted-U relation between internal remittances and migrant’s age. 513

14
A migrant having secondary education increases the conditional internal remittances by 94.8% while 514 having tertiary education increases the conditional domestic remittances by 210.8%, all else equal. This 515 suggests that a highly educated migrant send higher amounts of domestic remittances than a migrant 516 without formal education. Similar result is achieved by Lucas and Stark [17] as well as Bollard et al. [65]. 517 The marginal effects of migrant’s duration of stay at the destination suggest a statistically significance 518 increase in the probability to remit (1.5 percentage points) and unconditional (101.4%) remittance levels. 519 The relationship between migration duration and remittances is non-linear and consistent with remittance 520 decay hypothesis. 521
Being employed significantly increases the probability to remit by 45.9 percentage points compared to 522 being unemployed. The results also suggest that employment increases the unconditional level of internal 523 remittance in a statistically significant manner. This suggests that employment is an important 524 determinant of internal remittances. Our result is consistent with altruistic motivation [28]. Conforming to 525 results from Bouoiyour and Miftah [44], the marginal effects of household income indicates that household 526 income is negatively correlated with probability to remit and amount of remittances sent. On average, a 527 unit increase in household income reduces the probability to remit by 7.0% and the unconditional 528 domestic remittances by 83.2%. This result means that internal migrants remit more to lower income 529 households relative to their higher income counterparts. This suggests that domestic remittances are 530 motivated by altruism [17]. 531
An internal migrant has 10.6 percentage point higher probability to remit to a rural household relative to 532 an urban household. The marginal effects of conditional and unconditional level of domestic remittance 533 show that being a migrant from rural household decreases the conditional remittances by 33.3% and 534 increase unconditional level of domestic remittances by 74.1%. This result implies that rural households 535 may be more dependent on domestic remittances than urban households. The result reflects scarcity of 536 income generating activities in rural areas than in urban neighbourhoods. 537 538 539 540 Table 4 Heckman Regression Results of the Determinants of Internal Remittances 541 Explanatory variables Selection
coefficient Level coefficient
Probability Cond. level
Uncond. level
Migrant age in years 0.0487 (0.0337)
0.1613** (0.0686)
0.0186 (0.0129)
0.0953 (0.0713)
0.2032* (0.1093)
Age squared -0.0004 (0.0004)
-0.0015* (0.0008)
-0.0002 (0.0002)
-0.0009 (0.0008)
-0.0019 (0.0014)
Migrant gender 0.1000 (0.0944)
0.1727 (0.1852)
0.1423*** (0.0409)
0.0369 (0.1983)
0.3549 (0.3027)
Marital status 0.1766* (0.0932)
0.0673** (0.0356)
-0.2392* (0.1263)
0.5138** (0.2567)
Migrant has primary education -0.1287 (0.1587)
0.3465 (0.2863)
-0.0487 (0.0594)
0.5217 (0.3249)
-0.2470 (0.4994)
Migrant has secondary education -0.0488 (0.1675)
0.6003*** (0.3301)
-0.0185 (0.0633)
0.6667* (0.3425)
0.0817 (0.5565)
Migrant has tertiary education -0.0013 (0.1687)
1.1323*** (0.3082)
-0.0005 (0.0643)
1.1341*** (0.3146)
0.4276 (0.5747)
Duration of migration in years 0.0389** (0.0178)
0.0520 (0.0416)
0.0148** (0.0068)
-0.0008 (0.0019)
-0.0064*** (0.0021)
Duration of migration squared -0.0019*** (0.0006)
-0.0018 (0.0018)
-0.0007*** (0.0002)
0.0008 (0.0019)
-0.0064*** (0.0021)
Employment status of migrants 1.2048*** (0.1535)
1.8286* (1.0473)
0.4592*** (0.0550)
0.1965 (1.0283)
4.2023*** (0.5277)
Household head age in years -0.0003 (0.0033)
-0.0210*** (0.0055)
-0.0001 (0.0012)
-0.0205*** (0.0055)
-0.0090 (0.0105)
Household head gender 0.3706*** (0.1061)
0.2820 (0.3140)
0.1423*** (0.0409)
-0.2135 (0.3271)
1.1903*** (0.3554)

15
Employment status of household head
-0.3901*** (0.1254)
-0.7551** (0.3499)
-0.1487*** (0.0480)
-0.2267 (0.3544)
-1.4229*** (0.4380)
Number of household members -0.0180 (0.0224)
-0.0036 (0.0427)
-0.0069 (0.0085)
0.0208 (0.0457)
-0.0538 (0.0704)
Household income -0.1840 (0.0976)
-0.3627 (0.2355)
-0.0701* (0.0373)
-0.1134 (0.2380)
-0.6736*** (0.3218)
Proportion of children <15 years living in household
0.0005 (0.0027)
-0.0069 (0.0049)
0.0002 (0.0011)
-0.0076* (0.0047)
-0.0011 (0.0090)
Location of household 0.2796*** (0.0945)
-0.0249 (0.2101)
0.1056*** (0.0373)
-0.4053* (0.2118)
0.8005** (0.3232)
Household has multiple migrants -0.3855*** (0.0945)
-0.5554** (0.2730)
-0.1492*** (0.0368)
-0.0449 (0.2982)
-1.3615*** (0.3273)
Constant -1.5668 (1.0326)
5.3539* (3.2354)
Mills lambda 1.9428* (1.1782)
Rho 0.9782
Sigma 1.9862
Number of observations 1107 Censored observations 629 Uncensored observations 478 Wald chi2(20) 125.68
(0.0000)
Source: Author’s computation. Note: ***, ** and * show significance at 1%, 5% and 10% respectively. 542 Bootstrapped Standard errors are in parenthesis. 543
544
545 4.0 CONCLUSIONS 546 This paper empirically analyzed the determinants of internal and external remittances at the individual 547 level using single round cross-sectional dataset from the 2009 World Bank Household Survey for African 548 Migration Project for Kenya. Empirical analysis returns several key findings. The results indicates that no 549 single theory sufficiently explain remittance behaviour in Kenya. The study finds that external migrants 550 remit more at the extensive and intensive margin than internal migrants. Migrants with higher levels of 551 education prior migration remit more than migrants without formal education supporting the hypothesis 552 that remittances are driven by inter-temporal contractual agreement between household and the migrant. 553 Employed migrants have a higher probability to remit and send higher amounts of external and internal 554 remittances than unemployed migrants. The positive relationship between migrant’s employment and 555 remittances suggests that external and internal remittances are driven by altruistic reasons. The results 556 on the influence of household characteristic on migrant’s remittance behaviour reinforce the hypothesis 557 that external and internal remittances are dictated by altruistic motive. Among the sub-sample of 558 remitters, external migrants from higher income households are found to send higher amounts of 559 remittances. This result seems to support theory of self-interest. 560
From policy perspective, the Kenyan government ought to pursue policies that promote external migration 561 and favour migration of skilled individuals. Policies that improve migrant’s success in domestic and 562 foreign labour markets are also required. The government also needs to put policies in place to 563 encourage internal and external remittances. The government should endeavour to reduce remittance 564 transaction costs mainly by stimulating competition in the remittance transfer market. This is achievable 565 through encouraging microfinance institutions to participate in the remittance market; creating a more 566 effective financial framework for remittances; fostering the disclosure of remittance fees charged by 567 money transfer service providers; improve ability of migrants to compare fees charged by different 568 remittance transfer service providers and promoting adoption of modern and better technologies in money 569 transfer market. To encourage external remittances, the government should facilitate reduction and 570
16
abolition of illegal fees charged by migrant recruitment agencies on external migrants. This can be 571 attained by regulating and monitoring migrant recruitment agents. 572 573 574 575 COMPETING INTERESTS 576 Author has declared that no competing interests exist. 577 578 REFERENCES 579
1. Republic of Kenya. Diaspora Remittances, https://www.centralbank.go.ke/diaspora-580 remittances/; 2019. 581
2. International Organization for Migration. Send Money and Invest in Kenya: A Guide for 582 Diaspora Remittances and Investments. Brussels, Belgium, 2017 583
3. Ocharo KN. Remittances and Economic Growth in Kenya (1970-2010). Merit Research 584 Journal of Accounting, Auditing, Economics and Finance, 2015; 3(1):1-16. 585
4. World Bank. Migration and Remittances Factbook 2016, Third Edition, Washington D.C, 2016. 586 5. Republic of Kenya. Kenya Vision 2030: A Globally Competitive and Prosperous Kenya, 587
Nairobi, Government Printers; 2008 588 6. Aboulezz N. Remittances and Economic Growth Nexus: Empirical Evidence from Kenya. 589
International Journal of Academic Research in Business and Social Sciences, 2015; 590 5(12):285-296. 591
7. Kosgei KD, Tenai J, Kitur EK. The Impact of Workers’ Remittances on Economic Growth: 592 Evidence from Kenya. International Journal of Management and Economics Invention, 2016; 593 2(4):591-600. 594
8. Kagochi JM, Kiambigi M. Remittances’ Influence on Housing Construction Demand in Sub-595 Saharan Africa: The Case of Kenya. African Development Review, 2012; 24(3):255-265. 596
9. Johnston G, Whitelaw W. Urban-Rural Income Transfers in Kenya: an Estimated Remittances 597 Function. Economic Development and Cultural Change, 1974; 22(3):473-479. 598
10. Hoddinott J. A Model of Migration and Remittances Applied to Western Kenya. Oxford 599 Economic Papers, 1994; 46(3):459-476. 600
11. 11. Kiiru JM. Remittances and Poverty in Kenya. OIDA International Journal of Sustainable 601 Development, 2010; 1(8):33-41. 602
12. Bang JT, Mitra, A, Wunnava, PV. Do Remittances Improve Income Inequality? An 603 Instrumental Variable Quantile Analysis of the Kenyan Case. Economic Modelling, 2016; 604 58:394-402. 605
13. Jena F. Migrant Remittances and Physical Investment Purchases: Evidence from Kenyan 606 Households. The Journal of Development Studies, 2018; 54(2):312-326. 607
14. Odipo G, Olungah CO, Omia DO. Emigration and Remittances Utilization in Kenya. Journal 608 of Research on Humanities and Social Sciences, 2015; 5(14):163-172. 609
15. Knowles JC, Anker R. An Analysis of Income Transfers in a Developing Country: the Case of 610 Kenya. Journal of Development Economics, 1981; 8:205-226. 611
16. Hoddinott J. Modelling Remittance Flows in Kenya. Journal of African Economies, 1992; 612 1(2):206-232. 613
17. Lucas R, Stark O. Motivations to Remit: Evidence from Botswana. Journal of Political 614 Economy, 1985; 93(5):901-918. 615
18. Rapoport H, Docquier F. The Economics of Migrants’ Remittances.IZA Discussion Paper 616 Series, 2005, 01531. 617
19. Hagen-Zanker J, Siegel M. The Determinants of Remittances: A Review of the 618 Literature.Maastricht Graduate School of Governance, Working Paper, No. 3, 2007. 619
20. Cox D. Motives for Private Income Transfer. Journal of Political Economy, 1987; 95(3):508-620 546. 621
21. Stark O. The Migration of Labor. Cambridge, MA: Harvard University Press. 1991. 622 22. Taylor JE. The New Economics of Labour Migration and the Role of Remittances in the 623
Migration Process. International Migration, 1999; 37(1):63-88. 624

17
23. Poirine B. A Theory of Remittances as an Implicit Family Loan Arrangement. World 625 Development, 1997; 25(4):589-612. 626
24. Ilahi N, Jafarey S. Guest Worker Migration, Remittances and the Extended Family: Evidence 627 from Pakistan. Journal of Development Economics, 1999; 58(2):485-512. 628
25. Brown, RPC, Fransen, S, Carling J, Siegel. Measuring Remittances Through Surveys: 629 Methodological and Conceptual Issues for Survey Designers and Data Analysts. 630 Demographic Research, 2014; 31(41):1243-1274. 631
26. Glytsos NP. Remitting Behaviour of Temporary and Permanent Migrants: The Case of Greeks 632 in Germany and Australia. Labour, 1997; 11(3):409-435. 633
27. Naiditch C, Vranceanu R. Migrant Wages, Remittances and Recipient Labour Supply in a 634 Moral Hazard Model. Economic Systems, 2009; 33(1):60-82. 635
28. Stark O, Lucas, RE. Migration, Remittances and the Family. Economic Development and 636 Cultural Change, 1988; 36(3):465-481. 637
29. Cameron, AC, Trivedi, PK. Microeconometrics: Methods and Applications. Cambridge 638 University Press, New York; 2015 639
30. Niimi Y, Reilly B. Gender Differences in Remittance Behavior: Evidence from Vietnam. Asian 640 Development Bank Working Paper Series No. 135. 2008 641
31. Mahapatro SR. Why Do They Remit? Examining Factors Influencing Migrant Remittances in 642 India. Journal of Development Policy and Practice, 2017; 2(2):225-235. 643
32. Banerjee B. The Probability, Size and Uses of Remittances from Urban to Rural areas in 644 India.Journal of Development Economics, 1984; 16(3):293-311. 645
33. Brown RPC. Do Migrants’ Remittances Decline Over Time? Evidence from Tongans and 646 Western Samoans in Australia. Contemporary Pacific, 1998; 10(1):107-51. 647
34. Cox D, Eser Z,Jimenez E. Motives for Private Transfers over the Life Cycle: An Analytical 648 Framework and Evidence for Peru. Journal of Development Economics, 1998; 55:57-80. 649
35. Amuedo-Dorantes C, Pozo S. Remittances as Insurance: Evidence from Mexican Immigrants. 650 Journal of Population Economics, 2006; 19(2):227-254. 651
36. Tobin J. Estimation of Relationships for Limited Dependent Variables. Econometrica, 1958; 652 26:24-36. 653
37. Greene W H. Econometric Analysis, 5th ed., New Jersey: Person Education. 2003. 654 38. Powell JL. Least Absolute Deviations Estimation for the Censored Regression Model. Journal 655
of Econometrics, 1984; 25(3):303-325. 656 39. de la Briere B, Sadoulet E, de Janvry A, Lambert S. The Roles of Destination, Gender, and 657
Household Composition in Explaining Remittances: An Analysis for the Dominican Sierra. 658 Journal of Development Economic, 2002; 68(2):309-328. 659
40. Gubert F. Do Migrants Insure those who Stay Behind? Evidence from the Kayes Area 660 (Western Mali). Oxford Development Studies, 2002; 30(3):267-287. 661
41. Cragg J. Some Statistical Models for Limited Dependent Variables with Application to the 662 Demand for Durable Goods, Econometrica, 1971;39:829-844. 663
42. Heckman J. Sample Selection Bias as a Specification Error. Econometric: Journal of the 664 Econometric Society, 1979; 47(1):153-161. 665
43. Agarwal R, Horowitz A. Are International Remittances Altruism or Insurance? Evidence from 666 Guyana using Multiple-Migrant Households. World Development, 2002;30(11):2033-2044. 667
44. Bouoiyour J, Miftah A. Why do Migrants Remit? Testing Hypothesis for the Case of Morocco. 668 IZA Journal of Migration, 2015; 4:2. 669
45. Biyase M, Tregenna F. Determinants of Remittances in South Africa. Cape Town: University 670 of Cape Town SALDRU Working Paper No. 176/NIDS Discussion Paper No.3. 2016. 671
46. Phan D, Coxhead I. Rural-Urban Migration and Remittances in Vietnam: Evidence from 672 Migrant Tracer Data. Staff Paper No.581. 2016 673
47. Garip F. An Integrated Analysis of Migration and Remittances: Modeling Migration as a 674 Mechanism for Selection. Population Research and Policy Review, 2012; 31(5):637-663. 675
48. Straubhaar T. The Determinants of Workers’ Remittances: The Case of Turkey. 676 Weltwirtschafliches Archiv, 1986; 122:728-740. 677
49. Aydas OT, Neyapti B, Metin-Ozcan K. Determinants of Workers’ Remittances: The Case of 678 Turkey. Emerging Markets, Finance and Trade, 2005; 41(3):53-69. 679

18
50. Leuth E, Ruiz-Arranz M. A Gravity Model of Workers’ Remittances.IMF Working Paper06/209, 680 2006. 681
51. Alleyne D, Kirton, CD, Figueroa M. Macroeconomic Determinants of Migrant Remittances to 682 Caribbean Countries. Panel Unit Roots and Cointegration, 2008; 41(2):137-153. 683
52. Frankel J. Are Bilateral Remittances Countercyclical? Open Economies Review, 2011; 22(1):1 684 53. Ahmed J, Martinez-Zarzoso IM. Do Transfer Costs Matter for Foreign Remittances? A Gravity 685
Model Approach. Economics, E-Journal. The Open-Access, Open-Assessment E-Journal, 686 2016;10(4):1-36, http://dx.doi.org/10.5018/economics-ejournal.ja.2016-4 687
54. Connell J, Brown RPC. The Remittances of Migrant Tongan and Samoan Nurses from 688 Australia. Human Resource for Health, 2004;2(2). 689
55. Holst E, Schrooten M. Migration and Money. What Determines Remittances? Evidence from 690 Germany. Discussion Paper 566, Berlin, German Institute for Economic Research. 2006 691
56. Borja K. What Drives Remittances to Latin America? A Review of the Literature. International 692 Journal of Business and Social Science, (2012);3(17):33-44. 693
57. Adams Jr RH. Evaluating the Economic Impact of International Remittances on Developing 694 Countries Using Household Surveys: A Literature Review. Journal of Development Studies, 695 2011; 47(6):809-828. 696
58. VanWey LK. Altruistic and Contractual Remittances between Male and Female Migrants and 697 Households in Rural Thailand. Demography, 2004; 41(4):739-756. 698
59. Naufal GS. Why Remit? The Case of Nicaragua. Discussion Paper No. 3276, Bonn, IZA. 2008 699 60. Amemiya T. Advanced Econometrics. Cambridge, MA: Harvard University Press. ;1985 700 61. Wooldridge J. Econometric Analysis of Cross-Section and Panel Data MIT press, Cambridge, 701
England; 2002. 702 62. Hoffmann M, Kassouf AL. Deriving Conditional and Unconditional Marginal Effects in Log 703
Earnings Equations Estimated by Heckman’s Procedure. Applied Economics, 2005; 704 37(11):1303-1311. 705
63. Yen S, Rosinski J. On the Marginal Effects of Variables in the Log-Transformed Sample 706 Selection Models. Economics Letters, 2008; 100(1):4-8. 707
64. Puhani P. The Heckman Correction for Sample Selection and its Critique. Journal of 708 Economic Surveys, 2000; 14(1):53-68. 709
65. Nwosu OE, Fonta MW, Aneke G, Yuni ND. Microeconomic Determinants of Migrant 710 Remittances to Nigerian Households. Economics Bulletin, 2012; 32(4):3425-3438. 711
66. Bollard A, McKenzie D, Morten M, Rapoport H. Remittances and the Brain Drain Revisited: 712 The Microdata Show that More Educated Migrants Remit More, Policy Research Working 713 Paper Series, Mimeo. The World Bank, Washington, D. C.; 2009, 5113. 714
715 716
717
718
719
720