Why do members of congress support agricultural...
15
Why do members of congress support agricultural protection? q Marc F. Bellemare a,⇑ , Nicholas Carnes b a Department of Applied Economics, University of Minnesota, 1994 Buford Avenue, St. Paul, MN 55108, United States b Sanford School of Public Policy, Box 90245, Durham, NC 27708-0245, United States article info Article history: Received 24 October 2013 Received in revised form 3 October 2014 Accepted 4 October 2014 Keywords: Agricultural policy Agricultural protection Farm bill Congress Voting Lobbying abstract It seems paradoxical that until recently, developed countries have continued subsidizing agriculture even though their agricultural sectors had been declining in relative importance since the middle of the 20th century. What drives support for agricultural protection—the broad array of subsidies to farmers and taxes and quotas imposed on agricultural imports—in developed countries? We answer this question by testing three competing hypotheses about what drives support for agricultural protection in the US: (i) legislator preferences, (ii) electoral incentives, or (iii) lobbying. Using data on the roll call votes of the members of the 106th through the 110th Congresses (1999–2009) and the scores given to each legislator by the Farm Bureau, our findings suggest that electoral incentives explain a great deal of the variation in support for agricultural protection, but that legislator preferences and lobbying might play a role, too. Moreover, legislator preferences and electoral incentives appear to be substitutes for one another. Why does Congress support agricultural protection? Because many members have electoral incentives to—and because many of those who do not still have other personal or strategic interests at stake. Ó 2014 Elsevier Ltd. All rights reserved. ‘‘There is some justification at least in the taunt that many of the pretending defenders of ‘free enterprise’ are in fact defend- ers of privileges and advocates of government activity in their favor rather than opponents of all privileges. In principle the industrial protectionism and government-supported cartels and agricultural policies of the conservative groups are not dif- ferent from the proposals for a more far-reaching direction of economic life sponsored by the socialists.’’ [– F.A. Hayek (1949), Individualism and Economic Order.] Introduction Most developed countries subsidize agriculture heavily even though their agricultural sectors have steadily declined in impor- tance relative to their manufacturing and services sectors since the 1950s. In developing countries, by contrast, the agricultural sector often remains much more important than the manufactur- ing and services sectors, but governments tend to tax farmers and subsidize food consumers. Scholars have termed this pattern the ‘‘development paradox’’ (Lindert, 1991; Anderson, 1993; Barrett, 1999; Bellemare et al., 2014). 1 Why should countries be more likely to protect agriculture as their GDP per capita increases (Anderson and Hayami, 1986; World Bank, 1986)? 2 In developing countries, the answer seems to be that urban elites pressure governments to subsidize food consumption, often via the threat of social unrest (Lipton, 1977; Bates, 1981; Bellemare, 2014). 3 In developed countries, however, scholars have struggled to come to a consensus about why agricultural policy is tilted toward agricultural producers. http://dx.doi.org/10.1016/j.foodpol.2014.10.010 0306-9192/Ó 2014 Elsevier Ltd. All rights reserved. q We thank two reviewers for their helpful suggestions. We are also grateful to Laura Paul and Lindsey Novak for excellent research assistance as well as Kym Anderson, Nate Jensen, Mike Munger, Rob Paarlberg, Adam Sheingate, and Jo Swinnen for helpful suggestions. We also thank participants at the 2014 AAEA annual meetings in Minneapolis for useful comments. The data used in this study were collected with generous financial support from the National Science Founda- tion under Grant SES-0921163, ‘‘Doctoral Dissertation Research in Political Science: Social Class and Congressional Decision Making’’ and the Dirksen Congressional Center. ⇑ Corresponding author. E-mail addresses: [email protected] (M.F. Bellemare), nicholas.carnes@duke. edu (N. Carnes). 1 One could argue, however, that developed countries support their agricultural sectors partly because they have become economically less important. From a strategic perspective, for example, it might make sense for a country to support its agricultural sector if the goal is to prevent food shortages during wartime. 2 Although support for agriculture in developed countries remains high, it has declined markedly in recent years; see the recent survey by Anderson et al. (2013) for a discussion. 3 Thomson (2013), however, finds that this is largely due to the fact that developing countries are less democratic than developed ones. His theoretical model and empirical results indicate that while authoritarian regimes who face higher rates of urbanization do behave in line with the developmental paradox, authoritarian regimes who face more organized agricultural producers do not. Rather, they behave like the democratically elected governments of developed countries. Food Policy 50 (2015) 20–34 Contents lists available at ScienceDirect Food Policy journal homepage: www.elsevier.com/locate/foodpol
Transcript of Why do members of congress support agricultural...

Food Policy 50 (2015) 20–34
Contents lists available at ScienceDirect
Food Policy
journal homepage: www.elsevier .com/ locate/ foodpol
Why do members of congress support agricultural protection? q
http://dx.doi.org/10.1016/j.foodpol.2014.10.0100306-9192/� 2014 Elsevier Ltd. All rights reserved.
q We thank two reviewers for their helpful suggestions. We are also grateful toLaura Paul and Lindsey Novak for excellent research assistance as well as KymAnderson, Nate Jensen, Mike Munger, Rob Paarlberg, Adam Sheingate, and JoSwinnen for helpful suggestions. We also thank participants at the 2014 AAEAannual meetings in Minneapolis for useful comments. The data used in this studywere collected with generous financial support from the National Science Founda-tion under Grant SES-0921163, ‘‘Doctoral Dissertation Research in Political Science:Social Class and Congressional Decision Making’’ and the Dirksen CongressionalCenter.⇑ Corresponding author.
E-mail addresses: [email protected] (M.F. Bellemare), [email protected] (N. Carnes).
1 One could argue, however, that developed countries support their agsectors partly because they have become economically less important.strategic perspective, for example, it might make sense for a country to suagricultural sector if the goal is to prevent food shortages during wartime.
2 Although support for agriculture in developed countries remains higdeclined markedly in recent years; see the recent survey by Anderson et al. (a discussion.
3 Thomson (2013), however, finds that this is largely due to the fact that decountries are less democratic than developed ones. His theoretical mempirical results indicate that while authoritarian regimes who face higheurbanization do behave in line with the developmental paradox, authregimes who face more organized agricultural producers do not. Rather, thelike the democratically elected governments of developed countries.
Marc F. Bellemare a,⇑, Nicholas Carnes b
a Department of Applied Economics, University of Minnesota, 1994 Buford Avenue, St. Paul, MN 55108, United Statesb Sanford School of Public Policy, Box 90245, Durham, NC 27708-0245, United States
a r t i c l e i n f o
Article history:Received 24 October 2013Received in revised form 3 October 2014Accepted 4 October 2014
Keywords:Agricultural policyAgricultural protectionFarm billCongressVotingLobbying
a b s t r a c t
It seems paradoxical that until recently, developed countries have continued subsidizing agriculture eventhough their agricultural sectors had been declining in relative importance since the middle of the 20thcentury. What drives support for agricultural protection—the broad array of subsidies to farmers and taxesand quotas imposed on agricultural imports—in developed countries? We answer this question by testingthree competing hypotheses about what drives support for agricultural protection in the US: (i) legislatorpreferences, (ii) electoral incentives, or (iii) lobbying. Using data on the roll call votes of the members ofthe 106th through the 110th Congresses (1999–2009) and the scores given to each legislator by the FarmBureau, our findings suggest that electoral incentives explain a great deal of the variation in support foragricultural protection, but that legislator preferences and lobbying might play a role, too. Moreover,legislator preferences and electoral incentives appear to be substitutes for one another. Why doesCongress support agricultural protection? Because many members have electoral incentives to—andbecause many of those who do not still have other personal or strategic interests at stake.
� 2014 Elsevier Ltd. All rights reserved.
the 1950s. In developing countries, by contrast, the agricultural
‘‘There is some justification at least in the taunt that many ofthe pretending defenders of ‘free enterprise’ are in fact defend-ers of privileges and advocates of government activity in theirfavor rather than opponents of all privileges. In principle theindustrial protectionism and government-supported cartelsand agricultural policies of the conservative groups are not dif-ferent from the proposals for a more far-reaching direction ofeconomic life sponsored by the socialists.’’
[– F.A. Hayek (1949), Individualism and Economic Order.]
Introduction
Most developed countries subsidize agriculture heavily eventhough their agricultural sectors have steadily declined in impor-tance relative to their manufacturing and services sectors since
sector often remains much more important than the manufactur-ing and services sectors, but governments tend to tax farmersand subsidize food consumers. Scholars have termed this patternthe ‘‘development paradox’’ (Lindert, 1991; Anderson, 1993;Barrett, 1999; Bellemare et al., 2014).1
Why should countries be more likely to protect agriculture astheir GDP per capita increases (Anderson and Hayami, 1986;World Bank, 1986)?2 In developing countries, the answer seems tobe that urban elites pressure governments to subsidize foodconsumption, often via the threat of social unrest (Lipton, 1977;Bates, 1981; Bellemare, 2014).3 In developed countries, however,scholars have struggled to come to a consensus about whyagricultural policy is tilted toward agricultural producers.
riculturalFrom a
pport its
h, it has2013) for
velopingodel andr rates oforitariany behave

7 There were 90.7 million taxpayers in the US in 2008 (Internal Revenue Service
M.F. Bellemare, N. Carnes / Food Policy 50 (2015) 20–34 21
Four explanations for agricultural protection—the broad array ofsubsidies to farmers and taxes and quotas imposed on agriculturalimports—have so far been suggested (de Gorter and Swinnen, 2002):
1. Legislator preferences: Lawmakers vote according to theirpersonal policy preferences.4
2. Electoral incentives: Voters prefer agricultural protection, andre-election-oriented policy makers follow their lead (Downs,1957; Coughlin, 1992).
3. Lobbying: Interest groups representing agricultural producerslobby policy makers and contribute to the re-election campaignsof those who support agriculture (Olson, 1971; Becker, 1983).5
4. Institutions: A country’s political institutions encourage agri-cultural protection.
As shown in Table 1, which reviews the literature on what agri-cultural protection, scholars have found evidence to support mostof these explanations: electoral incentives (Swinnen and de Gorter,1993; Swinnen, 1994), lobbying (Vesenka, 1989; Abler, 1991;Hansen, 1991; Brooks et al., 1998; Sheingate, 2003; Alvarez,2005; Gawande and Hoekman, 2006; Bullock and Coggins, 2008),and institutions (Beghin and Kherallah, 1994; Park and Jensen,2007; Thies and Porche, 2007; Assman et al., 2012; Klomp andde Haan, forthcoming) all seem to contribute to policy outcomeson agricultural issues. As Table 1 indicates, however, the research-ers who have studied each of these explanations have typicallyfocused on just one or two of these factors at a time. Moreover,most have focused on aggregate-level measures: although eachhypothesis is premised on micro-level theories about how politi-cians make decisions (e.g., that those who receive more moneyfrom agricultural lobbyists tend to support agricultural causes),scholars have seldom tested these theories with data on how indi-vidual politicians make decisions about agricultural policy.
In this article, we explore how preferences, electoral incentives,and lobbying can influence legislative action on agricultural policyin the United States Congress. We focus on the 106th through110th Congresses (1999–2009), the relatively short period in USagricultural history during which lawmakers passed two ofthe most significant agriculture bills in the last few decades: the2002 Farm Security and Rural Investment (FSRI) Act and the2008 Food, Conservation, and Energy (FCE) Act. These bills are partof a long legislative tradition of subsidizing farmers via theso-called ‘‘farm bill,’’ the ongoing ‘‘legislative package that renewsAmerica’s farm subsidy entitlement system every five years or so’’(Paarlberg, 2011). Using data on how individual members voted onthese farm bills6 and how members were rated by the AmericanFarm Bureau Federation—a leading agricultural advocacy organiza-tion—we simultaneously test the micro-level underpinnings ofseveral explanations for agricultural protection.
Knowing what drives support for agricultural protection isimportant for two reasons. First, in this era of budget austerity, it
4 We treat preferences as distinct from ideology throughout this paper. In practicaterms, this means we account for preferences by controlling for whether respondentshave spent time working in agriculture prior to getting elected to Congress, and weaccount for ideology by controlling for party affiliation. Poole and Rosenthal (1996look at whether legislators behave as ideologues or as agents of their constituents.
5 Unfortunately, we can only measure lobbying in the form of contributions toagricultural political action committees (PACs), and we cannot measure other kinds olobbying (e.g., writing to or calling one’s representatives). As such, our estimate of the
6 As Ferejohn (1986) noted, farm bills are typically the result of a legislative logrolbetween rural and urban lawmakers, with the former voting in favor of theagricultural protection (e.g., farm subsidies) and the latter voting in favor of thenutrition programs (e.g., food stamps) contained in the farm bill. In order todisentangle support for agriculture from support for nutrition programs, the empiricawork below controls for the poverty rate in a legislator’s district, which proxies for thenumber of food stamp recipients in the same district.
2013), and the budget of the 2008 farm bill was $288 billion (US Government PrintingOffice, 2013a). Note, however, that about 80% of farm bill resources go to programslike the Supplemental Nutrition Assistance Program, i.e., food stamps. Still, the facremains that the voting behavior we study impacts the entirety of the resourcesdedicated to the farm bill.
8 Specifically, our measure of electoral incentives – the proportion of farmers in aCongressional district – is a proxy for how much of the electorate in a given district isa priori in favor of agricultural protection, since it not only captures the proportion ofarmers, but it also proxies for the number of people who derive a livelihood fromagriculture (e.g., farm workers; dealers of seeds, pesticides, fertilizer, and farmimplements; agricultural credit officers; etc.) in a district.
9 The belief that lobbying drives much of agricultural policy is shared by both sidesof the political divide. On the left, see for example Nestle (2013). On the right, seechapter 18 of the Cato Institute’s (2009) Handbook for Policy Makers.
10 It is entirely possible, however, that electoral incentives have themselves beenshaped by lobbying. For example, the farm lobby, through sustained effort over theyears, might have managed to focus voter attention on agriculture-related topicswhich would not be captured by the measure of lobbying we use in this paper.
l
)
f
l
l
is important to know what determines support for a set of mea-sures which most academic economists decry as wasteful(Schmitz et al., 2010). The 2008 US farm bill cost the average Amer-ican taxpayer $3175 over five years, or about $635 annually from2008 to 2012.7 Second, to the extent that one wants to change theway agricultural policy is made, it is important to know whetherone should aim to change who gets involved in politics, change theelectoral system, or reform campaign finance to ‘‘get money out ofpolitics.’’ And although we cannot claim that our results are causalgiven our use of observational data, our findings are remarkably con-sistent across dependent variables and specifications, which helpsalleviate concerns about endogeneity.
To determine why members of Congress support agriculturalprotection, we analyze three sets of outcomes: (i) the scores legis-lators receive from the American Farm Bureau Federation (hereaf-ter the Farm Bureau), (ii) how legislators voted on the 2002 farmbill, and (iii) how legislators voted on the 2008 farm bill. We focuson three variables of interest: (i) the proportion of a legislator’scareer spent working as a farm owner, which we use as a proxyfor a legislator’s preference for supporting agriculture, (ii) the pro-portion of a legislator’s constituents who are themselves farmers,which we use to measure electoral incentives,8 and (iii) the amountof money a legislator received from agricultural political action com-mittees (PACs), which we use to measure lobbying. To help withidentification, we also include district-specific controls (poverty rate,median income, constituent ideology), legislator-specific controls(agricultural committee membership, party affiliation, age, and gen-der) as well as state, chamber (i.e., House or Senate), and congressio-nal term fixed effects wherever applicable.
Pundits9 (and some prior research, e.g., Brooks and Carter, 1995)often blame the farm lobby for policies that protect agriculture. In con-trast, our results suggest that electoral incentives are what primarilydrives legislative action on agricultural policy.10 We also find that lob-bying and legislators’ own preferences seem to matter, but to a muchlesser extent. In line with Swinnen’s (2010) exhortation that research-ers should focus on the interactions between various explanations foragricultural policy, we also find that a legislator’s preferences and elec-toral incentives appear to be substitutes for one another. Why doesCongress support agricultural protection? Because many membersappear to have electoral incentives to—and because many of thosewho don’t seem to have other personal or strategic interests at stake.
Background and theoretical framework
A brief history of US agricultural policy
The history of agricultural protection in the United States datesback to 1862, when the Homestead Act and the Morrill Act wereadopted and the US Department of Agriculture (USDA) was
,
t
f
,
Table 1Findings in the literature on the political economy of agricultural protection.
Reference Preferences of politicians Electoral incentives Lobbying Notes
Alvarez (2005) ‘‘Inconclusive evidence of correlation between moneyand favorable legislative behavior.’’
No data analysis. Primarily aliterature review.Also discusses the economicimportance of the sector but does notdirectly discuss how this could affectvoting behavior.
Abler (1991) Campaign contributions are usedto help elect people who arepredisposed to support sugar anddairy programs.
Campaign contributions are used to help elect peoplepredisposed to support sugar and dairy programs.
Brooks et al. (1998) Evidence that pro- and anti-sugar interests have beenable to ‘‘buy’’ favorable votes.
Lopez (2001) Political contributions influence agricultural subsidies.de Gorter and Swinnen (2002) Tendency for support to agriculture to
decrease with the proportion of thepopulation in agriculture.
Cross-country study.
Gawande and Hoekman (2006) ‘‘Interest-group money bends agricultural policy in theUnited States.’’
Klomp and de Haan (forthcoming) Public agricultural spending increases underthe influence of upcoming elections.
Cross-country analysis
Swinnen (2010) Discusses literature that addresses lobbying. Literature review of food policies.Mitra et al. (2003) This paper ‘‘estimates of the government’s weight on
welfare relative to contributions and the proportion ofthe population that is politically organized.’’
Uses data from US and Turkey to testthe Grossman–Helpman model
Thies and Porche (2007) ‘‘In federal systems where the upper househas a territorial constituency, the marginaleffect on producer support is negative.’’
This paper ‘‘analyze[s] the politicaleconomy of agricultural producersupport in the OECD countries.’’
Vesenka (1989) ‘‘A senator’s personal ideologicalconvictions is significant inexplaining and predicting votes ofUS Senators.’’
‘‘Contributions from agricultural political actioncommittees are insignificant in explaining andpredicting the US Senate’s votes on eight 1981 and six1985 Farm Bill amendments.’’
Swinnen and de Gorter (1993) ‘‘Our model reconciles the apparentcontradiction between models of self-interested politicians and of governmentsmotivated by social concerns.’’
22M
.F.Bellemare,N
.Carnes/FoodPolicy
50(2015)
20–34

M.F. Bellemare, N. Carnes / Food Policy 50 (2015) 20–34 23
established by Abraham Lincoln, who called it the ‘‘people’sdepartment.’’ The Homestead Act gave federal land to settlersunder the legal doctrine of homesteading, whereby someone gainsownership of a plot of land by virtue of clearing and cultivating it(Allen, 1991). The Morrill Act, for its part, gave birth to the networkof land grant universities, and the Hatch Act of 1887 created a cor-responding network of agricultural experiment stations which, tothis day, still fund agricultural research. The USDA implements pol-icies related to agriculture, forestry, and food, and it oversees thevarious agencies in charge of implementing those policies. AsKnutson et al. (2007: 87) note, until the Great Depression, US agri-cultural policy focused largely on ‘‘development, research, educa-tion, and information.’’
When the Great Depression hit rural areas especially hard, pol-icy makers expanded agricultural protection. Following the stockmarket crash of October 1929, agricultural commodity prices fellby about 60% (Cochrane, 1958). Many individuals were forced tomigrate in search of work, a phenomenon Steinbeck immortalizedin The Grapes of Wrath. Rural households struggled to make a living,and the average farm family’s income was less than half that of theaverage non-farm family (Paarlberg, 2011).
In response, the flurry of New Deal legislation included the Agri-cultural Adjustment Act (AAA) of 1933 (Skocpol and Finegold,1982), which added a host of agricultural protection measures.The most important were price supports, which set the prices ofselected agricultural commodities equal to purchasing power par-ity for the period 1910–1914, which had seen high commodityprices and farm incomes (Knutson et al., 2007). The AAA was mod-ified and extended in 1938 and then again in 1949. Ever since, thefarm bill has been a part of US public policy: ‘‘[e]very farm billsince 1949 has been a further amendment to the 1938 act, witha fixed termination date’’ (Knutson et al., 2007: 88).
When America became involved in World War II, millions ofpeople left rural areas to join the war effort or to take manufactur-ing jobs in urban centers. Labor became ever scarcer in ruralareas and, as a result, the agricultural sector developed severallabor-saving technologies that allowed for increasing returns toscale in agriculture. Farms became bigger and fewer in number(Paarlberg, 2011).11
As farms consolidated, the price supports adopted in 1933 even-tually proved unsustainable. At first, they were replaced by flexibleprice supports, which were set at less than 100 percent of the 1910–1914 parity levels (Knutson et al., 2007). By the 1970s, pricesupports had effectively become income supports for farmers.Lawmakers allowed prices to fall below the levels they hadachieved during the price-support era. In exchange, the govern-ment began granting farmers direct payments tied to farm prices,often referred to as ‘‘coupled payments.’’ Coupled payments provedtoo costly, however, and the 1996 farm bill–the Federal AgricultureInvestment and Reform (FAIR) Act of 1996 (US Government PrintingOffice, 2013b)–decoupled direct payments and food prices andauthorized direct payments to farmers regardless of the quantitiesthey produced or the prices of their crops.12 By decoupling pay-ments from price and quantity, lawmakers hoped to bring an endto the market distortions that price supports had created: In princi-ple, farmers could receive government subsidies while still allowingthe market to dictate which crops were most valuable. In the span of
11 The theory of innovation described here is known as the theory of inducedinnovation, which posits that increases in the relative price of a given factor oproduction lead to the development of technologies that will allow to economize onthat factor production (Hicks, 1932). See Hayami and Ruttan (1985) for an applicationto agriculture.
12 By then, agricultural protection had largely lost its initial raison d’être, since theaverage American farmer, with a net worth in excess of $600,000 and about 1800acres of land, was significantly better off than the average American (Paarlberg, 201198).
13 Obviously, this brief historical overview of US agricultural policy is in no waymeant to be an exhaustive survey. The reader interested in a more exhaustivediscussion of US agricultural protection is encouraged to consult Orden et al. (1999)Paarlberg and Paarlberg (2000), Gardner (2006), Knutson et al. (2007), Schmitz et al(2010), and Paarlberg (2011).
f
:
just a few decades, American agricultural policy had moved from asystem of price supports to a system of direct transfers.
This system of direct transfers was renewed and expanded inthe 2002 and 2008 farm bills (US Government Printing Office,2013c,d). The 2002 farm bill renewed the direct payments enactedby the 1996 farm bill, but it also introduced countercyclical pay-ments and commodity loan rates, which were continued in 2008.The 2008 farm bill, which took effect at the height of the 2008 foodcrisis, added the Average Crop Revenue Election (ACRE) program, aform of revenue insurance for farmers (Schmitz et al., 2010). Foodprices had reached a 30-year high, and the ACRE program ‘‘cleverlyused the high income levels of [farmers in] 2008 as a baseline fromwhich farmers would be able to make claims for added compensa-tion in the event prices subsequently fell, which of course theysoon did’’ (Paarlberg, 2011). Of course, there was a certain discon-tinuity between the two farm bills: since the mid-2000s, agricul-tural policy has become entangled with environmental or energypolicy via biofuels (de Gorter and Just, 2009). Overall, however,2002 and 2008 were good years for agricultural protection.13
The political economy of US agricultural policy
Why have lawmakers worked so hard to protect agriculture? AsPaarlberg (2011) explains, the process by which the farm bill isrenewed (and usually expanded) every five to seven years is sup-ported by an iron triangle composed of (i) the House and SenateAgricultural Committees, whose members are often advocates ofagricultural protection, (ii) the USDA, whose very existence is jus-tified in great part by its administering agricultural protection pro-grams, and (iii) the farm lobby, which works to extract as muchmoney as possible for farmers, and which contributes to the cam-paigns of sympathetic members of Congress.
First, the House and Senate Agricultural Committees draft eachfarm bill. Paarlberg (2011:100) notes:
The secret to every farm bill’s success in Congress is the leadrole played by the House and Senate Agriculture Committees,where members from farm states and farm districts enjoy adominant presence and are rewarded for their legislative effortswith generous campaign contributions from the farm lobby,which is built around organizations representing the farmerswho get the subsidies. The Agriculture Committees draft thelegislation that goes to the floor for a final vote, and in the draft-ing process they take care to satisfy the minimum needs of bothRepublican and Democratic members to ensure bipartisan sup-port. . . . The final package is what students of legislative politicscall a committee-based logroll.
Once the Agricultural Committees draft a farm bill, the proposedlegislation is sent to the House and Senate for floor action. Both theHouse and Senate place the legislation on their calendars, the billsare debated, and then votes take place. If a majority of the membersof a chamber vote ‘‘Yea,’’ the bill passes. This is the first of the threemost common major votes on any farm bill, and we will refer to thisvote as the vote on passage for the remainder of this paper.
If the House and Senate pass different versions of the farm bill,the two chambers appoint an ad hoc conference committee to ironout the differences. If the conference committee reaches an agree-ment, the reconciled bill is then sent to each chamber for approval.This is the second of the three major votes on most farm bills, andwe will refer to this vote as the conference vote.
,.
24 M.F. Bellemare, N. Carnes / Food Policy 50 (2015) 20–34
If both chambers pass an identical farm bill, it heads to the Pres-ident who may sign it into law or veto it. If the President vetoes,the bill is sent back to Congress with the President’s reasons forvetoing the bill. Both chambers then have the option to vote tooverride the President’s veto, but overriding a presidential vetorequires a two-thirds majority in each chamber. This is the thirdof the three major votes that are possible on a farm bill, and we willrefer to it as the veto override vote. The 2002 farm bill, for instance,was passed in slightly different forms in the House and Senate, rec-onciled in conference committee, passed in conference votes inboth chambers, then signed into law by the president. The 2008farm bill, on the other hand, was passed in different forms, recon-ciled in conference, passed in conference votes, and then vetoed byGeorge W. Bush. Congress voted to override President Bush’s veto,however, and the extension became law.
Why did members of Congress do so much to shepherd thesebills through the legislative process, even at the expense of follow-ing through on a veto showdown with President Bush? The fourexplanations that seem most promising are lawmaker preferences,electoral incentives, lobbying, and political institutions. Perhapslawmakers personally favor aggressive agricultural protections.Perhaps their constituents pressure them to support agriculture.Perhaps lobbyists do. Or perhaps the institutional environmenthas somehow stacked the deck in agriculture’s favor.
Unfortunately, we cannot test institutional explanations in thispaper: the relevant features of the institutional environment (e.g.,delegated authority to committees, iron triangles, the different geo-graphical constituencies of the House and Senate, and so on) havebeen essentially constant during the period when we have relevantdata.14 Instead, we focus on legislator preferences, electoral incen-tives, and lobbying. Previous empirical research on this topic suggeststhat all three explanations hold promise. Research on interest groupsis well-developed in political science (e.g., Denzau and Munger, 1986;Hall and Deardorff, 2006; Hall and Wayman, 1990) and economics(e.g., Grossman and Helpman, 1994). Denzau and Munger argue thatinterest groups focus on legislators whose constituents are indifferentor rationally ignorant about the groups’ preferred policies. In otherwords, voters who have a preference for those policies not only gettheir way in their own districts, but also in other districts where votersdo not care or are rationally ignorant about those policies. Grossmanand Helpman conclude that legislators trade off campaign contribu-tions from interest groups and the welfare of their constituents (seealso Grossman and Helpman, 1996). There are good reasons to suspectthat lawmakers’ own preferences matter, too: a growing body ofresearch has shown that legislators often vote their own views onthe issues before them (for a useful review, see Burden, 2007).
Empirical framework
Which of these explanations carries the most weight? To date,scholars have never examined all three in conjunction at theindividual level, as shown in Table 1. That is, we do not knowhow important legislator preferences (as distinct from ideology),electoral incentives, and lobbying are relative to one another whenlegislators make important decisions about agricultural protectionpolicies (though a handful of studies have tackled two simulta-neously; see, for example, Brooks, 1997).
Estimation strategy
In the empirical application below, we model legislative actionon major farm bills as a function of all three factors and a host of
14 Our approach also cannot account for logrolling, the practice whereby membersof Congress trade favors, in which one member will vote another one’s preference onan issue in expectation of the other voting the one’s preference on a different issue.
controls. We focus on five measures of how legislators voted onthe 2002 and 2008 farm bills: the passage and committee votesin 2002 and the passage, committee, and veto override votes in2008. Although farm bills are omnibus bills that cover both agricul-tural protection and nutrition programs, we argue below thatincluding the poverty rate in a district as a control variable allowsisolating voting in favor of agricultural protection.
The core equation we estimate is
yijt ¼ aþ bppijt þ beeijt þ b‘‘ijt þ cxijt þ dsds þ djdj þ dtdt þ �ijt; ð1Þ
where yijt = 1 if legislator i in state j during Congress t casts a ‘‘Yea’’vote and yijt = 0 if the legislator casts a ‘‘Nay’’ vote, p is a measure oflegislator preference for agricultural protection, e is a measure ofelectoral incentives, ‘ is a measure of lobbying, x is a vector of otherlegislator- or district-specific attributes, ds is an indicator variablecapturing whether a legislator is a senator, dj is a vector of statefixed effects, dt is a vector of Congress fixed effects, and � is an errorterm with mean zero.
Unfortunately, studying individual roll call votes can sometimesobscure larger patterns in legislative conduct on a particular issue.As such, we also use Eq. (1) to analyze how our explanatory vari-ables are related to two composite measures of overall supportfor agriculture, that is, two measures that are based on a largenumber of legislative choices. The first is the score given to eachlegislator by the American Farm Bureau Federation (AFBF). Duringeach Congress, the Farm Bureau selects roughly a dozen roll callvotes that it considers important to the interests of farmers, andassigns each legislator a score between 0 and 100 depending onhow often the legislator voted for the pro-agriculture position.(To make this measure more comparable to our roll call votingmeasures, we simply rescaled Farm Bureau scores to rangebetween 0 and 1.) Farm Bureau scores are available electronicallyfor over 200 legislators in the 106th Congress and over 300 in boththe 108th and 109th. Altogether, we have 906 observations for thisuseful measure of legislative conduct on agricultural issues.
Our second composite measure is an indicator for legislatorswho were identified as ‘‘Friends of the Farm Bureau.’’ This distinc-tion is assigned at the end of each congressional term to membersnominated by their state Farm Bureaus and approved by thenational Farm Bureau Board of Directors, who consider a legisla-tor’s ‘‘voting records on AFBF’s priority issues established by theBoard of Directors, [the] number of bills that a member has spon-sored and co-sponsored, . . .and how accessible and responsive thatmember is to Farm Bureau members and leaders.’’15
The Friend of the Farm Bureau indicator is arguably our bestoverall measure of legislative action on agricultural issues: it cov-ers a wide range of actions, both at the floor voting stage andbehind the scenes. And it is available for almost every legislatorwho served during the 106th through 110th Congresses, the timeframe when we have high-quality data on all of our explanatoryvariables. With any given final passage vote, we have at most535 observations (435 votes in the House and 100 in the Senate).With the Friend measure, we have 2699: one for each member ineach of five Congresses. (The number slightly exceeds 2675—or5 � 535—because a few members were replaced due to death orresignation and a few switched parties and therefore appear twicein our dataset.)
Because all but one of our dependent variables are binary (theexception being a legislator’s Farm Bureau score), Eq. (1) is esti-mated by ordinary least squares, which constitutes a linear proba-bility model (LPM). Although the LPM suffers from two significantshortcomings relative to either the probit or logit—it can yield
5 From http://www.fb.org/index.php?action=legislative.112c (accessed June 13,013).
1
2

M.F. Bellemare, N. Carnes / Food Policy 50 (2015) 20–34 25
predicted probabilities outside of the [0,1] interval, and it suffersfrom heteroskedasticity due to the Bernoulli structure of the vari-ance of binary variables—these shortcomings are irrelevant in thisapplication. First, since we are not interested in forecasting futurevotes, it does not matter that predicted probabilities can in theorylie outside of the [0,1] interval; what matters instead is to accu-rately estimate the coefficient associated with each variable ofinterest. Moreover, our use of robust standard errors throughouteliminates concerns about heteroskedasticity.16 Additionally, theLPM offers three distinct advantages over nonlinear procedures suchas the probit or logit. First, it prevents coefficient estimates frombeing identified as a result of the specific distribution assumed forthe error term. Second, it produces coefficient estimates that canbe easily interpreted as elasticities without extra computations.Third, and most importantly for the application at hand, it doesnot suffer from the incidental parameter problem one encounterswhen incorporating fixed effects to nonlinear procedures such asthe probit or logit (Heckman, 1981).
Of course, we must note an important limitation up front. Oneach of the five bills we examine, some legislators simply do notcast votes.17 As a result, many do not have Farm Bureau scores(though almost all have Friend of the Farm Bureau indicators) duringthe three Congresses for which we have Farm Bureau score data.Although there is a burgeoning area of research devoted to dealingwith abstention—and, more importantly, strategic abstention—fromroll call votes (Rosas et al., 2012), the methods developed requiredata which we simply do not have. We thus assume that in this con-text, votes are missing at random, a common assumption in the caseof missing data. Again, our Friend of the Farm Bureau measureshould help to further alleviate concerns about this limitation, butit is worth noting here.
Identification strategy
In any application, there are three possible sources of statisticalendogeneity that can compromise the identification of causalrelationships:
1. Unobserved heterogeneity: The controls on the right-handside (RHS) of Eq. (1) might fail to account for some importantnonrandom differences between legislators, and those differ-ences are correlated with the variables on the RHS of Eq. (1).
2. Measurement error: One or more of the variables in Eq. (1)might be measured with error.
3. Reverse causality or simultaneity: Changes in the dependentvariable might induce changes in one or more of the explan-atory variables.
In most analyses of cross-sectional data, unobserved heteroge-neity is the most likely source of prospective endogeneity. Indeed,although the right-hand side of Eq. (1) includes a rich set ofcontrols, we can never rule out the possibility that we havemissed something important. Simply put, our results are notcausal estimates; they are associations, which can be useful fortesting competing explanations of legislative action (e.g., if
16 Moreover, in the presence of heteroskedasticity, the use of robust standard errorswith the probit or logit (or any other nonlinear procedure) yields inconsistencoefficient estimates. As Giles (2013) informally noted in a discussion of the topic‘‘What use is a consistent standard error when the point estimate is inconsistent?’See Greene (2012:692) for a formal treatment.
17 Note that the issue of misclassification (i.e., zero responses recorded as ones orone responses recorded as zeroes) can be a serious threat to identification in an LPM(Hausman et al., 1999). This is not a problem here, however, given that the votes omembers of Congress are public, that that those votes are carefully recorded, and thathey are under a considerable amount of scrutiny from various stakeholders.
18 Although the Food Research and Action Center (FRAC) has made availablecongressional district-level data on the number of food stamp or SNAP recipients,those data are for 2011, and so we cannot use them for our analysis, which stops in2009. See FRAC (2011) for the data.
t:’
ft
lobbying drives legislators to support farms, we should observean association between lobbying and support for farms) butwhich are not the same as causal evidence (since we cannotdefinitively rule out that something correlated with lobbyingwas really doing the work).
We are less concerned about measurement error. Eq. (1) con-trols for a wide range of factors that should capture a legislator’spreferences for food policy programs such as the SNAP: not onlydo we account for a legislator’s age, gender, party affiliation, state,and Congress, we also control for the poverty rate (which proxiesfor the number of food stamp or SNAP recipients)18 as well as forthe median income (which, once the poverty rate is included, proxiesfor inequality) in the legislator’s district. In other words, although itis certainly possible that a legislator’s vote on a farm bill encom-passes more than her vote on agricultural protection, it is highlyunlikely that this significantly compromises the identification ofour results given our control variables. Additionally, our use of FarmBureau-related variables (i.e., Farm Bureau scores, and the indicatorfor whether a legislator is a Friend of the Farm Bureau) provides aconsistency check on the farm bill results: those variables home inon agricultural protection and ignore other kinds of policy.
Finally, except as regards the Farm Bureau-related variables, theissue of reverse causality is largely irrelevant in this context.Indeed, it is impossible for a legislator’s vote on a farm bill to causea legislator to have received more money from agricultural PACs inthe preceding election. And though it is certainly possible that thetwo are jointly determined because agricultural PACs contributeto a legislator’s re-election campaign in the hope that, once elected,his votes will favor agriculture, legislators can do whatever theywant once elected. Likewise, it is unlikely that a legislator’s voteon a farm bill causes changes in the proportion of that legislator’sconstituents who work as farmers, and it is simply impossible thatit causes the legislator to have spent more time working as afarmer.
Still, the empirical results in this paper rely on observationaldata, so we cannot claim to have identified causal relationshipsbetween our three variables of interest (i.e., preferences, electoralincentives, and lobbying) and support for agricultural protection.The relationship between lobbyists, voters, and legislators iscomplex, after all. PACs routinely lobby legislators who theyexpect to vote their way, and many PACs try to change legisla-tors’ personal views about the issues at hand, either by tryingto persuade them or trying to replace them (by donating to theiropponents). Likewise, legislators’ personal views depend in parton the kinds of people voters elect, which in turn depends onvoters’ preferences.
However, if we want to understand what drives agriculturalprotection in the US, we have to start somewhere. We cannotrandomly assign legislators to have certain kinds of constituents,certain kinds of preferences, or certain kinds of relationships withinterest groups. Likewise, finding a valid instrumental variable(IV)—a variable that explains either a legislator’s preferences,the preferences of her constituents, or how much she receivesin agricultural PAC contributions, but which is itself uncorrelatedwith the legislator’s voting behavior—is difficult enough for anyone of these three variables, and finding valid IVs for all threewould be a Herculean task. We can, however, use observationaldata to determine whether the associations implied by extanttheories really exist in the complex world of congressional deci-sion making.

Table 2Descriptive statistics.
Variable Mean (Std.Dev.)
N
Dependent variablesFarm Bill 2002 Passage Vote (Indicator) 0.689 (0.463) 511Farm Bill 2002 Conference Vote (Indicator) 0.662 (0.473) 518Farm Bill 2008 Passage Vote (Indicator) 0.602 (0.490) 515Farm Bill 2008 Conference Vote (Indicator) 0.767 (0.423) 520Farm Bill 2008 Veto Vote (Indicator) 0.765 (0.424) 520Farm Bureau Score 0.612 (0.269) 906Friend of the Farm Bureau (Indicator) 0.483 (0.500) 2699
Variables of interestProportion of Career Spent in Agriculture 0.022 (0.091) 2715Proportion of Agricultural Constituents 0.008 (0.011) 2715Contributions from Agricultural PACs ($1000) 22.942 (33.590) 2715
District characteristicsPoverty Rate 0.123 (0.054) 2715Median Income ($1,000) 43.159 (10.301) 2715Proportion of Republican Constituents 0.522 (0.079) 2680
Legislator characteristicsRepublican (Indicator) 0.511 (0.500) 2714Member of House Agricultural Committee
(Indicator)0.131 (0.337) 2676
Member of Senate Agricultural Committee(Indicator)
0.038 (0.190) 2715
Female (Indicator) 0.142 (0.349) 2715Age (Years) 56.069 (10.050) 2715106th Congress (Indicator) 0.200 (0.400) 2715107th Congress (Indicator) 0.200 (0.400) 2715108th Congress (Indicator) 0.199 (0.399) 2715109th Congress (Indicator) 0.199 (0.399) 2715110th Congress (Indicator) 0.202 (0.402) 2715
0 Of course, some agricultural PACs may not support some farm bills. As such, our
26 M.F. Bellemare, N. Carnes / Food Policy 50 (2015) 20–34
Data and descriptive statistics
Do lawmakers support agriculture when they personally preferpolicies that protect farmers?19 When their constituents preferthose policies? When agricultural interests lobby them aggressively?Or is the average lawmaker’s support for agricultural protection duesome combination of the three? To answer these questions, we needdata on what lawmakers want, what their constituents want, andhow much lawmakers are lobbied by agricultural interests.
Measuring legislators’ personal views on public policy can bechallenging. The last representative survey that asked membersof Congress about their personal opinions was conducted in thelate 1950s (Miller and Stokes, 1963). We can easily tap legislators’attitudes toward economic issues like agricultural subsidies, how-ever, by studying what they did for a living before they wereelected to Congress. All else equal, legislators who were farm own-ers themselves should be more likely to support policies that pro-mote agricultural interests.
We identified lawmakers who previously worked as farmersusing data from the Congressional Leadership and Social Status(CLASS) dataset (Carnes, 2011), the only existing database thatcontains detailed information about the professional backgroundsof a large sample of American legislators. The CLASS datasetincludes a wide range of biographical data for each of the 783 leg-islators who served in the 106th through 110th Congresses (1999–2008), including information about all of the jobs the legislator hadbefore serving in Congress. We focus here on the percentage ofeach member’s pre-congressional career spent working as a farmowner or manager. If legislators sometimes vote with an eye to
19 Of course, a lawmaker’s personal preferences are endogenous, given that whogets elected can be the result of sustained effort by lobbyists, or of the preferences ofthat politician’s voters. Levitt (1998), for example, shows that PACs influence politicsequally through their effect on roll call votes and through their effect on elections viathe preferences of voters.
their own policy preferences, as Carnes (2012, 2013) shows, formerfarmers in Congress should be more likely to support policies thatbenefit farmers.
Likewise, if legislators vote with an eye to their constituents’preferences, those who represent larger numbers of farmers shouldbe more likely to support agriculture. As a simple test of this idea,we examined the CLASS dataset’s measure of the proportion ofeach legislator’s constituents who work as farm owners or manag-ers. Of course, most people who work in agriculture are farmemployees, not farm owners. We focus here on owners and manag-ers—who stand to reap the most immediate benefits from agricul-tural subsidies—although studying the concentration of farmemployees in a district would probably produce similar findings(since the proportion of farm workers in a district is highly corre-lated with the proportion of farm owners.) Lawmakers who repre-sent greater numbers of farm owners tend to represent greaternumbers of farm workers, too—and those lawmakers usually havestrong electoral incentives to keep federal dollars flowing toagriculture.
To measure lobbying on behalf of agriculture, we simply com-puted the amount of money each legislator received from agricul-tural PACs during each congressional term using Federal ElectionsCommission data compiled by the Center for Responsive Politics(2012). With these data, we can easily determine whether law-makers who receive more money from farm PACs are more likelyto vote to fund agriculture.20 Table 2 lists the complete descriptivestatistics for all of the variables in our analysis during each congres-sional term and when we pool observations across all fiveCongresses.
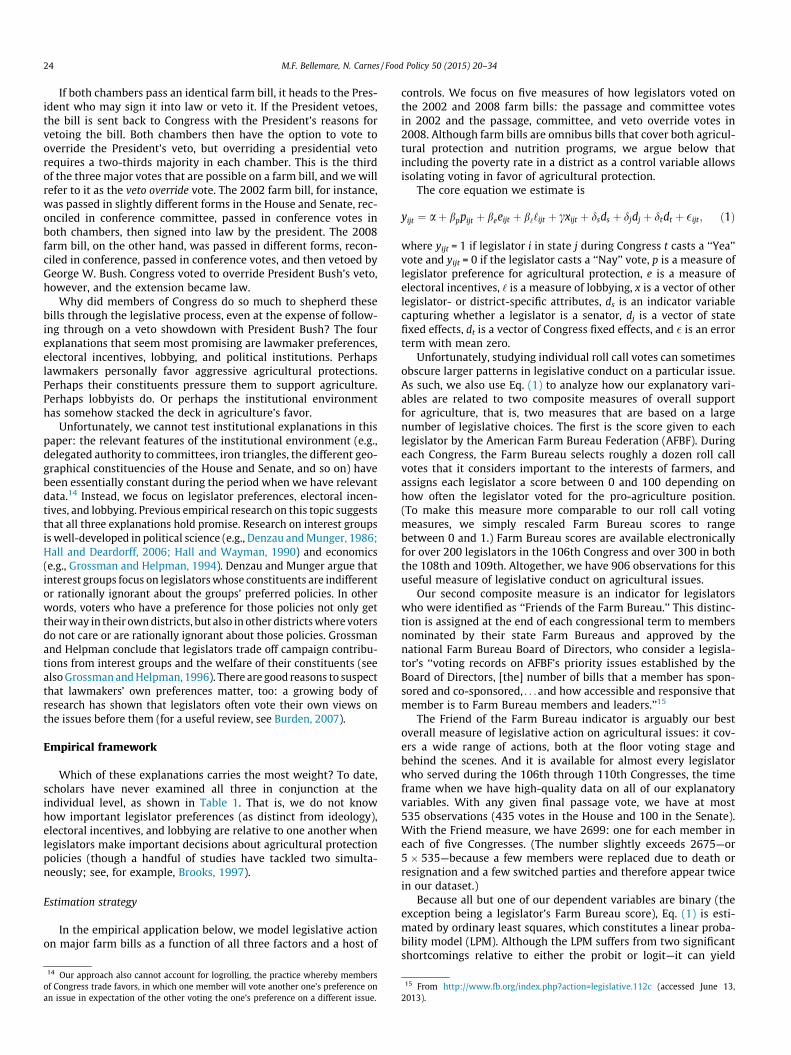
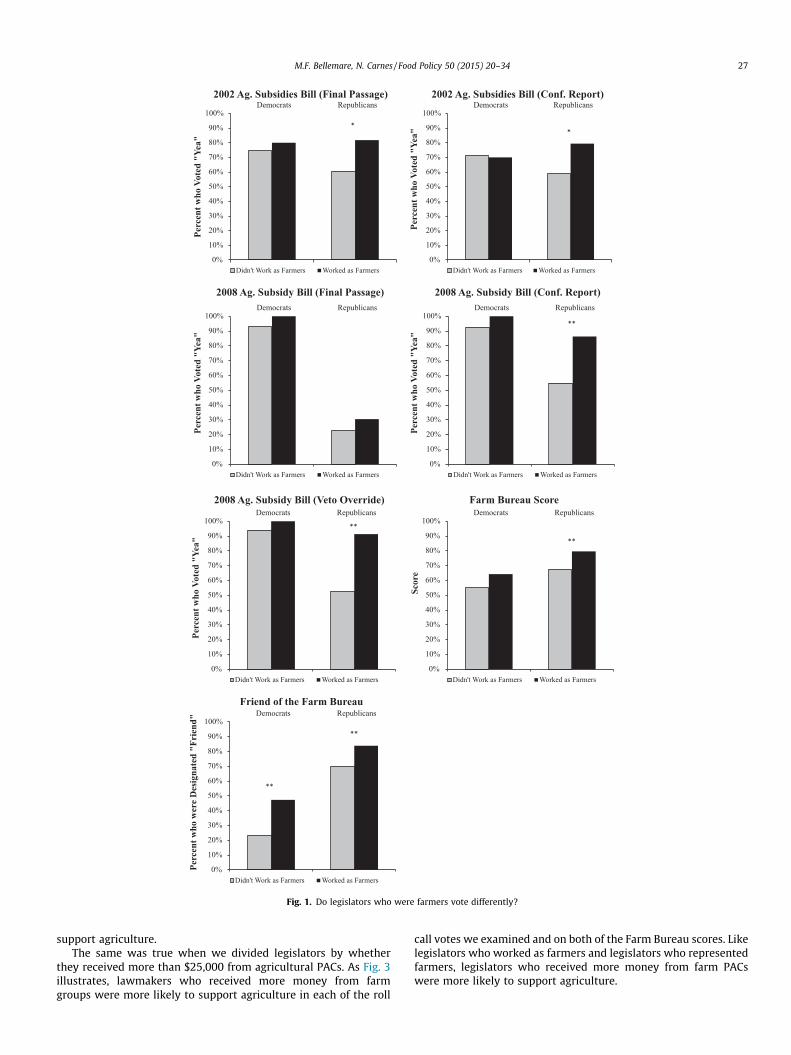
Measured this way, legislator preferences, constituent prefer-ences, and agricultural lobbying each predict substantial differ-ences in how legislators vote on farm issues. In Fig. 1, we havesimply divided legislators by party (Democrats on the left, Repub-licans on the right) and then by whether the legislator ever workedas a farm owner or manager before serving in Congress (non-farm-ers are gray, farmers are black). The first five panels plot the per-centages of legislators who voted in favor of agriculture on eachof the individual roll call votes we have singled out. The last twopanels plot the average Farm Bureau score members receivedand the percentage of members who were designated ‘‘Friends ofthe Farm Bureau.’’ With one exception (Democrats voting on theconference report for the 2002 agriculture bill), legislators whohad worked as farm owners always scored higher on average thanthose who did not. These gaps were almost always statistically sig-nificant for Republican lawmakers,21 and the difference was signif-icant among legislators from both parties when we examined whichmembers were designated Friends of the Farm Bureau, our mostcomprehensive measure of support for agriculture. Consistent withthe idea that legislators vote on farm policy with an eye to their pref-erences, members of Congress who had worked as farmers wereconsistently more likely to support farmers.
Likewise, members whose constituents included more farmowners were more likely to support pro-agriculture legislation.Fig. 2 repeats the analysis in Fig. 1, this time dividing lawmakersby whether they represented a district or state where more than2% of people worked as farm owners or managers (i.e., aboutdouble the national average). Across the board, legislators whorepresented greater numbers of farmers were more likely to
nalysis represents the lower bound of the association between lobbying andgislative voting on agricultural protection.1 The gaps between Democrats who had been farmers and those who had not may
ot have achieved statistical significance in some panels because the data on roll calloting are censored at 100%. Although many of the Republican gaps are significantnd many of the Democratic gaps are not, it would probably be a mistake to concludeat a background in agriculture only matters for Republicans.
2
ale
2
nvath
0%
10%
20%
30%
40%
50%
60%
70%
80%
90%
100%Democrats Republicans
Perc
ent w
ho V
oted
"Ye
a"
2002 Ag. Subsidies Bill (Final Passage)
Didn't Work as Farmers Worked as Farmers
*
0%
10%
20%
30%
40%
50%
60%
70%
80%
90%
100%Democrats Republicans
Perc
ent w
ho V
oted
"Ye
a"
2002 Ag. Subsidies Bill (Conf. Report)
Didn't Work as Farmers Worked as Farmers
*
0%
10%
20%
30%
40%
50%
60%
70%
80%
90%
100%Democrats Republicans
Perc
ent w
ho V
oted
"Ye
a"
2008 Ag. Subsidy Bill (Final Passage)
Didn't Work as Farmers Worked as Farmers0%
10%
20%
30%
40%
50%
60%
70%
80%
90%
100%Democrats Republicans
Perc
ent w
ho V
oted
"Ye
a"
2008 Ag. Subsidy Bill (Conf. Report)
Didn't Work as Farmers Worked as Farmers
**
0%
10%
20%
30%
40%
50%
60%
70%
80%
90%
100%Democrats Republicans
Perc
ent w
ho V
oted
"Ye
a"
2008 Ag. Subsidy Bill (Veto Override)
Didn't Work as Farmers Worked as Farmers
**
0%
10%
20%
30%
40%
50%
60%
70%
80%
90%
100%Democrats Republicans
Scor
e
Farm Bureau Score
Didn't Work as Farmers Worked as Farmers
**
0%
10%
20%
30%
40%
50%
60%
70%
80%
90%
100%Democrats Republicans
Perc
ent w
ho w
ere
Des
igna
ted
"Fri
end"
Friend of the Farm Bureau
Didn't Work as Farmers Worked as Farmers
**
**
Fig. 1. Do legislators who were farmers vote differently?
M.F. Bellemare, N. Carnes / Food Policy 50 (2015) 20–34 27
support agriculture.The same was true when we divided legislators by whether
they received more than $25,000 from agricultural PACs. As Fig. 3illustrates, lawmakers who received more money from farmgroups were more likely to support agriculture in each of the roll
call votes we examined and on both of the Farm Bureau scores. Likelegislators who worked as farmers and legislators who representedfarmers, legislators who received more money from farm PACswere more likely to support agriculture.

0%
10%
20%
30%
40%
50%
60%
70%
80%
90%
100%Democrats Republicans
Perc
ent w
ho V
oted
"Ye
a"
2002 Ag. Subsidies Bill (Final Passage)
More Farm Owners in Dist. Fewer Farm Owners in Dist.
* *
0%
10%
20%
30%
40%
50%
60%
70%
80%
90%
100%Democrats Republicans
Perc
ent w
ho V
oted
"Ye
a"
2002 Ag. Subsidies Bill (Conf. Report)
More Farm Owners in Dist. Fewer Farm Owners in Dist.
*
0%
10%
20%
30%
40%
50%
60%
70%
80%
90%
100%Democrats Republicans
Perc
ent w
ho V
oted
"Ye
a"
2008 Ag. Subsidy Bill (Final Passage)
More Farm Owners in Dist. Fewer Farm Owners in Dist.0%
10%
20%
30%
40%
50%
60%
70%
80%
90%
100%Democrats Republicans
Perc
ent w
ho V
oted
"Ye
a"
2008 Ag. Subsidy Bill (Conf. Report)
More Farm Owners in Dist. Fewer Farm Owners in Dist.
*
0%
10%
20%
30%
40%
50%
60%
70%
80%
90%
100%Democrats Republicans
Perc
ent w
ho V
oted
"Ye
a"
2008 Ag. Subsidy Bill (Veto Override)
More Farm Owners in Dist. Fewer Farm Owners in Dist.
*
0%
10%
20%
30%
40%
50%
60%
70%
80%
90%
100%Democrats Republicans
Scor
e
Farm Bureau Score
More Farm Owners in Dist. Fewer Farm Owners in Dist.
*
*
0%
10%
20%
30%
40%
50%
60%
70%
80%
90%
100% Democrats Republicans
Perc
ent w
ho w
ere
Des
igna
ted
"Fri
end"
Friend of the Farm Bureau
More Farm Owners in Dist. Fewer Farm Owners in Dist.
+
+
Fig. 2. Do legislators from districts with a larger share of farmers vote differently?
28 M.F. Bellemare, N. Carnes / Food Policy 50 (2015) 20–34

0%
10%
20%
30%
40%
50%
60%
70%
80%
90%
100%Democrats Republicans
Perc
ent w
ho V
oted
"Ye
a"
2002 Ag. Subsidies Bill (Final Passage)
Less $ from Ag. PACs More $ from Ag. PACs
*
*
0%
10%
20%
30%
40%
50%
60%
70%
80%
90%
100%Democrats Republicans
Perc
ent w
ho V
oted
"Ye
a"
2002 Ag. Subsidies Bill (Conf. Report)
Less $ from Ag. PACs More $ from Ag. PACs
+**
0%
10%
20%
30%
40%
50%
60%
70%
80%
90%
100%Democrats Republicans
Perc
ent w
ho V
oted
"Ye
a"
2008 Ag. Subsidy Bill (Final Passage)
Less $ from Ag. PACs More $ from Ag. PACs
*
0%
10%
20%
30%
40%
50%
60%
70%
80%
90%
100%Democrats Republicans
Perc
ent w
ho V
oted
"Ye
a"
2008 Ag. Subsidy Bill (Conf. Report)
Less $ from Ag. PACs More $ from Ag. PACs
**
0%
10%
20%
30%
40%
50%
60%
70%
80%
90%
100%Democrats Republicans
Perc
ent w
ho V
oted
"Ye
a"
2008 Ag. Subsidy Bill (Veto Override)
Less $ from Ag. PACs More $ from Ag. PACs
**
0%
10%
20%
30%
40%
50%
60%
70%
80%
90%
100%Democrats Republicans
Scor
e
Farm Bureau Score
Less $ from Ag. PACs More $ from Ag. PACs
**
*
0%
10%
20%
30%
40%
50%
60%
70%
80%
90%
100%Democrats Republicans
Perc
ent w
ho w
ere
Des
igna
ted
"Fri
end"
Friend of the Farm Bureau
Less $ from Ag. PACs More $ from Ag. PACs
**
**
Fig. 3. Do legislators who receive substantial amounts of agricultural PAC money vote differently?
M.F. Bellemare, N. Carnes / Food Policy 50 (2015) 20–34 29

Table 3OLS Estimation results for Friends of the Farm Bureau.
Robust standard errors in parentheses.⁄ p < 0.1.
** p < 0.05.*** p < 0.01.
2 Note that in all of our specifications, we regress a binary outcome on thegarithm of the amount of money received from agricultural PACs in 1000s of dollar.s such, the estimated coefficient for the logarithm of agricultural PAC contributionsnnot be interpreted as an elasticity. To be interpreted as such, the estimatedefficient has to be divided by how much money a legislator has received to recover.
hat is, when y ¼ aþ b lnð‘Þ, @y=@‘ ¼ b=‘. This last ratio can be computed in one ofo ways: at means (i.e., computing b=�‘), or taking the mean thereof (i.e., computing
Ni¼1ðb=‘iÞ). We opt for the latter approach.
30 M.F. Bellemare, N. Carnes / Food Policy 50 (2015) 20–34
Estimation results and discussion
Of course, there is a great deal of overlap between the threevariables: the legislators who receive more money from agricul-tural PACs are often the legislators who worked as farmers andwho represent farmers. To disentangle the effects of the three vari-ables, we estimated the regressions described in Eq. (1) above.
Table 3 reports the results of four regression specifications thatuse our most comprehensive measure of support for agriculturalprotection, i.e., our indicator variable for whether each memberwas designated a Friend of the Farm Bureau during each of the fiveCongresses covered by the CLASS dataset. In each specification, wecontrol for the poverty rate and the median income in each legis-lator’s district, whether a legislator is a member of the House orSenate agricultural committee, the legislator’s party (an indicatorfor whether a legislator is a Republican), the partisanship of thelegislator’s constituents (the proportion of constituents who iden-tified as Republicans in the National Annenberg Election Study),the legislator’s gender (an indicator for women), the legislatorsage, the legislator’s state (not shown for brevity), whether the leg-islator is a Senator, and the Congress (also not shown). In the firstspecification in Table 3, we included our measure of the proportionof each legislator’s own pre-congressional career he or she spentworking as a farm owner or manager. In the second specification,we included a measure of the proportion of the legislator’s constit-uents who are farm owners or managers. In the third specification,we included the logarithm of the amount of contributions the leg-islator received from agricultural PACs. The fourth specificationincludes all three variables of interest: our measures of legislatorpreferences, constituent preferences, and lobbying activity.
As Table 3 illustrates, all three variables of interest wereassociated with significant differences in how legislators voted
on agricultural policy. Legislators who spent the entirety of theirpre-congressional career working as farm owners or managersare 27 percentage points more likely to be Friends of the FarmBureau (column 1), but this decreases to 15 percentage pointsand is no longer significant once other mechanisms of supportfor agricultural protection are controlled for (column 4). Likewise,for a one percentage point increase in the proportion of a legisla-tor’s constituents who work in agriculture, that legislator was 33percentage points more likely to be a Friend of the Farm Bureau(column 2), but this decreases to 25 percentage points once othermechanisms of support for agricultural protection are controlledfor (column 4). Though the estimated coefficients for the propor-tion of constituents who work in agriculture might seem high, notethat this is due to the conditioning domain: for more than 99% ofour sample, that proportion was less 5%, and the mean of this var-iable is less than 1%. Given those very small percentages, for theaverage legislator in our sample, a one percentage point increasein the proportion of constituents who work in agriculture reallymeans a 100% increase in the number of their constituents whowork in agriculture, i.e., the difference between having 1% of con-stituents employed in agriculture versus having 2% working inagriculture. Lastly, for every additional $1,000 tranche receivedfrom agricultural PACs, a legislator was 1.9% (column 3) morelikely to be a Friend of the Farm Bureau,22 but this decreases to
2
loAcacoTtwP
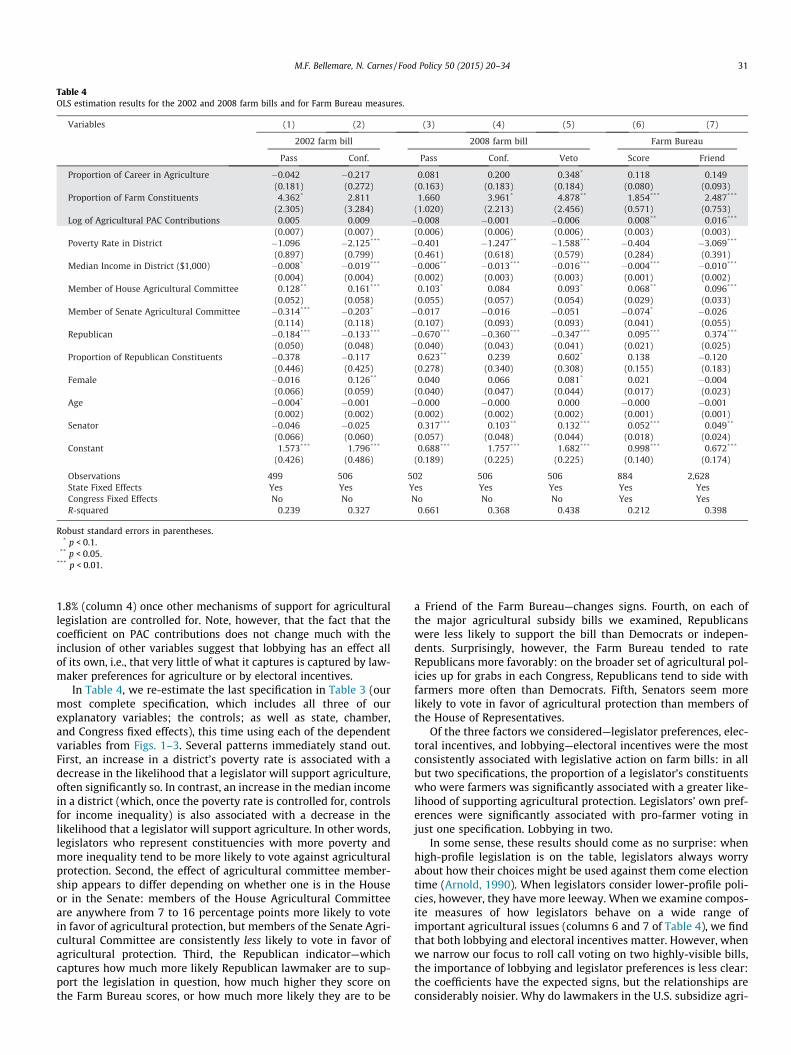
Table 4OLS estimation results for the 2002 and 2008 farm bills and for Farm Bureau measures.
Robust standard errors in parentheses.* p < 0.1.
** p < 0.05.*** p < 0.01.
M.F. Bellemare, N. Carnes / Food Policy 50 (2015) 20–34 31
1.8% (column 4) once other mechanisms of support for agriculturallegislation are controlled for. Note, however, that the fact that thecoefficient on PAC contributions does not change much with theinclusion of other variables suggest that lobbying has an effect allof its own, i.e., that very little of what it captures is captured by law-maker preferences for agriculture or by electoral incentives.
In Table 4, we re-estimate the last specification in Table 3 (ourmost complete specification, which includes all three of ourexplanatory variables; the controls; as well as state, chamber,and Congress fixed effects), this time using each of the dependentvariables from Figs. 1–3. Several patterns immediately stand out.First, an increase in a district’s poverty rate is associated with adecrease in the likelihood that a legislator will support agriculture,often significantly so. In contrast, an increase in the median incomein a district (which, once the poverty rate is controlled for, controlsfor income inequality) is also associated with a decrease in thelikelihood that a legislator will support agriculture. In other words,legislators who represent constituencies with more poverty andmore inequality tend to be more likely to vote against agriculturalprotection. Second, the effect of agricultural committee member-ship appears to differ depending on whether one is in the Houseor in the Senate: members of the House Agricultural Committeeare anywhere from 7 to 16 percentage points more likely to votein favor of agricultural protection, but members of the Senate Agri-cultural Committee are consistently less likely to vote in favor ofagricultural protection. Third, the Republican indicator—whichcaptures how much more likely Republican lawmaker are to sup-port the legislation in question, how much higher they score onthe Farm Bureau scores, or how much more likely they are to be
a Friend of the Farm Bureau—changes signs. Fourth, on each ofthe major agricultural subsidy bills we examined, Republicanswere less likely to support the bill than Democrats or indepen-dents. Surprisingly, however, the Farm Bureau tended to rateRepublicans more favorably: on the broader set of agricultural pol-icies up for grabs in each Congress, Republicans tend to side withfarmers more often than Democrats. Fifth, Senators seem morelikely to vote in favor of agricultural protection than members ofthe House of Representatives.
Of the three factors we considered—legislator preferences, elec-toral incentives, and lobbying—electoral incentives were the mostconsistently associated with legislative action on farm bills: in allbut two specifications, the proportion of a legislator’s constituentswho were farmers was significantly associated with a greater like-lihood of supporting agricultural protection. Legislators’ own pref-erences were significantly associated with pro-farmer voting injust one specification. Lobbying in two.
In some sense, these results should come as no surprise: whenhigh-profile legislation is on the table, legislators always worryabout how their choices might be used against them come electiontime (Arnold, 1990). When legislators consider lower-profile poli-cies, however, they have more leeway. When we examine compos-ite measures of how legislators behave on a wide range ofimportant agricultural issues (columns 6 and 7 of Table 4), we findthat both lobbying and electoral incentives matter. However, whenwe narrow our focus to roll call voting on two highly-visible bills,the importance of lobbying and legislator preferences is less clear:the coefficients have the expected signs, but the relationships areconsiderably noisier. Why do lawmakers in the U.S. subsidize agri-
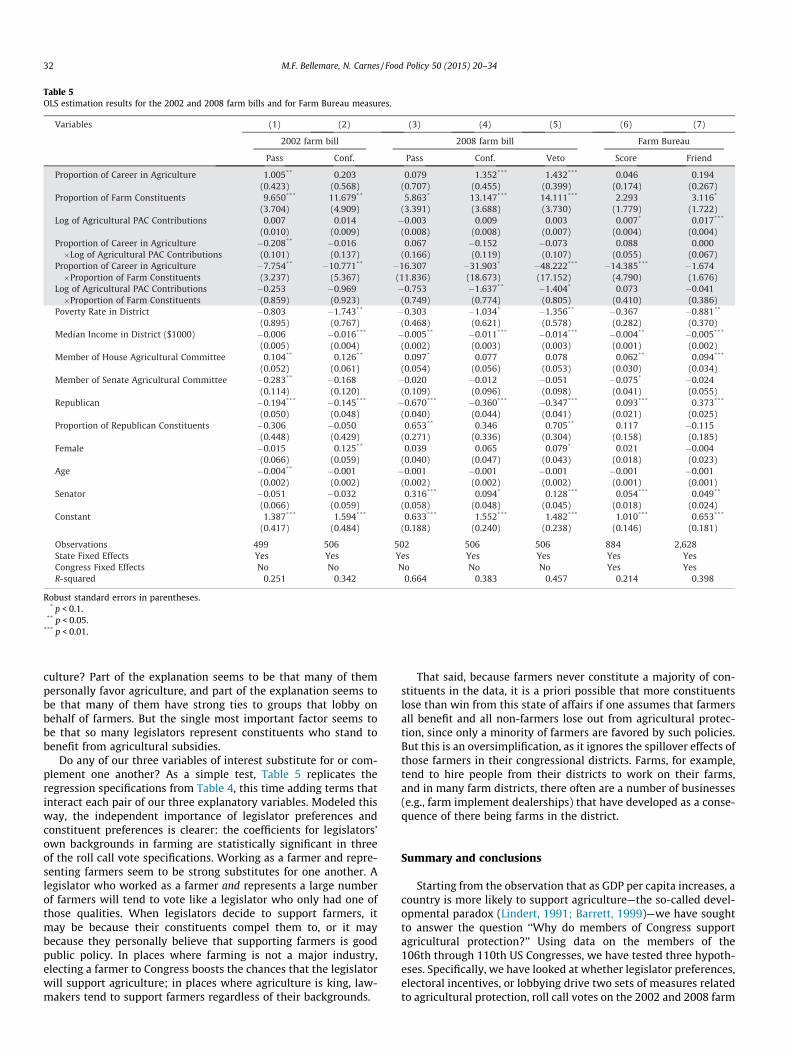
Table 5OLS estimation results for the 2002 and 2008 farm bills and for Farm Bureau measures.
Robust standard errors in parentheses.* p < 0.1.
** p < 0.05.*** p < 0.01.
32 M.F. Bellemare, N. Carnes / Food Policy 50 (2015) 20–34
culture? Part of the explanation seems to be that many of thempersonally favor agriculture, and part of the explanation seems tobe that many of them have strong ties to groups that lobby onbehalf of farmers. But the single most important factor seems tobe that so many legislators represent constituents who stand tobenefit from agricultural subsidies.
Do any of our three variables of interest substitute for or com-plement one another? As a simple test, Table 5 replicates theregression specifications from Table 4, this time adding terms thatinteract each pair of our three explanatory variables. Modeled thisway, the independent importance of legislator preferences andconstituent preferences is clearer: the coefficients for legislators’own backgrounds in farming are statistically significant in threeof the roll call vote specifications. Working as a farmer and repre-senting farmers seem to be strong substitutes for one another. Alegislator who worked as a farmer and represents a large numberof farmers will tend to vote like a legislator who only had one ofthose qualities. When legislators decide to support farmers, itmay be because their constituents compel them to, or it maybecause they personally believe that supporting farmers is goodpublic policy. In places where farming is not a major industry,electing a farmer to Congress boosts the chances that the legislatorwill support agriculture; in places where agriculture is king, law-makers tend to support farmers regardless of their backgrounds.
That said, because farmers never constitute a majority of con-stituents in the data, it is a priori possible that more constituentslose than win from this state of affairs if one assumes that farmersall benefit and all non-farmers lose out from agricultural protec-tion, since only a minority of farmers are favored by such policies.But this is an oversimplification, as it ignores the spillover effects ofthose farmers in their congressional districts. Farms, for example,tend to hire people from their districts to work on their farms,and in many farm districts, there often are a number of businesses(e.g., farm implement dealerships) that have developed as a conse-quence of there being farms in the district.
Summary and conclusions
Starting from the observation that as GDP per capita increases, acountry is more likely to support agriculture—the so-called devel-opmental paradox (Lindert, 1991; Barrett, 1999)—we have soughtto answer the question ‘‘Why do members of Congress supportagricultural protection?’’ Using data on the members of the106th through 110th US Congresses, we have tested three hypoth-eses. Specifically, we have looked at whether legislator preferences,electoral incentives, or lobbying drive two sets of measures relatedto agricultural protection, roll call votes on the 2002 and 2008 farm
M.F. Bellemare, N. Carnes / Food Policy 50 (2015) 20–34 33
bills, Farm Bureau scores, and the ‘‘Friend of the Farm Bureau’’designation.
Although all three of our competing hypotheses explain some ofthe variation in support for agricultural protection, the oneexplanation that almost always explains support for agriculturalprotection is the electoral pressure a legislator faces, i.e., the pro-portion of her constituents who are farm owners or farm manag-ers. Moreover, we find that a legislator’s preferences foragricultural protection and the degree of electoral pressure hefaces appear to be substitutes for one another.
This is not to say that lobbying doesn’t matter. If agriculturalPAC contributions were irrelevant to legislative outcomes, thosePACs would presumably find other ways to spend their money.At the margin, however, agricultural PACs do not seem to be simply‘‘buying votes.’’ As others have noted, PACs give to legislators not tochange their votes but to influence who gets elected (Abler, 1991)and to mobilize allies to do work behind the scenes (Hall andWayman, 1990). Generally speaking, our findings are close to thoseof Vesenka (1989), who found that PACs explain very little but thatideology (i.e., party affiliation) explains quite a bit of variation insupport for agricultural protection.
Our approach, of course, has a few important limitations. Firstand foremost is our inability to make causal statements. Our dataare observational and we do not have an experimental researchdesign: it would be a mistake to conclude that the relationshipsdiscussed above are causal. This is simply an inherent feature ofmost studies of legislative decision making. Our observational datacan help us test the observable implications of causal theoriesabout agricultural protection in Congress, but a complete causalstatement will have to wait for future research.
Second, much of the action on any given farm bill occurs at thecommittee level, i.e., well before the vast majority of legislatorscast a vote, and our data do not allow us to study what goes onin committees beyond controlling for agricultural committeemembership. Another promising direction for future research,then, might be to explore in greater detail the role of the Houseand Senate Agricultural Committee membership—or the role ofprior legislative precedent as a form of ‘‘path dependence’’ thatshapes the bills that eventually come to a floor vote.
Finally, although our results are not causal, they have importantpractical implications for reformers. The most consistent predictorof support for agricultural protection is the proportion of a legisla-tor’s constituents who are farm owners or farm managers. Butthose voters can only play an important role in the policy-makingprocess if other voters are in the dark about the costs they shoulderwhen Congress enacts agricultural protections (Becker, 1983). Thesolution, then, may be to educate voters about the costs and ben-efits of agricultural policy. In addition, our findings have clearimplications for advocates of agricultural protection as well. Thosewho want to see more support for agriculture in Congress couldbenefit by working to elect more legislators who personally sup-port agricultural protection. Our findings suggest one promisinggroup: If you want Congress to protect farm owners, it may be wiseto elect more farm owners. And if you want Congress to stop pro-tecting farmers, it may be wise to stop electing them.
References
Abler, David G., 1991. Campaign contributions and house voting on sugar and dairylegislation. Am. J. Agric. Econ. 73, 11–17.
Allen, Douglas W., 1991. Homesteading and property rights, or ‘How the West WasReally Won’. J. Law Econ. 34, 1–23.
Alvarez, José, 2005. Sweetening the US legislature: the remarkable success of thesugar lobby. Polit. Q. 76, 92–99.
Anderson, Kym, 1993. Lobbying incentives and the pattern of protection in rich andpoor countries. Econ. Dev. Cult. Change 43, 401–423.
Anderson, Kym, Hayami, Yujiro, 1986. The Political Economy of AgriculturalProtection. Allen and Unwin, Sydney.
Anderson, Kym, Rausser, Gordon, Swinnen, Johan, 2013. Political economy of publicpolicies: insights from distortions to agricultural and food markets. J. Econ.Literature 51, 423–477.
Arnold, R. Douglas, 1990. The Logic of Congressional Action. Yale University Press,New Haven, CT.
Assman, Christian, Henning, Christian, Krampe, Eva, 2012. Constitutional Rules,Informal Institutions, and Agricultural Protection in Developing and IndustrialCountries: Theory and Empirical Evidence. Working Paper. University ofBamberg.
Barrett, Christopher B., 1999. The microeconomics of the developmental paradox:on the political economy of food price policy. Agric. Econ. 20, 159–172.
Bates, Robert, 1981. Markets and States in Tropical Africa. University of CaliforniaPress, Berkeley, CA.
Becker, Gary, 1983. A theory of competition among pressure groups for politicalinfluence. Quart. J. Econ. 98, 371–400.
Beghin, John C., Kherallah, Mylène, 1994. Political institutions and internationalpatterns of agricultural protection. Rev. Econ. Stat. 76, 482–489.
Bellemare, Marc F., 2014. Rising food prices, food price volatility, and social unrest.Am. J. Agric. Econ. (forthcoming).
Bellemare, Marc F., Barrett, Christopher B., Just, David R., 2013. The welfare impactsof commodity price volatility: evidence from rural Ethiopia. Am. J. Agric. Econ.95, 877–899.
Brooks, Jonathan, 1997. Congressional voting on farm payment limitations: politicalpressure or ideological conviction? J. Agric. Resour. Econ. 22 (2), 281–295.
Brooks, Jonathan C., Carter, Colin A., 1995. The Political Economy of US AgriculturalPolicy. Australian Bureau of Agricultural and Resource Economics, Canberra.
Brooks, Jonathan C., Cameron, A. Colin, Carter, Colin A., 1998. Political actioncommittee contributions and U.S. congressional voting on sugar legislation. Am.J. Agric. Econ. 80, 441–454.
Bullock, David S., Coggins, Jay S., 2008. Do farmers receive huge rents for smalllobbying efforts? In: Tweeten, Luther G., Thompson, Stanley R. (Eds.),Agricultural Policy for the 21st Century. Wiley, New York.
Burden, Barry C., 2007. The Personal Roots of Representation. Princeton UniversityPress, Princeton.
Carnes, Nicholas, 2012. Does the numerical underrepresentation of the workingclass in congress matter? Legis. Stud. Q. 37, 5–34.
Carnes, Nicholas, 2013. White-Collar Government: The Hidden Role of Class inEconomic Policy Making. University of Chicago Press, Chicago.
Carnes, Nicholas [producer and distributor], 2011. Congressional Leadership andSocial Status [dataset].
Cato Institute, 2009. Cato Handbook for Policymakers, seventh ed. Cato Institute,Washington, DC.
Center for Responsive Politics [producer and distributor], 2012. Bulk Data [dataset],OpenSecrets.org.
Cochrane, Willard, 1958. Farm Prices: Myth and Reality. University of MinnesotaPress, Minneapolis, MN.
Coughlin, Peter J., 1992. Probabilistic Voting Theory. Cambridge University Press,Cambridge.
de Gorter, Harry, Just, David R., 2009. The economics of a blend mandate forbiofuels. Am. J. Agric. Econ. 91 (3), 738–750.
de Gorter, Harry, Swinnen, Johan, 2002. Political economy of agricultural policy. In:Gardner, Bruce L., Rausser, Gordon C. (Eds.), Handbook of AgriculturalEconomics, vol. 2B. Elsevier-North Holland, Amsterdam.
Denzau, Arthur C., Munger, Michael C., 1986. Legislators and interest groups: howunorganized interests get represented. Am. Polit. Sci. Rev. 80, 89–106.
Downs, Anthony, 1957. An Economic Theory of Democracy. Harper and Row, NewYork.
Ferejohn, John, 1986. Logrolling in an institutional context: a case study of foodstamp legislation. In: Wright, Gerald C., Rieselbach, Leroy N., Dodd, Lawrence C.(Eds.), Congress and Policy Change. Agathon Press, New York.
FRAC, 2011. Households Receiving Food Stamps (SNAP) by Congressional District,2011. <http://frac.org/pdf/acs2011_1year_household_snap_congressionaldistricts_bystate.pdf> (accessed17.07.13).
Gardner, Bruce L., 2006. American Agriculture in the Twentieth Century: How ItFlourished and What It Cost. Harvard University Press, Cambridge, MA.
Gawande, Kishore, Hoekman, Bernard, 2006. Lobbying and agricultural trade policyin the United States. Int. Org. 60, 527–561.
Giles, Dave, 2013. Robust Standard Errors for Nonlinear Models. <http://davegiles.blogspot.com/2013/05/robust-standard-errors-for-nonlinear.html>(accessed 14.06.13).
Greene, William H., 2012. Econometric Analysis. Prentice Hall, Upper Saddle River,NJ.
Grossman, Gene M., Helpman, Elhanan, 1994. Protection for sale. Am. Econ. Rev. 84,833–850.
Grossman, Gene M., Helpman, Elhanan, 1996. Electoral competition and specialinterest politics. Rev. Econ. Stud. 63, 265–286.
Hall, Richard L., Deardorff, Alan V., 2006. Lobbying as legislative subsidy. Am. Polit.Sci. Rev. 100, 69–84.
Hall, Richard L., Wayman, Frank W., 1990. Buying time: moneyed interests and themobilization of bias in congressional committees. Am. Polit. Sci. Rev. 84, 797–820.
Hansen, John Mark, 1991. Gaining Access: Congress and the Farm Lobby, 1919–1981. University of Chicago Press, Chicago.
Hausman, Jerry A., Abrevaya, Jason, Scott-Morton, Fiona M., 1999. Misclassificationof the dependent variable in a discrete-response setting. J. Econ. 87, 239–269.

34 M.F. Bellemare, N. Carnes / Food Policy 50 (2015) 20–34
Hayami, Yujiro, Ruttan, Vernon W., 1985. Agricultural Development: An InternationalPerspective, second ed. Johns Hopkins University Press, Baltimore, MD.
Heckman, James J., 1981. The incidental parameters problem and the problem ofinitial conditions in estimating a discrete time-discrete data stochastic process.In: Manski, Charles F., McFadden, Daniel. (Eds.), Structural Analysis of DiscreteData and Econometric Applications. MIT Press, Cambridge, MA.
Hicks, John R., 1932. The Theory of Wages. MacMillan, London.Internal Revenue Service, 2013. SOI Tax Stats – Individual Statistical Tables by Size
of Adjusted Gross Income. <http://www.irs.gov/uac/SOI-Tax-Stats—Individual-Statistical-Tables-by-Size-of-Adjusted-Gross-Income> (accessed 18.05.13).
Klomp, Jeroen., de Haan, Jakob., 2013. Conditional election and partisan cycles ingovernment support to the agricultural sector: an empirical analysis. Am. J.Agric. Econ. 95 (4), 793–818.
Knutson, Ronald D., Penn, J.B., Flinchbaugh, Barry L., Outlaw, Joe L., 2007.Agricultural and Food Policy, sixth ed. Prentice Hall, Upper Saddle River, NJ.
Levitt, Steven D., 1998. Are PACs trying to influence politicians or voters? Econ.Politics 10 (1), 19–35.
Lindert, Peter H., 1991. Historical patterns of agricultural policy. In: Peter Timmer,C. (Ed.), Agriculture and the State. Cornell University Press, Ithaca.
Lipton, Michael, 1977. Why Poor People Stay Poor: Urban Bias in WorldDevelopment. Harvard University Press, Cambridge, MA.
Lopez, Rigoberto A., 2001. Campaign contributions and agricultural subsidies. Econ.Politics 13 (3), 257–279.
Miller, Warren E., Stokes, Donald E., 1963. Constituency influence in congress. Am.Polit. Sci. Rev. 57, 45–56.
Mitra, Devashish, Thomakos, Dimitrios D., Ulubasoglu, Mehmet, 2003. ‘Protectionfor Sale’ in a developing country: democracy vs. dictatorship. Rev. Econ. Stat. 84(3), 497–508.
Nestle, Marion, 2013. The Farm Bill Farce: 227 Amendments. <http://www.foodpolitics.com/2013/06/ the-farm-bill-farce-227-amendments/> (accessed21.07.13).
Olson, Mancur, 1971. The Logic of Collective Action: Public Goods and the Theory ofGroups. Harvard University Press, Cambridge, MA.
Orden, David, Paarlberg, Robert, Roe, Terry, 1999. Policy Reform in AmericanAgriculture. University of Chicago Press, Chicago.
Paarlberg, Robert, 2011. Food Politics. Oxford University Press, Oxford.Paarlberg, Robert, Paarlberg, Don, 2000. Agricultural policy in the twentieth
century. Agric. Hist. 74, 136–161.Park, Jong Hee, Jensen, Nathan M., 2007. Electoral competition and agricultural
support in OECD countries. Am. J. Polit. Sci. 51, 314–329.
Poole, Keith T., Rosenthal, Howard, 1996. Are legislators ideologues or agents oftheir constituents? Eur. Econ. Rev. 40, 707–717.
Rosas, Guillermo, Shomer, Yael, Haptonstahl, Stephen R., 2012. No News Is News:Non-Ignorable Non-Response in Roll-Call Data Analysis. Working Paper.Washington University.
Schmitz, Andrew, Moss, Charles B., Schmitz, Troy G., Furtan, Hartley W., CaroleSchmitz, H., 2010. Agricultural Policy, Agribusiness, and Rent-Seeking Behavior.University of Toronto Press, Toronto.
Sheingate, Adam, 2003. The Rise of the Agricultural Welfare State: Institutions andInterest Group Power in the United States, France, and Japan. PrincetonUniversity Press, Princeton.
Skocpol, Theda, Finegold, Kenneth, 1982. State capacity and economic interventionin the early new deal. Polit. Sci. Q. 97, 255–278.
Swinnen, Johan, 1994. A positive theory of agricultural protection. Am. J. Agric.Econ. 76, 1–14.
Swinnen, Johan, 2010. The political economy of agricultural and food policies:recent contributions, new insights, and areas for further research. Appl. Econ.Perspect. Policy 32, 33–58.
Swinnen, Johan, de Gorter, Harry, 1993. Why small groups and low-income sectorsobtain subsidies: the ‘Altruistic’ side of a ‘Self-Interested’ government. Econ.Politics 5, 285–293.
Thies, Cameron G., Porche, Schuyler, 2007. The political economy of agriculturalprotection. J. Politics 69, 116–127.
Thomson, H., 2013. Food and Power: The Political Economy of Agricultural Policyunder Authoritarian Regimes. Working Paper. University of Minnesota.
US Government Printing Office, 2013a. Public Law 110-234 – Food, Conservation,and Energy Act of 2008. <http://www.gpo.gov/fdsys/pkg/PLAW-110publ234/pdf/PLAW-110publ234.pdf> (accessed 18.05.13).
US Government Printing Office, 2013b. Public Law 104-127 – Federal AgricultureImprovement and Reform Act of 1996. <http://www.gpo.gov/fdsys/pkg/PLAW-104publ127/content-detail.html> (accessed 20.05.13).
US Government Printing Office, 2013c. Public Law 107-171 – Food Security andRural Investment Act of 2002. <http://www.gpo.gov/fdsys/pkg/PLAW-107publ171/content-detail.html> (accessed 20.05.13).
US Government Printing Office, 2013d. Public Law 110-234 – Food, Conservation,and Energy Act of 2008. <http://www.gpo.gov/fdsys/pkg/PLAW-110publ234/content-detail.html> (accessed 20.05.13).
Vesenka, Mary H., 1989. Economic interests and ideological conviction: a note onPACs and agricultural acts. J. Econ. Behav. Organ. 12, 259–263.
World Bank, 1986. World Development Report. Oxford University Press, Oxford.