Why Do Low-Educated Workers Invest Less in Further Training?ftp.iza.org/dp5180.pdf · Why Do...
32
DISCUSSION PAPER SERIES Forschungsinstitut zur Zukunft der Arbeit Institute for the Study of Labor Why Do Low-Educated Workers Invest Less in Further Training? IZA DP No. 5180 September 2010 Didier Fouarge Trudie Schils Andries de Grip
Transcript of Why Do Low-Educated Workers Invest Less in Further Training?ftp.iza.org/dp5180.pdf · Why Do...

DI
SC
US
SI
ON
P
AP
ER
S
ER
IE
S
Forschungsinstitut zur Zukunft der ArbeitInstitute for the Study of Labor
Why Do Low-Educated Workers Invest Less in Further Training?
IZA DP No. 5180
September 2010
Didier FouargeTrudie SchilsAndries de Grip

Why Do Low-Educated Workers Invest Less in Further Training?
Didier Fouarge ROA, Maastricht University
Trudie Schils Maastricht University
Andries de Grip
ROA, Maastricht University and IZA
Discussion Paper No. 5180 September 2010
IZA
P.O. Box 7240 53072 Bonn
Germany
Phone: +49-228-3894-0 Fax: +49-228-3894-180
E-mail: [email protected]
Any opinions expressed here are those of the author(s) and not those of IZA. Research published in this series may include views on policy, but the institute itself takes no institutional policy positions. The Institute for the Study of Labor (IZA) in Bonn is a local and virtual international research center and a place of communication between science, politics and business. IZA is an independent nonprofit organization supported by Deutsche Post Foundation. The center is associated with the University of Bonn and offers a stimulating research environment through its international network, workshops and conferences, data service, project support, research visits and doctoral program. IZA engages in (i) original and internationally competitive research in all fields of labor economics, (ii) development of policy concepts, and (iii) dissemination of research results and concepts to the interested public. IZA Discussion Papers often represent preliminary work and are circulated to encourage discussion. Citation of such a paper should account for its provisional character. A revised version may be available directly from the author.

IZA Discussion Paper No. 5180 September 2010
ABSTRACT
Why Do Low-Educated Workers Invest Less in Further Training?* Several studies document the fact that low-educated workers participate less often in further training than high-educated workers. The economic literature suggests that there is no significant difference in employer willingness to train low-educated workers, which leaves the question of why the low educated invest less in training unanswered. This paper investigates two possible explanations: Low-educated workers invest less in training because of 1) the lower economic returns to these investments or 2) their lower willingness to participate in training. Controlling for unobserved heterogeneity that can affect the probability of enrolling into training, we find that the economic returns to training for low-educated workers are positive and not significantly different from those for high-educated workers. However, low-educated workers are significantly less willing to participate in training. This lesser willingness to participate in training is driven by economic preferences (future orientation, preference for leisure), as well as personality traits (locus of control, exam anxiety, and openness to experience). JEL Classification: J24, J31, C21 Keywords: returns to training, preferences, non-cognitive skills Corresponding author: Didier Fouarge ROA, Maastricht University PO Box 616 6200 MD Maastricht The Netherlands E-mail: [email protected]
* We thank Eric Bonsang, Bart Golsteyn, Renske Jongsma, Olivier Marie, and participants of the LOPSI conference in Milan, the Education in Adulthood and the Labour Market workshop in Nuremberg, the ESPE conference in Essen, and the International Workshop on Applied Economics of Education in Catanzaro for their useful comments on earlier versions of this paper.
2
1 Introduction The fact that low-educated workers participate less often in further training is well documented in the economic literature (Bassanini et al., 2007). Booth and Bryan (2002) show that firms often pay for their workers’ training, even when it is general, and Leuven and Oosterbeek (1999) and Maximiano and Oosterbeek (2007) find that there is no significant difference between firms’ willingness to train low- and high-educated workers. This paper therefore focuses on explaining the difference in training participation between the high and low educated from the workers’ perspective. We contribute to the literature by investigating two alternative explanations: Low-educated workers invest less in further training because of 1) lower economic returns to such investments or 2) their lower willingness to participate in training due to different preferences or personality traits. In doing so, our contribution is twofold. First, only a few studies investigate the heterogeneity in returns to training across different types of workers, such as low and high educated.1 We provide estimates of the returns to training by education level. Second, a worker’s motivation to participate in training is usually unobserved and therefore left as a black box. The data we use enable us to open this box and focus on specific economic preferences, such as future orientation and preference for leisure, and personality traits such as the individual’s locus of control, exam anxiety, and the Big Five personality traits (Borghans et al., 2008a). Using data on Dutch workers, we find that the economic returns to training—in terms of higher wages—for the low educated are positive and not significantly different from those for high-educated workers. This finding is robust to a number of specification tests. Nonetheless, we find that low-educated workers have a significantly lower willingness to participate in training than high-educated workers, because of different economic preferences (future orientation, preference for leisure) as well as personality traits (locus of control, exam anxiety, and openness to experience). The paper continues as follows. Section 2 presents a brief overview of the relevant literature. Section 3 exposes the data and defines the main concepts used, and Section 4 presents the methods used for the analysis. Section 5 discusses the estimation results. Finally, Section 6 presents our conclusions.
1 Bassanini and Ok (2007) discuss such heterogeneity in returns to training in a number of European countries.
3
2 Related literature Economic returns to training can be derived from a higher wage as well as a higher probability of staying employed. Empirical evidence indicates a positive relation between participation in training and wages. The strength of this relation, however, differs across studies, depending on the country, time period, and methodological approach (Booth et al., 2003; Frazis & Loewenstein, 2005; Hill, 2001; Leuven & Oosterbeek, 2004, 2008). There are a few studies that investigate the differences in the returns to training between low- and high-educated workers, but with mixed results. While Kuckulenz and Zwick (2004) find a smaller return to training for the low educated in Germany, Lynch (1992) finds no skill-related differences in the United States. Conversely, a study by the Organisation for Economic Co-operation and Development (OECD) shows a larger return to training for the low educated in France, the Netherlands, and the United Kingdom (OECD, 1999). Larger returns for the low educated are also found in Portugal (Budría & Pereira, 2007) and a number of other European countries (Brunello, 2004). Apart from the expected economic returns to training, low-educated workers may also not participate in training because they are simply less willing to do so. Borghans et al. (2008a) suggest that participation in training is driven by cognitive skills, as well as economic preferences (such as time discounting, risk preference, and preference for leisure) and personality traits (i.e., “noncognitive skills,” such as the Big Five personality factors, locus of control, and self-esteem). It can be argued that these preferences and personality traits affect training participation both directly and indirectly. First, psychological research by Colquitt et al. (2000) shows that personality traits have a direct and significant effect on both the motivation of employees to train and learning outcomes. Second, personality traits affect training participation indirectly through the worker’s educational attainment. Jacob (2002) provides evidence for the role of noncognitive skills on educational attainment, and Borghans et al. (2008b) show that persons with favorable noncognitive skills perform best in cognitive tests. Cognitive skills, in turn, largely determine a worker’s level of education, as shown by Heckman et al. (2006). Initial education and job-related training are expected to be complementary, since higher ability lowers the costs of training. Nevertheless, others argue that the low educated might feel a greater need to invest in their human capital to palliate their skills shortcomings and remain employable in the knowledge economy (Barron et al., 1989). However, empirical evidence suggests that initial schooling and job-related training are complementary (Van Smoorenburg & Van der Velden, 2000).
4
Only a few studies attempt to test workers’ willingness to participate in job-related training. These studies usually show a positive relation between a worker’s readiness to participate in training and their actual training participation (Noe & Wilk, 1993; Maurer & Tarulli, 1994) but make no distinctions with respect to the workers’ levels of education. However, a qualitative observational study reported by Illeris (2005) indicates that the low educated have a subjective feeling of ambivalence toward job-related training; that is, most of them have had negative experiences in school and thus want to avoid any form of training whatsoever in later life. In addition, Tharenou (2001) argues that negative experiences (e.g., failure in taking exams) in the earlier schooling life of the low educated can further reduce their willingness to participate in training. 3 Data The analyses in this paper are based on three surveys that are representative of the Dutch labor force: the Dutch Institute for Labour Studies’ (OSA) Labour Supply Panel (1986–2006) to study the economic returns to on-the-job training and the Research Centre for Education and the Labour Market (ROA) Lifelong Learning Survey (2004 and 2007) and the Dutch Central Bank (DNB) Household Survey (2004, 2005, and 2007) to study workers’ willingness to train. We selected individuals aged 18–64 years old.2 Following Steedman and McIntosh (2001), we distinguish three levels of education using the International Standard Classification of Education (ISCED): low (ISCED 0–2), intermediate (ISCED 3), and high (ISCED 5–7). 3.1 Economic returns of training To analyze economic returns to training, we use the OSA Labour Supply Panel, a biennial survey with repeated measurements among the same individuals. Each wave has data for some 4,500 individuals in about 2,000 households. The data are organized as a person–period file. The survey contains information on worker training participation, labor market status, and wages, enabling us to investigate private returns to training investments. As in most other studies (e.g., Bassanini et al., 2007), training is measured as participation in work-related courses in the previous two years, excluding courses taken as a hobby. In 2006, 44% of all workers reported that they had participated in one or more training courses in the previous two years. However, as Figure 1 shows, this percentage differs significantly across education levels. In 2006, more than half of
2 Restricting the sample to people aged 18–54 yields similar results.

5
the high-educated workers (53%) reported training participation in the previous two years, while the training incidence of intermediate-educated workers was 44%. However, the corresponding percentage among the low educated was merely 30%.3 Training participation increased in the observation period across all education levels. However, despite the increase in training incidence, the difference in training incidence between low- and high-educated workers, as well as between intermediate- and high-educated workers, has been increasing since 1996.4 [Figure 1 about here] We use wage information to assess the economic return to training. Our measurement of wage is the net monthly wage.5 The expectation is that training participation in the previous two years is associated with a higher wage. The econometric analyses are based on the waves 1994–2006 because two of the necessary variables are lacking for the years prior to 1994: tenure and total labor market experience. Descriptive statistics for our estimation sample are reported in Appendix A. 3.2 Willingness to participate in training Willingness to participate in training is investigated using the ROA Lifelong Learning Survey. This survey was fielded in 2004 and 2007 among a representative sample of the Dutch labor force. The data were gathered as part of the CentERdata (Tilburg University) panel, a well-established web-based panel of some 2,000 Dutch households. Sample statistics for these data are reported in Appendix B. The DNB Household Survey is also a web-based survey that is part of the CentERdata panel. It contains information on economic preferences and personality.6 These data were matched to the ROA Lifelong Learning Survey at the individual level, since the survey was fielded among the same panel respondents. The ROA Lifelong Learning Survey contains information on stated preferences with respect to participating in training that we use to identify differences in workers’ training willingness. At the start of the 2004 and 2007 surveys, respondents were asked to report four competencies (e.g., flexibility, administrative skills, commercial insight, and people skills) that are important to doing their job successfully, to be
3 Data on the workload associated with the training are not consistently available over the years. 4 Evidence of a growing gap in the training participation of low- and high-educated workers is also found in Germany (Riphahn & Trübswetter, 2007). 5 Our analyses control for the number of hours worked. 6 These data were previously used, for example, to study the effect of personality on earnings (Nyhus & Pons, 2005).

6
picked from a list of 26 competencies.7 Later in the questionnaire respondents were asked which of the four competencies they would prefer to be trained in if a course were provided to them during working hours, at their employer’s expenses. Then the training intention question was asked, stating that the course would be during workings hours and paid for by the employer, but that it would involve a limited time investment during leisure time. The question is as follows: “How likely are you to take on training in [the respondent’s preferred competency in which to train] if it would take you one evening (of your leisure time) a week during half a year?” This approach is novel in the sense that it elicits people’s willingness to train skills that are directly relevant to them in their job. Respondents answered the training intention question on a five-point scale, with the following categories: 1, very unlikely; 2, somewhat unlikely; 3, neither likely nor unlikely; 4, somewhat likely; and 5, very likely. Because respondents indicated that the skill was important to their job and that they would prefer to train this particular skill over others, the answers to this last question can be used to evaluate the respondent’s willingness to train. On average, low-educated workers appear to be less inclined to participate in training than high-educated workers. The mean value for the low-educated workers’ answers is 2.8, while it is 3.2 for high-educated workers. This difference is statistically significant. Workers with an intermediate level of education score 3.1, which is not statistically different from the high-educated workers’ score. Economic preferences We use information on economic preferences and personality traits to explain a worker’s willingness to participate in training. Economic preferences are measured by preference for leisure and the individual’s future orientation. A worker’s preference for leisure is expected to play a role in the decision of whether or not to train because training requires a time investment, time that could also be allocated to activities such as leisure. The preference for leisure is derived from one question that follows the training intention question in the 2004 ROA Lifelong Learning Survey. Regardless of their actual answer to the training intention question, respondents were asked whether the fact that they “would prefer to do something else in the evening” was a reason for them not to take training. The answer was given on a seven-point scale ranging from “disagree completely” to “agree completely”, and was standardized.8
7 The three most important competencies were the same, irrespective of education level, with people skills being the most frequently reported competency, followed by occupation-specific skills and communication skills. 8 One could argue that the relation between economic preferences and personality traits, on the one hand, and the willingness to train is not necessarily linear. However, Mueller and Plug (2006), who investigate the effect of personality on earnings, show that personality traits can be used linearly.
7
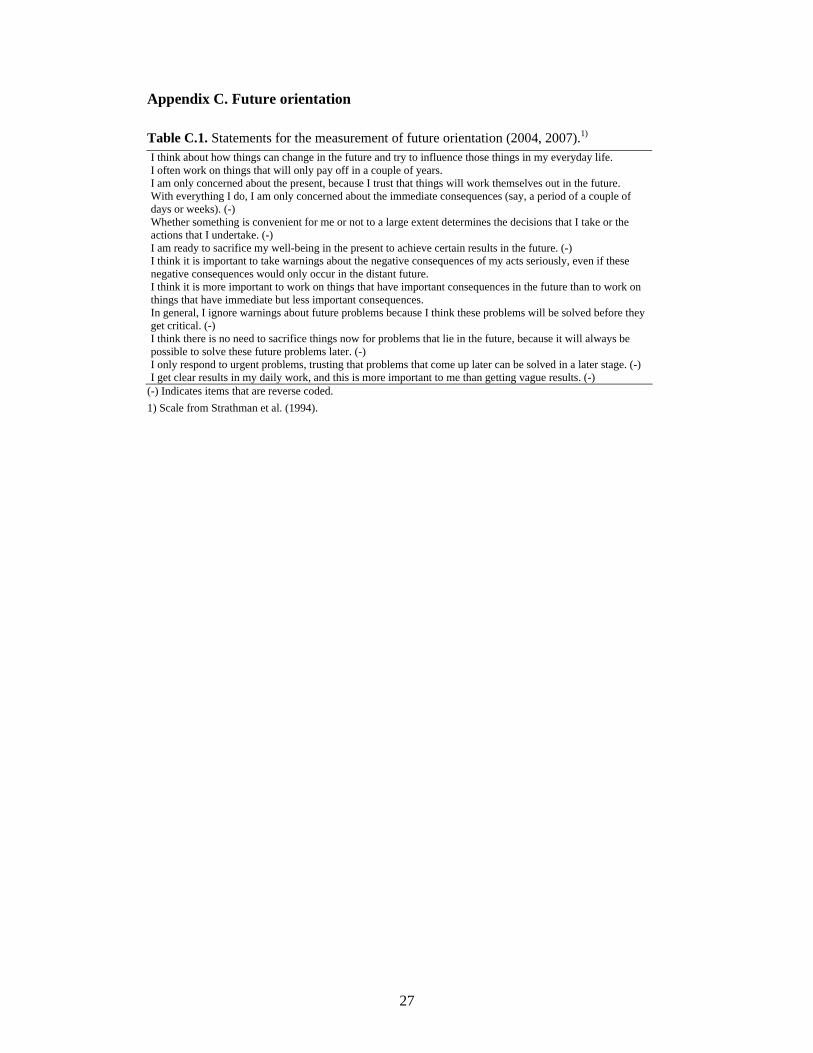
As suggested by Borghans et al. (2008a), investments in training can also be affected by an individual’s time perspective or future orientation. Future orientation indicates people’s time horizons or the extent to which they consider the distant consequences of their actions, rather than just the immediate ones, in spite of the fact that it might take effort today to achieve a desirable outcome in the future.9 Future orientation—which is allowed to vary over time—is measured in the 2004 and 2007 waves of the DNB Household Survey using the 12-item scale suggested by Strathman et al. (1994). It contains items such as the following: “I am ready to sacrifice my well-being in the present to achieve certain results in the future,” “I often work on things that will only pay off in a couple of years,” and “With everything I do, I am only concerned about the immediate consequences” (the full list of statements is reported in Appendix C). Answers were given on a seven-point scale ranging from “does not at all apply to me” to “really applies to me.” We constructed a single measure of future orientation based on the standardized average of the answers. Higher values indicate a stronger future orientation. The scale reliability (Cronbach’s alpha) equals 0.75 in 2004 and 0.73 in 2007.10 Personality traits Personality traits are assessed by the psychological cost of training (as indicated by exam anxiety), the economic locus of control, and the Big Five personality test. Research in the psychology of education suggests that exam anxiety inhibits school achievement (Hembree, 1988). In particular, for many low-educated workers, exam anxiety is a pervasive problem that inhibits learning activities (Pekrun, 1992). Our measure of exam anxiety is based on a question that follows the training intention question in the 2004 ROA Lifelong Learning Survey. Respondents were asked (regardless of their actual answer to the training intention question) whether the fact that they “find it scary to take an exam again” would be a reason for them not to take training. Answers were given on a seven-point scale ranging from “disagree completely” to “agree completely” and were standardized. The concept of locus of control was first introduced by Rotter (1966) and refers to individuals’ beliefs about whether they are able to control the events in their lives. The literature suggests that locus of control is domain specific (Lefcourt et al., 1979). In particular, Furnham (1986) develops a scale for a person’s economic locus of control that has been shown to correlate better with individuals’ investment decisions
9 The concept of future orientation is highly related to an individual’s time preference and is also seen as a determinant of human capital investments (Killingsworth, 1982). 10 Using factor scores rather than a summary index does not affect our findings.

8
than the original Rotter scale (see, e.g., Plunkett & Buehner, 2007). Furnham’s original economic locus of control focuses on four dimensions: internal (belief that one determines one’s own economic fate), chance (belief that chance determines one’s economic fate), external/denial (belief that economic misfortune is overstated), and powerful others (belief that powerful people determine one’s economic fate). The 2005 and 2007 waves of the DNB Household Survey allow us to measure the first two dimensions of Furnham’s economic locus of control: the internal and chance dimensions.11 The internal dimension of the economic locus of control is measured using seven statements such as, “My life is determined by my own actions” and “I am usually able to protect my personal interests.”12 The statements were answered on a seven-point scale ranging from “disagree completely” to “agree completely.” The average score (standardized) on these statements is used to measure the internal locus of control, with increasing values revealing a stronger internal economic locus of control. The scale reliability equals 0.67 in 2005 and 0.70 in 2007. The chance dimension is measured using five statements such as “It is chiefly a matter of fate whether I become rich or poor” and “There is little one can do to prevent poverty.” Again, the average score (standardized) on these statements is used to measure the chance dimension of locus of control, with increasing values indicating a stronger belief that economic outcomes are determined by fate. The scale reliability equals 0.71 in 2005 and 0.76 in 2007. The expectation is that individuals with a strong internal locus of control will invest more in training to get a better grasp on their future labor market position. In parallel, individuals who rely on chance are expected to invest less in training.
11 Locus of control is not assumed to be time constant. 12 The full list of statements is reported in Appendix D.

9
Personality is assessed using the Big Five taxonomy, according to which personality is broken down into five main dimensions (Goldberg, 1992): openness to experience (intellectual curiosity, imagination), conscientiousness (self-discipline, aim for achievement), extraversion (enjoying being with others, being full of energy), agreeableness (consideration, friendliness), and neuroticism (emotional instability, negative emotions). Personality traits are measured in the 2005 DNB Household Survey with the 50-item scale from the International Personality Item Pool (Goldberg, 1999).13 Factor analysis is used to derive the five personality dimensions.14 Conscientiousness and openness to experience are particularly expected to correlate with willingness to train, since these are indicative of a person’s eagerness to learn (De Haan & Schouwenburg, 1996). The indicators derived from the 2004 and 2005 DNB Household Survey are matched to the corresponding respondents in the 2004 ROA Lifelong Learning Survey. Indicators derived from the 2007 DNB Household Survey are matched to the 2007 respondents of the ROA Lifelong Learning Survey. The analyses using the Big Five taxonomy, preference for leisure, and exam anxiety are constrained to the 2004 wave of the ROA Lifelong Learning Survey. Despite the fact that both datasets pertain in principle to the same set of respondents, in a number of cases no match for the ROA Lifelong Learning Survey respondents could be found in the DNB Household Survey. Of the 1,290 working individuals of the 2004 ROA Lifelong Learning Survey, 217 cases could not be matched to the 2004 DNB Household Survey, and 276 cases could not be matched to the 2005 DNB Survey. Of all 941 working individuals in the 2007 ROA Lifelong Learning Survey, 106 cases could not be matched to the 2007 DNB Household Survey. For those cases that could not be matched, we set the measures for preferences and personality traits equal to zero and include a dummy variable in the models indicating when the factor is missing. In the estimation, none of these dummies turn out to be significant. 4 Empirical models 4.1 Economic returns to training To assess the economic returns to training, we estimate a fixed effects wage regression for the effect of training on wage according to the following equation:
13 See http://ipip.ori.org/New_IPIP-50-item-scale.htm. 14 We use principal component factor analysis with promax rotation to allow for correlation across factors. We imposed a five-factor solution in anticipation of the underlying factor structure. The 50 items and their factor loadings are reported in Appendix E. The full results are available from the author.
10
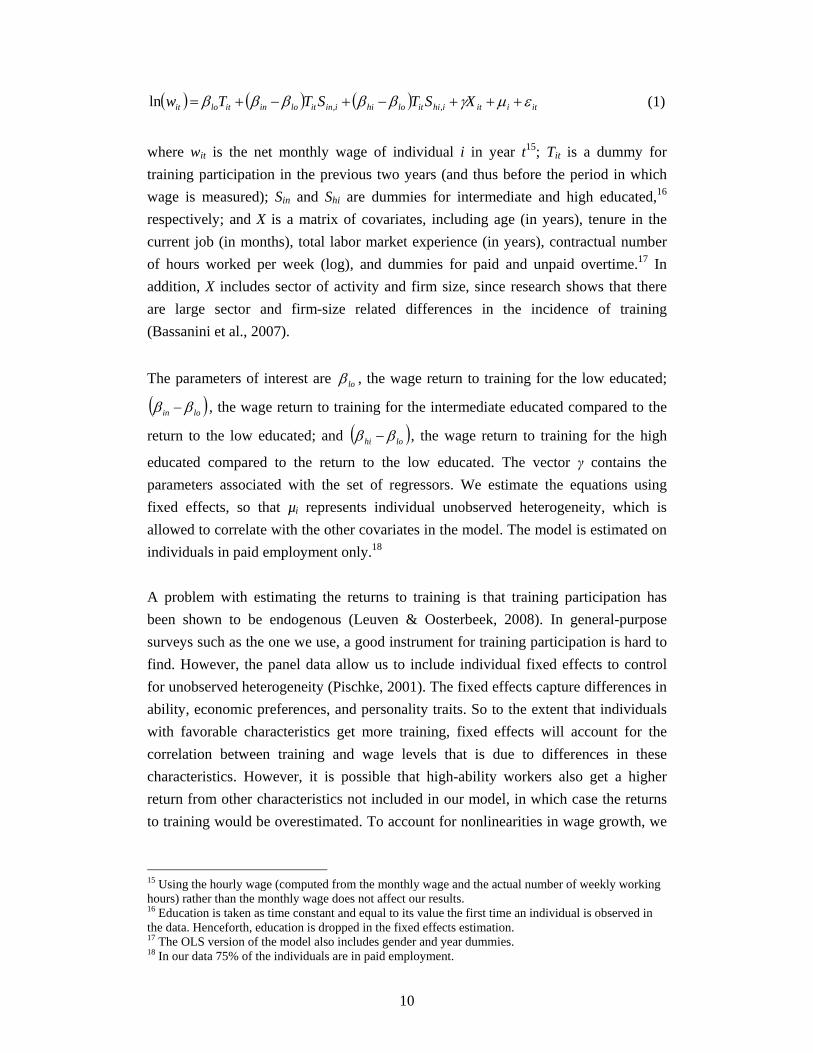
( ) ( ) ( ) itiitihiitlohiiinitloinitloit XSTSTTw εµγβββββ +++−+−+= ,,ln (1)
where wit is the net monthly wage of individual i in year t15; Tit is a dummy for training participation in the previous two years (and thus before the period in which wage is measured); Sin and Shi are dummies for intermediate and high educated,16 respectively; and X is a matrix of covariates, including age (in years), tenure in the current job (in months), total labor market experience (in years), contractual number of hours worked per week (log), and dummies for paid and unpaid overtime.17 In addition, X includes sector of activity and firm size, since research shows that there are large sector and firm-size related differences in the incidence of training (Bassanini et al., 2007). The parameters of interest are loβ , the wage return to training for the low educated;
( )loin ββ − , the wage return to training for the intermediate educated compared to the
return to the low educated; and ( )lohi ββ − , the wage return to training for the high
educated compared to the return to the low educated. The vector γ contains the parameters associated with the set of regressors. We estimate the equations using fixed effects, so that µi represents individual unobserved heterogeneity, which is allowed to correlate with the other covariates in the model. The model is estimated on individuals in paid employment only.18 A problem with estimating the returns to training is that training participation has been shown to be endogenous (Leuven & Oosterbeek, 2008). In general-purpose surveys such as the one we use, a good instrument for training participation is hard to find. However, the panel data allow us to include individual fixed effects to control for unobserved heterogeneity (Pischke, 2001). The fixed effects capture differences in ability, economic preferences, and personality traits. So to the extent that individuals with favorable characteristics get more training, fixed effects will account for the correlation between training and wage levels that is due to differences in these characteristics. However, it is possible that high-ability workers also get a higher return from other characteristics not included in our model, in which case the returns to training would be overestimated. To account for nonlinearities in wage growth, we
15 Using the hourly wage (computed from the monthly wage and the actual number of weekly working hours) rather than the monthly wage does not affect our results. 16 Education is taken as time constant and equal to its value the first time an individual is observed in the data. Henceforth, education is dropped in the fixed effects estimation. 17 The OLS version of the model also includes gender and year dummies. 18 In our data 75% of the individuals are in paid employment.
11
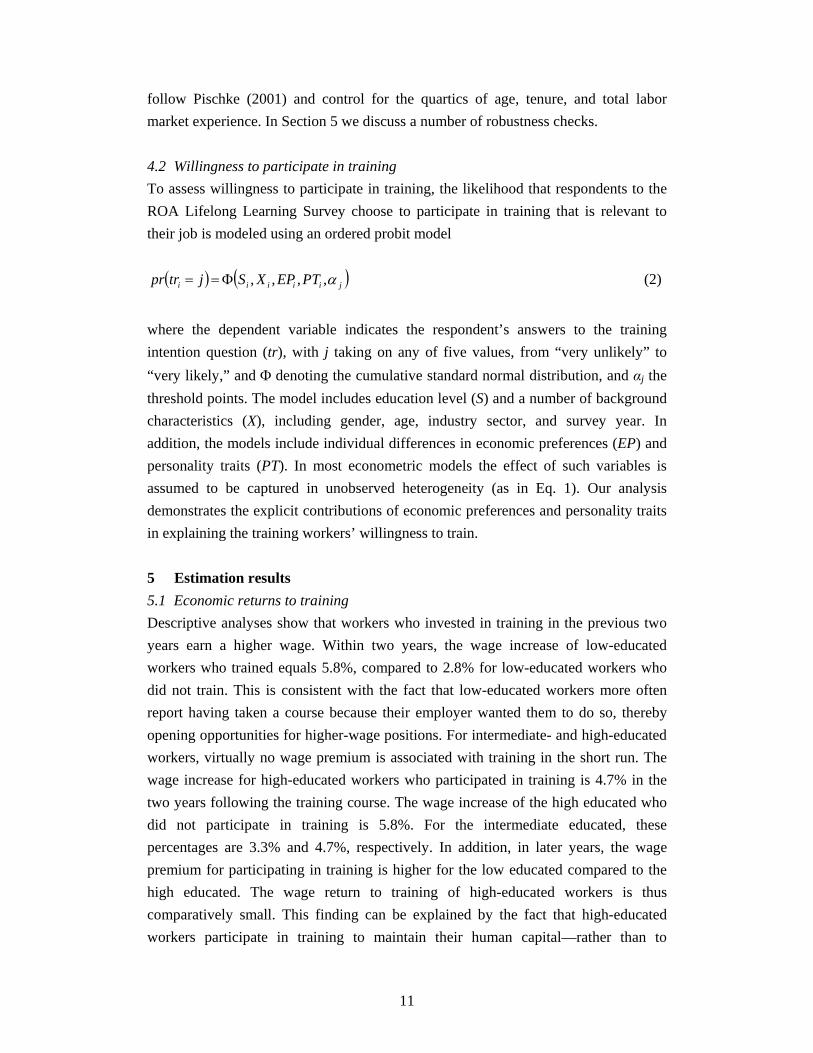
follow Pischke (2001) and control for the quartics of age, tenure, and total labor market experience. In Section 5 we discuss a number of robustness checks. 4.2 Willingness to participate in training To assess willingness to participate in training, the likelihood that respondents to the ROA Lifelong Learning Survey choose to participate in training that is relevant to their job is modeled using an ordered probit model
( ) ( )jiiiii PTEPXSjtrpr α,,,,Φ== (2)
where the dependent variable indicates the respondent’s answers to the training intention question (tr), with j taking on any of five values, from “very unlikely” to “very likely,” and Φ denoting the cumulative standard normal distribution, and αj the threshold points. The model includes education level (S) and a number of background characteristics (X), including gender, age, industry sector, and survey year. In addition, the models include individual differences in economic preferences (EP) and personality traits (PT). In most econometric models the effect of such variables is assumed to be captured in unobserved heterogeneity (as in Eq. 1). Our analysis demonstrates the explicit contributions of economic preferences and personality traits in explaining the training workers’ willingness to train. 5 Estimation results 5.1 Economic returns to training Descriptive analyses show that workers who invested in training in the previous two years earn a higher wage. Within two years, the wage increase of low-educated workers who trained equals 5.8%, compared to 2.8% for low-educated workers who did not train. This is consistent with the fact that low-educated workers more often report having taken a course because their employer wanted them to do so, thereby opening opportunities for higher-wage positions. For intermediate- and high-educated workers, virtually no wage premium is associated with training in the short run. The wage increase for high-educated workers who participated in training is 4.7% in the two years following the training course. The wage increase of the high educated who did not participate in training is 5.8%. For the intermediate educated, these percentages are 3.3% and 4.7%, respectively. In addition, in later years, the wage premium for participating in training is higher for the low educated compared to the high educated. The wage return to training of high-educated workers is thus comparatively small. This finding can be explained by the fact that high-educated workers participate in training to maintain their human capital—rather than to

12
increase it—and that their reward for training investments can take on forms other than higher wages (Neuman & Weiss, 1995). These descriptive findings are verified in our model estimates. Table 1 reports the estimation results of an ordinary least squares (OLS) wage regression and a fixed effects panel wage regression. The OLS estimation results presented in column 1 of Table 1 show that the wage returns to training participation are estimated to be equal to 5.7%. In the fixed effects wage regression, that controls for unobserved heterogeneity (column 2); however, the returns are estimated to be 2.6%. This is in line with other estimates of the wage returns to training. For example, Frazis and Loewenstein (2005) estimate the returns to training to be in the range of 1.4–4.1% for the United States, and Pischke (2001) estimates the returns for Germany to range from 0.1 to 4.3%, depending on the type of training. The lower estimate of the return in the panel specification compared to the OLS estimate can be attributed to the fact that unobserved heterogeneity picks up endogeneity.19 The fixed effects results in Table 1 imply that the wage returns to training are not statistically different across education levels, which is confirmed in analyses by education levels. Although the returns to training, in absolute terms, could be different across different levels of education, the percentage returns are the most relevant from our perspective, since workers from each education levels will compare returns from their investment to their own wage. [Table 1 about here] Training participation not only raises wages but it can also increase a worker’s employability (Sanders & De Grip, 2004). Therefore, in an additional analysis where we included both people in and out of paid employment, we estimated a fixed effects linear probability model for the likelihood of experiencing unemployment.20 We found that for low-educated persons who participated in one or more training courses in the previous two years, the probability of being jobless is significantly lower than for those who did not participate in training. The return to the high skilled in terms of
19 Alternatively, the lower return could be due to measurement error on the training variable, resulting in downward bias of the estimated coefficient in the fixed effects specification. However, this is not likely to play a role here, since, except for the last three waves of the panel, the data were gathered by very experienced interviewers. If misreporting were an issue, one would expect training to be reported differently by experienced panel respondents and new panel members, since they differ in experience with the questionnaire. However, tests have shown that this is not the case. 20 This is possible since the training information is available for persons with a job as well as for persons without a job.

13
a higher probability to be employed is not statistically different from that of the low skilled. 5.2 Robustness We test the robustness of the wage returns to training to alternative specifications. First, we use some alternative measures for training participation. We use the cumulated number of training courses over the years instead of training dummies. This could pick up the added value of subsequent training events and the longer-term economic benefits of training. Compared to the fixed effects baseline model in Table 1, we find smaller wage returns for the low educated (1.8%)—but this estimate is not statistically different from our baseline estimate—and significantly lower returns for the high educated. We then constrain the analysis to training courses that are financed exclusively by the employer (almost 75% of all training is fully paid for by the employer). Such training courses are probably more obligatory, such that self-selection is less problematic. For these training courses, we find similar wage returns (2.6%), and no difference in returns across education levels. We also constrain the analysis to training taken during working hours only (almost a third of training takes place exclusively during working hours). Again, the idea is that these training courses are more obligatory, such that self-selection is less of an issue. Training during working hours has higher wage returns (3.7%), but again we find no evidence that the returns are different across education levels. We also check that the returns are not due to people who change to another job in another sector of employment, because then the economic returns would not be direct, but only indirect through a reallocation process in the labor market that could be more beneficial for the low educated. When we restrict our analysis to people who remained employed in the same industry sector, we find returns that are basically similar to those in Table 1. Second, we tried alternative model specifications. We followed Pischke (2001) and included an individual-specific time trend in the wage equation to account for the fact that individuals might differ in their wage growth, generating a spurious relation between training and wages. This boils down to adding the term tiν in Eq. 1.
However, estimating this individual-specific time trend requires at least three waves of panel data. This reduces the total number of observations to about a third of the initial number. In this model, the wage returns are slightly smaller (2.1%) and similar across education groups, but only statistically significant at a 13% level. However, this model might suffer from possible attenuation bias, especially when the number of people who switch treatments is small. In addition, we used the two-stage least-squares first-difference estimator and find significant but slightly smaller wage returns

14
(1.9%). However, the returns are not statistically different from our original estimate. In this model, the returns do not differ across education levels. Finally, we implemented two instrumental variable approaches. First, we follow the approach suggested by Budría and Pereira (2007), who used a dummy for holding a second job as an instrument for training. The authors argued that having a second job proxies for an individual’s commitment to work and motivation, and show the statistical validity of this instrument. In our data, second job holding is positively related to training, but tests reject the validity of this instrument (F test < 10). Second, we exploit a change in the Dutch tax law in 1998 to instrument training participation. The change consists of an extra 20% tax deduction for a firm’s training expenditures (Leuven and Oosterbeek, 2004).21 In our analyses the generic change in the tax deduction regime is not found to be a valid instrument (F test < 10). One possible reason is that the additional deduction is not very large. We can conclude that the positive wage returns to training for the low educated that are not different from those for higher-educated workers (as presented in Table 1) appear to be robust in a number of different specifications. However, despite these similar returns, the costs of training may be different across education groups. It can be argued that the costs of training are higher for low-educated than for high-educated workers, because the former are not as easy to train; that is, because of their lower ability, low-educated workers take longer to master certain skills (Acemoglu & Pischke, 1999; Heckman et al., 2006). If this is the case, then the net returns are lower for the low educated. However, the literature also suggests that the costs of training may be greater for the high educated, either because they require more advanced training, which is usually more expensive, or because the foregone productivity during training is greater (Ariga & Brunello, 2006). When this is the case, then the net returns would be higher for the low educated. We have no information on the direct costs of training in our data. However, for 2006, our data show that the time allocated to training does not differ by education level: The median duration of the training events was two weeks, with a median weekly time involvement of eight hours, and neither duration nor the weekly hours spent in training differ significantly across levels of education. Since foregone productivity to a large extent determines the costs of training (Frazis et al., 1998), and training duration is similar across educational levels, we can assume that the costs of training relative to the wage or productivity gain is similar for low- and high-educated
21 This additional tax deduction implies that 120% of the training costs can be deducted from profits.

15
workers. Therefore, our findings suggest that poor economic returns to training are not a potential explanation for the difference in training participation depicted in Figure 1. 5.3 Willingness to participate in training Table 2 reports the estimates for workers’ willingness to participate in training for a number of alternative model specifications in which economic preferences and personality traits are included.22 The estimation results of Model 1 show that willingness to train is greater for intermediate-educated workers than for low-educated workers, and even higher for high-educated workers. However, the inclusion of future orientation and economic locus of control (Model 2) results in lower estimates of the relation between the workers’ level of education and their willingness to train. Economic preferences have a significant effect on the propensity to train. Workers with a stronger orientation toward the future are more willing to participate in training courses, suggesting that they perceive training as an investment strategy. This is consistent with the idea that larger values of future orientation reflect a lower discount rate. Also, as shown in Model 3, those who have a higher preference for leisure are less inclined to participate in a training course that is relevant to their job when they have to study for this training in the evening. Table 2 shows that including these economic preferences in the analysis decreases the observed differences in training willingness across education levels. Model 2 shows that personality traits also matter. Workers with a stronger internal locus of control have stronger willingness to train (Model 2), suggesting that these workers take their economic fate in their own hands and invest in human capital to secure their future labor market position. This is in line with the findings of Coleman and DeLeire (2003). Consistent with this, workers who have a stronger chance locus of control, that is, who tend to attribute their experiences more to fate or chance, display lower willingness to train. In addition, workers who have exam anxiety are much less inclined to participate in training (Model 3). Including these personality traits further decreases the size and significance of educational differences in willingness to train. One might be concerned that the decrease in size and significance of the differences in willingness to train between low- and high-educated workers is due to the reduction in sample size when including
22 Models 1 and 2 are estimated on the pooled cross-sections, and the standard errors are corrected accordingly. While a fixed effects model performs poorly with only two waves of data, a random effects probit model leads to similar results (a Hausman test for the linear version of Models 1 and 2 fails to reject the random effects specification).

16
the additional variables in the model that are only observed in 2004; however, as Model 5 shows, this is not the case.23 [Table 2 about here] Model 4 includes the Big Five personality traits in our analysis (Borghans et al., 2008a). We find that openness to experience is positively correlated with willingness to train.24 This is in line with earlier findings by Barrick and Mount (1991) and can be understood from the fact that this personality trait indicates creativity, intellectual autonomy, and curiosity. The other Big Five personality traits do not significantly affect workers’ willingness to participate in training. The estimation results show that when we include economic preferences and personality traits, the difference between low- and high-educated workers in their willingness to participate in training that is important to their job is no longer significant. The findings reported in Table 2 therefore suggest that interpersonal differences in noncognitive skills explain the education-related differences in willingness to train; that is, the lesser willingness to train of the low educated is due to their preferences and personality traits, which also determined their decision to invest in initial education. This has important policy implications, to which we return in the next paragraph. 6 Conclusions and discussion The low training participation rate of low-educated workers relative to high-educated workers is well documented in the empirical economic literature. However, a clear explanation for this difference is lacking. This paper fills this gap by investigating two alternative explanations: Low-educated workers invest less in training because 1) they have lower economic returns to on-the-job training or 2) they have a lesser willingness to participate in training courses, due to distinct economic preferences and personality traits. Controlling for unobserved heterogeneity, we find that low-educated workers who train earn 2.6% more than those who do not train. These economic returns are similar to the returns that high-educated workers derive from participating in training, suggesting that differences in economic returns to training cannot explain the differences in training participation between low- and high-educated workers. These results appear to be robust in alternative specifications.
23 Model 5 is the same as Model 1, but it is estimated on the 2004 data only. 24 An F-test rejects the hypothesis that the Big Five personality traits are jointly equal to zero.
17
Using data on workers’ willingness to participate in a training course that is important to their job but which requires the worker’s individual time investment, we find that low-educated workers are significantly less willing to participate in such training than high-educated workers. We show that this difference in workers’ willingness to train across education levels is due to differences in economic preferences—future orientation and preference for leisure time—as well as personality traits—economic locus of control, exam anxiety, and openness to experience. In particular, the negative effect of exam anxiety on the willingness of low-educated workers to participate in training appears to be great, which may be due to prior negative experiences in school. The fact that the inclusion of the set of economic preferences and personality traits explains differences in investments in further training between low-educated and higher-educated workers deserves further discussion. This can result from the fact that these preferences and personality traits also determined previous educational choices. Empirical evidence is, however, not fully conclusive (Coleman & DeLeire, 2003; Cebi, 2007). In the literature, the difference in training participation between high-educated and low-educated workers has been attributed to the complementarity between initial education and training on the job (Van Smoorenburg & Van der Velden, 2000; Heckman, 2000). Our results suggest that this complementarity can be attributed to the fact that the participation in initial education and training is determined by similar economic preferences and personality traits. Since “learning by doing” is an important way of acquiring knowledge (Arrow, 1962), one could also argue that the reason why low-educated workers participate less often in training than high-educated workers is that they more often learn from informal channels. However, a survey question included in the ROA Lifelong Learning Survey asking for “the percentage of working time spent on activities from which one can learn” suggests that low-educated workers spend significantly less time on such activities (22% of their working time) than high-educated workers (32% of their working time) (see also Borghans et al., 2009). This suggests that the lower training participation of low-educated workers is not due to the substitution of formal training by informal learning. Current academic and policy debates stress the importance of a well-trained workforce. Growing international competition is raising the need to upgrade the skills of the workforce, whereas an aging population calls for the prevention of skill depreciation due to wear and atrophy (De Grip & Van Loo, 2002). Against this background, developed economies aim to achieve a competitive and cohesive
18
knowledge society, where “lifelong learning” activities play a central role. To the extent that personality traits are time invariant (Costa & McCrae, 1997), they are difficult to tune through policy measures. Our findings therefore suggest that it will be difficult to increase the participation of low-educated workers in lifelong learning activities. However, to the extent that some of these traits develop in the course of one’s life (Heckman, 2007), it might still be possible to stimulate the participation in training of the low-educated workforce. In particular, our findings suggest that helping low-educated workers overcome their fear of taking exams can increase their participation in further training. Also, increasing the awareness of positive economic returns to training for the low educated could help increase their participation in training. This may be especially important when low-educated workers have low expectations about the benefits of being trained. References Acemoglu, D. & Pischke, J. (1999). The structure of wages and investment in general
training. Journal of Political Economy, 107(3), 539–572. Ariga, K. & Brunello, G. (2006). Are education and training always complements?
Evidence from Thailand. Industrial and Labor Relations Review, 59(4), 613–629. Arrow, K. (1962). The economic implications of learning by doing, Review of
Economic Studies, 29(3), 155–173.
Barrick, M. & Mount, M. (1991). The Big Five personality dimensions and job
performance: A meta-analysis. Personnel Psychology, 44(1), 1–26.
Barron, J., Black, D. & Loewenstein, M. (1989). Job matching and on-the-job training. Journal of Labor Economics, 7(1), 1–19.
Bassanini, A., Booth, A., Brunello, G., De Paola, M. & Leuven, E. (2007). Workplace training in Europe. In: Brunello, G., Garibaldi, P. & Wasmer, E. (Eds.), Education and Training in Europe., Oxford: Oxford University Press, pp. 143–309.
Bassanini, A. & Ok, W. (2007). How do firms’ and individuals’ incentive to invest in human capital vary across groups? Working paper, Organisation for Economic Co-operation and Development, Paris.
Booth, A. & Bryan, M. (2007). Who pays for general training in private sector Britain? In: Polachek, S. & Tatsiramos, K. (Eds.), Aspects of Worker Well-Being. Research in Labor Economics, 26, 85–123.
Booth, A., Francesconi, M. & Zoega, G. (2003). Unions, work-related training, and wages: Evidence for British men. Industrial and Labor Relations Review, 57(1), 68–91.
19
Borghans, L., Duckworth, A., Heckman, J. & Ter Weel, B. (2008a). The economics
and psychology of personality traits. Journal of Human Resources, 43(4), 972–
1059.
Borghans, L., Meijers, H. & Ter Weel, B. (2008b). The role of non-cognitive skills in cognitive tests. Economic Inquiry, 46(1), 2–12.
Borghans, L., Golsteyn, B., De Grip, A. & Nelen, A. (2009). Leren op het werk: Ontwikkelingen en consequenties voor productiviteit en mobiliteit. s-Hertogenbosch: ecbo.
Brunello, G. (2004). Labour market institutions and the complementarity between education and training in Europe. In: Checchi, D. & Lucifora, C. (Eds.), Education, Training and Labour Market Outcomes in Europe. Houtmills: Palgrave Macmillan, pp. 188–209.
Budría, S. & Pereira, P. (2007). The wage effects of training in Portugal: Differences across skill groups, genders, sectors and training types. Applied Economics, 39(4), 787–807.
Cebi, M. (2007). Locus of control and human capital investment revisited. Journal of Human Resources, 42(4), 919–932.
Coleman, M. & DeLeire, T. (2003). An economic model of locus of control and the human capital investment decision. Journal of Human Resources, 38(3), 701–21.
Colquitt, J., LePine, J. & Noe, R (2000). Toward an integrative theory of training motivation: A meta-analytic path analysis of 20 years of research. Journal of Applied Psychology, 85(5), 678–707.
Costa, P. & McCrae, R. (1997). Longitudinal stability of adult personality. In: Hogan, J., Johnson, A. & Briggs, S. (Eds.), Handbook of Personality Psychology. San Diego: Academic Press, pp. 269–292.
De Grip, A. & Van Loo, J. (2002). The economics of skills obsolescence: A review. In: De Grip, A., Van Loo, J. & Mayhew, K. (Eds.), Understanding Skills Obsolescence. Research in Labor Economics, 21, 1–26.
De Haan, B. & Schouwenburg, H. (1996). Personality in learning and education: A review. European Journal of Personality, 10(5), 303–336.
Frazis, H., Gittleman, M., Horrigan, M. & Joyce, M. (1998). Results from the 1995 Survey of Employer-Provided Training. Monthly Labor Review, 121(6), 3–13.
Frazis, H. & Loewenstein, M. (2005). Reexamining the returns to training: Functional form, magnitude and interpretation. Journal of Human Resources, 40(2), 453–476.
Furnham, A. (1986). Economic locus of control. Human Relations, 39(1), 29–43. Georgellis, Y. & Lange, T. (2007). Participation in continuous on-the-job training and
job satisfaction: longitudinal evidence from the German labour market. International Journal of Human Resource Management, 18(6), 969–985.

20
Goldberg, L. (1992). The development of markers for the Big-Five factor structure. Psychological Assessment, 4(1), 26–42.
Goldberg, L. (1999). International Personality Item Pool: A scientific collaboratory for the development of advanced measures of personality and other individual differences, http://ipip.ori.org/ipip/ (last accessed December 4, 2009).
Heckman, J. (2000). Policies to foster human capital. Research in Economics, 54(1), 3–56.
Heckman, J. (2007). The economics, technology and neuroscience of human capability formation. Proceedings of the National Academy of Sciences, 104(33), 13250–13255.
Heckman, J., Stixrud, J. & Urzua, S. (2006). The effects of cognitive and non-cognitive abilities on labor market outcomes and social behavior. Journal of Labor Economics, 24(3), 411–482.
Hembree, R. (1988). Correlates, causes, effects, and treatment of test anxiety. Review of Educational Research, 58(1), 47–77.
Hill, E. (2001). Post-school-age training among women: Training methods and labor market outcomes at older ages. Economics of Education Review, 20(2), 181–191.
Jacob, B. (2002). Where the boys aren’t: Non-cognitive skills, returns to school and the gender gap in higher education. Economics of Education Review, 21(6), 589–598.
Illeris, K. (2005). Lifelong learning and the low-skilled. International Journal of Lifelong Education, 25(1), 15–28.
Killingsworth, M. (1982). “Learning by doing” and “Investment in training”: A synthesis of two “rival” models of the life cycle. Review of Economic Studies, 49(2), 263–271.
Kuckulenz, A. & Zwick, T. (2004). The impact of training on earnings: Differences between participant groups and training forms. Mimeo, Centre for European Economic Research (ZEW), Mannheim.
Lefcourt, H., Von Baeyer, C., Ware, E. & Cox, D. (1979). The multidimensional-multiattributional causality scale: The development of a goal-specific locus of control scale. Canadian Journal of Behavioral Science, 11(4), 286–304.
Leuven, E. & Oosterbeek, H. (1999). Demand and supply of work-related training: Evidence from four countries. Research in Labor Economics, 18: 303–330.
Leuven, E. & Oosterbeek, H. (2004). Evaluating the effect of tax deductions on training. Journal of Labor Economics, 22(2), 461–488.
Leuven, E. & Oosterbeek, H. (2008). An alternative approach to estimate the wage returns to private-sector training. Journal of Applied Econometrics, 23(4), 423–434.
21
Lynch, L. (1992). Private-sector training and the earnings of young workers. American Economic Review, 82(1), 299–312.
Maurer, T. & Tarulli, B. (1994). Investigation of perceived environment, outcome and person variables in relationship to development by employees. Journal of Applied Psychology, 79(1), 3–14.
Maximiano, S. & Oosterbeek, H. (2007). On the determinants of workers’ and firms’ willingness to train. Conference paper, European Association of Labour Economists (EALE), Oslo, 2007.
Mueller, G. & Plug, E. (2006). Estimating the effect of personality on male and female earnings, Industrial & Labor Relations Review, 60(1), 3–22.
Neuman, S. & Weiss, A. (1995). On the effects of schooling vintage on experience-earnings profiles: Theory and evidence, European Economic Review, 39(5), 943–955.
Noe, R. & Wilk, S. (1993). Investigation of the factors that influence employees’ participation in development activities. Journal of Applied Psychology, 78(2), 291–302.
Nyhus, E. & Pons, E. (2005). The effects of personality on earnings. Journal of Economic Psychology, 26(3), 363–384.
Organisation for Economic Co-operation and Development (1999). Employment Outlook 1999. Paris: Organisation for Economic Co-operation and Development.
Pekrun, R. (1992). The impact of emotions on learning and achievement: Towards a theory of cognitive/motivational mediators. Applied Psychology, 41(4), 359–376.
Pischke, J. (2001). Continuous training in Germany. Journal of Population Economics, 14(3), 523–548.
Plunkett, H. & Buehner, M. (2007). The relation of general and specific locus of control to intertemporal monetary choice. Personality and Individual Differences, 42(7), 1233–1242.
Riphahn, R. & Trübswetter, P. (2007). New evidence on the complementarity of education and training. Mimeo, CESifo, Munich.
Rotter, J. (1966). Generalized expectancies for internal versus external control of reinforcement. Psychological Monographs: General and Applied, 80(1), 1–28.
Sanders, J. & De Grip, A. (2004). Training and low-skilled workers’ employability. International Journal of Manpower, 25(1), 73–89.
Steedman, H. & McIntosh, S. (2001). Measuring low skills in Europe: How useful is the ISCED framework? Oxford Economic Papers, 53(3), 564–581.
Strathman, A., Gleicher, F., Boninger, D. & Edwards, C. (1994). The consideration of future consequences: Weighing immediate and distant outcomes of behavior. Journal of Personality and Social Psychology, 66(4), 742–752.

22
Tharenou, P. (2001). The relationship of training motivation to participation in training and development. Journal of Occupational and Organizational Psychology, 74(5), 599–621.
Van Smoorenburg, M. & Van der Velden, R. (2000). The training of school-leavers: Complementarity or substitution? Economics of Education Review, 19(2), 207–217.

23
Figures and tables Figure 1. Percentage of workers who participated in training in the previous two years, by education level, 1986–2006.
10
20
30
40
50
60Tr
aini
ng (%
)
1986
1988
1990
1992
1994
1996
1998
2000
2002
2004
2006
Low Intermediate High
Source: OSA Labour Supply Panel. Table 1. Effect of training participation on wage.
Monthly wage (log) OLS1) Panel fixed effects model2) Training * low educated 0.053*** 0.026*** (0.008) (0.009) Training* intermediate educated -0.026** -0.008 (0.011) (0.013) Training* high educated -0.059*** -0.016 (0.012) (0.013) Intermediate educated 0.122*** (0.009) High educated 0.344*** (0.012) N*T 18774 18774 N 9366 9366 σµ 0.429 σε 0.214 ρ4) 0.802
1) Control variables: gender, married (dummy), number of children below age six, quadric of age, quadric of tenure, quadric of experience, hours worked (log), unpaid overtime work (dummy), paid overtime work (dummy), sector dummies, firm size, and year dummies. 2) Control variables: same as 1), with the exception of gender and year dummies. * p < 0.10, ** p < 0.05, *** p < 0.01. Robust standard errors are in parentheses. Source: OSA Labour Supply Panel.

24
Table 2. Ordered probit regression for willingness to participate in training.1)
Model 12) Model 22) Model 3 Model 4 Model 5 Intermediate education 0.217*** 0.187*** 0.144* 0.134 0.152* (0.070) (0.071) (0.086) (0.086) (0.084) High education 0.312*** 0.252*** 0.162* 0.123 0.227*** (0.069) (0.070) (0.087) (0.088) (0.085) Economic preferences
Future orientation2) 0.053** 0.072** 0.070** (0.027) (0.032) (0.032)
Preference for leisure -0.227*** -0.231*** (0.036) (0.037) Personality traits
Internal locus of control 0.138*** 0.245*** 0.232*** (0.044) (0.059) (0.061) Chance locus of control -0.135*** -0.183*** -0.174*** (0.040) (0.053) (0.055) Exam anxiety -0.490*** -0.492*** (0.036) (0.036) Openness to experience 0.076** (0.035) Conscientiousness -0.056 (0.034) Extraversion 0.025 (0.033) Agreeableness 0.020 (0.037) Neuroticism -0.013
(0.035) Pseudo R-squared 0.031 0.035 0.111 0.113 0.008 N 2161 2161 1224 1224 1224
1) Answers are measured on a scale ranging from “very unlikely” (1) to “very likely” (5). The table shows the regression coefficients and the standard errors are in parentheses. Models 3 and 4 could only be estimated for the 2004 wave of the ROA Lifelong Learning Survey. Model 5 is similar to Model 1, but it is only estimated for 2004. Additional control variables are gender, age, age squared, industry sector, a dummy for the 2007 wave (Models 1 and 2 only), dummy variables to control for missing values on future orientation and personality traits, and four threshold points. 2) Because a number of individuals were present in both the 2004 and 2007 waves of data collection, the standard errors were corrected accordingly. * p<0.10, ** p<0.05, *** p<0.01. Source: ROA Lifelong Learning Survey and DNB Household Survey.

25
Appendix A. OSA Labour Supply Panel Table A.1. Sample statistics for the OSA Labour Supply Panel 1994–2006.1) Total By education level By training status
Low Intermediate High Yes No
Mean Std. dev Mean Mean Mean Mean Mean
Low-skilled1) 0.33 0.471 1.00 0.00 0.00 0.39 0.26 Intermediate-skilled 0.38 0.485 0.00 1.00 0.00 0.36 0.40 High-skilled 0.29 0.453 0.00 0.00 1.00 0.25 0.34 Training in previous two years 0.43 0.495 0.33 0.46 0.51 0.00 1.00 Female (in years) 0.44 0.497 0.40 0.47 0.45 0.46 0.42 Age 40.41 10.281 41.86 38.44 41.33 41.20 39.37 Experience (in years) 18.89 10.603 21.55 17.36 17.83 19.57 17.98 Tenure (in months) 122.05 111.992 137.00 110.72 119.67 125.92 116.89 Monthly wage (log) 6.78 0.611 6.59 6.73 7.07 6.69 6.89 Hours worked per week (log) 3.38 0.456 3.34 3.37 3.44 3.33 3.45 Not married (dummy) 0.20 0.400 0.18 0.21 0.21 0.20 0.20 Number of kids under age 6 0.32 0.679 0.23 0.38 0.36 0.30 0.35 Unpaid over time work 0.29 0.452 0.15 0.27 0.46 0.24 0.35 Paid overtime work 0.23 0.421 0.28 0.26 0.13 0.21 0.26 Sector of industry: Agriculture 0.02 0.125 0.02 0.02 0.01 0.02 0.01 Industry 0.14 0.343 0.20 0.13 0.08 0.15 0.12 Construction 0.05 0.219 0.08 0.05 0.01 0.05 0.05 Trade, Hotel, and Catering 0.15 0.353 0.20 0.17 0.05 0.17 0.11 Transport 0.07 0.257 0.10 0.07 0.04 0.08 0.06 Financial and commercial services 0.15 0.356 0.11 0.16 0.19 0.14 0.17 Noncommercial services 0.04 0.205 0.05 0.04 0.05 0.05 0.04 Public sector 0.11 0.307 0.08 0.11 0.13 0.09 0.13 Education 0.10 0.296 0.02 0.04 0.25 0.09 0.11 Healthcare 0.18 0.388 0.14 0.22 0.19 0.18 0.19 Firm size: 1–9 employees 0.13 0.341 0.16 0.15 0.09 0.16 0.11 10–19 employees 0.10 0.305 0.12 0.10 0.09 0.11 0.10 20–49 employees 0.17 0.371 0.17 0.15 0.17 0.17 0.16 50–99 employees 0.13 0.333 0.14 0.12 0.12 0.12 0.13 100–499 employees 0.26 0.440 0.25 0.26 0.29 0.25 0.28 500+ employees 0.21 0.404 0.17 0.21 0.25 0.19 0.22 Panel wave: 1994 0.14 0.342 0.17 0.13 0.09 0.15 0.11 1996 0.14 0.352 0.17 0.15 0.11 0.15 0.14 1998 0.13 0.334 0.14 0.13 0.10 0.14 0.12 2000 0.13 0.341 0.14 0.13 0.14 0.13 0.13 2002 0.16 0.368 0.15 0.16 0.18 0.15 0.17 2004 0.14 0.347 0.11 0.14 0.18 0.12 0.16 2006 0.16 0.363 0.11 0.16 0.20 0.15 0.16 Pooled number of cases (N) 18774 Unique number of cases (N) 9366
1) Sample statistics for the estimation sample. 2) The larger share of low-educated workers compared to that in Table B.1 reflects the increase in the educational level of workers from the 1990s to the 2000s. The distribution of educational levels is similar in the last wave of both surveys.

26
Appendix B. ROA Lifelong Learning Survey and DNB Household Survey Table B.1. Sample statistics for the ROA Lifelong Learning Survey and DNB Household Survey.1) By education level Low Intermediate Low Variable Mean Std. dev. Mean Mean Mean Low-educated 0.23 0.422 Intermediate-educated 0.34 0.473 High-educated 0.43 0.495 Likelihood that one would train 3.08 1.306 2.80 3.14 3.19 Age 42.97 10.265 46.44 40.88 42.77 Female 0.42 0.493 0.36 0.42 0.44 Industry 0.18 0.385 0.24 0.22 0.12 Construction 0.05 0.215 0.07 0.07 0.02 Trade, Hotel, and Catering 0.10 0.303 0.20 0.17 0.04 Transport 0.05 0.221 0.07 0.03 0.01 Financial and commercial services 0.17 0.379 0.12 0.18 0.20 Public sector 0.11 0.314 0.08 0.09 0.14 Semi-public sector 0.04 0.189 0.02 0.02 0.06 Education 0.11 0.313 0.03 0.03 0.22 Healthcare 0.19 0.389 0.17 0.19 0.19 2007 wave 0.43 0.496 0.44 0.44 0.43 Future orientation2) 0.00 1.000 -0.25 -0.07 0.19 Preference for leisure3) 0.00 1.000 -0.01 0.02 0.00 Internal locus of control2) 0.00 1.000 0.19 0.04 -0.12 Chance locus of control2) 0.00 1.000 0.03 -0.02 0.00 Exam anxiety3) 0.00 1.000 -0.02 0.00 0.00 Openness to experience2)3) 0.00 1.000 -0.32 -0.09 0.25 Conscientiousness2)3) 0.00 1.000 0.03 0.04 -0.05 Extraversion2)3) 0.00 1.000 0.00 0.06 -0.05 Agreeableness2)3) 0.00 1.000 -0.06 -0.12 0.12 Neuroticism2)3) 0.00 1.000 0.05 0.04 -0.05 Number of observations (N) 2161
1) Sample statistics for the largest estimation sample. 2) Variable from the DNB Household Survey. 3) Measured in 2004 only.
27
Appendix C. Future orientation Table C.1. Statements for the measurement of future orientation (2004, 2007).1) I think about how things can change in the future and try to influence those things in my everyday life. I often work on things that will only pay off in a couple of years. I am only concerned about the present, because I trust that things will work themselves out in the future. With everything I do, I am only concerned about the immediate consequences (say, a period of a couple of days or weeks). (-) Whether something is convenient for me or not to a large extent determines the decisions that I take or the actions that I undertake. (-) I am ready to sacrifice my well-being in the present to achieve certain results in the future. (-) I think it is important to take warnings about the negative consequences of my acts seriously, even if these negative consequences would only occur in the distant future. I think it is more important to work on things that have important consequences in the future than to work on things that have immediate but less important consequences. In general, I ignore warnings about future problems because I think these problems will be solved before they get critical. (-) I think there is no need to sacrifice things now for problems that lie in the future, because it will always be possible to solve these future problems later. (-) I only respond to urgent problems, trusting that problems that come up later can be solved in a later stage. (-) I get clear results in my daily work, and this is more important to me than getting vague results. (-)
(-) Indicates items that are reverse coded. 1) Scale from Strathman et al. (1994).

28
Appendix D. Locus of control Table D.1. Statements for the measurement of locus of control (2005, 2007).1) Internal dimension
Saving and careful investing is a key factor in becoming rich. Whether or not I become wealthy depends mostly on my ability. In the long run, people who take very good care of their finances stay wealthy. If I become poor, it’s usually my own fault. I am usually able to protect my personal interests. When I get what I want, it’s usually because I worked hard for it. My life is determined by my own actions.
Chance dimension There is little one can do to prevent poverty. Regarding money, there isn’t much you can do for yourself when you are poor. It’s not always wise for me to save because many things turn out to be a matter of good or bad fortune. It is chiefly a matter of fate whether I become rich or poor. Only those who inherit or win money can possibly become rich.
1) Internal and chance dimensions from Furnham’s scale (Furnham, 1986). Furnham uses six question items for the chance locus of control. One of these items, “Becoming rich has nothing to do with luck,” was dropped because it did not have any added value.

29
Appendix E. Factor analysis for Big Five personality traits (2005) Table E.1. Rotated factor analysis for the Big Five (2005), factor loadings. Variable Agreeableness Neuroticism Extraversion Openness Conscientiousness Uniqueness I do chores right away. 0.036 0.087 -0.144 -0.121 0.582 0.663 I leave my things lying around. 0.126 0.055 0.112 0.183 -0.724 0.493 I live my life according to schedules. -0.118 0.212 0.003 -0.055 0.521 0.743 I neglect my obligations. -0.108 0.088 0.127 0.168 -0.399 0.764 I have an eye for details. 0.013 0.100 0.112 0.363 0.543 0.562 I am accurate in my work. 0.064 0.058 0.063 0.218 0.514 0.655 I forget to put things back where they belong. 0.059 0.074 -0.066 0.009 -0.620 0.598 I am always well prepared. 0.028 0.028 -0.046 0.195 0.598 0.579 I often make a mess of things. 0.061 0.214 0.072 0.040 -0.663 0.478 I like order. -0.019 0.100 0.038 0.013 0.770 0.436 I am the life of the party. -0.032 0.026 -0.694 0.019 0.009 0.526 I feel little concern for others. -0.584 0.006 0.108 0.012 0.081 0.643 I get stressed out easily. 0.167 0.749 0.021 -0.037 0.022 0.476 I have a rich vocabulary. 0.084 0.006 -0.030 0.531 0.018 0.677 I do not talk a lot. -0.186 -0.062 0.687 0.041 0.009 0.465 I am interested in people. 0.778 0.072 -0.058 0.017 -0.039 0.409 I am relaxed most of the time. -0.035 -0.587 0.010 0.211 0.000 0.573 I have difficulty understanding abstract ideas. 0.034 0.317 -0.148 -0.471 0.044 0.653 I feel comfortable around people. 0.385 -0.120 -0.460 0.026 0.043 0.486 I insult people. -0.397 0.236 -0.157 0.221 -0.151 0.672 I worry about things. 0.313 0.647 0.120 -0.005 0.080 0.588 I have a vivid imagination. 0.025 0.112 -0.093 0.668 -0.121 0.522 I keep in the background. 0.055 -0.005 0.769 -0.003 0.015 0.421 I sympathize with others’ feelings. 0.849 0.117 -0.020 -0.053 -0.061 0.359 I seldom feel blue. -0.047 -0.595 -0.098 0.061 -0.014 0.622 I am not interested in abstract ideas. -0.012 0.136 -0.101 -0.428 0.070 0.789 I start conversations. 0.212 0.018 -0.637 0.060 0.075 0.460 I am not interested in other people’s problems. -0.654 -0.041 -0.011 -0.017 0.077 0.607 I am easily disturbed. 0.080 0.307 -0.125 -0.006 -0.272 0.793 I have excellent ideas. 0.028 -0.043 -0.029 0.670 0.023 0.510 I have little to say. -0.239 0.101 0.430 -0.155 0.043 0.604 I have a soft heart. 0.477 -0.175 0.074 0.120 0.009 0.654 I get upset easily. 0.181 0.738 0.040 -0.125 -0.039 0.436 I do not have a good imagination. 0.056 0.017 0.097 -0.481 -0.004 0.747

30
I talk to a lot of different people at parties. 0.188 -0.045 -0.679 -0.031 0.056 0.442 I am not really interested in others. -0.720 0.049 0.105 0.041 0.020 0.440 I change my mood a lot. -0.174 0.634 -0.101 0.105 0.014 0.544 I am quick to understand things. 0.147 -0.164 0.025 0.494 0.141 0.569 I do not like to draw attention to myself. 0.200 -0.016 0.665 -0.048 0.033 0.556 I take time out for others. 0.779 0.029 0.054 -0.019 -0.022 0.436 I have frequent mood swings. -0.078 0.756 0.027 0.082 0.013 0.413 I use difficult words. -0.166 0.184 -0.017 0.570 -0.068 0.678 I do not mind being the center of attention. -0.113 -0.029 -0.597 0.204 -0.040 0.563 I feel others’ emotions. 0.580 0.112 -0.052 0.170 0.034 0.586 I get irritated easily. -0.231 0.621 -0.057 0.155 0.026 0.533 I spend time reflecting on things. 0.291 -0.059 0.395 0.273 0.115 0.678 I am quiet around strangers. 0.000 0.125 0.763 0.019 -0.067 0.389 I make people feel at ease. 0.403 -0.023 -0.231 0.193 0.014 0.632 I often feel blue. -0.047 0.730 0.074 0.038 -0.018 0.433 I am full of ideas. -0.035 0.009 -0.115 0.619 0.052 0.579