Why do all the flights leave at 8 am?: Competition and...
30
International Journal of Industrial Organization 17 (1999) 611–640 Why do all the flights leave at 8 am?: Competition and departure-time differentiation in airline markets a, b * Severin Borenstein , Janet Netz a Haas School of Business, University of California, Berkeley, CA 94720-1900, USA and National Bureau of Economic Research b Department of Economics, Krannert School of Management, Purdue University, W . Lafayette, IN 47907-1310, 765-494-4452, USA Received 31 October 1996; received in revised form 26 April 1997; accepted 26 August 1997 Abstract Theoretical models of spatial product differentiation indicate that firms face two opposing incentives: (1) minimize differentiation in order to ‘‘steal’’ customers from competitors, and (2) maximize differentiation in order to reduce price competition. Using data on U.S. airline departure times from 1975, when fares were regulated, and 1986, when fares were not regulated, we empirically estimate the effect of competition on differentiation. We find a negative relationship in both periods. In 1986, however, reductions in exogenous scheduling constraints increase differentiation, implying that firms may be differentiating their products where possible to reduce price competition. This effect is not apparent in the 1975 data. 1999 Elsevier Science B.V. All rights reserved. Keywords: Airlines; Spatial competition; Product differentiation JEL classification: L13; L93; D43 1. Introduction A great deal of theoretical work on product differentiation and spatial competi- tion has been done since Hotelling’s path-breaking 1929 paper ‘‘Stability in * Corresponding author. E-mail address: [email protected] (S. Borenstein) 0167-7187 / 99 / $ – see front matter 1999 Elsevier Science B.V. All rights reserved. PII: S0167-7187(97)00058-1
-
Upload
truongnguyet -
Category
Documents
-
view
215 -
download
1
Transcript of Why do all the flights leave at 8 am?: Competition and...

International Journal of Industrial Organization17 (1999) 611–640
Why do all the flights leave at 8 am?: Competition anddeparture-time differentiation in airline markets
a , b*Severin Borenstein , Janet NetzaHaas School of Business, University of California, Berkeley, CA 94720-1900, USA and National
Bureau of Economic ResearchbDepartment of Economics, Krannert School of Management, Purdue University, W. Lafayette,
IN 47907-1310, 765-494-4452, USA
Received 31 October 1996; received in revised form 26 April 1997; accepted 26 August 1997
Abstract
Theoretical models of spatial product differentiation indicate that firms face two opposingincentives: (1) minimize differentiation in order to ‘‘steal’’ customers from competitors, and(2) maximize differentiation in order to reduce price competition. Using data on U.S. airlinedeparture times from 1975, when fares were regulated, and 1986, when fares were notregulated, we empirically estimate the effect of competition on differentiation. We find anegative relationship in both periods. In 1986, however, reductions in exogenous schedulingconstraints increase differentiation, implying that firms may be differentiating their productswhere possible to reduce price competition. This effect is not apparent in the 1975 data. 1999 Elsevier Science B.V. All rights reserved.
Keywords: Airlines; Spatial competition; Product differentiation
JEL classification: L13; L93; D43
1. Introduction
A great deal of theoretical work on product differentiation and spatial competi-tion has been done since Hotelling’s path-breaking 1929 paper ‘‘Stability in
*Corresponding author.E-mail address: [email protected] (S. Borenstein)
0167-7187/99/$ – see front matter 1999 Elsevier Science B.V. All rights reserved.PI I : S0167-7187( 97 )00058-1

612 S. Borenstein, J. Netz / Int. J. Ind. Organ. 17 (1999) 611 –640
Competition.’’ This theory literature, however, has developed without the benefitof virtually any empirical investigation. Our paper examines a particular type ofproduct differentiation in the airline industry—the scheduling of flight departure
1times—in an attempt to shed light on the predictions of the theoretical models.Airline flight scheduling provides a natural, though complex, empirical test ofspatial competition theories. The major theoretical findings have natural analogs inthis market and a key factor in the theories—the endogeneity of price de-termination—changed between the 1970s and the 1980s as the airline industry wasderegulated.
Hotelling’s initial model of spatial competition was very simple, assumingperfectly inelastic demand and a uniform distribution of consumers over the space.His surprising results—minimum differentiation with two firms and no stableequilibrium with three firms—spurred substantial investigation of sensitivity of the
2results to his assumptions. These works extend Hotelling’s model in manydirections, allowing elastic demand, a variety of conjectural variations for firms,nonuniform distributions of consumers, and various shapes and dimensions ofspaces. While many of the extensions have supported Hotelling’s finding ofminimum, or at least reduced, differentiation, other work has indicated thatcompetition is consistent with, or does not differ much from, the social optimum.
The mixed results of the theoretical work arise from two conflicting incentivesfaced by firms competing in two dimensions. On the one hand, firms attempt tolocate close to their competitors’ locations in order to ‘‘steal’’ customers, whichwe call an ‘‘attraction’’ force. However, reducing differentiation increases pricecompetition, reducing the profit to be made on each sale. This effect we term a‘‘repulsion’’ force since it gives each firm an incentive to locate farther from itscompetitors. Different assumptions cause one or the other of these forces todominate, resulting in a tendency towards minimal or maximal differentiation,respectively.
Unfortunately for our purposes, the airline industry is much more complicatedthan the assumptions of any of the models: demand is elastic; passengers aredistributed nonuniformly in their preferred departure times; passenger delay costs,analogous to transport costs in a typical spatial model, vary over consumers; eachroute is part of a network; and airlines compete on departure time, prices, andother quality factors. We attempt to control for the effects of these factors that varyacross route observations in order to analyze the strategic incentives of firms toposition their brands either closer to competitors’ brands or farther away than theywould in the absence of competitive considerations. Our approach to this analysis
1 Greenhut et al., 1987, briefly discuss airline scheduling in the context of spatial theory, suggestingthat more competition leads to less differentiation.
2 As discussed below, these are not actually equilibria. Existence (and uniqueness) of equilibrium is acommon problem in models of spatial equilibrium when price is endogenous.

S. Borenstein, J. Netz / Int. J. Ind. Organ. 17 (1999) 611 –640 613
is to ask whether, for a given number of flights on a route, the departure times ofthose flights are closer together or farther apart if they are scheduled by amonopolist than if different flights are scheduled by different airlines. Our resultsprovide support for the assertion that multiple airlines on a route will locate theirflights more closely together in time than will a single firm controlling the samenumber of flights. We argue, however, that this result may capture effects otherthan competitive positioning of brands. Results indicate that when schedulingpossibilities are more constrained by landing slot availability and other factors, theobserved scheduling exhibits less differentiation than does unconstrained schedul-ing.
In Section 2, we review some theoretical models of spatial competition anddiscuss the factors that seem to determine the degree of product differentiation thatobtains. The application of these theories to the airline industry is discussed inSection 3. The most important complication is that flights are part of a network,which affects the incentives for a firm to strategically reschedule flights on aspecific route. In Section 4, we describe the data and their sources, introduce themeasures we use for analyzing departure-time differentiation, and present simplesummary statistics that begin to address the empirical issues. These statisticsindicate that as competition on a route increases, the degree of differentiationdeclines. We present an empirical model of departure-time differentiation inSection 5 and discuss the econometric issues that arise in attempting to estimatethis model. The results from our 1986 postderegulation dataset are presented anddiscussed in Section 6. Analysis using data from 1975, prior to deregulation of theairline industry, is shown in Section 7. Section 8 concludes with some furtherinterpretations of our results.
2. Theories of spatial differentiation
Hotelling (1929) proposed his model of spatial competition in order to explain acertain puzzle: when there are two sellers of a homogeneous good and price is notequal, why doesn’t the firm charging the higher price lose all its customersinstantaneously? Hotelling assumed that buyers are distributed uniformly over aline of finite length; that consumers pay the seller’s price plus a transport cost perunit distance; that demand is perfectly inelastic; that firms choose price andlocation in an effort to maximize profits; and that relocation is costless. Hotellingconsiders a game where firm A is permanently located. Firm B then locates, andthen firms choose price. The equilibrium with two firms proposed by Hotelling ischaracterized by minimum differentiation, i.e., the two firms are paired at thecenter of the market. This is in contrast to the socially optimal locations thatminimize transport costs, where the firms locate at the first and third quartiles andrealize identical profits as under minimum differentiation. In the case of threefirms, Hotelling finds no stable equilibrium.
614 S. Borenstein, J. Netz / Int. J. Ind. Organ. 17 (1999) 611 –640
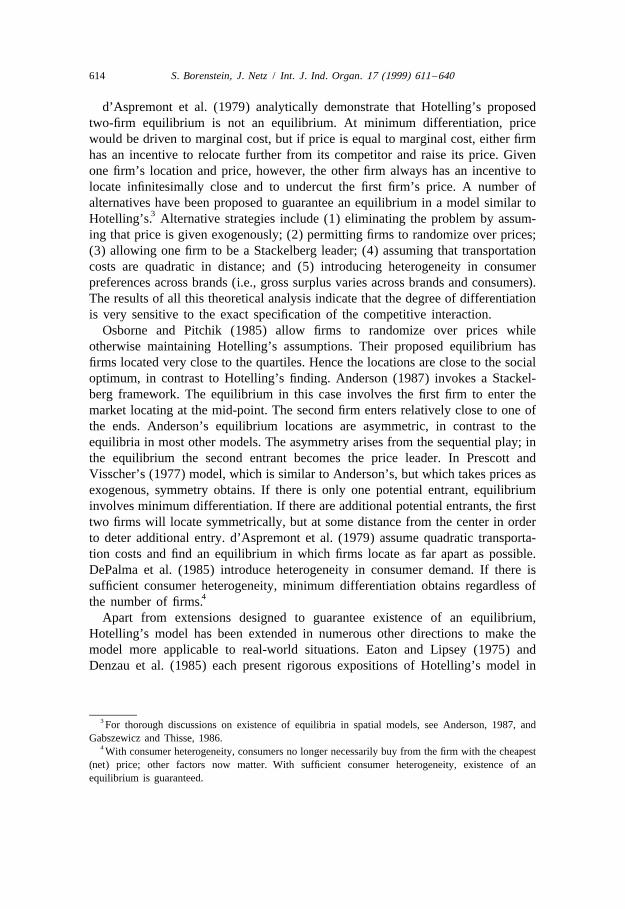
d’Aspremont et al. (1979) analytically demonstrate that Hotelling’s proposedtwo-firm equilibrium is not an equilibrium. At minimum differentiation, pricewould be driven to marginal cost, but if price is equal to marginal cost, either firmhas an incentive to relocate further from its competitor and raise its price. Givenone firm’s location and price, however, the other firm always has an incentive tolocate infinitesimally close and to undercut the first firm’s price. A number ofalternatives have been proposed to guarantee an equilibrium in a model similar to
3Hotelling’s. Alternative strategies include (1) eliminating the problem by assum-ing that price is given exogenously; (2) permitting firms to randomize over prices;(3) allowing one firm to be a Stackelberg leader; (4) assuming that transportationcosts are quadratic in distance; and (5) introducing heterogeneity in consumerpreferences across brands (i.e., gross surplus varies across brands and consumers).The results of all this theoretical analysis indicate that the degree of differentiationis very sensitive to the exact specification of the competitive interaction.
Osborne and Pitchik (1985) allow firms to randomize over prices whileotherwise maintaining Hotelling’s assumptions. Their proposed equilibrium hasfirms located very close to the quartiles. Hence the locations are close to the socialoptimum, in contrast to Hotelling’s finding. Anderson (1987) invokes a Stackel-berg framework. The equilibrium in this case involves the first firm to enter themarket locating at the mid-point. The second firm enters relatively close to one ofthe ends. Anderson’s equilibrium locations are asymmetric, in contrast to theequilibria in most other models. The asymmetry arises from the sequential play; inthe equilibrium the second entrant becomes the price leader. In Prescott andVisscher’s (1977) model, which is similar to Anderson’s, but which takes prices asexogenous, symmetry obtains. If there is only one potential entrant, equilibriuminvolves minimum differentiation. If there are additional potential entrants, the firsttwo firms will locate symmetrically, but at some distance from the center in orderto deter additional entry. d’Aspremont et al. (1979) assume quadratic transporta-tion costs and find an equilibrium in which firms locate as far apart as possible.DePalma et al. (1985) introduce heterogeneity in consumer demand. If there issufficient consumer heterogeneity, minimum differentiation obtains regardless of
4the number of firms.Apart from extensions designed to guarantee existence of an equilibrium,
Hotelling’s model has been extended in numerous other directions to make themodel more applicable to real-world situations. Eaton and Lipsey (1975) andDenzau et al. (1985) each present rigorous expositions of Hotelling’s model in
3 For thorough discussions on existence of equilibria in spatial models, see Anderson, 1987, andGabszewicz and Thisse, 1986.
4 With consumer heterogeneity, consumers no longer necessarily buy from the firm with the cheapest(net) price; other factors now matter. With sufficient consumer heterogeneity, existence of anequilibrium is guaranteed.

S. Borenstein, J. Netz / Int. J. Ind. Organ. 17 (1999) 611 –640 615
which sellers locate simultaneously and compete via location only. These papersanalyze the properties of location equilibria for any number of firms. By assumingthat firms compete only in location, they skirt the existence problem. They alsoignore the complication of potential entry. They are able to specify equilibria forany number of firms with the exception of three. Although minimum differentia-tion obtains only for two agents, equilibria for more firms is characterized bypairing of firms. For example, on a line of unit length with four firms, the
1 3 1] ] ]equilibrium has two firms at and two at . With five firms, two locate at , one4 4 6
1 5] ]at , and two at . Multiple equilibria exist for greater than five firms, and all2 6
equilibria are characterized by a pairing of firms, at least near the endpoints of theline, and by symmetry.
Location theory also has been applied to situations where firms locate more thanone outlet. For example, Martinez-Giralt and Neven (1988) examine a duopolywhere firms first locate two outlets, then choose price. Based on an assumption ofquadratic transportation costs, they find that firms will minimally differentiate their
5,6own locations and maximally differentiate relative to each other. However, theresult of maximum differentiation with respect to competitors is not robust. Forone thing, the assumption of quadratic transportation costs is crucial. Modelsallowing each firm to locate a single outlet (with price endogenous) also findmaximal differentiation under quadratic transportation costs. However, if equilib-rium is achieved by changing another assumption, for example, by introducingheterogeneity in consumer preferences, minimal differentiation obtains, as dis-cussed above. Work by Gabszewicz and Thisse (1986) and Bensaid and dePalma(1993) suggest that the finding of maximal differentiation may be driven by theassumption that each firm locates two outlets or the assumption that there are onlytwo firms, respectively. Gabszewicz and Thisse allow two firms to locate as many
7plants as they desire. In this case, the equilibrium will involve competitive pairs ofplants located evenly over the market space, similar to the equilibria in the abovemodels for even numbers of firms. That is, the firms differentiate their own outlets,but locate next to their competitors. Bensaid and de Palma extend the analysis tothree firms each locating up to two outlets. While confirming Martinez-Giralt andNeven’s maximum differentiation result for two firms with two outlets each, theyfind that (almost) anything goes when there are three firms. The three candidateequilibria under a two-stage, locate then price, game include: an equilibrium whereoutlets are evenly spaced, with each firm locating its two outlets at opposite sidesof the circle; an equilibrium where each firm reduces differentiation of its own
5 Hence, on a bounded line, each firm locates its outlets at one of the ends of the market. On a unitcircle, each firm locates its outlets together and directly across the circle from its competitor’s location.
6 In contrast, a monopolist would never locate two firms at the same point. Thus, a monopolist leadsto more differentiation than more competitive market structures.
7 Fixed costs are assumed to exist, which limits the number of plants each firm will establish.

616 S. Borenstein, J. Netz / Int. J. Ind. Organ. 17 (1999) 611 –640
outlets (though not to the point of minimum differentiation), while increasingdifferentiation relative to competitors’ outlets; and a mixed equilibrium, where twofirms bunch their own outlets at opposite sides of the circle, while the third firm
8locates its outlets between the competitors, on opposite sides of the circle. Thus, itappears that the literature with regard to firms locating multiple outlets leads toroughly the same equilibria as the literature constraining firms to locate only oneoutlet: reduced (but not minimal) differentiation, maximal differentiation, and avariety of outcomes in between these two extremes.
Hotelling’s model also has been extended to allow for elastic demand andvarious conjectural variations on the part of firms. Smithies (1941) allows elastic,albeit linear, demand and examines several conjectural variations. Again firms arecompeting across two dimensions, price and location. When one firm assumes thatits competitor will react via price but maintain its location, or assumes itscompetitor will strategically react via price and location, Smithies concludes thefirms will locate towards the center, although minimum differentiation may notobtain. With elastic demand, moving toward the center can result in the loss ofcustomers near the endpoints, depending on parameter values, hence this willmitigate the tendency towards minimum differentiation. Eaton (1972) confirmsSmithies’ most important results in a more mathematically rigorous investigation.He then derives the parameter values that result in minimum differentiation,showing that for a market length less than a critical value, which is a function ofthe demand parameters and the transport cost, minimum differentiation obtains.However, Eaton also notes that this equilibrium is unstable as no pure strategyprice choices exist. Furthermore, with elastic demand, Eaton demonstrates that anequilibrium with three firms can be reached in which the middle firm makes lowerprofits, charges a lower price, and has a smaller market share.
Eaton and Lipsey (1976) analyze the sensitivity of minimum differentiation tothe conjectural variations of firms and to the distribution of consumers on one- andtwo-dimensional, bounded and unbounded spaces. While they maintain somesimple assumptions—that demand is completely inelastic and that firms charge thesame base price—their contribution comes from allowing any distribution ofcustomers that can be represented by a well-behaved density function. In the caseof a finite linear space with zero conjectural variations, i.e., firms assume rivalswill leave their location unchanged, minimum differentiation occurs as both firmslocate at the median of the density function. However, for a unimodal density,
8 Bensaid and dePalma also consider equilibrium locations when two firms each locate two outletsbut recognize that a third firm may enter and locate up to two outlets. In that case outlets of the originaltwo firms are more differentiated, and depending on the magnitude of the fixed cost, the third firm maybe blockaded from the market, may locate one outlet, or may locate two outlets. This effect does notseem relevant to the case of airline scheduling, since airlines can re-schedule flights very quickly inresponse to entry. Netz and Taylor (1997) find that in locating retail gas stations, where the cost ofre-locating in response to entry is high, firms will increase locational differentiation in order to reducethe likelihood of entry.

S. Borenstein, J. Netz / Int. J. Ind. Organ. 17 (1999) 611 –640 617
there is no equilibrium for more than two firms. Eaton and Lipsey establish that‘‘[w]ith a variable customer density function that is not rectangular over any finiterange of [the line], a necessary condition for equilibrium is that the number of
9firms does not exceed twice the number of modes.’’ This theorem also applies tounbounded one-dimensional, e.g., circular, spaces. Eaton and Lipsey conclude thatHotelling’s results are sensitive to changes in conjectural variation and changes inthe distribution of customers. Importantly for our analysis, however, they showthat their results are generally not sensitive to market shapes and boundaries, e.g.,as one moves from a linear to a circular space. One characteristic of the equilibriaof Hotelling’s model for more than three firms—pairing of the firms closest to theendpoints—is of course not applicable to a circular space.
Thus, much of the theoretical work to date has concluded that less productdifferentiation results when many different firms control location choices thanwhen a single firm controls all outlets. Some studies, however, have found that thedifference between the monopoly and competitive location choices may be quitesmall if the firms compete in price as well as location, with the degree ofdifferentiation also depending on conjectural variations and the elasticity ofdemand. With prices set exogenously, the pure location decision yields only an‘‘attraction’’ force, which systematically results in minimum or decreased differen-tiation as each firm tries to steal customers from its competitors. When price isendogenous, the desire of each firm to limit price competition by increasing thedegree of differentiation results in the opposing ‘‘repulsion’’ force. Whichinfluence dominates when price is set endogenously depends upon the assumptionsmade, especially with regard to conjectural variations. We empirically estimate thedegree of differentiation in the airline industry to get a sense of whether the
10‘‘repulsion’’ force or the ‘‘attraction’’ force dominates in this particular industry.
3. Applying location theory to airline scheduling
The scheduling of airline departure times can be analyzed within a spatialframework, where the space on which we study airline location competition is aone-dimensional circle, in essence a 24-hour clock. Instead of consumers being
9 Eaton and Lipsey, 1976, p. 35. Wherever the density function is rectangular, the number of modes isinfinite.
10 While little empirical work has been done on the issue of spatial differentiation, Brown-Kruse etal., 1993, have conducted experimental work that supports the idea of minimum differentiation. In thetheoretical model on which they base the experiment, minimum differentiation is in the set of possibleequilibria. The observed equilibrium in the one-shot game experiment is minimum differentiation. In arepeated game with an unknown ending and without communication, players exhibit some, largelyunsuccessful, attempts to signal to the unknown partner a willingness to coordinate to the collusivelocations (at the quartiles), but in general minimum differentiation obtains. However, with non-bindingcommunications the observed location pattern is at the quartiles.

618 S. Borenstein, J. Netz / Int. J. Ind. Organ. 17 (1999) 611 –640
physically located, their ‘‘most preferred departure times,’’ as termed by Douglasand Miller (1974), are located over time. Given the distribution of preferreddeparture times, airlines then schedule their flights. In reality, of course, airlineschoose many strategic variables in a market simultaneously—including number offlights, departure times, prices, and service quality—in order to maximize profits.The airline industry deviates from theoretical models in a variety of other respectsas well: flight schedules on a route must be integrated into the carrier’s network offlights; the cost of rescheduling flights is neither prohibitive nor zero; and eachcarrier may schedule several flights on the same route. We do not attempt to createor estimate a full-blown model of an airline manager’s decision-making process.Instead, we estimate a structural equation for departure-time differentiation on aroute and attempt to account in the estimation for some of the network effects andother constraints faced by an airline.
One question that the literature does not tend to address is the effect ofcompetition in general on locational patterns. That is, how does the locationalpattern differ between a market characterized by two firms each locating threeoutlets compared to a market characterized by six firms each locating one outlet?The literature that assumes each firm locates one outlet in some cases comparesthe equilibria to outcome that obtains if a monopoly locates all the outlets. Amonopolist locates to minimize transportation costs (thus maximizing grosssurplus to consumers, allowing the monopolist to set higher prices). Thus, modelsthat predict minimal differentiation will find that a less competitive market (a
11monopoly market) has a more differentiated outcome, while models that predictmaximal differentiation will find that a monopoly market has a less differentiatedoutcome. The literature on multiproduct firms appears to support the aboveconclusions, though Bensaid and dePalma show that one candidate equilibriuminvolves firms replicating the monopoly outcome of equal-spacing over themarket. None of the models studies asymmetric markets where firms locate adifferent numbers of outlets. The routes that we analyze range from monopolies toeach carrier locating one flight, and any outcome in between. We assume that therelationship between the degree of competition and the degree of differentiation ismonotonic, and attempt to discover whether the relationship is positive ornegative. Some models suggest that, for a given number of flights on a route, anincrease in the number of firms competing on the route might decrease departure-
12time differentiation. On the other hand, alternative assumptions, for examplequadratic transportation costs or elastic demand, may mitigate or even reverse thistendency.
With differentiation by departure time in an airline market, the cost to aconsumer of taking a certain flight is the ticket price plus the cost to the consumer
11 Greenhut et al., 1987, suggest this is the case for airlines, though their argument rests in part on thepossibility that more concentrated markets lead to collusion.
12 In the next section we define an index for measuring the degree of differentiation.

S. Borenstein, J. Netz / Int. J. Ind. Organ. 17 (1999) 611 –640 619
of adapting travel plans to the flight’s departure time. Passengers’ most preferreddeparture times (MPDTs) are distributed around the clock, analogously toconsumers being physically located in a market relative to the physical location ofstores. A passenger incurs a cost from what Douglas and Miller term scheduledelay, i.e., the time between the MPDT and the flight taken. The cost per unit timewill vary across passengers according to their value of time, e.g., delay costs willbe greater for business travelers than for tourists. This departs from the theoriesdiscussed above, which assume equal transport cost per unit distance for allconsumers. Of course, passengers’ MPDTs are not distributed uniformly about the24-hour clock. As Eaton and Lipsey’s analysis indicates, one can expect anonuniform distribution to lead to a demand-driven lessening of departure-timedifferentiation, with the degree of this effect influenced by the amount ofcompetition on the route.
Airlines obviously compete on price as well as departure times in a market.Another complication lies in the fact that, unlike the theoretical work that assumeseach firms charges a single price, airlines charge a wide range of prices on mostroutes. However, average fares do not usually differ much among competingairlines on the same route. On routes with two or more active competitors (definedas a market share above 10%), less than 5% of the variance in fares on a route isdue to cross-carrier variation in average fares; the remainder is attributable to
13within-firm price variation. In the analysis below, we therefore assume allcarriers on a route charge the same average fare, though we recognize that thelevel of that average fare is determined simultaneously with the differentiation offlights through departure times. To gain more insight into the role that pricecompetition plays in influencing the degree of differentiation, we empiricallyanalyze data from 1986, when prices were unregulated and determined en-dogenously, and 1975, when the Civil Aeronautics Board set price exogenously, atleast relative to departure times on any one route.
Finally, the analysis must take into account the complicating factors referred toearlier. In particular, the analysis must take into account the externality thatscheduling a flight imposes on the rest of the network, since the plane used on oneroute is in use in prior and subsequent routes; scheduling constraints that arise atslot-constrained airports; and capacity constraints.
4. Data sources and measures of departure-time differentiation
We begin our empirical study of departure-time crowding in the airline industryby examining airline schedules in 1986, eight years after the industry wasderegulated. The flights are taken from the May 15, 1986 Official Airline Guide(OAG), North American Edition, which lists all scheduled direct flights between
13 See Borenstein and Rose, 1994.

620 S. Borenstein, J. Netz / Int. J. Ind. Organ. 17 (1999) 611 –640
14all North American airports. Our sample is limited to routes between the largest15200 domestic airports. The Herfindahl index, based on carrier shares of nonstop
flights, is also derived from the OAG listings.All traffic data are from the Department of Transportation’s Database 1A
(DB1A) for the second quarter of 1986, a 10 percent sample of all airline ticketssold in the United States. We further limit the sample to routes on which at least80% of all passengers fly direct and at least 36 passengers appeared in the DB1Aduring the quarter. If a substantial proportion of passengers do not fly direct, thenthe direct flights will be competing with connecting itineraries for which wecannot control given data limitations. We also assume that on routes with 3 to 6nonstop flights per day (in one direction), indirect flights that make one or moreintermediary stops are considered substantially inferior products that are largely
16ignored by airlines when they set departure times. Routes with less than 36passengers are excluded because we do not have sufficient data to calculate manyof the variables for these routes.
In order to analyze the causes of differentiation of departure times on a route,we must first construct a measure of it. In most spatial competition models, each ofthe outlets competes with only its most nearby neighbors for marginal sales. Inreality, however, every flight competes with every other flight on a route to agreater or lesser extent. For example, if two flights are scheduled around 8 am andone is scheduled at 10 am, each of the 8 am flights competes about equally withthe 10 am departure, even if one departs at 7:58 am and the other at 8:03 am; itwould be misleading to assume that the 10 am flight and the 7:58 am flight are notcompeting for the same passengers. For this reason, our analysis focuses on ameasure of departure time differentiation that takes into account the differentiationbetween every pair of flights on a route.
On a route with n daily departures departing at d , . . . d each expressed as1 n
minutes after midnight, we study the average distance between flights measured17as:
n21n2 a]]]AVGDIFF 5 O O [minhud 2 d u, 1440 2 ud 2 d uj] ,j.1 i j i jn(n 2 1) i51
0 , a , 1. (1)
AVGDIFF is the average of the absolute time difference between each pair offlights on the route raised to the a power. It is minimized at zero, when all flights
14 To be eligible to be included in an observation, a flight had to be operating during the week thatincluded May 15 and had to be scheduled to operate at least 5 days per week.
15 The 200th largest airport is Prudhoe Bay, Alaska, with average daily enplanements of 136 in thesecond quarter of 1986.
16 Inclusion in our regression analysis of a variable representing the number of multi-stop directflights did not affect our results and was never significant.
17 The number 1440 appears because this is the number of minutes in a day.
S. Borenstein, J. Netz / Int. J. Ind. Organ. 17 (1999) 611 –640 621
depart at the same time. It is maximized when the n flights are equally spacedaround the 24-hour clock. If a is near 0, then the measure is much more stronglyinfluenced by changes in the time between flights that are close together to beginwith. For instance, a one minute increase in the time between two flights that areten minutes apart will increase the index by more than a one minute increase in thetime between two flights that are three hours apart. As a increases, a change in thetime difference between two flights that are close together has a relatively smallereffect on AVGDIFF. As a approaches 1, the index is almost equally affected bychanges in the distance between flights that are close together or far apart to beginwith.
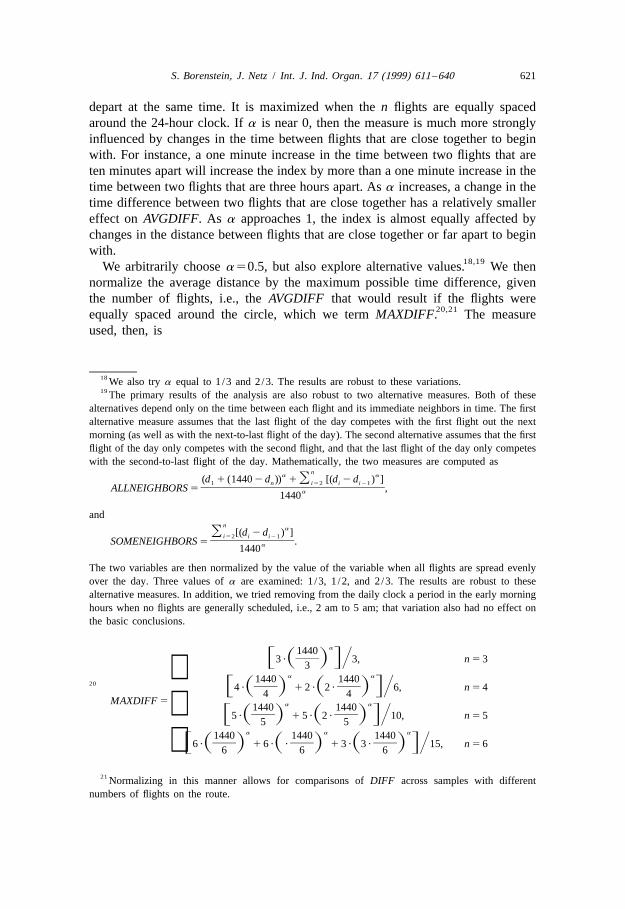
18,19We arbitrarily choose a 50.5, but also explore alternative values. We thennormalize the average distance by the maximum possible time difference, giventhe number of flights, i.e., the AVGDIFF that would result if the flights were
20,21equally spaced around the circle, which we term MAXDIFF. The measureused, then, is
18 We also try a equal to 1 /3 and 2/3. The results are robust to these variations.19 The primary results of the analysis are also robust to two alternative measures. Both of these
alternatives depend only on the time between each flight and its immediate neighbors in time. The firstalternative measure assumes that the last flight of the day competes with the first flight out the nextmorning (as well as with the next-to-last flight of the day). The second alternative assumes that the firstflight of the day only competes with the second flight, and that the last flight of the day only competeswith the second-to-last flight of the day. Mathematically, the two measures are computed as
na a(d 1 (1440 2 d )) 1O [(d 2 d ) ]1 n i52 i i21
]]]]]]]]]]ALLNEIGHBORS 5 ,a1440
andn
aO [(d 2 d ) ]i52 i i21]]]]]SOMENEIGHBORS 5 .a1440
The two variables are then normalized by the value of the variable when all flights are spread evenlyover the day. Three values of a are examined: 1 /3, 1 /2, and 2/3. The results are robust to thesealternative measures. In addition, we tried removing from the daily clock a period in the early morninghours when no flights are generally scheduled, i.e., 2 am to 5 am; that variation also had no effect onthe basic conclusions.
a1440]]F3 ?S D GY3, n 5 3
3a a 1440 144020 ]] ]]F4 ?S D 1 2 ?S2 ? D GY6, n 5 4
4 4MAXDIFF 5 a a1440 1440 ]] ]]F5 ?S D 1 5 ?S2 ? D GY10, n 5 5
5 5a a a1440 1440 1440
]] ]] ]]F6 ?S D 1 6 ?S ? D 1 3 ?S3 ? D GY15, n 5 6 6 6 6
21 Normalizing in this manner allows for comparisons of DIFF across samples with differentnumbers of flights on the route.

622 S. Borenstein, J. Netz / Int. J. Ind. Organ. 17 (1999) 611 –640
AVGDIFF]]]DIFF 5 . (2)MAXDIFF
Thus, DIFF gives the proportion of the maximum possible differentiation in flighttimes, and has a value in the interval [0, 1]. The closer the index to 1, the closerthe flights are to being evenly distributed over a 24-hour clock.
Table 1 presents the average values of the differentiation index for each of then-flight samples we study from May 1986 and the average index values for each of
22the observed market structures within each sample. Each observation includes allnonstop flights on a directional route, e.g., from Oakland to Denver (Denver toOakland is treated as a separate observation). This preliminary evidence supports
Table 11Average differentiation index by sample and market structure
3-flight markets-236 observations (DIFF /HERF correlation: 0.520)
Mkt Struc 3–0 2–1 1–1–1 All
Obs 182 44 10 236
Avg DIFF† 0.884* 0.794* 0.463 0.850
SE of Avg‡ (0.006) (0.019) (0.092) (0.009)
4-flight markets—222 observations (DIFF /HERF correlation: 0.497)
Mkt Struc 4–0 3–1 2–2 2–1–1 1–1–1–1 All
Obs 110 46 50 14 1 222
Avg DIFF† 0.877* 0.807 0.777 0.728 0.649 0.829
SE of Avg‡ (0.005) (0.013) (0.015) (0.051) (0.057) (0.007)
5-flight markets-166 observations (DIFF /HERF correlation: 0.492)
Mkt Struc 5–0 4–1 3–2 3–1–1 2–2–1 2–1–1–1 All
Obs 63 25 65 5 9 1 166
Avg DIFF† 0.901* 0.875* 0.846 0.828 0.794 0.737 0.878
SE of Avg‡ (0.006) (0.011) (0.006) (0.027) (0.044) – (0.005)
6-flight markets—152 observations (DIFF /HERF correlation: 0.286)
Mkt Struc 6–0 5–1 4–2 4–1–1 3–3 3–2–1 3–1–1–1 2–2–1–1 All
Obs 21 6 40 3 58 16 1 7 152
Avg DIFF† 0.877 0.854 0.828 0.805 0.850 0.861* 0.635* 0.747 0.842
SE of Avg‡ (0.010) (0.015) (0.009) (0.041) (0.007) (0.013) – (0.030) (0.005)
1The market structure indicates the number of flights by each carrier, e.g., 4–2 means one carrierschedules four flights and one carrier schedules two flights.*Indicates the mean is significantly different than that of the neighbor to the right at the 5% level.†The mean value of the differentiation index is significantly different from 1 at the 1% level for allsamples and market structures, except 1–1–1–1, which is significantly different from 1 at the 10%level.‡Standard errors of averages calculated under the assumption that all observations are independent.
22 The market structure refers to the distribution of flights among firms. Observations are divided intodifferent samples depending on the number of flights on the route.

S. Borenstein, J. Netz / Int. J. Ind. Organ. 17 (1999) 611 –640 623
the conjecture that competition is associated with less differentiation thanmonopoly. In all four samples, DIFF is positively and significantly correlated withthe Herfindahl index based on the number of flights. The average index increasesmonotonically with the Herfindahl index in the three-, four-, and five-flightsamples. In several of the cases, the averages are significantly different betweenneighboring cells.
Table 1 does not indicate the source of the decline in product differentiationwith competition. One explanation is that each firm schedules its flights moreclosely to competitors’ flights, as suggested by Hotelling, in an effort to sell tomore consumers. Alternatively, competition might lead to market segmentation,with each firm trying to schedule its flights far from the competitor’s flights and, asa result, crowding together its own flights, in an effort to reduce price competition.For instance, one firm might schedule all its flights on a route (in a given direction)in the morning and the other firm might schedule all its flights in the evening. Theformer explanation would imply that the interfirm differentiation would be lessthan intrafirm competition, while the latter would imply the opposite.
The measure of differentiation in a market can be partitioned into averagewithin- and between-firm differentiation, since each pair of flights considered inthe measure is either scheduled by the same airline or is scheduled by differentairlines. Simply comparing the average within and between measures of differen-tiation across routes, however, could be misleading, because the possible values ofeach measure depend on the market structure that determines the number of withinand between pairings. To compare within-firm with between-firm differentiation,we use a measure that takes as given the market structure, i.e., the allocation of thenumber of flights among firms, as well as the departure time of each flight. Wecalculate the average time distance between flights scheduled by competitors byapplying Eq. (1) to the subset of flight differences, ud 2d u, where the carriersi j
scheduling flights departing at d and at d are different. We refer to this variable asi j
BTWNDIFF. We then normalize BTWNDIFF by the average time distancebetween all flights on the route, i.e., AVGDIFF. The resulting variable isBTWNRATIO, the ratio of the average time distance between flights scheduled by
23different carriers to the average time distance between all flights. BTWNRATIOis an indicator of whether the observed between-firm differentiation is greater
23 BTWNRATIO can be calculated in another manner as well. We can compare the between (orwithin) measures with that which would result if the same departure times were distributed differentlyamong the firms. For example, consider a route with 3 flights, departing at (A1) 8 am, (B) 9 am, and(A2) 3 pm, with (A1) and (A2) flown by firm A and (B) flown by firm B. We compare the average of
a athe two between-firm time difference measures, u8 am–9 amu and u9 am–3 pmu , with the averagebetween-firm difference that would result if firm B operated the 8 am or the 3 pm flight instead of the 9am flight. This alternative interpretation of BTWNRATIO, the ratio of the observed between-firmaverage differentiation to the average between-firm measure for all possible allocations of the sameflight shares across the same departure times, is also an indicator of whether between-firm orwithin-firm differentiation dominates on the route.
624 S. Borenstein, J. Netz / Int. J. Ind. Organ. 17 (1999) 611 –640
(ratio .1) or less (ratio ,1) than the flight differentiation in the market as a24whole.
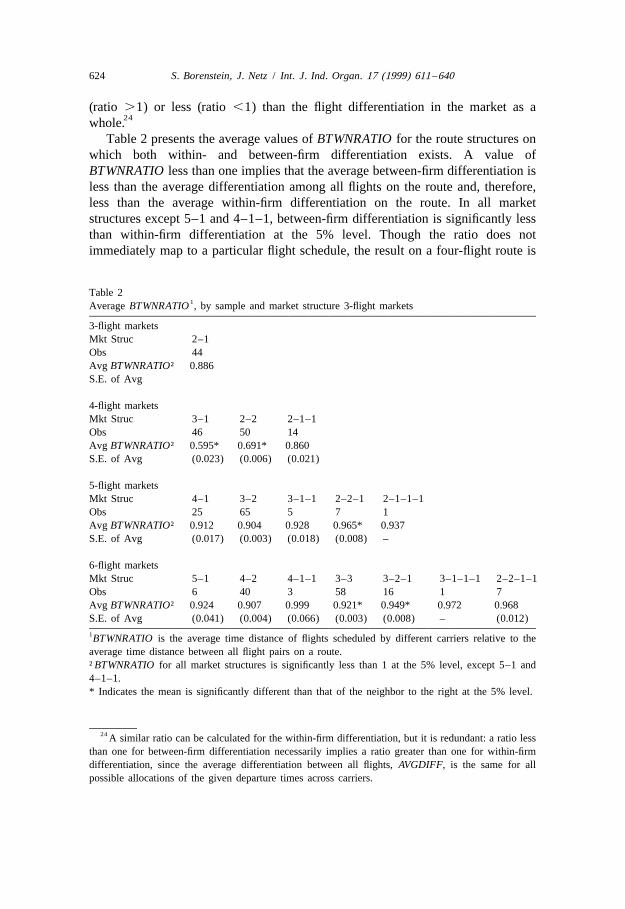
Table 2 presents the average values of BTWNRATIO for the route structures onwhich both within- and between-firm differentiation exists. A value ofBTWNRATIO less than one implies that the average between-firm differentiation isless than the average differentiation among all flights on the route and, therefore,less than the average within-firm differentiation on the route. In all marketstructures except 5–1 and 4–1–1, between-firm differentiation is significantly lessthan within-firm differentiation at the 5% level. Though the ratio does notimmediately map to a particular flight schedule, the result on a four-flight route is
Table 21Average BTWNRATIO , by sample and market structure 3-flight markets
3-flight marketsMkt Struc 2–1Obs 44Avg BTWNRATIO† 0.886S.E. of Avg
4-flight marketsMkt Struc 3–1 2–2 2–1–1Obs 46 50 14Avg BTWNRATIO† 0.595* 0.691* 0.860S.E. of Avg (0.023) (0.006) (0.021)
5-flight marketsMkt Struc 4–1 3–2 3–1–1 2–2–1 2–1–1–1Obs 25 65 5 7 1Avg BTWNRATIO† 0.912 0.904 0.928 0.965* 0.937S.E. of Avg (0.017) (0.003) (0.018) (0.008) –
6-flight marketsMkt Struc 5–1 4–2 4–1–1 3–3 3–2–1 3–1–1–1 2–2–1–1Obs 6 40 3 58 16 1 7Avg BTWNRATIO† 0.924 0.907 0.999 0.921* 0.949* 0.972 0.968S.E. of Avg (0.041) (0.004) (0.066) (0.003) (0.008) – (0.012)1BTWNRATIO is the average time distance of flights scheduled by different carriers relative to theaverage time distance between all flight pairs on a route.†BTWNRATIO for all market structures is significantly less than 1 at the 5% level, except 5–1 and4–1–1.* Indicates the mean is significantly different than that of the neighbor to the right at the 5% level.
24 A similar ratio can be calculated for the within-firm differentiation, but it is redundant: a ratio lessthan one for between-firm differentiation necessarily implies a ratio greater than one for within-firmdifferentiation, since the average differentiation between all flights, AVGDIFF, is the same for allpossible allocations of the given departure times across carriers.
S. Borenstein, J. Netz / Int. J. Ind. Organ. 17 (1999) 611 –640 625
more consistent with two firms each having one morning and one evening flightthan with one firm having two morning flights and the other having two eveningflights. In other words, on average, firms schedule their flights more closely tocompetitors’ flights than to their own flights. However, it is not clear whether thisscheduling occurs for strategic reasons or due to constraints such as networkconsideration. To more thoroughly investigate the effect of competition ondifferentiation of departure times, we must also control for other factors that affectflight scheduling.
5. An econometric model of departure-time differentiation
In the regression analysis, we seek primarily to estimate the effect ofcompetition on departure-time differentiation. We measure competition withCOMP, which is equal to the inverse of the Herfindahl index calculated by shares
25of nonstop flights. Based on Hotelling’s conjecture and the preliminary results,we would expect that as competition on the route increases, holding constant thetotal number of flights, product differentiation is lessened. Another category ofvariables that is likely to significantly affect departure time differentiation isdemand patterns. As demonstrated by Eaton and Lipsey, demand patterns willinfluence the scheduling of flights, causing flights to be less crowded together onroutes where the MPDTs of the potential customers are more diffuse. We employtwo variables to capture such demand-driven crowding, reflecting the distributionof MPDTs and the cost to passengers of deviating from their MPDT. First, thedistribution of MPDTs tends to be more concentrated on routes where certainnormal hours of departure time, not in the middle of the night, would result inarrivals in the middle of the night. If demand is substantially less for flights thateither depart or arrive during the early morning hours, then MPDTs and actualdeparture times will be more concentrated on long flights and on flights from thewestern to the eastern U.S., due to the associated time change. Flights from SanFrancisco to New York, for instance, involve a nine-hour time loss including thetime change. For such a route, few passengers will want to depart between 3 pmand 10 pm local San Francisco time, as they would arrive in New York in the veryearly morning hours. In contrast, flights from New York to San Franciscoeffectively take only three hours, so that passengers can leave New York as late as9 pm and still arrive in San Francisco before midnight. We control for this MPDT
25 This variable exhibits much better explanatory power than the Herfindahl index. We have alsoestimated the model with separate dummy variables for each market structure. The qualitative resultsare unchanged and the additional variables are not a statistically significant improvement over the moreparsimonious model.

626 S. Borenstein, J. Netz / Int. J. Ind. Organ. 17 (1999) 611 –640
distribution effect with a travel time variable, TRVTIME, the average scheduled26nonstop time of travel on the route plus the effect of any time zone changes.
Another factor in flight scheduling involves the cost to passengers of flying onan inconvenient flight. Theoretical work has tended to assume that this cost isidentical across consumers. In a homogeneous setting with elastic demand, as thecost to passengers of inconvenience rises, ceteris paribus, the airline will have anincentive to increase differentiation in order to avoid losing customers at the endsof the market. Of course, in reality this cost differs over passengers. Though weare not able to analyze the effect of heterogeneity in delay costs among customerson a single route, we attempt to control for differences in average delay costs ofpassengers on different routes. We attempt to control for differences in delay costsbetween tourists and business travelers. Business travelers probably differ fromothers in at least two important ways: they place a higher cost on deviating fromtheir MPDTs and their MPDTs are probably more concentrated into a few hours ofthe day. The second factor clearly suggests that there will be less departure timedifferentiation on business-oriented routes. The first factor, however, suggests thattourist travelers have weaker preferences among flights. This could mean thatcompetitive scheduling is both less costly to consumers and less effective inattracting them. Airlines would be more free to schedule flights strategically,whether that means greater or less differentiation, because they are less constrainedby consumer demand. Thus, the effect could be to increase or decrease differentia-tion compared to a business route with the same demand pattern. We measure theproportion of customers on a route who are on vacation or other nonbusiness
27matters using the variable TOUR.The degree of departure-time crowding also will be affected by supply-side
considerations other than the spatial competition that is our primary focus. Thecost to an airline of rescheduling a flight for competitive purposes will depend onthe degree to which the flight is integrated into the network of the airline. Forinstance, if TWA’s flight from Philadelphia to St. Louis carries mostly passengerswho switch planes at St. Louis in order to continue their trips westward, then TWAwill schedule this flight to coincide with its other flights from the east coast thatarrive at St. Louis at nearly the same time and then depart 30–60 minutes later forvarious points to the west (which is known in the industry as a ‘‘bank’’ of flights).It would be quite costly for TWA to reschedule this flight in order to compete withanother airline for local Philadelphia–St. Louis passengers, since rescheduling may
26 We also tried including a variable indicating flights that were sufficiently long, over six hours oftravel time, that they could be scheduled on a red-eye basis. Including this variable did not affect theother results, and was significant only in the 3-flight sample.
27 Borenstein, 1989, explains the construction of this variable. Briefly, it is an estimate of theproportion of total city income derived from hotel expenditures of tourists. To construct the variable atthe route-level, we weight the tourist index at each endpoint city by the proportion of tickets originatingat the other city.
S. Borenstein, J. Netz / Int. J. Ind. Organ. 17 (1999) 611 –640 627
make layovers too short or too long, so that TWA would lose connectingpassengers. Thus, scheduling rigidities caused by integration of a flight into thecarrier’s network would tend to dampen the effect of strategic schedulingincentives. We attempt to capture this effect with a dummy variable, HUB, equal to
28one when either endpoint of the route is a hub for one of the carriers. If carriersdesire to locate their flights near competitors’, then the additional logistical costsof doing so at a hub would lead to increased departure time differentiation relativeto a situation without network considerations. Conversely, if carriers prefer tolocate their flights away from competitors’, then logistical complexities of a hubwould lead to decreased departure time differentiation.
Another consideration in strategic scheduling is capacity constraints. Even on aroute with no connecting passengers and no flights integrated into the airlines’networks, the incentive to strategically adjust departure times may be lessened ifdemand is high relative to the number of flights or seats offered. If there is atendency for carriers to locate flights near their competitors’ in order to stealcustomers, that incentive would be reduced if most flights are nearly full. If thereis an incentive to locate flights away from competitors’ in order to reduce pricecompetition, the threat of price competition would also be reduced if flights arenear full, so this motivation for rescheduling flights away from competitors woulddecline. To capture this effect, we include the average load factor, which is the
29,30percentage of seats occupied, on nonstop flights on the route, LOADFAC. Weexpect that on routes with high load factors, carriers will be less likely tostrategically schedule flights.
At some airports, congestion is controlled not by queuing, but by a system ofproperty rights for take-off and landing clearance at different times of the day,known as slots. We posit that slots would impede attempts to schedule flightsstrategically in response to competition. SLOT is equal to one if one of theendpoint airports is slot controlled—Chicago O’Hare, Washington National, NewYork’s Kennedy and La Guardia airports, Orange County, or Long Beach—andzero otherwise. If strategic scheduling results in a net attraction between differentbrands (less brand differentiation), then because SLOT impedes strategic schedul-
28 The following airport-carrier pairs are identified as hubs: Chicago O’Hare for American Airlinesand United Airlines; Atlanta for Delta and Eastern; Dallas–Ft. Worth for American and Delta; Denverfor Continental, United, and Frontier; St. Louis for TWA and Ozark; Miami for Eastern; Detroit forRepublic; Minneapolis for Republic and Northwest; Phoenix for Southwest and America West;Pittsburgh for USAir; Houston Intercontinental for Eastern and Continental; Charlotte for Piedmont;Salt Lake City for Western; Memphis for Republic; Baltimore for Piedmont; and Kansas City forEastern. In this analysis, we take the location and existence of hubs to be exogenous to thedeparture-time differentiation on individual routes.
29 LOADFAC may be endogenous, an issue we discuss below.30 The issues of congestion, capacity, or increasing marginal cost are not addressed in the theoretical
literature that we have reviewed because those models assume constant, usually zero, marginal costs.
628 S. Borenstein, J. Netz / Int. J. Ind. Organ. 17 (1999) 611 –640
ing, it would be expected to have a positive coefficient, i.e., SLOT constrains acarrier to schedule with more differentiation than desired. Likewise, if strategicscheduling results in a net repulsion between different brands (more branddifferentiation), then SLOT would be expected to have a negative coefficient.
Finally, it is possible that profits per passenger will affect the tendency of firmsto crowd near competing locations. The discussion above identifies the costs toairlines of strategically scheduling a flight. Whether an airline is willing to bearsuch costs depends on its gain from doing so. In particular, on a route with a highprice /cost margin, a firm might have a greater incentive to schedule flightsstrategically to gain more local passengers on the route at the cost of poorerconnections for passengers changing planes or poorer overall integration of theflight into the carrier’s network schedule. On the other hand, high profits perpassenger may increase the ‘‘repulsion’’ force, since carriers have more to lose byincreasing price competition by moving flights more closely to competitors’.Because we cannot directly measure profitability, to capture this effect, we includeRELFARE, a measure of the average fare on the route relative to the average fare
31,32on all other routes in the U.S. of similar distance. Because a high price /costmargin may strengthen the ‘‘attraction’’ and the ‘‘repulsion’’ forces, we cannotmake a sign prediction.
All of the variables that we have discussed, other than COMP, are hypothesizedto have a different effect as the level of competition on a route changes. A carrierwith a monopoly on a route, for instance, will respond to demand- and supply-sideconditions without worrying about losing passengers to competitors or increasing
33price competition. We address this issue by assuming a log–log relationship.
LDIFF 5 b 1 b LCOMP 1 b HUB 1 b LTRVTIME 1 b LTOUR0 1 2 3 4
1 b SLOT 1 b LLOADFAC 1 b LRELFARE 1 e. (3)5 6 7
One econometric difficulty is that the degree of differentiation may affect therelative fare or the load factor. As the degree of differentiation declines, pricecompetition increases, driving the fare down. We control for the effect of DIFF onRELFARE using instrumental variables. The instruments used in addition to theincluded exogenous variables are the share of flights served by non-majors on the
34route and carrier dummies indicating those carriers that serve the route.Scheduling convenience may also affect the number of passengers who fly nonstop
31 To be precise, we calculate the average fare for all routes in every 50-mile category (e.g., 200–249miles, 250–299 miles, etc.) and compare the average fare on a route to the average for routes in itscategory.
32 RELFARE is almost certainly endogenous, as discussed below.33 The primary results are robust to linear and log–linear functional forms.34 2The first stage fits well, with R s over 0.55.
S. Borenstein, J. Netz / Int. J. Ind. Organ. 17 (1999) 611 –640 629
on the route relative to capacity. Specification tests, however, do not reject the35hypothesis that LOADFAC is exogenous. Because two-stage least squares results
are substantially noisier, but not substantially different, we report results withLOADFAC treated as exogenous.
Recognition of the possible effect of location competition on entry also raises anissue due to the nonrandom nature of each sample. We have taken the factors thatdetermine the number of flights on a route to be irrelevant to analysis of the degreeof departure-time differentiation of those flights. It is possible, however, that thenumber of flights on a route, which dictates whether or not a route is in a givensample, is determined in part by variables that are effectively part of the residual inEq. (3). Even if the right-hand-side variables would be orthogonal to the residualin a ‘‘complete’’ sample, they could be correlated with the residuals in thisnonrandom sample, which would lead to inconsistent coefficient estimates. Thisconcern is common in labor economics studies that use nonrandom populationsamples. In our case, the resulting truncation is incidental, rather than direct,because the dependent variable in our study is not the basis for sampling.
The truncation problem in this instance is somewhat more complicated than in atypical labor supply study, for instance. In this case, the basis for selection is thatthe number of flights be exactly equal to the selection criterion, no greater and noless. Furthermore, we do not have a sample of included and excluded observationsthat would allow us to estimate Heckman’s (1977) selection equation and then
ˆinclude the resulting l as a right-hand-side variable in Eq. (3).Instead, we consider the bias that might result from estimating (3) ignoring the
sample selection issue. The most apparent source for selection bias is that COMP,which appears in (3), might also appear in the selection equation. In particular, fora given route demand, routes with more competition may have lower prices andmore flights. Thus, one indication of possible bias would be a correlation acrossthe observations in the sample between COMP and other variables that would bein a selection equation. The correlation one might then expect to find within ann-flight sample is lower demand on routes that have greater competition. In eachof the samples, however, COMP is not significantly correlated with the totalnumber of passengers on the route or with exogenous measures of market demandsuch as the size of the endpoint populations. In fact, COMP tends to show a weakpositive correlation with market size. Therefore we conclude that the potentialsample selection issue does not bias our results.
35 The specification tests were carried out first using measures of endpoint populations as identifyinginstruments, and then also using the ratio of endpoint populations to capacity on the route. Taking routecapacity as exogenous is questionable, but it is not much different from our sample structure that takesnumber of flights on the route as exogenous. In the first case, exogeneity could not be rejected in any ofthe regressions at the 10% level. In the second case, exogeneity could be rejected at 10% for one of thefour regressions.
630 S. Borenstein, J. Netz / Int. J. Ind. Organ. 17 (1999) 611 –640
A final econometric issue is possible correlation between the residuals ofdifferent observations. An observation in these datasets includes all nonstop flightsfrom airport A to airport B. If the same number of daily flights take place fromairport B to A, then that will be a separate observation in the same dataset.Between one-third and one-half of all observations in each dataset are on routes onwhich there are two included observations, one in each direction. In the 3-flightand 4-flight datasets, there is significant positive correlation between the residualson routes from which two observations are drawn. On the other two, thecorrelation is positive, but not significant at the 10% level. We estimate theregressions using the Huber correction to estimates of standard errors when thereis group correlation among the residuals, as implemented in the Stata statistical
36package.
6. Results
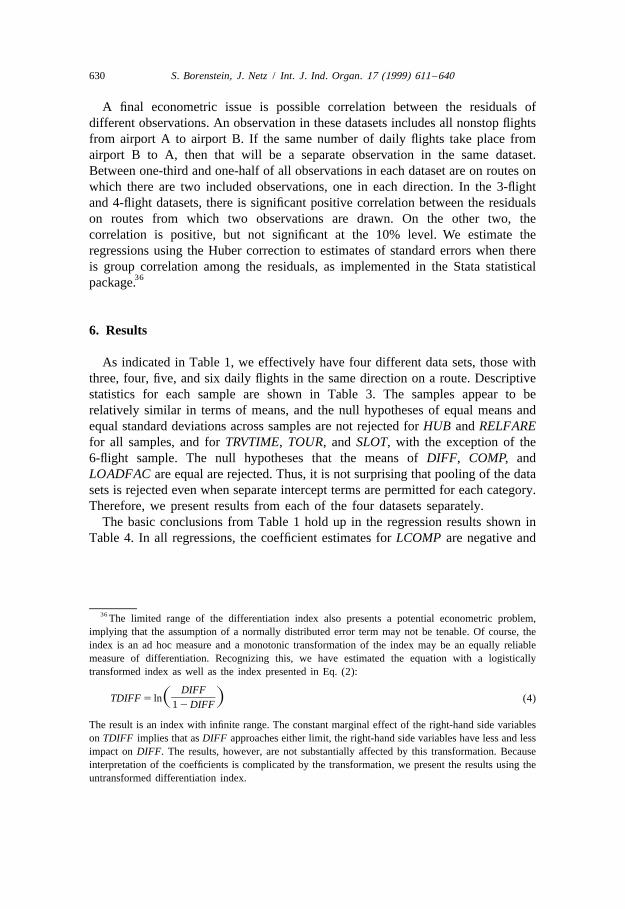
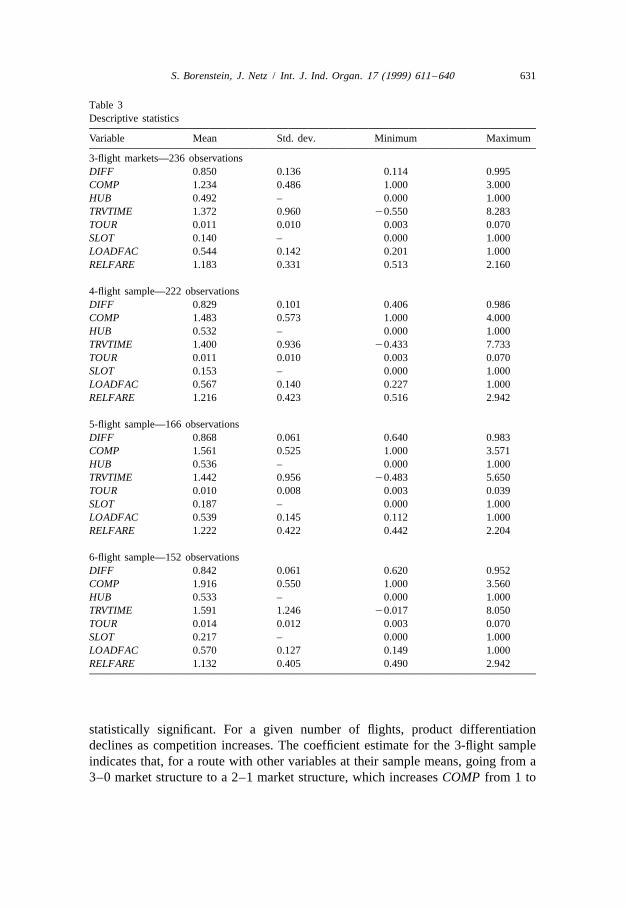
As indicated in Table 1, we effectively have four different data sets, those withthree, four, five, and six daily flights in the same direction on a route. Descriptivestatistics for each sample are shown in Table 3. The samples appear to berelatively similar in terms of means, and the null hypotheses of equal means andequal standard deviations across samples are not rejected for HUB and RELFAREfor all samples, and for TRVTIME, TOUR, and SLOT, with the exception of the6-flight sample. The null hypotheses that the means of DIFF, COMP, andLOADFAC are equal are rejected. Thus, it is not surprising that pooling of the datasets is rejected even when separate intercept terms are permitted for each category.Therefore, we present results from each of the four datasets separately.
The basic conclusions from Table 1 hold up in the regression results shown inTable 4. In all regressions, the coefficient estimates for LCOMP are negative and
36 The limited range of the differentiation index also presents a potential econometric problem,implying that the assumption of a normally distributed error term may not be tenable. Of course, theindex is an ad hoc measure and a monotonic transformation of the index may be an equally reliablemeasure of differentiation. Recognizing this, we have estimated the equation with a logisticallytransformed index as well as the index presented in Eq. (2):
DIFF]]]TDIFF 5 lnS D (4)1 2 DIFF
The result is an index with infinite range. The constant marginal effect of the right-hand side variableson TDIFF implies that as DIFF approaches either limit, the right-hand side variables have less and lessimpact on DIFF. The results, however, are not substantially affected by this transformation. Becauseinterpretation of the coefficients is complicated by the transformation, we present the results using theuntransformed differentiation index.
S. Borenstein, J. Netz / Int. J. Ind. Organ. 17 (1999) 611 –640 631
Table 3Descriptive statistics
Variable Mean Std. dev. Minimum Maximum
3-flight markets—236 observationsDIFF 0.850 0.136 0.114 0.995COMP 1.234 0.486 1.000 3.000HUB 0.492 – 0.000 1.000TRVTIME 1.372 0.960 20.550 8.283TOUR 0.011 0.010 0.003 0.070SLOT 0.140 – 0.000 1.000LOADFAC 0.544 0.142 0.201 1.000RELFARE 1.183 0.331 0.513 2.160
4-flight sample—222 observationsDIFF 0.829 0.101 0.406 0.986COMP 1.483 0.573 1.000 4.000HUB 0.532 – 0.000 1.000TRVTIME 1.400 0.936 20.433 7.733TOUR 0.011 0.010 0.003 0.070SLOT 0.153 – 0.000 1.000LOADFAC 0.567 0.140 0.227 1.000RELFARE 1.216 0.423 0.516 2.942
5-flight sample—166 observationsDIFF 0.868 0.061 0.640 0.983COMP 1.561 0.525 1.000 3.571HUB 0.536 – 0.000 1.000TRVTIME 1.442 0.956 20.483 5.650TOUR 0.010 0.008 0.003 0.039SLOT 0.187 – 0.000 1.000LOADFAC 0.539 0.145 0.112 1.000RELFARE 1.222 0.422 0.442 2.204
6-flight sample—152 observationsDIFF 0.842 0.061 0.620 0.952COMP 1.916 0.550 1.000 3.560HUB 0.533 – 0.000 1.000TRVTIME 1.591 1.246 20.017 8.050TOUR 0.014 0.012 0.003 0.070SLOT 0.217 – 0.000 1.000LOADFAC 0.570 0.127 0.149 1.000RELFARE 1.132 0.405 0.490 2.942
statistically significant. For a given number of flights, product differentiationdeclines as competition increases. The coefficient estimate for the 3-flight sampleindicates that, for a route with other variables at their sample means, going from a3–0 market structure to a 2–1 market structure, which increases COMP from 1 to

632 S. Borenstein, J. Netz / Int. J. Ind. Organ. 17 (1999) 611 –640
Table 4IV estimation of log–log specification dependent variable: LDIFF
Flight sample: 3-flight 4-flight 5-flight 6-flight
CONSTANT 20.159 20.052 20.054 20.149***(0.171) (0.086) (0.046) (0.051)
LCOMP 20.450*** 20.206*** 20.117*** 20.075***(0.120) (0.034) (0.019) (0.027)
HUB 20.028 20.036 20.017** 20.021*(0.058) (0.033) (0.011) (0.013)
SLOT 20.143* 20.071** 20.014 20.018(0.078) (0.045) (0.014) (0.018)
LLOADFAC 20.094 20.068* 0.001 0.005(0.060) (0.040) (0.014) (0.029)
LTVTIME 20.075** 20.017* 0.002 0.006(0.038) (0.010) (0.006) (0.010)
LTOUR 20.010 0.020 0.006 20.008(0.029) (0.017) (0.009) (0.010)
LRELFARE 20.091 0.063 20.021 0.012(0.103) (0.054) (0.019) (0.029)
Observations 231 220 170 1532R 0.40 0.30 0.26 0.07
***Significant at 1%. **Significant at 5%. *Significant at 10%.
37,381.8, causes the index to fall from 0.856 to 0.657. The former index correspondsto one flight at 8 am, one at noon, and one at 5:05 pm, while the latter wouldimply moving the third flight up to 2:30 pm if the first two remained at 8 am andnoon. Moving from a 3–0 market to a 1–1–1 market structure causes the index tofall to 0.522, corresponding to 8 am, noon, and 12:09 pm flights.
While that conclusion might be interpreted as support for a Hotelling-likeincentive to strategically locate brands near competitors’, other interpretations arealso possible. One might argue, for instance, that the observed effect results fromthe network integration problem that each carrier must solve. A single airlineschedules its flights on a given route so that they make the most valuable orprofitable links with the airline’s other flights. This is likely to involve schedulingdeparture times so that the flights arrive or depart a hub airport at the same timesas the carrier’s other flights. It also involves scheduling equipment so that anaircraft is properly positioned to be used for a sequence of profitable flights. Incomparison, even if two carriers on a route were not strategically positioning theirflights to gain a larger share of traffic on the route, the fact that their other flights
37 Continuous variables are evaluated at their means. For this example, we assume that this is a routethat includes a slot-constrained airport (SLOT51) and does not include a hub (HUB50).
38 Note that the change is quite large, 80% in this case, so the change in the log value is not a closeapproximation to the percentage change.
S. Borenstein, J. Netz / Int. J. Ind. Organ. 17 (1999) 611 –640 633
on other routes are not coordinated across airlines is likely to lead to morecrowding of the airlines’ flights on the observed route. Thus, while morecompetition is correlated with less product differentiation, it may not follow thatcompetition causes a strategic attraction tendency between brands. Indeed, theresults on the other variables suggest that may not be the case.
For example, two of the independent variables—HUB and SLOT—indicate theease with which an airline can schedule its flights. The coefficients on thesevariables are all negative and half are statistically significant. When a routeincludes a hub or a slot-constrained airport, the airlines have less flexibility inscheduling. The negative coefficient indicates that, given the constraint, flights arescheduled with less differentiation than without the constraint. That is, firms wouldprefer more differentiation.
The estimated impact of LOADFAC is less robust, but its negative estimatedcoefficient for the 3- and 4-flight samples also can be interpreted as implying a sort
39of competitive ‘‘repulsion’’ rather than ‘‘attraction’’ among carriers. When loadfactors are high, we argued that firms have less desire to engage in strategicscheduling, of either the attraction or the repulsion type. The negative coefficientestimates indicate that this decline in strategic scheduling is associated with adecline in product differentiation, implying that strategic scheduling causes
40increased product differentiation.The impact of travel time (TRVTIME) is generally negative as predicted. The
longer the travel time, the more airlines are constrained by passengers’ MPDTs.Routes with longer flights as measured by travel time tend to exhibit less productdifferentiation, probably due to the increased difficulty of scheduling arrival anddeparture times that are both at times that travelers consider reasonable.
The results on LTOUR and LRELFARE are not robust; the coefficients on bothvariables alternate in sign, and neither is significant. The results on LTOUR maybe due to the conflicting incentives tourist passengers offer airlines. We argued thatthe preferred departure times of tourists are more spread out over the day, which,ceteris paribus, would lead to more differentiation. However, the schedule delaycost to tourists is low, reducing the incentive to respond to these passengers andallowing the airline to continue to respond to the demands of business travelers.Also, business travelers are a source of considerably more profit than are tourists,so unless a route is primarily tourists, it may well pay for an airline to cater tobusiness travelers, despite losing tourist passengers. The results on LRELFAREmay similarly be due to the conflicting incentives arising from high price /cost
39 The estimated (positive) coefficients in the 5- and 6-flight sample are not close to conventionalsignificance levels.
40 A referee points out an alternative interpretation: routes with higher LOADFAC may be those withmore distinct demand peaks not captured by our demand variables, which would also be associatedwith less departure-time differentiation for reasons not related to strategic scheduling.

634 S. Borenstein, J. Netz / Int. J. Ind. Organ. 17 (1999) 611 –640
margins. While a high margin increases the attraction force, since there is more tobe gained by stealing customers, it also strengthens the repulsion force, becausethere is more to lose from increasing price competition. It may be that, on average,
41these two forces offset each other.Overall, one might interpret our results as suggesting that airlines are inclined to
schedule flights such that they are farther away from competitors, rather thansuccumbing to an incentive for minimal differentiation. The variables that measureconstraints on scheduling indicate that constraints lead to less differentiation.
While these results are provocative, a possibly cleaner test of the basic Hotellingconjecture is available using data from the regulated period in the airline industry.In that era, the threat of price competition was absent, since fares were set byregulators. In such a situation, airlines can schedule their flights closer togetherwithout a fear of increased price competition.
7. Differentiation with exogenous prices: The airline regulation era
To gain some insight into the effect of price competition on the tendency offirms to differentiate their product, we also have gathered data for 1975, a periodin which airlines were subject to fare and entry regulation. Because data on airlinesand departure times must be gathered by hand from the Official Airline Guide, weonly have data for three- and four-flight routes. During this period of regulation,fares were set exogenously by the Civil Aeronautics Board, based on the distanceof the flight. In 1986, while an airline had an incentive to schedule its flight closeto competitors’ in order to steal customers, the downside to such a strategy was anincrease in price competition due to reduced product differentiation. In 1975, this
42offsetting effect was considerably muted.The variables for the 1975 analysis are calculated in much the same manner as
described previously. The most notable change is the substitution of FARE forRELFARE. Recall that RELFARE is included as a proxy for the price /cost margin.Since the CAB set airfares using a distance-based formula, virtually all routes ofthe same distance had the same fare, and a relative fare measure such as we usedfor the 1986 data would not be useful in controlling for cost. However, it is widelyrecognized that longer routes with higher fares also had higher price /cost margins.That is, the marginal price per mile in the CAB fare formula was greater than the
41 It is also worth noting that TOUR and RELFARE are significantly negatively correlated, whichcould account for the large standard errors on their parameter estimates. However, TOUR andRELFARE are also jointly insignificant.
42 Firms were still able to compete on service quality and other factors, including flight frequency. Infact, service-quality competition led to much lower load factors and greater excess capacity on routesprior to deregulation. Thus, the sample of routes with a given number of flights could be quite differentin 1975 than in 1986. For example, the 4-flight routes in 1975 have fewer total passengers.

S. Borenstein, J. Netz / Int. J. Ind. Organ. 17 (1999) 611 –640 635
actual marginal cost of flying a longer route. We therefore use FARE to control forthe effect of profitability on differentiation, since higher fares are generallyassociated with higher price /cost margins. The 1975 data also differ from the 1986approach in that the route structure under regulation was a point-to-point system,
43rather than a hub-and-spoke system. Thus, there is no hub variable in this sample.Finally, only four airports were slot-constrained in 1975: Chicago O’Hare, NewYork’s Kennedy and LaGuardia airports, and Washington National. The means andstandard deviations for all variables are very similar across the two time periods,as can be seen by comparing Tables 3 and 5.
We begin by examining the same descriptive statistics as before. An examina-tion of the average differentiation index across various market structures, aspresented in Table 6, reveals the same pattern as in the deregulation-era data. Whatdoes differ is the correlation between the degree of product differentiation and theHerfindahl index. Surprisingly, the two variables are correlated at a much lower
44level during the regulated period. Absent the threat of price competition,
Table 5Descriptive statistics
Variable Mean Std. dev. Minimum Maximum
3-flight markets—267 observationsDIFF 0.847 0.116 0.462 0.998COMP 1.202 0.408 1.000 3.003TRVTIME 1.284 1.168 20.367 8.000TOUR 0.014 0.017 0.002 0.070SLOT 0.090 – 0.000 1.000LOADFAC 0.523 0.138 0.142 0.839FARE* 68.62 44.20 26.45 260.18
4-flight sample-150 observationsDIFF 0.844 0.090 0.556 0.978COMP 1.232 0.384 1.000 2.667TRVTIME 1.334 1.398 20.367 8.100TOUR 0.011 0.013 0.002 0.070SLOT 0.173 – 0.000 1.000LOADFAC 0.519 0.134 0.062 0.838FARE* 63.62 40.28 23.92 219.47
*Real 1986 dollars.
43 The tourist variable is also slightly changed from 1986. For about a quarter of the sample, we donot have data on ticket originations by city, which is necessary to compute a weighted average of thetourist variable for each city. For these routes we use the simple average across the two cities.
44 A large proportion of this difference is driven by the 1–1–1 observations in the deregulated era,which exhibit an exceedingly low degree of differentiation. When these ten observations are omitted,the correlation between the differentiation index and the Herfindahl index drops from 0.520 to 0.389.Nonetheless, the correlation is lower in the regulated era.
636 S. Borenstein, J. Netz / Int. J. Ind. Organ. 17 (1999) 611 –640
Table 61Average differentiation index by sample and market structure
3-flight markets—267 observations (DIFF /HERF correlation: 0.280)Mkt Struc 3–0 2–1 1–1–1 AllObs 207 55 5 267Avg DIFF‡ 0.865* 0.786 0.789 0.847SE of Avg (0.007) (0.020) (0.007) (0.007)
4-flight markets-150 observations (DIFF /HERF correlation: 0.328)Mkt Struc 4–0 3–1 2–2 2–1–1 AllObs 105 29 14 2 150Avg DIFF‡ 0.862* 0.811 0.773 0.829 0.844SE of Avg (0.007) (0.018) (0.030) (0.121) (0.007)1The market structure indicates the number of flights by each carrier, e.g., 4–2 means one carrierschedules four flights and one carrier schedules two flights.*Indicates the mean is significantly different than that of the neighbor to the right at the 5% level.‡The mean value of the differentiation index is significantly different than 1 at the 5% level, for allmarket structures, except 2–1–1.
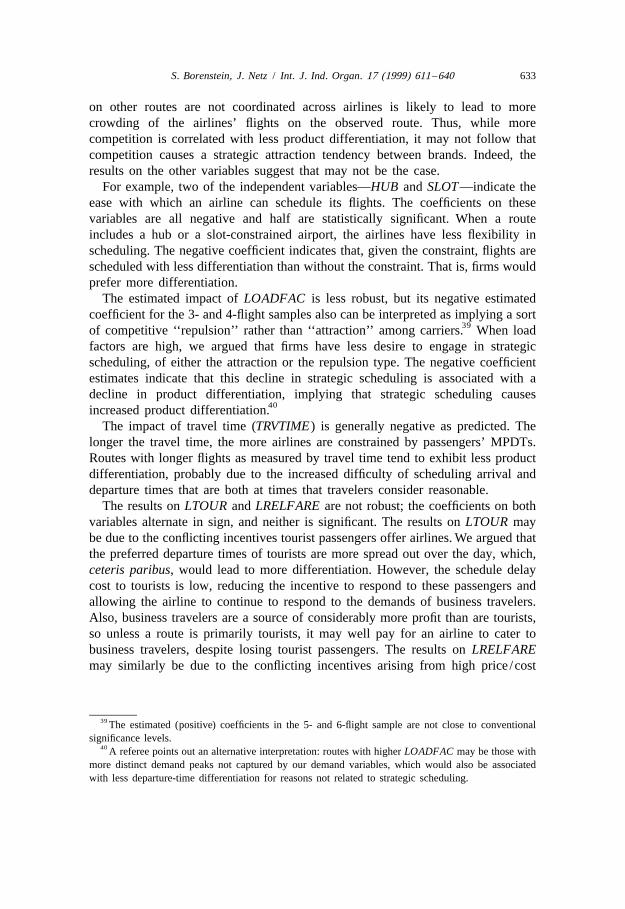
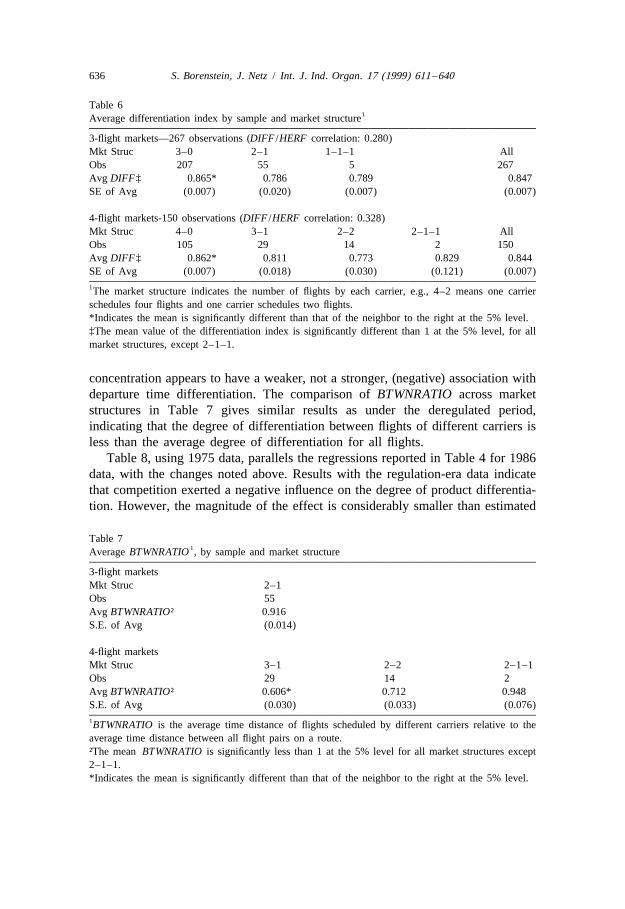
concentration appears to have a weaker, not a stronger, (negative) association withdeparture time differentiation. The comparison of BTWNRATIO across marketstructures in Table 7 gives similar results as under the deregulated period,indicating that the degree of differentiation between flights of different carriers isless than the average degree of differentiation for all flights.
Table 8, using 1975 data, parallels the regressions reported in Table 4 for 1986data, with the changes noted above. Results with the regulation-era data indicatethat competition exerted a negative influence on the degree of product differentia-tion. However, the magnitude of the effect is considerably smaller than estimated
Table 71Average BTWNRATIO , by sample and market structure
3-flight marketsMkt Struc 2–1Obs 55Avg BTWNRATIO† 0.916S.E. of Avg (0.014)
4-flight marketsMkt Struc 3–1 2–2 2–1–1Obs 29 14 2Avg BTWNRATIO† 0.606* 0.712 0.948S.E. of Avg (0.030) (0.033) (0.076)1BTWNRATIO is the average time distance of flights scheduled by different carriers relative to theaverage time distance between all flight pairs on a route.†The mean BTWNRATIO is significantly less than 1 at the 5% level for all market structures except2–1–1.*Indicates the mean is significantly different than that of the neighbor to the right at the 5% level.

S. Borenstein, J. Netz / Int. J. Ind. Organ. 17 (1999) 611 –640 637
Table 8IV estimation of log–log specification dependent variable: LDIFF
Flight sample: 3-flights 4-flights
CONSTANT 0.180 0.341*(0.159) (0.177)
LCOMP 20.133*** 20.074*(0.045) (0.044)
SLOT 20.039 0.011(0.032) (0.026)
LLOADFAC 0.078** 0.056*(0.039) (0.034)
LTRVTIME 0.022* 20.001(0.012) (0.013)
LTOUR 20.012 0.006(0.013) (0.013)
LFARE 20.077*** 20.101***(0.028) (0.034)
Observations 223 1272R 0.11 0.19
***Significant at 1%. **Significant at 5%. *Significant at 10%.
in 1986. As before, we examine the impact of changing from a 3–0 to 2–1 to1–1–1 market structure on the degree of differentiation, assuming that the othervariables are at their sample means. A movement from 3–0 to 2–1 decreases thedifferentiation index from 0.822 to 0.761. If two flights are scheduled at 8 am andnoon, then the former implies that the third flight is scheduled at 4:21 pm, and thelatter at 3:32 pm. A movement to a 1–1–1 market structure decreases the index to0.711, which corresponds to the third flight moving to 2:18 pm. These changes aresubstantially smaller than implied by the results using deregulation-era data.
Recall that three variables measure how tightly constrained an airline is instrategically scheduling a flight—HUB, SLOT, and TRVTIME. HUB is irrelevant inthe regulated time period; SLOT is insignificant; and, when significant, TRVTIMEis positive. In the deregulated era, all three variables were generally negative andoften significant, indicating that airlines preferred to differentiate their flights morewhen faced with competition, but could not due to scheduling constraints. Incontrast, carriers do not appear to be affected by constraints in the regulatedperiod; when competition changes, regulated carriers have more freedom to adjustschedules strategically, and respond by reducing differentiation. In other words,the appearance that competition reduced differentiation by a larger amount in thederegulated period may be an artifact of structural changes in network considera-tions (a move from a point-to-point system to a hub-and-spoke system).
It is also possible that airlines adjust to the absence of price competition bycompeting in quality dimensions: scheduling flights more responsively to passen-gers’ preferred departure times. When airlines can adjust their prices, a passengerwho deviates from her preferred departure time may be compensated with a lower

638 S. Borenstein, J. Netz / Int. J. Ind. Organ. 17 (1999) 611 –640
fare. When price is set by a regulator, this compensation is unavailable. Thevariables that we include to control for the distribution of preferred departuretimes, TRVTIME and TOUR, do not appear to add much explanatory power. Inessence, the airline may be more worried about losing passengers at the‘‘endpoints’’ of the day when they cannot adjust price.
The primary determinants of differentiation, apart from COMP, appear to beFARE, which, as explained above, indicates the profitability per passenger, and theload factor. Consistent with our earlier discussion of the airline’s tradeoff betweenattracting passengers and integrating the flight into its system, the fare appears tohave a significantly negative impact on the degree of product differentiation. Therewas greater differentiation on routes with low price /cost margins, where airlineshad less to gain by trying to steal customers from competitors. The coefficient onthe load factor is significantly positive, indicating that routes with higher loadfactors exhibit more product differentiation. This too is consistent with expecta-tions: if flights are relatively full, there is no point to trying to steal customers fromcompetitors.
8. Conclusions and interpretations
Simple descriptive statistics show that on a route with a given number of dailyflights, departure times are less differentiated if the route is served by competingairlines than if it is served by a single firm. In our econometric analysis we haveattempted to control for the other factors that might affect departure-timecrowding, and have found a negative relationship between competition andproduct differentiation that is significant, both statistically and in terms of the sizeof this effect. While these results might be interpreted as indication of acompetitive tendency towards reduced product differentiation, as conjectured byHotelling and others, we argue that this conclusion is difficult to square with theother estimated effects on differentiation.
Some of the other coefficient estimates could be interpreted as implying thatcarriers respond to increased logistical flexibility in scheduling by increasing theirdifferentiation from competing brands. Furthermore, high capacity utilization,which decreases the incentives for strategic scheduling, is (weakly) associated withless product differentiation, also implying that strategic scheduling increasesdifferentiation.
When prices are fixed, most models of differentiation predict that there will be astronger tendency for firms to crowd their brands towards competitors’. While ourresults from the era of regulated prices show that an increase in competition issignificantly associated with less product differentiation, the raw statisticalcorrelation and econometrically estimated causal relationship is weaker in theregulated fixed-price era (1975) than in the unregulated period (1986). At the sametime, however, the indicators we found in the 1986 sample that airlines respond to

S. Borenstein, J. Netz / Int. J. Ind. Organ. 17 (1999) 611 –640 639
greater scheduling flexibility by increasing differentiation are not evident in the1975 sample. In the 1975 samples, a decrease of scheduling constraints does notappear to affect the degree of departure time crowding. Furthermore, low loadfactors, which seem likely to increase the incentive to schedule strategically aresignificantly associated with less differentiation in departure times. Overall, itappears that the predictions of location models with exogenous prices aresupported by the results from the 1975 data.
Acknowledgements
We thank Jon Haveman, Phil Howrey, Peter Reiss, Nancy Rose, two anonymousreferees and seminar audiences at the University of Illinois, Harvard, MIT, andStanford. Jamie Woods provided excellent research assistance. Any remainingerrors are our own.
References
Anderson, S., 1987. Spatial competition and price leadership. International Journal of IndustrialOrganization 5, 369–398.
d’Aspremont, C., Gabszewicz, J.J., Thisse, J.-F., 1979. On Hotelling’s stability in competition.Econometrica 17, 1145–1151.
Bensaid, B., dePalma, A., 1993. Spatial Multiproduct Oligopoly. Unpublished manuscript.Borenstein, S., 1989. Hubs and high fares: Dominance and market power in the US airline industry.
RAND Journal of Economics 20, 344–365.Borenstein, S., Rose, N.L., 1994. Competition and price dispersion in the US airline industry. Journal
of Political Economy 103, 653–683.Brown-Kruse, J., Cronshaw, M.B., Schenk, D.J., 1993. Theory and experiments on spatial competition.
Economic Inquiry 31, 139–165.Denzau, A., Kats, A., Slutsky, S., 1985. Multi-agent equilibria with market share and ranking
objectives. Social Choice and Welfare 2, 95–117.DePalma, A., Ginsburgh, V., Papageorgiou, Y., Thisse, J.-F., 1985. The principle of minimum
differentiation holds under sufficient heterogeneity. Econometrica 53, 767–781.Douglas, G.W., Miller, J.C. III, 1974. Economic regulation of domestic air transport: theory and policy.
Brookings Institution, Washington D.C.Eaton, C.B., 1972. Spatial competition revisited. Canadian Journal of Economics 5, 268–278.Eaton, C.B., Lipsey, R.G., 1976. The non-uniqueness of equilibrium in the Loschian location model.
American Economic Review 66, 77–93.Eaton, C.B., Lipsey, R.G., 1975. The principle of minimum differentiation reconsidered: Some new
developments in the theory of spatial competition. Review of Economic Studies 42, 27–49.Gabszewicz, J.J., Thisse, J.-F., 1986. Spatial competition and the location of firms. In: Gabszewicz et
al. (Eds.), Location Theory. Harwood Academic Press, London.Greenhut, M.L., Norman, G., Hung, C.-S., 1987. The Economics of Imperfect Competition: A Spatial
Approach. Cambridge University Press, Cambridge.Heckman, J.J., 1977. Sample selection bias as a specification error. Econometrica 47, 153–161.Hotelling, H., 1929. Stability in competition. Economic Journal 39, 41–57.
640 S. Borenstein, J. Netz / Int. J. Ind. Organ. 17 (1999) 611 –640
Martinez-Giralt, X., Neven, D.J., 1988. Can price competition dominate market segmentation. Journalof Industrial Economics 36, 431–442.
Netz, J.S., Taylor, B.A., 1997. Umbeck, J.R., 1997. Maximum or Minimum Differentiation? AnEmpirical Investigation into the Location of Firms. Unpublished manuscript.
Osborne, M.J., Pitchik, C., 1985. Equilibrium in Hotelling’s Model of Spatial Competition. Un-published manuscript.
Prescott, E.C., Visscher, M., 1977. Sequential location among firms with foresight. Bell Journal ofEconomics 8, 378–393.
Smithies, A., 1941. Optimum location in spatial competition. Journal of Political Economy 49,423–439.