Why Democracy Protests Do Not Di · 2018-11-03 · Why Democracy Protests Do Not Di↵use ⇤ Dawn...
48
Why Democracy Protests Do Not Di↵use ⇤ Dawn Brancati Columbia University [email protected] Adri´ an Lucardi ITAM [email protected] Draft: Fall 2018 ⇤ The authors would like to thank Sid Tarrow, Val Bunce, Mark Beissinger, Kurt Weyland, POLSW3951, and the audience at Temple University’s IR Workshop for their constructive comments on earlier versions of this paper.
Transcript of Why Democracy Protests Do Not Di · 2018-11-03 · Why Democracy Protests Do Not Di↵use ⇤ Dawn...

Why Democracy Protests Do Not Di↵use⇤
Dawn BrancatiColumbia University
Adrian LucardiITAM
Draft: Fall 2018
⇤The authors would like to thank Sid Tarrow, Val Bunce, Mark Beissinger, Kurt Weyland, POLSW3951,and the audience at Temple University’s IR Workshop for their constructive comments on earlier versions ofthis paper.

Why Democracy Protests Do Not Di↵use
Abstract
One of the primary international factors proposed to explain the geographic and tem-poral clustering of democracy is the di↵usion of democracy protests. Democracyprotests are thought to di↵use across countries primarily through a demonstratione↵ect, whereby protests in one country cause protests in another based on the positiveinformation that they convey about the likelihood of successful protests elsewhere, andsecondarily, through the actions of transnational activists. In contrast to this view, weargue, that, in general, democracy protests are not likely to di↵use across countries be-cause the motivation for and the outcome of democracy protests results from domesticprocesses that are una↵ected or undermined by the occurrence of democracy protestsin other countries. Our statistical analysis supports this argument. Using daily dataon the onset of democracy protests around the world between 1989 and 2011, we foundthat in this period, democracy protests were not significantly more likely to occur incountries when democracy protests occurred in neighboring countries either in generalor in ways consistent with the expectations of di↵usion arguments.

Democracy exists in both geographic and temporal clusters (Huntington 1991; Jaggers
and Gurr 1995; Starr and Lindborg 2003; Brinks and Coppedge 2006; Gleditsch and Ward
2006; Leeson and Dean 2009). At the beginning of the twentieth century, democracy was
isolated to a few countries in North America and Western Europe. After World War II,
it expanded to Latin America and Asia, toppling military regimes and colonial powers in
the process. Shortly after the end of the Cold War, democracy moved into East Central
Europe, where it dislodged deep-rooted communist regimes, and made significant inroads
into Africa. Today, democracies constitute about two-thirds of all independent states in the
world (Marshall and Gurr 2015). These trends, as well as the slow-changing nature of most
domestic correlates of democracy, have led scholars to hypothesize that democracy is not
only a function of the domestic conditions within countries, but international factors as well.
One of the primary international factors proposed to explain the geographic and temporal
clustering of democracy is the di↵usion of democracy protests. Democracy protests, which
are public demonstrations in which participants demand countries adopt or uphold open
and competitive elections, are thought to di↵use primarily through a demonstration e↵ect
and secondarily, through transnational activists. According to the former, protests in one
country precipitate protests in another based on the positive information that they convey
about the likelihood of successful protests elsewhere, while according to the latter, they
di↵use through the direct actions of activists who provide material support to activists in
other countries.
As evidence of these processes, scholars point to the large number of countries that
have experienced protests at any one time, and to fact that where protests are believed to
have di↵used, protesters were aware of earlier protests, made reference to these protests,
and adopted similar strategies, tactics, and goals (Bunce and Wolchik 2006; Weyland 2009;
Beissinger 2007; Kuran 2011; Mitchell 2012). Fears of protests di↵using in this way have
compelled autocratic leaders around the world to undertake measures to prevent protests
1

from occurring in their countries – ranging from the tyrannical (e.g., increased censorship,
government purges, and opposition arrests) to the paranoid (e.g., banning protest symbols
such as Jasmine flowers and the color orange).
In contrast to these expectations, we argue that, in general, democracy protests are not
likely to di↵use across countries because the motivation for and the outcome of democracy
protests results primarily from domestic processes that are either una↵ected or undermined
by the occurrence of democracy protests elsewhere. Democracy protests arise when strong
public sentiment against governments, derived from political, social, or economic grievances,
is triggered by internal events, such as elections and economic crises, which facilitate collec-
tive action against governments by making individuals cognizant of their shared opposition
to regimes. In general, the occurrence of democracy protests in neighboring countries does
not raise this level of discontent, nor does it facilitate collective action on behalf of it. In fact,
most democracy protests in neighboring countries are poor models for protests elsewhere and
can lead governments to undertake measures to block protests from occurring in their own
countries.
To evaluate our argument, we conduct the first cross-national and longitudinal statistical
analysis of the di↵usion of democracy protests. Existing studies on the di↵usion of democracy
show a strong statistical correlation between the presence of democracy in one country and
the presence of democracy in neighboring countries and/or the world overall, but they are
unable to distinguish empirically among the di↵erent mechanisms through which democracy
might di↵use (Starr 1991; Jaggers and Gurr 1995; Starr and Lindborg 2003; Brinks and
Coppedge 2006; Gleditsch and Ward 2006; Franzese and Hays 2008; Leeson and Dean 2009;
Mainwaring and Perez-Linan 2014). To understand these mechanisms, it is essential to
examine the di↵usion of democracy protests apart from the di↵usion of democracy, because
even if protests themselves di↵use, their political successes might not (Saideman 2012; Hale
2014). Existing studies on democracy protests show, meanwhile, the influence of democracy
2
protests on each other, but their conclusions are not necessarily generalizable since they are
based on qualitative descriptions of the most prominent waves of democracy protests (Bunce
and Wolchik 2006; Beissinger 2007; Weyland 2009, 2012; della Porta 2014).
Our statistical analysis supports our argument. Using daily data on the onset of democ-
racy protests around the world between 1989 and 2011, we found that in this period, democ-
racy protests were not significantly more likely to occur in countries when democracy protests
occurred in neighboring countries regardless of the number or size of these protests. Democ-
racy protests were also not more likely to occur in this period in ways consistent with di↵usion
arguments. That is, democracy protests were not significantly more likely to occur in this
period when protests in neighboring countries were not repressed or were able to extract
political concessions from governments. Nor, were they more likely to occur when neigh-
boring protests occurred in influential countries or politically and socio-economically similar
countries. Thus, it seems that if democracy does di↵use to other countries, it is not likely a
result of democracy protests.
How Democracy Protests Are Thought to Di↵use
Democracy protests are believed to di↵use primarily through demonstration e↵ects, and
secondarily, through transnational activists.1 According to the concept of demonstration
e↵ects, protests spread across borders because protests in neighboring countries provide
activists in other countries with a focal point around which to coordinate action against
regimes (Kuran 1989, 2011; Lohmann 1994), and raise the expectations of these activists
that similar actions are likely to be successful in their own countries (Tarrow 1991, 1994;
McAdam and Rucht 1993; Soule 1997; Givan, Roberts and Soule 2010). Demonstration
e↵ects are believed to be the main reason why anti-regime contention spread throughout
1These processes are those most relevant and o↵ered to explain the di↵usion of democracy protests. SeeElkins and Simmons (2005) for a review of the range of mechanisms through which other events, policies,and institutions are argued to di↵use.
3
Europe in 1848 (Weyland 2009; Gilardi, Bamert and Wasserfallen 20153), in East Central
Europe in 1989 and the early 2000s (Kuran 1991; Lohmann 1994; Beissinger 2007; Mitchell
2012), and more recently, in the Middle East and North Africa with the so-called Arab Spring
(Kuran 2011).
As evidence of the presence of demonstration e↵ects in these four historical periods,
scholars point to the fact that people involved in subsequent protests were aware of earlier
protests, referenced events related to them, and used these protests as a rallying cry to urge
people in their own countries to rise up against their governments. They also point to the fact
that the protests were massive in scale and arose unexpectedly and spontaneously in many
di↵erent contexts in short succession of each other. In the case of the 1848 Revolutions,
protests occurred in three countries (i.e., Germany, Vienna, and Denmark) less than one
month after Louis Philippe I was dethroned in France. Likewise, within one month of
Tunisia’s Jasmine Revolution, protests erupted in Algeria and Jordan and shortly thereafter
in Egypt and Yemen. The Color Revolutions occurred over a longer time interval, but the
1989 protests in East Central Europe occurred in close succession of each other.
In support of di↵usion theories, scholars also note that subsequent protests in these
periods used similar frames, strategies, and repertoires as earlier protests (Bunce andWolchik
2006; Beissinger 2007; Saideman 2012; della Porta 2014). Most of the Color Revolutions were
organized around electoral fraud. The Arab Spring protests were not organized around a
single catalyzing event, but particular events were organized around similar themes like “A
Day of Rage”, common occasions, such as Friday afternoon prayers, and physical spaces,
like central squares (Patel 2014). They also were organized, as were the Color Revolutions,
through similar mediums, such as Twitter and Facebook (Lotan et al. 2011).
Transnational activists are also thought to play a role, albeit a less significant one, in
the di↵usion of democracy protests in these periods. According to di↵usion arguments,
transnational activists help protests di↵use by disseminating information about protests to
4

activists in other countries, and by providing them with the training and resources needed to
organize their own protests (Tarrow 2005; Bunce and Wolchik 2006; Beissinger 2007). The
Serbian opposition group, Otpor!, which organized the Bulldozer Revolution, is known to
have trained activists responsible for the Rose Revolution in Georgia, as well as members of
Pora, which played a central role in the Orange Revolution.
Outside the Color Revolutions, however, most research finds that transnational activists
have played little role in the development of democracy protests in other countries, includ-
ing the 1848 Revolutions (Weyland 2009, 2012), the 1989 protests in East Central Europe
(Kotkin 2009; Kuran 1991; Lohmann 1994), and the Arab Spring protests (Gana 2013).2 In
these periods, transnational activities were few in number, isolated from activists in other
countries, and short of the resources needed to export protests to other countries (Lynch
2012; Saideman 2012; Weyland 2012).
Di↵usion arguments, including both those about demonstration e↵ects and those about
transnational activists, di↵er in the importance they place on domestic conditions. Some
di↵usion arguments suggest that protests in neighboring countries are merely triggers for
protests in other countries, responsible for the timing of protests, but not whether or not
protests occur. Other arguments assign greater weight to neighboring protests, claiming that
protests in neighboring countries provide activists with the critical push needed to organize
protests that they otherwise would not. Structural conditions, according to Kurt Weyland,
provide the conditions for widespread contention, but “[p]roblems of long gestation that di↵er
across nations in magnitude and acuteness cannot account for the remarkable temporary
clustering of protests and their broad geographic spread” (2012, 919). Other arguments go
still further, arguing that neighboring protests cause protests to occur in countries even when
domestic conditions favoring protests are weak. Beissinger (2007) claims, for example, that
2Otpor! also trained activists in Tunisia through workshops indirectly sponsored by the US government. Bymost accounts, however, the workshop attendees neither initiated nor organized the Jasmine Revolution(Gana 2013, 151-2).
5

“the e↵ect of example is to make action and even successful action materialize in cases in
which they would not have otherwise been likely, so that example makes possible action and
outcomes that structure alone would not have permitted” (173).
Most di↵usion arguments also recognize that whether or not protests di↵use, and what
forms they assume, depends on the domestic and international context in which they arise
(Solingen 2012). According to these arguments, democracy protests are more likely to di↵use
to other countries depending on people’s awareness of earlier protests, as well as the degree
to which earlier protests raise people’s expectations about the likely success of protests
in their own countries. Proximity is thought to raise people’s awareness of prior protests
because it influences the extent to which people interact with each other, share a common
language, occupy a common media market, and so forth (Starr 1991; Gleditsch and Ward
2006; Kopstein and Reilly 2000). A country’s political and economic importance is also said
to raise people’s awareness of protests in other countries since instability in these countries
can have greater consequences for neighboring countries than protests in other countries.
(Elkins 2008).
Democracy protests are thought to raise people’s expectations about the likely success of
protests in their own countries when protests in other countries are successful, defined either
in terms of their size or ability to achieve their goals (Buenrostro, Dhillon and Wooders 2007;
Gilardi, Bamert and Wasserfallen 20153), and occur in countries with similar socio-economic,
political and cultural backgrounds (McAdam, McCarthy and Zald 1996; Bunce and Wolchik
2006; Beissinger 2007; Elkins 2008). Many characteristics of countries are hypothesized to
influence di↵usion processes in this way, including economic development, democracy, state
repressiveness, and nationalist sentiment, among others. Where the appropriate context for
protests to di↵use does not exist, some di↵usion scholars contend that activists adopt other
forms of regime contention, such as roundtables and national conferences, more suitable for
their country (della Porta and Tarrow 2012; Bunce, Patel and Wolchik 2013; Weyland 2014).
6
Democracy Protests: Poor Models for Protests Elsewhere
In contrast to these arguments, we argue that, in general, democracy protests are not
likely to di↵use to other countries through either demonstration e↵ects or transnational ac-
tivists. We consider democracy protests to have di↵used from one country to another country
if, and only if, protests in one country made protests in the other more likely to occur.3 Our
understanding of di↵usion does not rule out the possibility that democracy protests are larger
or occur sooner when protests arise in other countries due to the excitement and attention
surrounding earlier protests. Or, that other aspects of protests, including their strategies or
tactics, spread across borders.
Democracy protests, we argue, are not likely to di↵use to other countries because democ-
racy protests arise out of domestic processes that are either una↵ected or undermined by the
occurrence of democracy protests in other countries. Although democracy protests result
from domestic processes, they do not arise only, or necessarily, as a result of a strong public
sentiment in favor of democracy, but arise for other reasons including, most notably, oppo-
sition to an existing government in general (Beissinger 2013; Chaisty and Whitefield 2013).
At the same time, many people who desire democracy are unwilling to organize democracy
protests, or participate in them, because they are unaware of the extent to which others
oppose the regime, question the likely success of protests in their countries, and fear the
consequences of failed actions (Kuran 1989).
Elections and economic crises are two important factors shown to trigger democracy
protests because they not only generate opposition to the regime, but also make people
aware of their shared opposition to it. In the run-up to elections in authoritarian regimes,
leaders often either suspend elections, alter the electoral system in their favor, or commit
3Our conceptualization of di↵usion is similar to Stang (1991, 325) and Elkins and Simmons (2005, 36-38).They define di↵usion as any process in which prior adoption of a trait or practice alters the probability ofadoption for the remaining non-adopters. For an alternative view, see Weyland (2014), who argues that“[s]ince external stimuli [for a political transformation] do not always lead to successful emulation, di↵usionshould not be defined by increased chances of emulation” (32)
7

electoral fraud in order to remain in power (Tucker 2007; Hyde and Marinov 2014; Bunce and
Wolchik 2013; Beaulieu 2014). Not only do these actions provoke anger against the regime,
but they also suggest to the public that opposition to the regime is strong because a genuinely
popular regime would not have to resort to these actions. Fraud-ridden elections are said to
be especially likely to provoke protests when the incumbent leaders are in their final term of
o�ce and elites vie for control over and influence within the succeeding government (Hale
2005).
Economic crises also raise societal discontent for governments in general, and authoritari-
anism in particular, because governments wield significant responsibility over their countries’
economies. Even when governments are not directly responsible for crises, the public often
blames governments for them regardless because it lacks information about the real causes
of crises, which are often highly technical, complicated, and contested (Brancati 2016). As
a result, the public tends to evaluate a government’s job performance based on fluctuations
in their own well-being, grading it highly when the public is doing well economically and
poorly when it is not. This discontent increases support for opposition candidates who are
more likely to organize protests in election periods when opposition support is high, espe-
cially when opposition candidates lose elections by small margins of victory, which signals
to candidates that they likely would have won the elections had they been clean, and that
any protests that they were to organize would attract wide support (Brancati 2016).
The occurrence of democracy protests in other countries is not likely to strengthen these
motivations and, if anything, is likely to undermine them. Countries are not likely to hold
corrupt elections because democracy protests occurred against corrupt elections in other
countries. Nor, are they likely to delay elections because this could also incite protests.
After the Bulldozer Revolution, only a handful of countries in East Central Europe delayed
elections over the next ten years, and none of these delays were based on governments’ fears
of Color-like behavior in their countries, but rather from legal discrepancies about the timing
8

of elections (e.g., Czech Republic 2010 and Uzbekistan 2007), repeat elections (e.g., Serbia
2003 and Moldova 2010), and factional power struggles (e.g., Ukraine 2007).4 If anything,
governments weary of protests taking place against planned elections in their own countries
are likely to limit electoral fraud or undertake actions to better obscure it.
Governments are also not typically more likely to experience economic crises as a result
of protests in other countries. The economic repercussions for countries in which protests
occur do not usually rise to the level of crises while the spillover e↵ects of economic crises
are not usually immediate or universal (Dornbusch, Park and Claessens 2000).5 Moreover,
in some cases, governments with the economic means to do so have undertaken initiatives to
strengthen their economies to prevent protests from occurring. Backed by oil-rich economies,
the United Arab Emirates tried to prevent Arab Spring-like protests in the Emirates by
cutting food prices, while Saudi Arabia committed to a multi-billion dollar spending increase
to raise civil service salaries, create public-sector jobs, and build housing.6
Most democracy protests are also unlikely to inspire protests in other countries because
they are generally not successful, and because their success typically depends on domestic
processes that are not informative of the likely success of protests elsewhere. Almost two-
thirds of democracy protests that took place between 1989 and 2011 attracted less than ten
thousand participants at their single largest rally (a third attracted less than a thousand),
and about the same fraction of protests ended in three days or fewer (Brancati 2016, 28).
Moreover, in this period, less than 10% of protests forced governments to step down from
power and less than 25% of them extracted political concessions from governments (107).
4Information regarding the number of countries in which elections were delayed is based on nelda6 in theNational Elections Across Democracy and Autocracy (NELDA) Dataset (v3) and the Global ElectionsDatabase.
5Between 1989 and 2011, GDP per capita growth was only 1 percentage point lower on average in countrieswhere a democracy protest occurred one year after a protest compared to countries where a protest did notoccur. This di↵erence is statistically significant at the 0.05 level. However, inflation and unemploymentwere essentially unchanged. Figures calculated by the authors based on data from Brancati (2016).
6Glen Carey, “Saudi Spending Fuels Fastest Gulf Inflation: Arab Credit,” Bloomberg News, 5 March 2013;“UAE Boosts Military Pensions, Seen Pre-empting Unrest,” Al Arabiya News, 24 March 2011.
9

Conversely, about two-thirds of democracy protests in the period were repressed by military
or police forces (122; 130-131).
Even successful protests are unlikely to inspire democracy protests in other countries
because the success of these protests depends on domestic factors and the repressive capacity
of states in particular. State repressive capacity is based on the size of the protests, with
larger protests being harder to repress than smaller ones. It also depends on the size of a
country’s domestic security forces, with larger and better funded forces being more capable
of repressing democracy protests than others. The willingness of these forces to repress
protests, in turn, relies on a number of factors, including the existence of ideological or
personality conflicts, kinship ties, succession rules, and so forth.
Moreover, as others have noted, protests in neighboring countries can increase the repres-
sive capacity of states by leading autocrats to undertake initiatives that block the spread of
protests (Bratton and van de Walle 1997; Beissinger 2007; Heydemann and Leenders 2011;
della Porta and Tarrow 2012; Saideman 2012; Koesel and Bunce 2013; Danneman and Ritter
2014). A number of authoritarian regimes in East Central Europe cracked down on oppo-
nents, including civil society organizations and transnational activists promoting democracy
and human rights after the Orange and Tulip Revolutions. Similarly, China stepped up
measures after the Arab Spring to prevent democracy protests from occurring in China, in-
cluding increased censorship, police patrols, and arrests of known activists, while the oil-rich
states in the Middle East and North Africa increased spending.7
Countermeasures, such as these, we argue, are less likely to be important in explaining
why democracy protests do not di↵use across countries than the factors already mentioned,
because most democracy protests are small and of limited duration and not likely, therefore,
to instill fear in or elicit a reaction from governments in other countries, just as they are
not likely to provide much inspiration to activists in other countries to organize protests.
7James Fallows, “Arab Spring, Chinese Winter,” The Atlantic, September 2011.
10

Moreover, those states least likely to experience democracy protests are those most likely to
have the ability to undertake measures to counter their spread. These are states that are
economically prosperous and have the resources to increase public spending like the oil-rich
monarchies of the Persian Gulf, as well as states that have strong and sophisticated repressive
apparatuses like China.
Still, the fact that most democracy protests are poor models for other countries does
not rule out the possibility that democracy protests spread to other countries because, as
Weyland (2007, 2009) argues, the public lacks the time, information, and computational and
financial resources to evaluate fully the likely success of protests in their own countries, and
rely instead on cognitive shortcuts or heuristics that lead them to overestimate the odds of
successful protests occurring in their countries. According to the availability heuristic, people
make decisions based on the information most readily available to them, which is typically
information that is striking and vivid, while according to the representative heuristic, they
estimate the likelihood of an event occurring based on how much it resembles a prototypical
case. Bounded rationality arguments still make similar predictions as those in which actors
are fully rational, however, predicting, for example, that democracy protests are more likely
to spread to other countries when they occur in salient and geographically and temporally
proximate countries (Weyland 2007, 6).
Although we cannot rule out the possibility of bounded rationality theoretically, we are
skeptical about its applicability to democracy protests. Specifically, we are skeptical of
the assumption that people lack the necessary information needed to reliably predict the
likelihood of successful protests in their own country. Citizens living in authoritarian states
have a lot of information about their governments’ likelihood of repressing protests based
on their own personal experiences, the presence of non-state controlled forms of media,
and the general restrictiveness of their countries’ political and legal environments. It is
also not obvious to us that were people to rely on the availability heuristic to evaluate the
11
likelihood of successful protests in their own country that they would decide to organize
or participate in protests, since most protests are immediately repressed by governments
and are unable to extract concessions from governments. People are also likely to discount
the relevance of successful protests in neighboring countries since large protests that extract
political concessions from governments are not the prototypical case. Moreover, it has not
be shown experimentally or otherwise whether these heuristics, which explain individual
behavior, apply to group decision-making (Osmani 2016).
Any apparent clustering of democracy protests, we argue, is likely due to commonalities
among countries and not to di↵usion. Commonalities arguments claim that when protests
occur in two or more countries within a short period of time or in geographic proximity of
each other, that it is not because protests in one country cause protests in another country
to occur, but because the countries share certain things in common due to their temporal
or geographic proximity that makes protests likely to occur in them independently of each
other (Hale 2014). These include a decline in international oil prices or a spike in food prices,
as in Europe in 1848 (Goldstone 1991; Berger and Spoerer 2001; Houle, Kayser and Xiang
2016) and the Middle East and North Africa at the beginning of this decade (Jo↵e 2011;
Campante and Chor 2012); a similar electoral cycle marked by unpopular leaders, as in the
Color Revolutions (Hale 2005); and a change in a regional security environment, as when the
Soviet Union collapsed marking the end of the Cold War (Bunce and Wolchik 2013; Bratton
and van de Walle 1997; Gunitsky 2014).
Analysis
In order to evaluate the importance of di↵usion processes to the outbreak of democracy
protests in general, we examine statistically the correlation between the occurrence a democ-
racy protest in one country and the prior occurrence of a democracy protest in a neighboring
country. The analysis includes 183 countries between the end of the Cold War in 1989 and
12

the first year of the Arab Spring in 2011. This period encompasses three of the four waves
of democracy protests, which are emphasized in the literature as di↵using across countries,
and includes the internet era. Technological advancements in this era are believed to make
di↵usion more likely than in previous periods (Valenzuela, Arriagada and Scherman 2012).
The unit of analysis is the country-day. This allows us to determine whether a protest in
one country occurs before that of another, and how much earlier. Most analyses of di↵usion
processes are coded at the country-year level so that causality is much more di�cult to
establish. The detailed nature of these data can also help us to distinguish among di↵usion
and commonalities explanations for any observed clustering of democracy protests in the
data by identifying patterns in the ways in which democracy protests are clustered. While
some patterns are consistent with both di↵usion and commonalities arguments, as explained
further in the next section, certain patterns are only consistent with di↵usion arguments.
The use of the country-day as the unit of analysis results in a dataset with around 1.4
million observations, only a small proportion of which (N=289) experiences the onset of
democracy protests. The large number of observations in the analysis makes it more likely
that whatever results we find will be statistically significant. At the same time, the small
number of democracy protests that occurred between 1989 and 2011 make us less likely to
find significant results. We are inclined to believe that the lack of significance we find in the
subsequent analysis for the di↵usion variables is not due to the relatively small number of
democracy protests in the dataset for two reasons: first, other variables – such as elections
– have a positive, large, and statistically significant e↵ect on the probability of protest onset
consistent with the models reported in Brancati (2016); and second, the same analyses using
alternative measures of protests with more cases of protests are not significant either.
To ensure that the way in which we define neighbors does not drive our results (Zhukov
and Stewart 2013), we define neighbors (n) in two di↵erent ways. The first defines countries
as neighbors if theminimal distance between them is either 50 km or 800 km. These distances
13
(or very similar ones) are commonly used to define neighbors in the di↵usion literature. The
50 km category includes, but is not limited, to all contiguous countries.8 The second defines
two countries as neighbors if they belong to the same geographical region based on the UN
Statistics Division’s designation of macro-geographical regions.9 The term target (t) refers to
the country to which democracy protests might spread. Targets, if they experience protests,
become neighbors in the following observation period.
In the analysis, we evaluate the likelihood of protests to occur in target countries when
protests occur in neighboring countries within five di↵erent time intervals – three relatively
short intervals (i.e., 45 days, 90 days, 120 days), one medium-length interval (360 days) and
one long interval (election periods). (These results for the 360-days time interval are not
statistically significant and reported in the Appendix, Table A1). The remaining results are
discussed in the results section.) It is necessary to evaluate the likelihood of protests to
occur within objective time intervals to avoid identifying a temporal clustering of democracy
protests endogenously. Although the choice of these particular time intervals is arbitrary,
we think that they are consistent with the theoretical predictions for di↵usion.
We expect, for example, that if protests are to di↵use through demonstration e↵ects that
they should di↵use within a short to medium-length time period, as in the case of the 1848
Revolutions, the 1989 democracy protests, and the Arab Spring protests. Activists are most
likely to be excited and energized by protests in neighboring countries immediately after
they occur, and to rely on cognitive shortcuts to evaluate the odds of successful protests in
their own countries (Weyland 2007, 2009). Neighboring countries and target countries are
also likely to have more in common with each other in short time intervals as opposed to
long ones, so that the former serve as better models for protests in the latter. We, expect,
8Seventeen are island states and do not have any neighbors within 50 km of their borders. Two of these (Fijiand Mauritius) do not have any neighbors within 800 km of their borders.
9All 50 km neighbors are also 800 km neighbors, but only 70% of 50 km neighbors and 50% of 800 kmneighbors belong to the same UN region (based on the final day of the sample, 31 December 2011).
14
meanwhile, that if protests di↵use as a result of transnational activists that they should do
so over a medium-length to long period of time, as in the Color Revolutions, since activists
need time to amass resources to support and train activists in other countries.
We introduce an additional time component into the analysis by restricting particular
models to certain time periods, namely the internet era (24 October 1995 - onwards),10 the
period marking the end of communism (1989-1992),11 and the first year of the Arab Spring
protests (2011). The internet may facilitate the dissemination of information about protests
to neighboring countries, thus making di↵usion more likely, while most arguments about the
di↵usion of democracy protests are based on these two time periods.12
Data and Measures
The data and measures we use in the analysis allow us to not only identify whether
protests are more likely to occur when protests occur in neighboring country, but also to
identify any conditions under which di↵usion are more likely to occur. They also allow us
to identify if protests are more likely to occur when protests occur in neighboring countries
because protests in neighboring countries cause protests in other countries (di↵usion), or
because countries share particular features in common that make them both likely to ex-
perience protests independent of each other (commonalities). This is because only certain
patterns in the data would be consistent with di↵usion arguments, as Table 1 illustrates.
[Insert Table 1]
Democracy Protests
10We define the internet era as the period after the Federal Networking Council passed a resolution definingthe internet as a term in 24 October 1995.
11We identify 1989 as the starting point of the “end of communism” because it is the year the Berlin Wallfell, and 1992 as the endpoint because the Soviet Union dissolved in December 1991.
12As a robustness test, we interact neighbor protests with the target country’s internet access (using dataon internet users per 100 people from the World Bank) to determine if protests are more likely to occurin target countries when these countries have more access to the internet. The results of this analysis arenot significant. See Appendix (Table A2).
15
Democracy protests are defined as any public demonstration in which the participants’
primary demand is that countries adopt or uphold open and competitive elections (Brancati
2016). Democracy is understood here in a minimal sense so that protests about human
rights, gender equality, the economy, and so forth are not included.13 To measure democracy
protests, we use the Brancati (2016) dataset, which identifies all democracy protests that
fit this definition and that occur in independent countries between 1989 and 2011. In this
period, 310 democracy protests occurred.14 Protests for which there in some uncertainty as
to whether they meet this definition are identified as “borderline protests” and are dropped
from the analysis as a robustness test.15
Using these data, we created the following two measures. Target democracy protest,
which is the outcome of interest, is a dichotomous variable coded 1 if a democracy protest
began in a target country on a given day, and 0 otherwise. Neighbor democracy protest,
which is the main explanatory variable, is a dichotomous variable coded 1 if on a given day,
a protest took place in a neighboring country within the last 45, 90, 120, or 360 days, and
0 otherwise. For example, the outcome variable for Myanmar on 24 August 1998 is coded
as 1, as a democracy protest began in that country that day. Beginning on 25 August, all
of Myanmar’s neighbors get the value of 1 for the independent variable neighbor democracy
protest. Depending on the time window employed, this coding ends on 8 October 1998 (45
days later), 22 November (90 days), 22 December (120 days), or 19 August 1999 (360 days).
13While others might define democracy and thus, democracy protests, in broader terms, our definitionof democracy is based on features of political systems for which there is universal agreement that anydemocracy must contain at a minimum in order to be considered a democracy. For broader definitions,there is much less agreement. For more detailed information about the definition, cases, and codingprocedures used, see Brancati (2016, pp. 5-9).
14Our analysis includes 289 protests because we drop two protests from the original dataset that occurredprior to their countries’ independence according to the CShapes dataset (Weidmann and Gleditsch 2010),and all protests that broke out when another protest was ongoing in a country.
15A total of 27 protests are coded as borderline. Most of the Arab Spring protests are coded as borderlineor are not coded as democracy protests at all.
16

To address the possibility that anti-regime contention is more likely to occur in target
countries if anti-regime contention occurs in neighboring countries, we replicated our analyses
with three alternative measures of mass behavior that di↵er substantially from Brancati
(2016) as they code all forms of anti-government behavior, including strikes and/or protests,
that make political, but not necessarily democracy-related claims. The data used to construct
these measures are: the GDELT Project; the Social, Political, and Economic Event Database
(SPEED); and the Mass Mobilization Data (MMD) Project. Details regarding these data
and measures are provided in the Appendix, Tables A46 through A48.16
To account for the possibility that democracy protests are more likely to occur in target
countries the more protests take place in neighboring countries, and the larger these protests
are, we also measure the number and size of protests that occur in neighboring countries.
Number of neighbor protests is calculated as the total number of democracy protests that
occurred in neighboring countries in the last 45, 90, 120, or 360 days. Size of largest neighbor
protest is measured according to the number of people present at the single largest democracy
protest in any neighboring country within the last 45, 90, 120, or 360 days. Size is divided
into 5 categories of participants: (1) less than 1,000; (2) 1,000-10,000; (3) 10,000-100,000;
(4) 100,000-1 million; and (5) 1 million or more. A zero indicates that no protest occurred
in a neighboring country. Changes over time in the size of the largest protest are reflected
in the coding.
Government Responses to Neighboring Protests
Di↵usion arguments suggest that democracy protests are more likely to occur in a target
country if a protest in a neighboring country is not repressed by the government and is able
to achieve its political goals. To determine whether this is the case, we construct two sepa-
16GDELT: http://www.gdeltproject.org/; SPEED: http://www.clinecenter.illinois.edu/data/event/speed/;and MMD: http://www.binghamton.edu/massmobilization/. Accessed: 5 December 2017 and 10 January2017.
17
rate measures of how neighboring governments respond to protests. Neighbor protest success
is an ordinal variable indicating whether: (1) all democracy protests that occurred in a
neighboring country within 45, 90, 120, or 360 days were accommodated by the government;
(2) only some were accommodated; or (3) none were accommodated. No protests in any
neighboring country is the baseline. An accommodation includes any political concession
made to protesters, such as reforms to increase electoral competitiveness, correct electoral
fraud, restore suspended or annulled elections, hold elections for unelected o�ces, or return
elected governments to power, as well as the resignation of a country’s chief executive (Bran-
cati 2016, 136-146). An accommodation is only coded as such since the day after it was
announced. In this period, only 5 concessions were clearly hollow or disingenuous and are
dropped from the analyses as a robustness test.17
Neighbor protest repression is similarly measured. It is coded: (1) if all democracy
protests that occurred in a neighboring country within the last 45, 90, 120, or 360 days were
repressed by the government; (2) if only some were repressed; or (3) if none were repressed.
No protests in any neighboring country is also the baseline. Repression refers to only acts
of force by government military or police forces with the goal of ending the protests. Acts
of force used in self-defense or to manage violent crowds are not included. Protests are only
coded as repressed since the day after the repression began.
Neighbor Characteristics
Di↵usion arguments also suggest that whether or not protests spread to other countries
depends on the characteristics of the country in which the protests first took place, especially
its influentialness and similarity to target countries. The former a↵ects the degree to which
people in target countries are likely to be aware of protests in other countries, while the latter
17They include two cases of unkept promises of reform (e.g., Haiti 2004 and Egypt 2011); one case oftangential reforms (e.g., Russia 2011-2012); and two cases of status quo reforms (e.g., Kuwait 1989-90 andDemocratic Republic of Congo 1991).
18
a↵ects the extent to which they are likely to believe that similar protests would be successful
in their countries. According to di↵usion arguments, the more influential the neighboring
country and the more similar it is to the target country, the more likely protests are to
di↵use. Commonalities argument are silent as to whether or not protests are more likely
to occur in target countries when protests occur in influential neighbors, but suggest that
protests should be more likely to occur in target countries the more similar neighboring and
target countries are to each other in terms of factors likely to encourage democracy protests.
Our indicators of influentialness are based on four alternative measures: total gross do-
mestic product (GDP); total population (in millions); total military expenditures; and total
ground forces, measured as the number of active army personnel and government-controlled
paramilitary forces in a country. All values for these measures are lagged one year. Higher
GDPs, larger populations, greater military expenditures, and larger ground forces are in-
dicative of greater influentialness. Data for the first three measures are based on the World
Development Indicators (World Bank 2014), while data on the last are based on The Military
Balance (1988-2011) (International Institute for Strategic Studies 1988-2011).
Using these four measures, we construct eight di↵erent indicators of influentialness – one
indicator of absolute influence and one indicator of relative influence for each measure. The
absolute measures capture the overall influentialness of a neighboring country in the world,
while the relative measures capture the influentialness of a neighboring country vis-a-vis a
target country. Our measures are based on the most influential neighbor, which allows us to
address arguments that whether or not protests di↵use depends not on the influentialness of
the first country that experiences a protest, but on whether or not a pivotal case experiences
a protest.18
18Bunce, Patel and Wolchik (2013) argue that the protests di↵used in 2011, not because of the protestsin Tunisia, but because of those in Egypt, since Egypt is more influential than Tunisia due to its size,the developed character of its opposition, and its close alliance with the United States, and because theconditions in Egypt more closely resembled those present in other neighboring states. They make a similarargument in the case of East Germany and protests in 1989.
19

To understand how these measures are calculated, consider the following example. Neigh-
bor population (absolute) is measured in terms of the population of the largest neighboring
country that had a democracy protest in the last 45, 90, 120, or 360 days. If no neighboring
country had a democracy protest, this measures takes on the value of 0. The measure is then
logged to account for non-linearities.19 In contrast, neighbor population (relative) is defined
as the population ratio between the largest n=neighboring country that had a democracy
protest in the last 45, 90, 120, or 360 days, and that of the t=target country: populationnpopulationt
.
Accordingly, a value of 1 indicates that both countries are equally influential; a value above 1
indicates that the neighboring country is more influential than the target county, and a value
below 1 indicates that the neighboring country is less influential than the target country. A
value of 0 indicates that no neighboring country had a democracy protest. The measure is
logged so that the ratio is symmetric. We follow the same procedure to create the absolute
and relative measures of neighbor GDP, neighbor military spending and neighbor military
personnel.
To represent the similarity of target and neighboring countries, we construct four di↵erent
indicators based on factors shown elsewhere to a↵ect the occurrence of democracy protests –
GDP per capita, population, democracy, and state repressiveness. A higher GDP per capita
increases demands for democracy by fostering values of autonomy and self-expression accord-
ing to modernization theories (Inglehart and Welzel 2009), and reducing income inequality
according to redistributive arguments (Boix 2003). According to Brancati (2016), however,
it reduces the likelihood of democracy protests by minimizing the e↵ects of economic crises.
Countries with larger populations are more likely to experience protests because they are
generally more heterogenous than smaller countries. Both GDP per capita (similarity) and
population (similarity) are measured using the World Development Indicators.
19To account for zeros, we add 0.0001 before logging.
20
Democracy protests are less likely to occur in more democratic countries than in less
democratic ones, even though individuals generally have greater freedom to protest in the
former than in the latter, because there are fewer aspects of elections that are not open and
competitive in the former than in the latter. However, protests still occur in democracies,
particularly around threats to open and competitive elections, such as bans against certain
parties and candidates, as well as coups d’etat. We measure democracy with the Polity
Index, which codes democracy in a minimal sense based on the independence of executive
authority, the openness and competitiveness of executive recruitment, and the regulation
and competitiveness of participation (Marshall and Gurr 2015). The index ranges from -10
(strong autocracy) to +10 (strong democracy).
At the same time, protests are less likely to occur in more repressive states because
people are less likely to participate in protests if the odds of being hurt are higher and the
likelihood of protests achieving their goals is lower. We measure state repressiveness using the
Cingranelli and Richards’ physical integrity rights (CIRI PIR) index, which codes physical
rights on an 9-point scale based on the extent to which governments protect the populace
against torture, political imprisonment, extrajudicial killings, and disappearances.20 As in
the case of the previous measures, for any given observation, the similarity measures take
on the value of the most similar neighbor for each quantity of interest to address arguments
that protests di↵use based not on first incidences, but pivotal cases.
Whenever there is no protest in a neighboring country, the similarity measures take on
the value of 0. When there is a neighbor protest, we calculate the similarity indicators by
first taking the ratio of each of these measures for the neighboring country in relation to
the target country (as in the relative measures of influentialness), then logging the ratio to
20We do not measure similarity in terms of military strength because in most cases, democracy protestsare repressed by police (not military) forces, which the CIRI PIR index captures more accurately. Inthe calculation of the repressiveness variables, we invert the index’s original scores so that higher valuesindicate a more repressive government. Thus, the index ranges from 0 (full) to 8 (no government protectionagainst these actions).
21

make the distribution symmetric, and then taking the absolute value of the logged ratio.
For example, in the case of population, the corresponding formula is
���� log✓
populationnpopulationt
◆����. In
this way, the similarity measures take on the same value when A is the target and B is
the neighbor, as when B is the target and A the neighbor. We then invert the values by
subtracting them from the largest value that the above result takes. This simplifies the
interpretation of the results, as larger values indicate that two countries are more similar.
More importantly, were we not to invert the scores, having no protests would have the same
value as having a protest in the most similar pair of countries. But, by inverting the scores,
it has the same value as having a democracy protest in the most similar pair of countries.21
Additional Controls
In addition to these measures, we also include in the analysis a control variable for
election periods. We do not control for all factors that might a↵ect whether or not protests
occur within countries, such as nationalist sentiment, the urban landscape (i.e., central
squares), economic crises, or corruption. Some of these factors, like nationalist sentiment
and corruption, are very di�cult to measure. Others are more easily measurable, but the
factors themselves do not vary within years of countries (e.g., central squares), or the available
estimates of them do not (e.g., population, corruption and economic crises). These factors
are controlled for in the analysis using country-year fixed e↵ects, as explained further below.
Election periods, however, do vary within years of countries. We measure election periods
with an indicator variable coded 1 if a given observation fell within 30 days of a national
21While it is not ideal that a value of zero corresponds to two conditions – no protests in either the targetor neighboring countries and the most dissimilar pair of target and neighboring countries, we expect thelikelihood of protests to be very similar in both. For all four of the similarity measures for 50 km neighbors,over 99 percent of the zeros for these measures are a result of no protests occurring. The same is truefor three of the similarity measures (i.e., GDP per capita; population; and repressiveness) for 800 kmneighbors. For the democracy similarity measure, about 2 percent or less of the zeros are a result of noprotests occurring.
22
election in a given country (i.e., legislative or presidential election), and 0 otherwise.22 Specif-
ically, election period takes the value 1 if country n held a presidential or legislative election
on day d, as well as the 30 following days. Democracy protests are more likely to occur around
election periods because electoral fraud indicates to citizens that they are not alone in their
opposition to the government and that, if they protest, others are likely to protest as well
(Tucker 2007; Hyde and Marinov 2014; Kuntz and Thompson 2009; Svolik and Chernykh
2015; Beaulieu 2014). Elections also make the connection between a country’s poor eco-
nomic performance and its lack of democracy more salient (Brancati 2016). Although we
do not report the results of this variable in the tables to conserve space, election periods are
consistently a significant predictor of the likelihood of democracy protests to occur.
Results
In order to analyze the potential di↵usion of democracy protests, we first examine the
temporal and spatial distribution of democracy protests in the post-Cold War period. Table
2 depicts the percentage of days between 1 January 1989 and 31 December 2011 on which a
democracy protest broke out in a country depending on whether or not a democracy protest
occurred in a neighboring country within the last 45, 90, or 120 days. These figures do not
represent the total number of days on which democracy protests occurred in this period,
which is much higher, only the number of days on which democracy protests began, since
we are interested in the outbreak of democracy protests. Consistent with Boehmke (2009),
we drop all days in which a protest was already ongoing in a country, as countries where
a protest is already in place do not have the opportunity to have a new democracy protest
begin.
[Insert Table 2]
22The election data are based on the African Elections Database (Nunley 2004-2012), the Global ElectionsDatabase (Brancati 2007), and the Oxford series of election data handbooks (Nohlen, Krennerich andThibaut 1999; Nohlen 2005; Nohlen and Stover 2010).
23
The figures in the table provide some evidence of spatial clustering. Democracy protests,
according to these figures, are 20-50% more likely to break out if a protest occurred in a
neighboring country within the last 45, 90, or 120 days, but most of the e↵ects are statistically
significant. The evidence for a temporal clustering of protests is slightly weaker. Democracy
protests are less likely to occur for longer time intervals, but only consistently for 800 km
neighbors and UN regional neighbors, not for 50 km neighbors. The figures in this table
represent aggregate trends and do not show the regions of the world and time periods in
which democracy protests are clustered.
In order to visualize this information, we created a time-lapse video using iMovie. If a
democracy protest occurred in a country in a given month, a solid black dot appears in the
video within the borders of that country. The size of the dot is in proportion to the size of
the protests. The dot remains solid as long as the protest is on-going. The dot changes to
gray and becomes hollow for the 90-day period (approximately 13 weeks) after the protest
ended. Where democracy protests are temporally and/or spatially clustered, the density of
dots is higher. The time lapse-video is available online along with the replication materials
from the authors. From this video, we provide two snapshots of the two periods in which
democracy protests appear to be clustered – 1989-1992 around the end of communism in
East Central Europe and West Africa, and 2011 in the Middle East and North Africa (see
Figure 1).
While protests seem to be geographically clustered in these two periods, there are also
many countries that did not experience a protest even though their neighbors did. In 1989,
only 12 countries in the world – including all countries in East Europe (as defined by the
UN Statistics Division), except Poland and the Soviet Union – experienced at least one
democracy protest. In East Europe, all of the protests except those that occurred in Hungary
and Romania were succeeded by protests in other countries in the region within 120 days,
but none of the 7 protests occurring in other parts of the world were followed by protests
24

in their respective regions within 120 days. In 2011, a total of 23 countries – including 6
of the 20 countries in the Middle East and North Africa (as defined by the World Bank),
experienced at least one democracy protest. In MENA, 5 of the 7 protests that occurred
this year were followed by protests in the region within 120 days.
[Insert Figure 1]
Since whatever clustering observed in the table and video may be due to neighboring
countries having similar characteristics that dispose them to protests, and may not be sig-
nificant when controlling for other factors, in the remainder of the paper, we run a series of
models that examine more systematically whether democracy protests are temporally and
spatially clustered, as well as which features, if any, of democracy protests and the countries
in which they occur are associated with this clustering. The models are estimated using or-
dinary least squares regression with fixed e↵ects for country-years in order to control for any
unexplained variance in countries over time.23 Failing to include fixed-e↵ects for country-
years as we do, would misleadingly treat each day within a given year of a country as if it
were an independent observation. The p-values are based on standard errors clustered by
country.24,25
23We employ OLS rather than logit/probit specifications for three reasons. First, logit/probit specificationsdo not work well with fixed e↵ects, especially if, as is the case here, there are few observations in whichthe outcome variable takes the value of 1. Second, OLS and logit/probit models produce very similarresults when researchers are interested, as we are in this analysis, in estimating marginal e↵ects ratherthan fitted probabilities Angrist and Pischke (2009, p. 102-7), especially when including fixed e↵ects (Beck2011). Third, logit/probit models work especially poorly when the model is misspecified (i.e., an irrelevantvariable is included or a relevant one is excluded, even if that variable is uncorrelated with the explanatoryvariable of interest Angrist and Pischke (2009); Beck (2011, fn. 33).
24The standards errors are clustered by country to adjust for the fact that all observations for the samecountry across years may be correlated with each other.
25We do not believe that our use of country-year fixed e↵ects is driving our results. Since the unit ofobservation is the country-day and we employ relatively short time periods after a neighbor protest – 45,90 or 120 days, most country-years with at least one neighbor protest are treated in some days but not inothers. Thus, if protests were systematically more likely to begin shortly after a neighbor protest, the useof country-years could not wipe out this variation. Nonetheless, to ensure that the results are not drivenby the use of country-year fes, we ran a number of alternative specifications using country fixed e↵ects,country-and-year fixed e↵ects, country-decade fixed e↵ects, region-year fixed e↵ects and logit models with
25
Protests in Neighboring Countries
In the first set of models presented in Table 3, we examine whether or not a protest is
more likely to occur in a target country when a protest occurs in a neighboring country
located within 50 km or 800 km of the target country or in the same region as the target
country in the last 45, 90 and 120 days. We also explore if the likelihood of a democracy
protest to occur in a target country is associated with the number of democracy protests
that occur in neighboring countries and the size of the largest protest.
[Insert Table 3]
As is evident from Table 3, a democracy protest is not significantly more likely to occur in
a target country if at least one democracy protest occurred in a neighboring country located
within 50 km or 800 km of the target country or the same region as the target country in the
last 45, 90, or 120 days. A protest is also not significantly more likely to occur in a target
country regardless of the number of neighboring protests or the size of the largest protest.26
In order to determine if political protests of all types – and not just democracy protests
as defined by Brancati (2016) – are more likely to occur in target countries following similar
protests in neighboring countries, we repeated these analyses using three di↵erent measures
of protests based on data from GDELT, SPEED, and MMD. As Tables A46 - A48 in the Ap-
pendix show, the results are substantively and statistically the same with the point estimates
very small in magnitude and insignificant. The fact that the analyses using these datasets
random e↵ects, in all cases with various combinations of control variables and clustered standard errors(see Appendix Tables A3 - A18). In these models, the Neighbor Democracy Protest variable is only positiveand significant at conventional levels when we do not include fixed e↵ects or a set of standard controls.Alternatively, we collapsed our data so that the country-week, the country-month or the country-years(rather than country-day) is the unit of analysis (see Appendix Tables A19-A27, A28-A36 and A37-A43,respectively). Again, while several estimates are statistically significant at the 5% level in simple bivariatemodels, Neighbor Democracy Protes is not significant when we cluster the standard errors and/or includefixed e↵ects or a set of standard controls, or when we fit random e↵ect logit specifications.
26From this analysis, we cannot determine if protests are likely to be larger if protests occur in neighboringcountries. However, preliminary evidence suggests that they would not. When a democracy protest occursin a target country, the median size of a democracy protest in the target country (2=1,000-10,000) is thesame regardless of whether or not a protest occurred in a neighboring country. See Appendix (Table A44).
26

include a much larger number of protest events than the Brancati (2016) data and are also
insignificant, strengthens our confidence that our previous null findings are not driven by
the small number of democracy protests included in the analysis.27
In alternative models presented in Table 4, we repeat the analyses presented in the
previous table for certain subsets of the data to test the robustness of our findings. In
these analyses, we exclude cases of borderline protests and find no evidence that democracy
protests are more likely to occur in target countries if protests occur in either 50 km or 800
km neighbors in the last 45, 90, or 120 days. We also restrict the analyses to the internet
era (24 October 1995-), the end of Communism (either 1989-1992 or 1989 only), and the
Arab Spring (2011), and find no evidence that democracy protests are more likely to occur
in target countries if protests occurred in neighboring countries during any of these periods.
To explore the results for the end of communism and the Arab Spring further, we analyzed
qualitatively and quantitatively the events that occurred around the protests in East Central
Europe in 198928 and the Middle East and North Africa (MENA) in 2011.29
In our analysis, we find statistically significant evidence of a spatial and temporal clus-
tering of democracy protests in East Europe (as defined by the UN Statistics Division)
in 1989, but not in MENA (as defined by the World Bank) in 2011 (see Appendix Ta-
bles A50 and A54). In 1989, our analysis indicates that this clustering is more consistent
with a commonalities explanation of democracy protests rather than di↵usion. The common
exogenous shock associated with these protests was the changing orientation of Soviet for-
eign policy toward the region and Soviet Union’s announcement, in particular, that it would
27The actual values are: 249 (GDELT); 877 (SPEED); and 6, 211 (MMD).28These are the seven countries that the UN classifies as comprising East Europe and that existed in 1989:Bulgaria, Czechoslovakia, East Germany, Hungary, Poland, Romania and the Soviet Union. Note thatAlbania and Yugoslavia, which are not classified as part of East Europe and were more independent ofand/or isolated from of the USSR than those that were, did not experience protests in 1989.
29According to the World Bank, the MENA comprises the following countries: Algeria, Bahrain, Djibouti,Egypt, Iran, Iraq, Israel, Jordan, Kuwait, Lebanon, Libya, Malta, Morocco, Oman, Qatar, Saudi Arabia,Syria, Tunisia, the United Arab Emirates, the West Bank and Gaza, and Yemen.
27

not intervene in the domestic a↵airs of countries in the region. We identify this exogenous
shock with Mikhail Gorbachev’s speech of 6 July 1989, promising to respect the sovereignty
of countries in East Europe and withdraw troops from the region (Kramer 2011). When we
include a measure indicating the time passed since this speech and interact it with a East
Europe dummy, we find the Neighbor Democracy Protest variable is essentially zero, while
the interaction term has a large and statistically significant e↵ect on protests (see Appendix
Table A52). We do not find evidence of any spatial or temporal clustering of protests in
MENA in 2011, we suspect because more countries did not experience protests in MENA in
2011 than did. As explained in the Appendix, this null finding is robust to including three
additional protests that we did not include in our original analysis as they did not have
democracy as their primary demand – Tunisia in 2010, and Libya and Syria in 2011.
[Insert Table 4]
In still other models presented in this table, we split the data into two samples – one
for non-democracies (defined as those scoring 5 or less on the Polity IV index, or classified
as “Autocratic” or “Electoral authoritarian” according to V-Dem’s ordinal polyarchy index)
and one for democracies (scoring 6 or more on the Polity IV index or classified as “Mini-
mally democratic” or “Democratic” by V-Dem’s ordinal polyarchy index) – to determine if
protests are more likely to di↵use to non-democratic countries regardless of whether or not
neighboring countries are democratic. As the models show, democracy protests are not sig-
nificantly more likely to occur in authoritarian states if protests occur in neighboring states
for any time interval or definition of neighboring states. To check if the results are driven
by the use of linear probability models, we also tried conditional logit and random e↵ects
logit specifications. The conditional logit specifications also report null findings while the
random e↵ects models do not converge, probably due to the small number of cases in which
the outcome variable takes the value of 1. (See Appendix Table A58).
28
In other models, we consider the possibility of democracy protests di↵using across election
periods. For these models, we conduct two separate sets of analyses. In the first, we replicate
the models reported above, but include an interaction e↵ect between a post-election period
and the neighbor democracy protest variable (see Table A61 in the Appendix). In the
second, we code a neighbor democracy protest as having occurred if there was a post-election
democracy protest after the last election held in a neighboring country. In Table A62 we
use the country-day as the unit of observation and limit the analysis to election-related
democracy protests. In Tables A63 and A64, we employ the election as the unit of observation
in order to determine whether, conditional on there being an election, an election-related
protest is more likely to take place in a target country when there had been an election-related
protest in a neighbor country.
Overall, in these models, we find weak evidence that the likelihood of a democracy protest
to occur in a target country is significantly higher when a democracy protest occurs in a
neighboring country conditional on the occurrence of elections in target countries. Only a
handful of the e↵ects are significant and the few significant e↵ects that we find are unlikely
to be due to di↵usion processes since they are not consistent with the expectations of dif-
fusion arguments regarding the characteristics of neighboring protests that make protests
more likely to di↵use, and because a close inspection of the data indicates that the cases re-
sponsible for the significant results are not those that di↵usion scholars point to as examples
of di↵usion.
Government Responses to Neighbor Protests
In Table 5 we explore if how governments in neighboring countries respond to democracy
protests influences the likelihood of protests to occur in target countries. As is evident
from the results in this table, democracy protests are not significantly more likely to occur
in target countries regardless of whether or not governments repress democracy protests
29
in neighboring countries or extend political concessions to them. The three indicators for
success are not jointly significant in any of the models in this table according to Wald Tests,
nor are any of the three indicators for repression.
[Insert Table 5]
Characteristics of Neighbors
In the final set of models presented in Table 6, we examine if, as di↵usion arguments sug-
gest, democracy protests are more likely to occur in countries the more influential neighboring
countries are in absolute and relative terms, and the more similar neighboring countries are
to target countries. As is evident from the table, protests are not significantly more likely
to occur in target countries regardless of how influential neighboring countries are or how
similar they are to target countries. None of the measures of influentialness or similarity are
significant for either 50 km or 800 km neighbors for any time interval examined.
[Insert Table 6]
We cannot discern from the preceding analysis whether the null results we find are driven
by the fact that democracy protests do not di↵use across countries, or because the net e↵ect
of di↵usion is zero as a result of governments taking countermeasures to prevent the spread
of protests. That said, we are inclined to believe that our results are not due to the lat-
ter because the countries least likely to experience democracy protests countries are those
most capable of undertaking measures to counter them, and because we do not find any evi-
dence to suggest that governments systematically undertake countermeasures in response to
protests in neighboring countries. To investigate this possibility, we examined news accounts
around each of the protests, and analyzed statistically the likelihood of countries restricting
civil liberties and reducing media freedom when at least one democracy protest occurred
30

in a neighboring country in the last year. As Table A65 shows, countries whose neighbors
experienced a democracy protest in the last 360 days are not more likely to restrict civil
liberties or reduce media freedom within the year.
Conclusion
In contrast to prevailing views, our analysis finds little empirical evidence to support the
notion that democracy protests di↵use across countries based on either full or bounded ra-
tionality. According to our analysis, democracy protests were not significantly more likely to
occur shortly after democracy protests erupted in neighboring countries, no matter the num-
ber or size of the neighboring protests or whether the neighboring countries were influential
or similar to the target countries in terms of various political and socio-economic features.
Nor were they more likely to occur when democracy protests in neighboring countries were
not repressed by their governments or were able to extract political concessions from them.
These claims apply not only to the entire post-communist period, but also to the periods for
which protests are widely believed to di↵use across countries – the fall of communism, the
Color Revolutions, and the Arab Spring.
Our analysis o↵ers a valid and rigorous test of di↵usion arguments. If democracy protests
were to di↵use to other countries, we would expect to have seen evidence of it in the post-Cold
War era because of the free flow of information in this era. Not only did we not detect any
evidence of it in this period, but we also did not see any evidence of it for particular periods
within this era in which di↵usion is widely believed to have occurred. Of course, the absence
of evidence is not evidence of absence. However, the previous statistical analysis is extensive.
We analyzed the potential for di↵usion over five di↵erent time intervals (i.e., 45 days, 90
days, 120 days, 360 days, and elections periods); three di↵erent historical periods (i.e., the
fall of communism, the internet era, and the Arab Spring); and three di↵erent definitions of
neighbors (i.e., 50 km, 800 km, and UN-designated world regions). We also examined the
31
potential for di↵usion based not only on whether protests occurred in neighboring countries,
but also on various characteristics of neighboring countries’ protests, including their size,
strategies, and e↵ectiveness, and their similarity to other countries, using the only existing
data on democracy protests, as well as data on related forms of protests as a robustness test.
Our analysis does not exclude the possibility that other aspects of protests, including
their strategies, tactics, and techniques, di↵use across countries. Nor does it rule out the
possibility that democracy protests inspire other forms of mobilization, although we do not
find evidence that democracy protests inspire other types of politics protests or a↵ect the
size of protests in neighboring countries in any way. It also does not deny the possibility
that democracy protests inspire protests in other countries in particular cases, or that certain
individuals are inspired to participate in democracy protests by protests in other countries,
only that these cases are not part of a general trend. Lastly, our analysis does not rule out
the possibility that other international factors, such as exogenous economic shocks, influence
the likelihood of democracy protests to occur in countries, only that democracy protests in
other countries do not.
Knowing that democracy protests do not di↵use across countries in general is impor-
tant because many studies of individual protests suggest, either implicitly or explicitly, that
democracy protests di↵use more broadly. Moreover, democracy protests are one of the
mechanisms by which democracy is believed to di↵use across countries. The absence of any
evidence of protest di↵usion suggests that if democracy di↵uses, it does so through other
mechanisms, such as external support from neighboring countries in the form of foreign
aid, membership in regional organizations, and so forth. Were neighboring governments
to initiate democratic reforms in order to pre-empt protests from occurring against them,
democracy protests could still account for the geographic and temporal clustering of democ-
racy worldwide even if they do not di↵use across countries. However, since civil liberties and
32

media freedom do not generally decline when protests occur in neighboring countries, this
does not appear to be the case either.
33
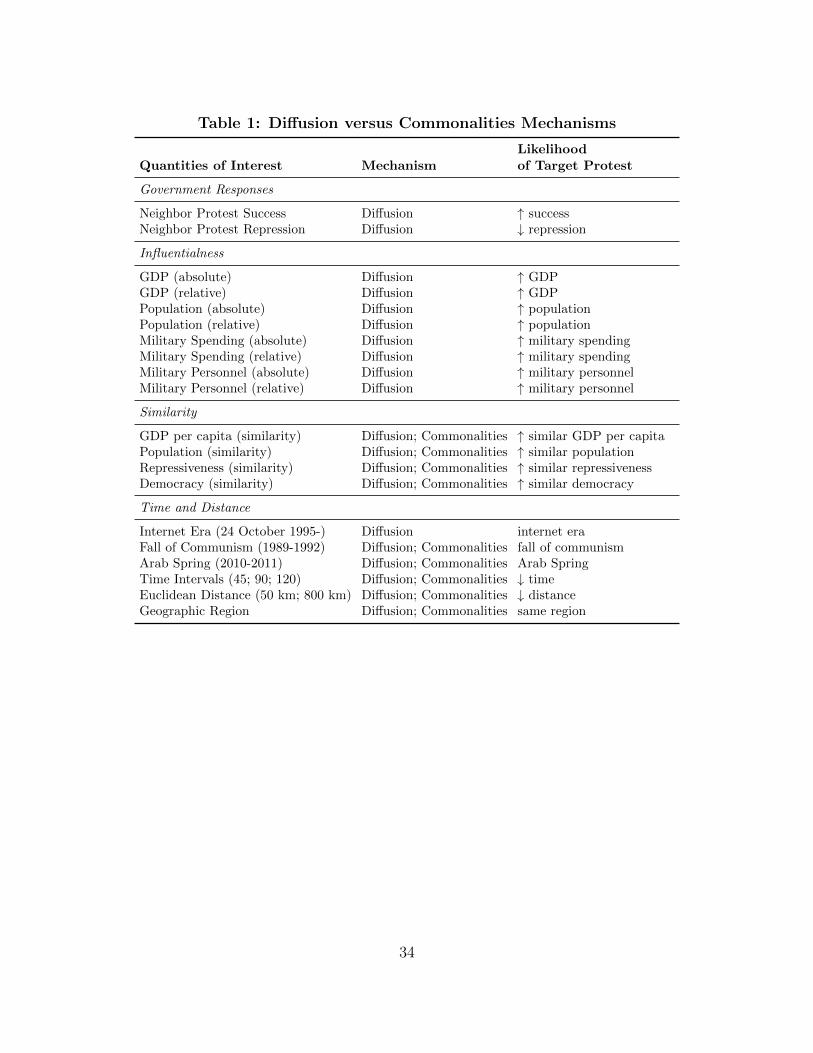
Table 1: Di↵usion versus Commonalities Mechanisms
Likelihood
Quantities of Interest Mechanism of Target Protest
Government Responses
Neighbor Protest Success Di↵usion " successNeighbor Protest Repression Di↵usion # repression
Influentialness
GDP (absolute) Di↵usion " GDPGDP (relative) Di↵usion " GDPPopulation (absolute) Di↵usion " populationPopulation (relative) Di↵usion " populationMilitary Spending (absolute) Di↵usion " military spendingMilitary Spending (relative) Di↵usion " military spendingMilitary Personnel (absolute) Di↵usion " military personnelMilitary Personnel (relative) Di↵usion " military personnel
Similarity
GDP per capita (similarity) Di↵usion; Commonalities " similar GDP per capitaPopulation (similarity) Di↵usion; Commonalities " similar populationRepressiveness (similarity) Di↵usion; Commonalities " similar repressivenessDemocracy (similarity) Di↵usion; Commonalities " similar democracy
Time and Distance
Internet Era (24 October 1995-) Di↵usion internet eraFall of Communism (1989-1992) Di↵usion; Commonalities fall of communismArab Spring (2010-2011) Di↵usion; Commonalities Arab SpringTime Intervals (45; 90; 120) Di↵usion; Commonalities # timeEuclidean Distance (50 km; 800 km) Di↵usion; Commonalities # distanceGeographic Region Di↵usion; Commonalities same region
34
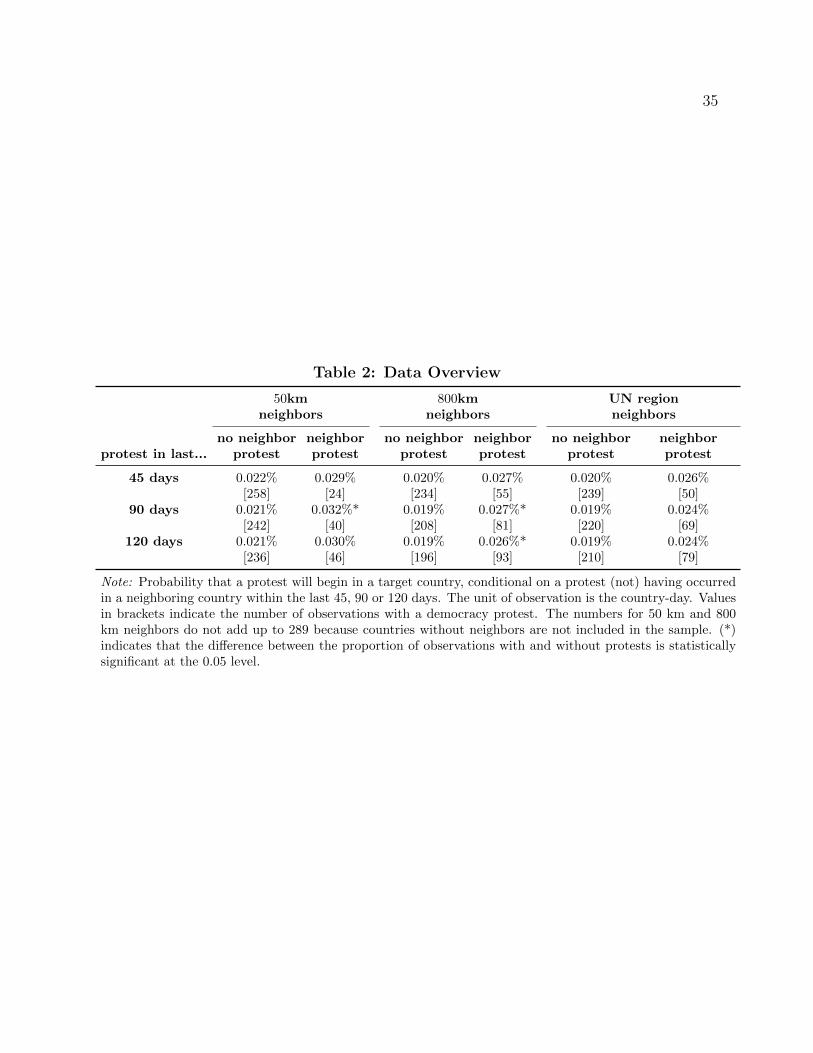
35
Table 2: Data Overview
50km 800km UN region
neighbors neighbors neighbors
no neighbor neighbor no neighbor neighbor no neighbor neighbor
protest in last... protest protest protest protest protest protest
45 days 0.022% 0.029% 0.020% 0.027% 0.020% 0.026%[258] [24] [234] [55] [239] [50]
90 days 0.021% 0.032%* 0.019% 0.027%* 0.019% 0.024%[242] [40] [208] [81] [220] [69]
120 days 0.021% 0.030% 0.019% 0.026%* 0.019% 0.024%[236] [46] [196] [93] [210] [79]
Note: Probability that a protest will begin in a target country, conditional on a protest (not) having occurredin a neighboring country within the last 45, 90 or 120 days. The unit of observation is the country-day. Valuesin brackets indicate the number of observations with a democracy protest. The numbers for 50 km and 800km neighbors do not add up to 289 because countries without neighbors are not included in the sample. (*)indicates that the di↵erence between the proportion of observations with and without protests is statisticallysignificant at the 0.05 level.
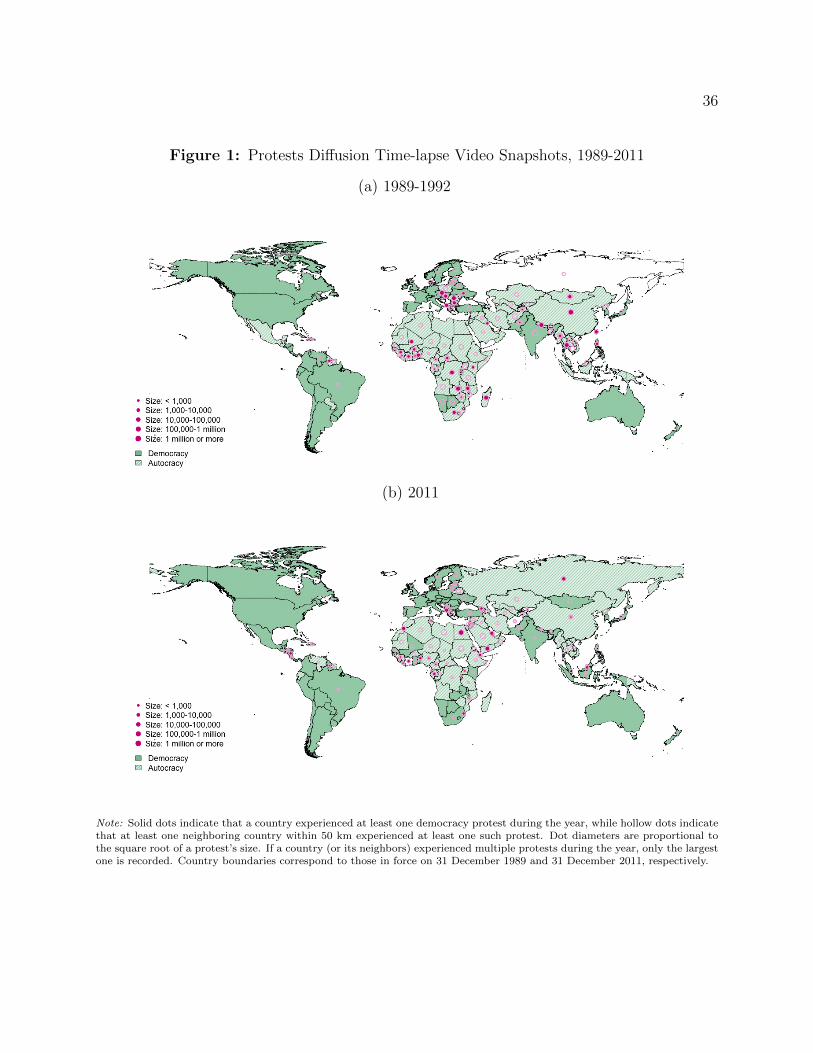
36
Figure 1: Protests Di↵usion Time-lapse Video Snapshots, 1989-2011
(a) 1989-1992
(b) 2011
Note: Solid dots indicate that a country experienced at least one democracy protest during the year, while hollow dots indicate
that at least one neighboring country within 50 km experienced at least one such protest. Dot diameters are proportional to
the square root of a protest’s size. If a country (or its neighbors) experienced multiple protests during the year, only the largest
one is recorded. Country boundaries correspond to those in force on 31 December 1989 and 31 December 2011, respectively.
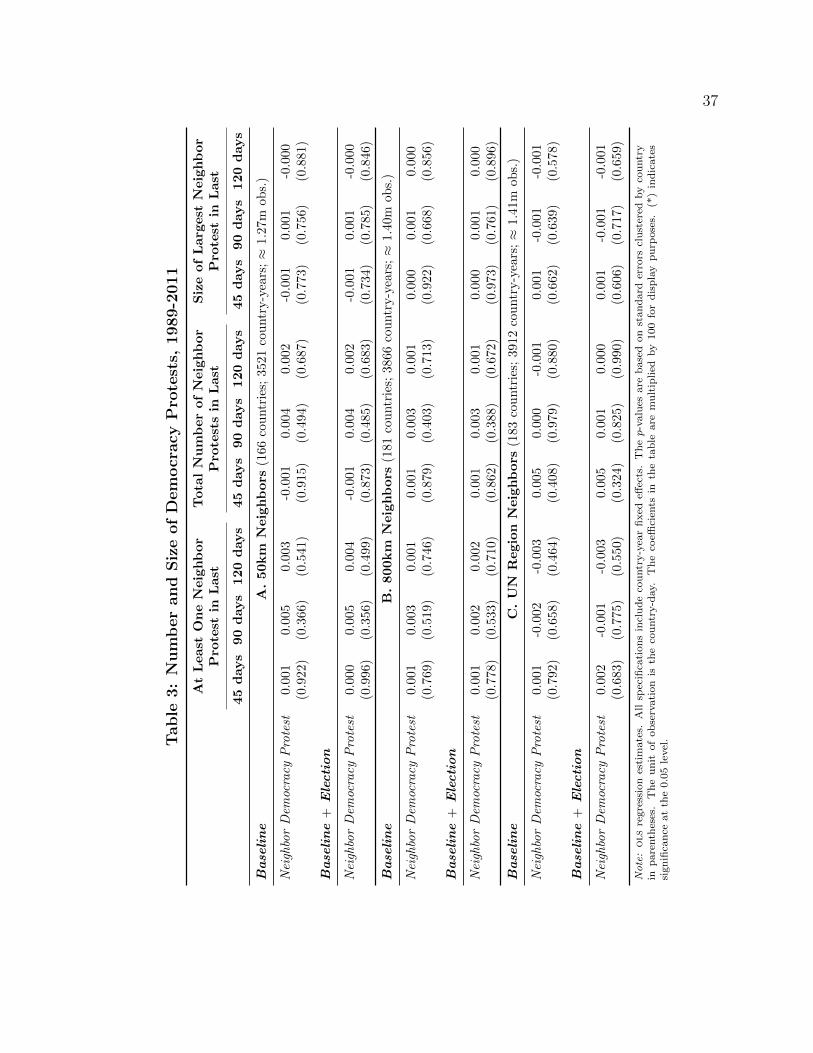
37
Table
3:Number
and
SizeofDem
ocracy
Pro
tests,
1989-2011
AtLeastOneNeighbor
TotalNumberofNeighbor
SizeofLargestNeighbor
Protestin
Last
Protestsin
Last
Protestin
Last
45days
90days
120days
45days
90days
120days
45days
90days
120days
Base
line
A.50km
Neighbors(166
countries;3521
country-years;⇡
1.27m
obs.)
NeighborDem
ocracy
Protest
0.001
0.005
0.003
-0.001
0.004
0.002
-0.001
0.001
-0.000
(0.922)
(0.366)
(0.541)
(0.915)
(0.494)
(0.687)
(0.773)
(0.756)
(0.881)
Base
line+
Election
NeighborDem
ocracy
Protest
0.000
0.005
0.004
-0.001
0.004
0.002
-0.001
0.001
-0.000
(0.996)
(0.356)
(0.499)
(0.873)
(0.485)
(0.683)
(0.734)
(0.785)
(0.846)
Base
line
B.800km
Neighbors(181
countries;3866
country-years;⇡
1.40m
obs.)
NeighborDem
ocracy
Protest
0.001
0.003
0.001
0.001
0.003
0.001
0.000
0.001
0.000
(0.769)
(0.519)
(0.746)
(0.879)
(0.403)
(0.713)
(0.922)
(0.668)
(0.856)
Base
line+
Election
NeighborDem
ocracy
Protest
0.001
0.002
0.002
0.001
0.003
0.001
0.000
0.001
0.000
(0.778)
(0.533)
(0.710)
(0.862)
(0.388)
(0.672)
(0.973)
(0.761)
(0.896)
Base
line
C.UN
Region
Neighbors(183
countries;3912
country-years;⇡
1.41m
obs.)
NeighborDem
ocracy
Protest
0.001
-0.002
-0.003
0.005
0.000
-0.001
0.001
-0.001
-0.001
(0.792)
(0.658)
(0.464)
(0.408)
(0.979)
(0.880)
(0.662)
(0.639)
(0.578)
Base
line+
Election
NeighborDem
ocracy
Protest
0.002
-0.001
-0.003
0.005
0.001
0.000
0.001
-0.001
-0.001
(0.683)
(0.775)
(0.550)
(0.324)
(0.825)
(0.990)
(0.606)
(0.717)
(0.659)
Note:ols
regressionestim
ates.Allspecificationsincludecountry-yearfixede↵ects.Thep-valuesarebasedonstandarderrorsclusteredbycountry
inparentheses.
Theunit
ofobservation
isthecountry-day.
Thecoe�cientsin
thetable
aremultiplied
by100fordisplaypurposes.
(*)indicates
significanceatthe0.05level.
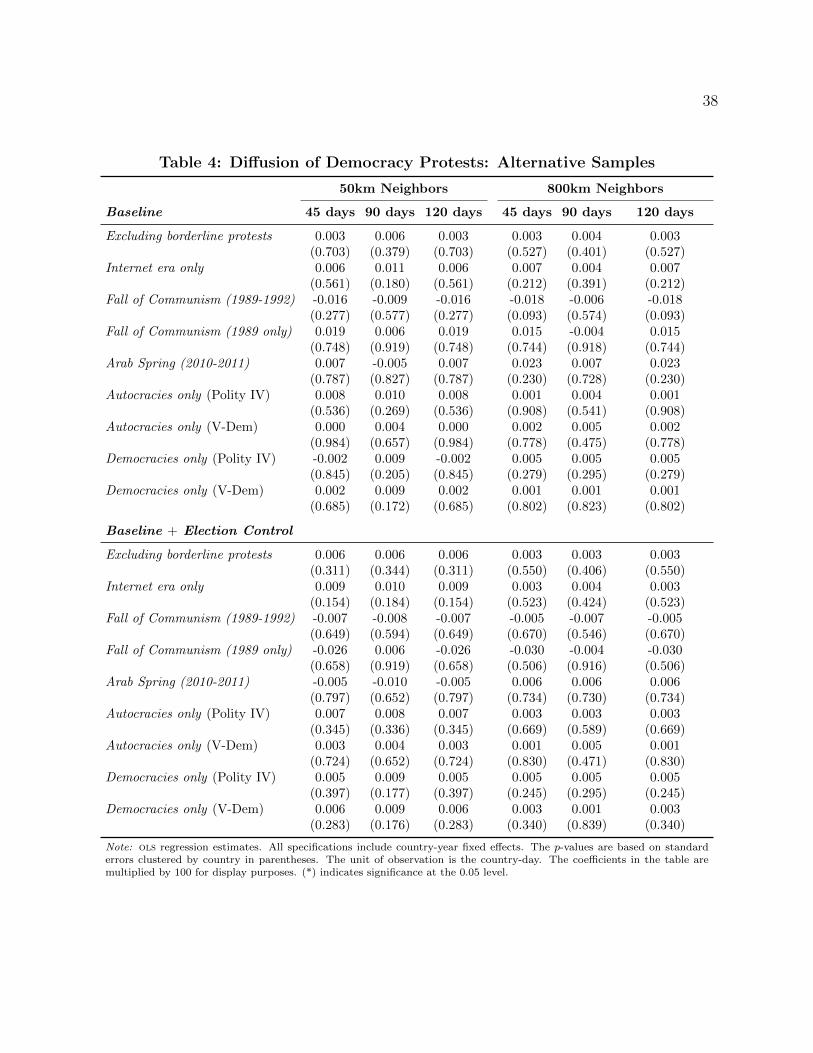
38
Table 4: Di↵usion of Democracy Protests: Alternative Samples
50km Neighbors 800km Neighbors
Baseline 45 days 90 days 120 days 45 days 90 days 120 days
Excluding borderline protests 0.003 0.006 0.003 0.003 0.004 0.003(0.703) (0.379) (0.703) (0.527) (0.401) (0.527)
Internet era only 0.006 0.011 0.006 0.007 0.004 0.007(0.561) (0.180) (0.561) (0.212) (0.391) (0.212)
Fall of Communism (1989-1992) -0.016 -0.009 -0.016 -0.018 -0.006 -0.018(0.277) (0.577) (0.277) (0.093) (0.574) (0.093)
Fall of Communism (1989 only) 0.019 0.006 0.019 0.015 -0.004 0.015(0.748) (0.919) (0.748) (0.744) (0.918) (0.744)
Arab Spring (2010-2011) 0.007 -0.005 0.007 0.023 0.007 0.023(0.787) (0.827) (0.787) (0.230) (0.728) (0.230)
Autocracies only (Polity IV) 0.008 0.010 0.008 0.001 0.004 0.001(0.536) (0.269) (0.536) (0.908) (0.541) (0.908)
Autocracies only (V-Dem) 0.000 0.004 0.000 0.002 0.005 0.002(0.984) (0.657) (0.984) (0.778) (0.475) (0.778)
Democracies only (Polity IV) -0.002 0.009 -0.002 0.005 0.005 0.005(0.845) (0.205) (0.845) (0.279) (0.295) (0.279)
Democracies only (V-Dem) 0.002 0.009 0.002 0.001 0.001 0.001(0.685) (0.172) (0.685) (0.802) (0.823) (0.802)
Baseline + Election Control
Excluding borderline protests 0.006 0.006 0.006 0.003 0.003 0.003(0.311) (0.344) (0.311) (0.550) (0.406) (0.550)
Internet era only 0.009 0.010 0.009 0.003 0.004 0.003(0.154) (0.184) (0.154) (0.523) (0.424) (0.523)
Fall of Communism (1989-1992) -0.007 -0.008 -0.007 -0.005 -0.007 -0.005(0.649) (0.594) (0.649) (0.670) (0.546) (0.670)
Fall of Communism (1989 only) -0.026 0.006 -0.026 -0.030 -0.004 -0.030(0.658) (0.919) (0.658) (0.506) (0.916) (0.506)
Arab Spring (2010-2011) -0.005 -0.010 -0.005 0.006 0.006 0.006(0.797) (0.652) (0.797) (0.734) (0.730) (0.734)
Autocracies only (Polity IV) 0.007 0.008 0.007 0.003 0.003 0.003(0.345) (0.336) (0.345) (0.669) (0.589) (0.669)
Autocracies only (V-Dem) 0.003 0.004 0.003 0.001 0.005 0.001(0.724) (0.652) (0.724) (0.830) (0.471) (0.830)
Democracies only (Polity IV) 0.005 0.009 0.005 0.005 0.005 0.005(0.397) (0.177) (0.397) (0.245) (0.295) (0.245)
Democracies only (V-Dem) 0.006 0.009 0.006 0.003 0.001 0.003(0.283) (0.176) (0.283) (0.340) (0.839) (0.340)
Note: ols regression estimates. All specifications include country-year fixed e↵ects. The p-values are based on standard
errors clustered by country in parentheses. The unit of observation is the country-day. The coe�cients in the table are
multiplied by 100 for display purposes. (*) indicates significance at the 0.05 level.

39
Table 5: Government Responses to Neighbor Protests, 1989-2011
50km Neighbors 800km Neighbors
(166 countries; 3521 c-years; ⇡ 1.27m obs.) (181 countries; 3866 c-years; ⇡ 1.40m obs.)
Baseline 45 days 90 days 120 days 45 days 90 days 120 days
Neighbor protest success
All Successful -0.016 -0.008 -0.010 -0.003 0.005 0.001(0.134) (0.438) (0.341) (0.653) (0.532) (0.898)
Some Successful -0.029 -0.029 -0.010 -0.026 -0.001 -0.001(0.034)* (0.028)* (0.644) (0.038)* (0.922) (0.934)
None Successful 0.006 0.010 0.007 0.004 0.002 0.002(0.536) (0.152) (0.258) (0.480) (0.626) (0.709)
Neighbor protest repression
All Repressed 0.003 0.008 0.004 0.007 0.010 0.008(0.775) (0.307) (0.630) (0.261) (0.090) (0.167)
Some Repressed -0.029 -0.023 -0.026 -0.038 -0.010 -0.017(0.055) (0.065) (0.025)* (0.000)* (0.462) (0.134)
None Repressed -0.002 0.002 0.005 -0.005 -0.008 -0.006(0.911) (0.888) (0.642) (0.484) (0.207) (0.368)
Election-related only
Neighbor Democracy Protest 0.003 0.004 -0.002 0.006 0.007 -0.000(0.724) (0.582) (0.740) (0.332) (0.163) (0.983)
Baseline + Election Control
Neighbor protest success
All Successful -0.014 -0.007 -0.009 -0.003 0.004 0.000(0.182) (0.497) (0.354) (0.655) (0.626) (0.966)
Some Successful -0.024 -0.027 -0.011 -0.025 0.000 -0.001(0.080) (0.036)* (0.616) (0.038)* (0.987) (0.942)
None Successful 0.004 0.010 0.007 0.004 0.002 0.002(0.653) (0.166) (0.241) (0.497) (0.615) (0.635)
Neighbor protest repression
All Repressed 0.002 0.009 0.004 0.007 0.010 0.008(0.824) (0.275) (0.554) (0.263) (0.087) (0.149)
Some Repressed -0.024 -0.020 -0.022 -0.037 -0.008 -0.015(0.107) (0.102) (0.057) (0.000)* (0.528) (0.166)
None Repressed -0.003 0.001 0.004 -0.005 -0.009 -0.007(0.851) (0.962) (0.700) (0.465) (0.172) (0.332)
Election-related only
Neighbor Democracy Protest 0.002 0.004 -0.002 0.005 0.008 0.001(0.840) (0.609) (0.776) (0.354) (0.144) (0.899)
Note: ols regression estimates. All specifications include country-year fixed e↵ects. The p-values are based on standard errors
clustered by country in parentheses. The unit of observation is the country-day. The coe�cients in the table are multiplied by
100 for display purposes. (*) indicates significance at the 0.05 level.

40
Table 6: Neighbor Countries’ Characteristics, 1989-2011
50km Neighbors 800km Neighbors
(151-165 countries; 2799-3494 (161-181 countries; 2997-3866
country-years; 1.02-1.26m obs.) country-years; 1.09-1.40m obs.)
Influentialness of neighbors 45 days 90 days 120 days 45 days 90 days 120 days
GDP (absolute) (log) 0.000 0.000 0.000 -0.000 0.000 -0.000(0.694) (0.368) (0.520) (0.997) (0.836) (0.922)
GDP (relative) (log) 0.000 0.000 0.000 -0.000 0.000 -0.000(0.915) (0.604) (0.653) (0.926) (0.852) (0.980)
Population (absolute) (log) 0.000 0.000 0.000 -0.000 0.000 0.000(0.709) (0.409) (0.592) (0.984) (0.765) (0.997)
Population (relative) (log) -0.000 0.000 0.000 -0.000 0.000 0.000(0.998) (0.734) (0.881) (0.853) (0.769) (0.968)
Military spending (absolute) (log) 0.000 0.000 0.000 -0.000 0.000 -0.000(0.967) (0.295) (0.478) (0.998) (0.739) (0.867)
Military spending (relative) (log) 0.000 0.001 0.001 0.000 -0.000 -0.000(0.868) (0.379) (0.357) (0.961) (0.913) (0.653)
Military personnel (absolute) (log) 0.000 0.000 0.000 0.000 0.000 0.000(0.964) (0.331) (0.415) (0.680) (0.464) (0.661)
Military personnel (relative) (log) -0.000 0.000 0.000 0.000 0.000 0.000(0.782) (0.701) (0.758) (0.830) (0.646) (0.864)
Similarity with neighbors
GDP per capita (similarity) 0.000 0.001 0.001 0.000 0.000 0.000(0.930) (0.537) (0.552) (0.952) (0.550) (0.637)
Population (similarity) -0.000 0.000 0.000 -0.000 0.000 0.000(0.925) (0.624) (0.560) (0.857) (0.723) (0.748)
Repressiveness (similarity) 0.003 0.004 0.003 0.004 0.003 0.003(0.601) (0.338) (0.285) (0.273) (0.290) (0.242)
Polity IV (similarity) 0.003 0.004 0.003 0.002 0.002 0.002(0.472) (0.124) (0.231) (0.460) (0.240) (0.312)
Polyarchy index (V-Dem) (similarity) 0.001 0.001 0.001 0.001 0.001 0.001(0.806) (0.490) (0.695) (0.594) (0.518) (0.656)
Note: ols regression estimates. All specifications include country-year fixed e↵ects. The p-values are based on standard errors
clustered by country in parentheses. The unit of observation is the country-day. The coe�cients in the table are multiplied by
100 for display purposes. (*) indicates significance at the 0.05 level.
References
Angrist, Joshua D. and Jorn-Ste↵en Pischke. 2009. Mostly Harmless Econometrics: An Empiricist’sCompanion. Princeton: Princeton University Press.
Beaulieu, Emily. 2014. Electoral Protest and Democracy in the Developing World. New York:Cambridge University Press.
Beck, Nathaniel. 2011. “Of Fixed-E↵ects and Time-Invariant Variables.” Political Analysis19(2):119–122.
Beissinger, Mark R. 2007. “Structure and Example in Modular Political Phenomena: The Di↵usionof Bulldozer/Rose/Orange/Tulip Revolutions.” Perspectives on Politics 5(2):259–276.
Beissinger, Mark R. 2013. “The Semblance of Democratic Revolution: Coalitions in Ukraine’sOrange Revolution.” American Political Science Review 107(3):574–592.
Berger, Helge and Mark Spoerer. 2001. “Economic Crises and the European Revolutions of 1848.”The Journal of Economic History 61(2):293–326.
Boehmke, Frederick J. 2009. “Policy Emulation or Policy Convergence? Potential Ambiguitiesin the Dyadic Event History Approach to State Policy Emulation.” The Journal of Politics71(3):1125–1140.
Boix, Carles. 2003. Democracy and Redistribution. New York: Cambridge University Press.
Brancati, Dawn. 2007. “Global Elections Database.” http://www.globalelectionsdatabase.com.
Brancati, Dawn. 2016. Democracy Protests: Origins, Features, and Significance. New York: Cam-bridge University Press.
Bratton, Michael and Nicolas van de Walle. 1997. Democratic Experiments in Africa: RegimeTransitions in Comparative Perspective. New York City: Cambridge University Press.
Brinks, Daniel and Michael Coppedge. 2006. “Di↵usion Is No Illusion: Neighbor Emulation in theThird Wave of Democracy.” Comparative Political Studies 39(4):463–489.
Buenrostro, Lucia, Amrita Dhillon and Myrna Wooders. 2007. “Protests and Reputation.” Inter-national Journal of Game Theory 35:353–377.
Bunce, Valerie, David Patel and Sharon L. Wolchik. 2013. “Rethinking the Di↵usion of Democracy:1989, the Color Revolutions and the Arab Uprisings.” Paper presented at International StudiesAssociation, San Francisco, CA, April 3-6, 2013.
Bunce, Valerie J. and Sharon L. Wolchik. 2006. “International Di↵usion and Postcommunist Elec-toral Revolutions.” Communist and Post-Communist Studies 39(3):283–304.
Bunce, Valerie J. and Sharon L. Wolchik. 2013. “Favorable Conditions and Electoral Revolutions.”Journal of Democracy 17(4):5–18.
41

Campante, Filipe R. and Davin Chor. 2012. “Why Was the Arab World Poised for Revolution?Schooling, Economic Opportunities, and the Arab Spring.” Journal of Economic Perspectives26(2):167–188.
Chaisty, Paul and Stephen Whitefield. 2013. “Forward to Democracy or Back to Authoritarianism?The Attitudinal Bases of Mass Support for the Russian Election Protests of 2011–2012.” Post-Soviet A↵airs 29(5):387–403.
Danneman, Nathan and Emily Hencken Ritter. 2014. “Contagious Rebellion and Preemptive Re-pression.” Journal of Conflict Resolution 58(2):254–279.
della Porta, Donatella. 2014. Mobilizing for Democracy: Comparing 1989 and 2011. Oxford: OxfordUniversity Press.
della Porta, Donatella and Sidney Tarrow. 2012. “Interactive Di↵usion: The Coevolution of Policeand Protest Behavior With an Application to Transnational Contention.” Comparative PoliticalStudies 45(1):119 –152.
Dornbusch, Rudiger, Yung Chul Park and Stijn Claessens. 2000. “Contagion: Understanding HowIt Spreads.” The World Bank Research Observer, 15(2):177–197.
Elkins, Zachary. 2008. Is Democracy Contagious? Di↵usion and the Dynamics of Regime Transi-tion. In International Perspectives on Contemporary Democracy, ed. Peter F. Nardulli. Urbana-Champaign: University of Illinois Press pp. 42–62.
Elkins, Zachary and Beth Simmons. 2005. “On Waves, Clusters, and Di↵usion: A ConceptualFramework.” The Annals of the American Academy of Political and Social Science 598(1):33–51.
Franzese, Jr., Robert J. and Jude C. Hays. 2008. “Interdependence in Comparative Politics: Sub-stance, Theory, Empirics, Substance.” Journal of Comparative Politics 41(4-5):742– 80.
Gana, Nouri. 2013. The Making of the Tunisian Revolution: Contexts, Architects and Prospects.Edinburgh: Edinburgh University Press.
Gilardi, Fabrizio, Justus Bamert and Fabio Wasserfallen. 20153. “Learning and the Di↵usion ofRegime contention in the Arab Spring.” Research and Politics 2(3):1–9.
Givan, Rebecca Kolins, Kenneth M. Roberts and Sarah A. Soule, eds. 2010. The Di↵usion of SocialMovements. New York: Cambridge University Press.
Gleditsch, Kristian Skrede and Michael D. Ward. 2006. “Di↵usion and the International Contextof Democratization.” International Organization 60(4):911–933.
Goldstone, Jack A. 1991. Revolution and Rebellion in the Early Modern World. Berkeley: Universityof California Press.
Gunitsky, Seva. 2014. “From Shocks to Waves: Hegemonic Transitions and Democratization in theTwentieth Century.” International Organization 68(3):561 – 597.
42

Hale, Henry E. 2005. “Democracy, Autocracy, and Revolution in Post-Soviet Eurasia.” WorldPolitics 58(1):133–165.
Hale, Henry E. 2014. “Regime Change Cascades: What We Have Learned from the 1848 Revolutionsto the 2011 Arab Uprisings.” Annual Review of Political Science 16:331–53.
Heydemann, Steven and Reinoud Leenders. 2011. “Authoritarian Learning and AuthoritarianResilience: Regime Responses to the ‘Arab Awakening’.” Globalizations 8(5):647–653.
Houle, Christian, Mark Andreas Kayser and Jun Xiang. 2016. “Di↵usion or Confusion? ClusteredShocks and the Conditional Di↵usion of Democracy.” International Organization 70(4):687–726.
Huntington, Samuel P. 1991. The Third Wave: Democratization in the Late Twentieth Century.Norman, Oklahoma: University of Oklahoma Press.
Hyde, Susan D. and Nikolay Marinov. 2014. “Does Information Facilitate Self-Enforcing Democ-racy?:The Role of International Election Observation.” International Organization 68(2):329 –359.
Inglehart, Ronald and Christian Welzel. 2009. “How Development Leads to Democracy: What WeKnow About Modernization.” Foreign A↵airs 88(2):33–48.
International Institute for Strategic Studies, The. 1988-2011. The Military Balance. London: TheInternational Institute for Strategic Studies.
Jaggers, Keith and Ted Robert Gurr. 1995. “Tracking Democracy’s Third Wave with the PolityIII Data.” Journal of Peace Research 32(4):469–82.
Jo↵e, George. 2011. “The Arab Spring in North Africa: Origins and Prospects.” The Journal ofNorth African Studies 16(4):507–532.
Koesel, Karrie J. and Valerie J. Bunce. 2013. “Di↵usion-Proofing: Russian and Chinese Re-sponses to Waves of Popular Mobilizations against Authoritarian Rulers.” Perspectives on Poli-tics 11(3):753–768.
Kopstein, Je↵rey S. and David A. Reilly. 2000. “Geographic Di↵usion and the Transformation ofthe Postcommunist World.” World Politics 53(1):1–37.
Kotkin, Stephen. 2009. Uncivil Society: 1989 and the Implosion of the Communist Establishment.New York: Modern Library.
Kramer, Mark. 2011. “The Demise of the Soviet Bloc.” The Journal of Modern History 83(4):788–854.
Kuntz, Philipp and Mark R. Thompson. 2009. “More than Just the Final Straw : Stolen Electionsas Revolutionary Triggers.” Comparative Politics 41(3):253–272.
Kuran, Timur. 1989. “Sparks and Prairie Fires: A Theory of Unanticipated Political Revolution.”Public Choice 61(1):41–74.
43

Kuran, Timur. 1991. “Now Out of Never: The Element of Surprise in the East European Revolutionof 1989.” World Politics 44(1):7–48.
Kuran, Timur. 2011. “The Politics of Revolutionary Surprise.” https://www.project-syndicate.org.
Leeson, Peter T. and Andrea M. Dean. 2009. “The Democratic Domino Theory: An EmpiricalInvestigation.” American Journal of Political Science 53(3):533–551.
Lohmann, Susanne. 1994. “The Dynamics of Informational Cascades: The Monday Demonstrationsin Leipzig, EastGermany, 1989-91.” World Politics 47(1):42–101.
Lotan, Gilad, Erhardt Grae↵, Mike Ananny, Devin Ga↵ney, Ian Pearce and Danah Boyd. 2011.“The Revolutions were Tweeted: Information Flows during the 2011 Tunisian and EgyptianRevolutions.” International Journal of Communication 5:1375–1405.
Lynch, Marc. 2012. The Arab Uprising: The Unfinished Revolutions of the New Middle East. NewYork: Public A↵airs.
Mainwaring, Scott and Anıbal Perez-Linan. 2014. Democracies and Dictatorships in Latin America:Emergence, Survival and Fall. Cambridge: Cambridge University Press.
Marshall, Monty G. and Ted Robert Gurr. 2015. “Polity IV Project, Political Regime Character-istics and Transitions, 1800-2014.” http://www.systemicpeace.org/inscrdata.html.
McAdam, Doug and Dieter Rucht. 1993. “The Cross-National Di↵usion of Movement Ideas.” TheAnnals of the American Academy of Political and Social Science 528(July):56–74.
McAdam, Doug, John D. McCarthy and Mayer N. Zald, eds. 1996. Comparative Perspectives onSocial Movements: Political Opportunities, Mobilizing Structures, and Cultural Framings. NewYork City: Cambridge University Press.
Mitchell, Lincoln A. 2012. The Color Revolutions. Philadelphia: University of Pennsylvania Press.
Nohlen, Dieter, ed. 2005. Elections in the Americas: A Data Handbook. Oxford: Oxford UniversityPress.
Nohlen, Dieter, Michael Krennerich and Berhard Thibaut, eds. 1999. Elections in Africa: A DataHandbook. Oxford: Oxford University Press.
Nohlen, Dieter and Philip Stover, eds. 2010. Elections in Europe: A Data Handbook. Baden-Baden,Germany: Nomos Publishers.
Nunley, Albert C. 2004-2012. “African Elections Database.” http://africanelections.tripod.
com.
Osmani, Juliana. 2016. “Heuristics and Cognitive Biases: Can the Group Decision-Making AvoidThem?” Academic Journal of Interdisciplinary Studies 5(3):225–232.
Patel, David Siddhartha. 2014. “Roundabouts and Revolutions: Public Squares, Coordination, andthe Di↵usion of the Arab Uprisings.”.
44

Saideman, Stephen M. 2012. “When Conflict Spreads: Arab Spring and the Limits of Di↵usion.”International Interactions 38(5):713–722.
Solingen, Etel. 2012. “Of Dominoes and Firewalls: The Domestic, Regional, and Global Politics ofInternationalDi↵usion.” International Studies Quarterly 56(4):631–644.
Soule, Sarah A. 1997. “The Student Divestment Movement in the United States and the Shanty-town: Di↵usion of a Protest Tactic.” Social Forces 75(3):855–883.
Stang, David. 1991. “Adding Social Structure to Di↵usion Models: An Event History Framework.”Sociological Methods and Research 19(3):324–353.
Starr, Harvey. 1991. “Democratic Dominoes: Di↵usion Approaches to the Spread of Democracy inthe International System.” The Journal of Conflict Resolution 35(2):356–381.
Starr, Harvey and Christina Lindborg. 2003. “Democratic Dominoes Revisited: The Hazards ofGovernmental Transitions, 1974–1996.” Journal of Conflict Resolution 47(4):490–519.
Svolik, Milan W. and Svitlana Chernykh. 2015. “When are Election Outcomes Self-Enforcing?How Institutions Shape Incentives for Electoral Manipulation and Post-Election Protest.” TheJournal of Politics 77(2):407–420.
Tarrow, Sidney. 2005. The New Transnational Activism. New York: Cambridge University Press.
Tarrow, Sidney G. 1991. “Struggle, Politics, and Reform: Collective Action, Social Movements,and Cycles of Protest.” Ithaca, NY: Cornell University Press.
Tarrow, Sidney G. 1994. Power in Movement: Social Movements and Contentious Politics. Cam-bridge University Press.
Tucker, Joshua A. 2007. “Enough! Electoral Fraud, Collective Action Problems, and Post-Communist Colored Revolutions.” Perspectives on Politics 5(3):535–551.
Valenzuela, Sebastian, Arturo Arriagada and Andres Scherman. 2012. “The Social Media Basis ofYouth Protest Behavior: The Case of Chile.” Journal of Communication 62(2):299–314.
Weidmann, Nils B., Doreen Kuse and Kristian Skrede Gleditsch. 2010. “The Geography of theInternational System: The CShapes Dataset.” International Interactions: Empirical and Theo-retical Research in International Relations 36(1):86–106.
Weyland, Kurt. 2007. Bounded Rationality and Policy Di↵usion: Social Sector Reform in LatinAmerica. Princeton, NJ: Princeton University Press.
Weyland, Kurt. 2009. “The Di↵usion of Revolution: ‘1848’ in Europe and Latin America.” Inter-national Organization 63(3):391–423.
Weyland, Kurt. 2012. “The Arab Spring: Why the Surprising Similarities with the RevolutionaryWave of 1848?” Perspectives on Politics 10(4):917–934.
45

Weyland, Kurt. 2014. Making Waves: Democratic Waves in Europe and Latin America since theRevolutions. New York City: Cambridge University Press.
World Bank, The. 2014. World Development Indictors Online. Washington, D.C.: World BankGroup.
Zhukov, Yuri M. and Brandon M. Stewart. 2013. “Choosing Your Neighbors: Networks of Di↵usionin International Relations.” International Studies Quarterly 57(2):271–287.
46