Why Are Sports Team IPOs Uncommon?
52
University of Pennsylvania ScholarlyCommons Joseph Wharton Scholars Wharton Undergraduate Research 2019 Why Are Sports Team IPOs Uncommon? Chris K . Oh University of Pennsylvania, [email protected] Follow this and additional works at: hps://repository.upenn.edu/joseph_wharton_scholars Part of the Accounting Commons , Business Administration, Management, and Operations Commons , Corporate Finance Commons , Finance and Financial Management Commons , and the Sports Management Commons is paper is posted at ScholarlyCommons. hps://repository.upenn.edu/joseph_wharton_scholars/59 For more information, please contact [email protected]. Recommended Citation Oh, C. K. (2019). "Why Are Sports Team IPOs Uncommon?," Joseph Wharton Scholars. Available at hps://repository.upenn.edu/ joseph_wharton_scholars/59
Transcript of Why Are Sports Team IPOs Uncommon?

University of PennsylvaniaScholarlyCommons
Joseph Wharton Scholars Wharton Undergraduate Research
2019
Why Are Sports Team IPOs Uncommon?Chris K. OhUniversity of Pennsylvania, [email protected]
Follow this and additional works at: https://repository.upenn.edu/joseph_wharton_scholarsPart of the Accounting Commons, Business Administration, Management, and Operations
Commons, Corporate Finance Commons, Finance and Financial Management Commons, and theSports Management Commons
This paper is posted at ScholarlyCommons. https://repository.upenn.edu/joseph_wharton_scholars/59For more information, please contact [email protected].
Recommended CitationOh, C. K. (2019). "Why Are Sports Team IPOs Uncommon?," Joseph Wharton Scholars. Available at https://repository.upenn.edu/joseph_wharton_scholars/59
Why Are Sports Team IPOs Uncommon?
AbstractThis paper explored the topic of capital raising in the professional sports industry, particularly regarding thedistinct lack of equity financing among professional sports teams. Therefore, the study attempts to answer thequestion: "why are sports team IPOs uncommon?" This paper hypothesizes that professional sports teams donot benefit from a stock market listing, discouraging private sports team owners from taking their teamspublic. This hypothesis is then tested through three main lenses: 1) managerial disincentives, 2) operationaldisincentives, and 3) financial disincentives. Reviewing the existing literature and case studies of precedentprofessional sports team IPOs suggest that going public induces limitations in managerial freedom due to theadditionally imposed financial discipline followed by an IPO. This may hinder player investment decisions,preventing owners from realizing win-maximization and even long-term profit-maximization. The lack offlexibility is exacerbated by a mismatch in incentives given the typical profile of a professional sports teamowner. Other managerial disincentives are also present. For operational and financial disincentives, the studyused a unique panel dataset consisting of domestic performance data and various financial metrics and ratiosof European football clubs, including those that are currently listed and delisted. The study finds that, contraryto the existing literature, there is a statistically significant positive relationship between pre- and post-IPOaverage points won per game in domestic league. However, the coefficient is quite small and thus the practicalmagnitude of the impact of an IPO to the team's match performance can be considered marginal.Furthermore, the empirical results indicate that a stock market listing helps a football club to successfullydeleverage, although it has no significant impact on other key financial ratios. Listing may also potentiallyharm the clubs’ bottom line. Meanwhile, the interaction effects assessing the role of a club's current listingstatus and the country in which it operates, with regard to the differences in a club’s operational and financialdependent variables pre- and post-IPO, were also analyzed. In consequence, given the strong managerialdisincentives with a lack of material operational and financial incentives, private sports team owners may notfind stock market listing as an attractive strategic alternative for capital raising over debt financing.
Keywordsprofessional sports, initial public offerings, disincentives, panel data, football
DisciplinesAccounting | Business Administration, Management, and Operations | Corporate Finance | Finance andFinancial Management | Sports Management
This thesis or dissertation is available at ScholarlyCommons: https://repository.upenn.edu/joseph_wharton_scholars/59

Why are Sports Team IPOs Uncommon?
By
Chris Kyoosung Oh
An Undergraduate Thesis submitted in partial fulfillment of the requirements for the
JOSEPH WHARTON SCHOLARS
Faculty Advisor:
Matthew C. Cedergren
Professor, Accounting
THE WHARTON SCHOOL, UNIVERSITY OF PENNSYLVANIA
MAY 2019
Abstract
This paper explored the topic of capital raising in the professional sports industry, particularly
regarding the distinct lack of equity financing among professional sports teams. Therefore, the
study attempts to answer the question: "why are sports team IPOs uncommon?" This paper
hypothesizes that professional sports teams do not benefit from a stock market listing, discouraging
private sports team owners from taking their teams public. This hypothesis is then tested through
three main lenses: 1) managerial disincentives, 2) operational disincentives, and 3) financial
disincentives. Reviewing the existing literature and case studies of precedent professional sports
team IPOs suggest that going public induces limitations in managerial freedom due to the
additionally imposed financial discipline followed by an IPO. This may hinder player investment
decisions, preventing owners from realizing win-maximization and even long-term profit-
maximization. The lack of flexibility is exacerbated by a mismatch in incentives given the typical
profile of a professional sports team owner. Other managerial disincentives are also present. For
operational and financial disincentives, the study used a unique panel dataset consisting of
domestic performance data and various financial metrics and ratios of European football clubs,
including those that are currently listed and delisted. The study finds that, contrary to the existing
literature, there is a statistically significant positive relationship between pre- and post-IPO average
points won per game in domestic league. However, the coefficient is quite small and thus the
practical magnitude of the impact of an IPO to the team's match performance can be considered
marginal. Furthermore, the empirical results indicate that a stock market listing helps a football
club to successfully deleverage, although it has no significant impact on other key financial ratios.
Listing may also potentially harm the clubs’ bottom line. Meanwhile, the interaction effects
assessing the role of a club's current listing status and the country in which it operates, with regard
to the differences in a club’s operational and financial dependent variables pre- and post-IPO, were
also analyzed. In consequence, given the strong managerial disincentives with a lack of material
operational and financial incentives, private sports team owners may not find stock market listing
as an attractive strategic alternative for capital raising over debt financing.
Keywords: professional sports; initial public offerings; disincentives; panel data; football

1
I. Introduction
Historically, professional sports teams have been “athletic organizations comprising
talented, expert players hired by club owners, whose revenues originally derived from admission
fees charged to spectators seeing games.” These teams have also usually been members of a league
that schedules a championship season. For example, the National Association of Professional Base
Ball Players, founded in the United States in 1871, was the first organized professional sports
league, from which the Major League Baseball (MLB) was later established (Riess 2017).
Professional sports teams, as opposed to amateur sports teams, are undoubtedly for-profit
business operators. Nowadays, teams not only generate massive streams of revenue from gate
receipts, but also rely on selling products such as broadcasting and media rights, sponsorship rights,
and merchandise. In order to facilitate their business, teams employ management, staff members,
coaches, and expert players requiring immense payroll expenses. Moreover, sports teams own
large PP&E assets on their balance sheet including items such as stadia and training facilities that
require substantial capital expenditure. The professional sports industry is by no means small. For
example, having averaged a 5.5 percent compound annual growth rate in the past five years and
still considered to be in its growth stage, the U.S. sports franchises industry in 2019 is estimated
to be $37.9 billion in revenue, of which $22.6 billion is spent on wages (Lombardo 2019).
Meanwhile, the European football market was estimated to be worth €25.5 billion in 2018 (Barnard,
Dwyer and Winn 2018).
The English Premier League (EPL) provides a great example of modern sports teams’ rapid
growth and increasing capital needs. According to Deloitte’s analysis (Barnard, Dwyer and Winn
2018), during the 2016-17 season, the 20 clubs in the league generated a record aggregate revenue
of £4,552 million, which is translated into an average revenue of £228 million per club. Of the 20

2
clubs’ operations during the season, wage costs alone were £2,487million, which constitutes 55
percent of aggregate revenue. These wage costs have also been rising at a rapid rate historically,
increasing approximately 9 percent just from the 2015-16 to 2016-17 season. In fact, Chelsea F.C.
and Liverpool F.C. were the only two clubs that reduced their wage costs year-on-year. Regarding
capital expenditure, £395 million was spent by the EPL clubs in 2016-17, a massive increase of
£160 million from the previous season, implying 68 percent growth. While £221 million of the
£395 million was solely due to Tottenham Hotspur F.C. constructing their new stadium, even
excluding Tottenham Hotspur F.C., the year-on-year capital expenditure growth was still 13
percent, indicating robust redevelopment and expansion of the EPL clubs’ main pitches, retail
stores, and training ground facilities. Examining the average EPL stadium capacity over the past
20 years, this figure has increased from 32,386 in 1997-98 to 40,096 in 2017-18 season. All the
expenses considered, the EPL clubs generated a record aggregate operating profit of £1,034 million
in the 2016-17 season, more than double that reported in the 2015-16 season of £509 million.
However, the EPL is only ranked fourth in the list of world professional sports leagues by
revenue ("List Of Professional Sports Leagues By Revenue" 2019). The National Football League
(NFL), MLB, and the National Basketball Association (NBA) grossed much greater revenue than
the EPL in the order mentioned; in fact, the NFL’s aggregate revenue was more than double that
of the EPL. Besides, at least 28 professional sports leagues globally have surpassed $500 million
of annual revenue during the 2016-17 season.
The above points illustrate that it would be fair to assume that a number of professional
sports teams across various leagues must face some degree of capital raising needs for successful
company operations. When traditional firms are faced with financing needs, they mainly resort to
two different types of capital: debt and equity. The most common types of debt capital involve: 1)

3
firms borrowing term loans or revolving credit loans from banks, which may or may not require a
specified repayment schedule with either a fixed or floating interest rate, or 2) firms issuing debt
securities such as bonds, commercial paper, or convertible bonds to either retail or institutional
investors, which require principal payment upon maturity and again may or may not require regular
coupon payments (Nemecek and Glassman 2019). On the other hand, equity capital is generated
by the sale of shares, either common stock or preferred equity, which represent ownership of a
firm. One specific way in which firms access equity capital is by listing the firm on a public
exchange, allowing any investor the opportunity to purchase a share of the ownership in the firm.
This process of firms undertaking change in ownership from a private entity to the general public
is called Initial Public Offering (IPO) (Hashimzade 2017).
The route from private to public ownership via an IPO has been a common practice for the
general business landscape starting from the creation of the Dutch East India Company in 1602
(Kyriazis and Metaxas 2011). In the United States alone, about 3,600 firms were listed on the stock
exchanges at the end of 2017 (Bloomberg Opinion Editorial Board 2018). There has also been a
total of 8,497 IPOs from 1980 to 2018 in the United States (Ritter 2019).
However, this process seems far less common in the case of professional sports teams. In
the case of American sports, the Green Bay Packers is currently the only single team that is the
closest to a typical “stock market team,” meaning that the revenue and profits generated by the
team are the primary source of the topline for the public corporation that owns the team. However,
the Green Bay Packers’ shares do not confer any of the advantages of a traditional stock and acts
more as a “collectible item” as they do not pay any dividends, do not benefit from earnings, are
not tradeable on a public exchange, and have no securities-law protection (Saunders 2012).
Therefore, it would be fair to conclude that currently the NFL, MLB, NBA, and the National

4
Hockey League (NHL) all have no teams which are themselves publicly traded. There are indeed
a few teams that have public market exposure via their ownership by publicly traded parent
corporations, such as the New York Rangers (owned by Madison Square Garden Company),
Toronto Maple Leafs (Rogers Communications, BCE), and Montreal Canadiens (BCE) from the
NHL, the New York Knicks (Madison Square Garden) and Toronto Raptors (Rogers
Communications, BCE) from the NBA, and the Atlanta Braves (Liberty Media Corporation) and
Toronto Blue Jays (Rogers Communications) from the MLB ("List Of Publicly Traded Sports
Teams" 2019). Nonetheless, these teams are owned by parent companies whose core businesses
consist of non-sports related activities. This lack of stock market teams in the major leagues is
surprising considering that the four major leagues in the United States have 123 teams total and
are among the top five professional sports leagues by revenue in the world; the NHL is ranked fifth
after the EPL.
Rarity of IPOs in the sports industry also seem to be prevalent in Europe, where association
football is incomparably the most dominant type of sports. For example, the STOXX Europe
Football Index, which covers all football clubs listed on a stock exchange in Europe, Eastern
Europe, Turkey, or the EU-enlarged region, suggests that out of all the European football leagues
there are only 22 clubs being publicly traded as of today ("STOXX Digital | STOXX® Europe
Football" 2019). This number is considerably low given that, according to the UEFA Country
Coefficients system, there are currently 55 member countries, in which exists at least one
professional football league; a number of countries also have several lower division leagues
("Member Associations - UEFA Coefficients - Country Coefficients" 2019). Furthermore,
empirical analysis suggests that the popularity of public listing for European football clubs has
historically been dwindling. Table 1 (in the appendix) shows the year-by-year count of the index

5
components in the STOXX Europe Football Index from 2002 to 2019.1 It can be seen that in 2002
there was a total of 34 stock market teams in the index, whereas in 2019 this number decreased to
22. Moreover, Figure 1 demonstrates that there is an overall declining trend in the index
components count over the 18 years of observation.
Historically speaking, the number of stock market teams in North America has been even
further lower than that in Europe. Only a handful of North American major league sports teams
have in the past directly listed on a public exchange, and these were subsequently delisted within
a short time frame. These teams include the Boston Celtics of the NBA, the Cleveland Indians of
the MLB, and the Florida Panthers and the Vancouver Canucks of the NHL.2 Stock for the Boston
Celtics Limited Partnership began trading on the New York Stock Exchange under the ticker
symbol BOS starting in late 1986. Its $360 million sale to a local investor group in 2002 ended the
franchise’s 16-year stint as a stock market team – the last major independently-owned American
public sports franchise. Having gone public at $18.5 per share, its shares were bought out at $27
per share (Willoughby 2019). The Cleveland Indians’ stock was publicly traded under the ticker
symbol CLEV on the NASDAQ Stock Market for approximately just two years, from June 30,
1998 to January 1, 2000; it was the first and to-this-day the last professional baseball team to go
public. Raising $60 million by selling four million shares of stock at an initial offering price of
$15 per share, the Indians were sold to a private investor in 2000 for $320 million at $22.6 per
share (Schaffer 2006). Meanwhile, the Florida Panthers became a publicly traded company on
November 31, 1996, under the ticker symbol PUCK. The IPO on NASDAQ raised approximately
$66 million, which was used primarily for debt paydown and working capital needs. However,
barely a month after the public offering, the team’s primary owner, multibillionaire H. Wayne
Huizenga, took steps to transform the business into a “diversified leisure time-based sports and

6
entertainment company.” By 1998, hockey accounted for only about 10 percent of the company,
no longer qualifying it as a stock market team, and even the company’s name was changed to Boca
Resorts, Inc. The Panthers were officially sold in 2001 and since then the team has been in private
hands (Cheffins 1999). Lastly, Vancouver Canucks were at a point traded as Northwest Sports
Enterprises on the Vancouver Stock Exchange. Given the fact that Northwest Sports was almost
entirely controlled by a privately held corporation owned by John McCaw of Seattle, the Canucks
can thus be considered to have been a stock market team (Cheffins 1999); just like the others, the
team is also currently privately owned.3 Asides from the four teams just mentioned, there were
certainly a number of other professional sports franchises in North America that were historically
owned by a publicly quoted corporation, making only a minor contribution to the parent company’s
financial performance (Cheffins 1999).4 However, the fact remains that there have only been four
stock market teams in the history of North American major sports leagues.
As both current and historical analyses of professional sports team IPO suggest a distinct
lack of its popularity across various leagues, this study attempts to answer the question “why are
sports team IPOs uncommon?” in a comprehensive and academically validated manner utilizing
both qualitative and quantitative analysis based on empirical data. This paper hypothesizes that
professional sports teams do not benefit from a stock market listing, prompting private sports team
owners to not take their teams public. This hypothesis is then tested through three main lenses: 1)
managerial disincentives, 2) operational disincentives, and 3) financial disincentives.
For the purpose of this thesis, managerial disincentives of a sports team IPO refer to any
impediment in the “organization and coordination of the activities of a business in order to achieve
defined objectives ("Management" 2018).” The study acknowledges that sports team owners may
have two differing motives: win-maximization (running the team to maximize success for a given

7
level of profits or losses) and profit-maximization (running the team to maximize returns to its
owners) (Kesenne 2008). Therefore, this paper relies on a detailed literature review along with
case studies of precedent professional sports team IPOs to address the managerial pros and cons
of an IPO for achieving both types of objectives for owners across different sports leagues. In other
words, the analysis of managerial disincentives focuses on any procedural hurdles related to both
optimizing each team’s match performance and maximizing owners’ returns through long-term
and short-term financial planning and the implementation of various strategies in areas such as
funding, investing, cost control, and corporate governance.
Meanwhile, the analysis of operational disincentives directly addresses whether an IPO had
a tangible impact on the sports team’s match performance – to see if stock market listing translated
into winning more matches. In that sense, a successful sports team operation in this paper is defined
as securing a winning match performance. Given the relatively much larger sample size, this study
analyzes a unique dataset consisting of European football clubs’ domestic match results pre- and
post-IPO. The clubs analyzed include those that are still currently being traded per the STOXX
Europe Football Index as well as those that used to be public but have delisted. This study thus
extends the work by Baur and McKeating; their research examined the effects of an IPO on the
domestic and international match performance of all publicly listed football clubs as of 2011 – not
those that had delisted, however (Baur and McKeating 2011).
Lastly, the analysis of financial disincentives directly examines whether an IPO had a
material impact on the sports team’s financial statements. This is an area where the study
contributes most uniquely to the literature by analyzing various pre- and post-IPO financial metrics
of the same sample of European football clubs used for the operational disincentives analysis. The
balance sheet metrics examined include assets, liabilities, current assets, current liabilities, and

8
player registration rights, whereas the income statement metrics examined include revenue and net
income. Using these metrics, the paper also further analyzes pre- and post-IPO financial ratios
such as debt ratio, current ratio, player registration rights/assets, player registration rights/revenue,
return on assets, and net margin.
The existing literature and empirical analyses suggest that there are several managerial
disincentives that may outweigh the advantages, most notably including limitations in managerial
freedom due to the additionally imposed financial discipline followed by an IPO, impacting
investment decisions such as acquiring new players (Russell 1997) and potentially negatively
affecting owners’ motives of win-maximization and even long-term profit-maximization. This
lack of flexibility is exacerbated by a mismatch in incentives given the typical profile of a
professional sports team owner. The results of a statistical analysis on operational disincentives
suggest that, contrary to Baur and McKeating’s finding that most clubs – except lower division
clubs – perform worse after the IPO (Baur and McKeating 2011), with regard to the study’s total
sample population, which includes delisted teams, there is a statistically significant positive
relationship between pre- and post-IPO average points won per game in domestic league. However,
the coefficient is quite small and thus the practical magnitude of the impact of an IPO to the team’s
performance can be considered marginal. With regard to the analysis of financial disincentives,
the size of major balance sheet line items all increased after the IPO, although this may be due to
the obvious additional capital raised through an IPO, the general growth of the European football
industry in the 1990s and 2000s, and nominal inflation. Interestingly, net income on the income
statement decreased post-IPO. Nevertheless, the more important and “real” ratio analysis – it
removes the nominal impact of the general industry growth and inflation – suggests that there is

9
in fact a significant reduction in the debt ratio post-IPO, whereas the other ratios did not observe
any material shift pre- and post-IPO.
Overall, these results may suggest that the raised funds through an IPO are primarily used
for balance sheet consolidation, primarily regarding debt reduction, and not for increased
investments in player acquisition, in accordance with the added financial discipline required by
the public markets. This may explain why net margin was not significantly impacted post-IPO.
Besides, the funds raised may not be sufficient to ensure a greater long-term match performance,
suggested by the marginal positive coefficient for the dependent variable of average points won
per game in domestic league. The statistical analyses backing the above points support similar
theoretical predictions made by Baur and McKeating (2011). In consequence, given the lack of
strong financial and operational incentives, along with the strong managerial disincentives, private
sports team owners may not find stock market listing as an attractive strategic alternative for capital
raising over debt financing.
The remainder of this paper progresses as follows: Section II reviews the relevant literature
and demonstrates that the paper’s findings are consistent with the existing theoretical predictions
as well as the empirical results reported for professional sports team IPOs. The section involves a
particularly extensive discussion on the topic of managerial disincentives, as the hypothesis that
managerial disadvantages outweigh the advantages is mainly addressed through literature review
and case studies. The findings also motivate the development of the hypotheses for operational
and financial disincentives. Section III describes the sample selection criteria and data collection
procedures. Section IV describes the econometric framework through which the statistical analyses
were executed. Section V presents the empirical results from the previous section’s model and

10
discusses their implications, while Section VI reviews the robustness of the results given the
limitations and mitigants. Section VII concludes the study.
II. Literature Review and Hypotheses Motivation
As mentioned in the previous section, there are several existing literatures that point out
the managerial disincentives regarding a sports team IPO. Stock market listing may hinder
facilitating win-maximization. Dave Russell (1997) suggests that the fiduciary duty public stock
market teams face to maximize returns for the shareholders may negatively affect a team’s
investment decisions regarding player capital expenditures, potentially leading to worse post-IPO
match performance. This limitation in the freedom to invest in expensive players may particularly
pose a substantial managerial challenge for professional sports teams as the existing literature
indicates that overinvestment does pay off in sports. Dietl, Franck, and Lang (2008) argue that
football clubs, along with all other sports teams, have a genuine incentive to overinvest, as there
is a strong correlation between talent investment and winning probability. That said, given this
“arms race” overinvestment environment, where teams try to out-invest their opponents, the added
financial scrutiny followed by an IPO and the changed governance structure may not be ideal for
maintaining a competitive advantage, negatively affecting teams’ decision to go public. It is also
important to note that the average profiles of team owners in most all sports leagues, including the
North American major leagues and the European football leagues, have been and still are ultra-
high-net-worth individuals, who may potentially view their teams as trophy assets ("List Of
Professional Sports Team Owners" 2019). Cheffins mentions that these individuals are often
attracted to sports team investments due the love of the game, publicity, ego gratification, or even
civic duty (Cheffins 1999). That said, their ownership motives may potentially lean more towards
win-maximization despite the costs, and the lack of managerial flexibility – especially regarding

11
aggressive talent investment – due to the fiduciary duty for the shareholders, may pose owners a
severe mismatch in incentives, substantially diminishing the attractiveness of an IPO. Indeed, the
need for a greater financial discipline following an IPO is real. Franck (2010) mentions that small
shareholders of football clubs benchmark the performance of their stock against alternative
investments in their portfolio and deteriorate the spending power of the club demanding a
competitive profit. Concerns surrounding control and shareholder activism can also be found in
other existing literature (Goode 2014).
Yet, even with the fiduciary duty, listing publicly may also hinder facilitating profit-
maximization. Franck (2010) argued that public football clubs ironically have inferior “capital
tapping and channeling” capabilities compared to privately owned football clubs. He said: “they
[football corporations] cannot mobilize money injections by wealthy individuals looking for
spillovers to other businesses, political and social acceptance, consumptive ownership, or access
to cash transactions with money laundering potential.” This alludes to the paper’s earlier prediction
that the ultra-high-net-worth sports team owners may be willing to win-maximize despite incurring
some financial losses. Meanwhile, an IPO may also entail risks for managerial instability given
firm value market exposure as well as the additional administrative costs. In the earlier section,
Table 1 and Figure 1 pointed out that with regard to European football, an industry where sports
team IPOs are relatively more common than in other sports industry, the popularity of sports team
IPOs have decreased over the past 18 years – 34 index constituents in 2002 to 22 in 2019. The
EPL had a huge impact in this downward trend, as can be seen from Table 3 in the later section.
In the case of British football clubs, 27 teams had listed stock by the mid-1990s as broadcast
revenues soared after the EPL was founded in 1992; owners wished to cash in on the suddenly
increased value of their assets. However, their selling shares to the public was widely deemed a

12
failed experiment. Most listed teams failed to pay dividends and their market value crashed. After
the global financial crisis in 2002, triggered by the dot-com bubble, the clubs’ share price fell even
further and numerous teams had their shares suspended given financial distress. Moreover, the
compliance costs under public company regulations exceeded £100,000 a year and many private
sports team investors were turned off. As a result, most of the football clubs exited out of the public
equity market in the early 2000s, and by 2012, only three British football clubs remained publicly
traded ("If At First You Don’t Succeed" 2012). Since then, clubs have continued to avoid the stock
market. Currently, there are only two British stock market clubs remaining: Manchester United
F.C. and Celtic F.C.
Delving further into the costs associated with an IPO, the yearly administrative costs of
being a public firm have to do mostly with working with certified accounting and law firms on the
back end to prepare and maintain filings and disclosure statements in compliance with government
regulatory entities such as the Securities and Exchange Commission. However, on the front end
dealing with the public, there are also costs associated with preparing annual shareholder meetings,
distributing materials to shareholders, and maintaining registry of shareholders (Schaffer 2006);
this was especially the case before the wide spread of digitization. While this may not be
particularly burdensome for traditional firms, the nature of sports stock has in the past made the
process especially time-consuming and expensive. As sports stock attracts not only the
experienced retail or institutional investors, but also numerous fans who view the stock as a
collectible item, public sports teams end up dealing with a large population of small shareholders.
For example, 90 percent of Boston Celtics shareholders owned 10 shares or less, and this increased
the administrative difficulties and costs (Lebowitz 1996). In 1997, the president of the Sacramento
Kings of the NBA considered a public share offering but decided not to pursue it, stating: “the

13
problem is you have 40,000 people each owning one share as souvenirs. The cost associated with
that would be incredible” (Delsohn 1997). Asides, there are also costs associated with initiating an
IPO, primarily attributed to the investment bankers who price, market, and sell the securities to the
general public (Schneider, Manko and Kant 1981). One study states that the total initiating
expenses of carrying out an IPO can cost around 15 percent of the capital actually generated
(Kratofil 1999). For example, the Cleveland Indians IPO raised $60 million from the equity sale
but incurred $6.2 million in the process, which is a little over 10 percent of the capital raised and
is still quite significant (Kadlec 1998). Lastly, there may be non-monetary opportunity costs
involved with an IPO process, such as the time commitment the key personnel of the team will
have to attribute to the sale of stock. As executives spend much time working with accountants,
lawyers, and financial advisors throughout the IPO process – often taking at least three or even
more than six months – they may have less opportunity to engage in the day-to-day management
responsibilities, possibly hurting the short-term company operations and putting it at a competitive
disadvantage (Schaffer 2006).
Specific to the North American sports environment, Cheffins also observed that teams may
have less need to rely on an IPO than their European counterparts because they require less “one-
off” cash outlays to acquire players; this is due to North American sports teams’ reliance on trades
(player-for-player exchanges), farm clubs (minor league teams that specialize in developing
players), player drafts, and salary cap (Cheffins 1999). Furthermore, Cheffins also mentions that
sometimes league policies and officials make it extremely difficult or unrealistic for the
management to pursue an IPO. In the case of the NFL, for example, there is an uncodified policy
prohibiting public offerings of shares in the NFL teams. The NFL Constitution also prohibits
corporate ownership of franchises and stipulates that three-quarters of the league’s owners approve

14
transfers of ownership interests in a team. For example, William Sullivan, former owner of the
NFL’s New England Patriots, gave up his plans to make the team public and sold it privately in
1988 due to the league’s opposition; the NFL stands out as being particularly firmly opposed to
public ownership of teams than the other three major leagues (Cheffins 1999). The above reasons
may be why there have historically been only four stock market teams in North America, as
discussed in the previous section. Similarly, in Europe, Germany used to require a football club to
operate as a sports association as opposed to a “full-fledge company,” prohibiting various teams
from listing on the stock market until the regulations were a bit relaxed in 1998 (Bologna 1998).
Still, the German Bundesliga is famous for its “50+1 rule” that prevents commercial investors to
have more than a 49 percent stake ("German Soccer Rules: 50+1 Explained" 2019).
While the above points illustrate the various managerial disincentives associated with a
sports team IPO, certain positives do exist as well. Cheffins points out that financing construction
activity can be a reason why professional sports teams may sell stock to the public (Cheffins 1999).
For example, in the mid-1990s, a number of auto racing companies operating speedways relied on
the equity market to use the proceeds to finance track expansions and new speedways (Rayner).
While this may be a consideration for European football clubs that own their own stadiums and
thus are financially responsible for upgrading the facilities themselves, it does not seem to affect
North American professional sports franchises. This is because the major league franchises receive
the help of taxpayers for building or renovating sports facilities; cities compete for retaining
professional sports teams locally for various positive externalities and in turn offer government
subsidies (Palomo 1997). For example, during the twentieth century, approximately $20 billion
was spent on sports stadiums or arenas, and nearly $15 billion of this amount was funded by
government subsidies (Keating 1999). Nonetheless, Cheffins mentions that the funds raised

15
through an IPO may also serve other purposes such as purchase of playing staff, expansion into
new areas of activity through acquisition – like the Florida Panthers, as mentioned in the previous
section – or even creating an exit option given the greater liquidity public equity provides.
However, Cheffins acknowledges that the creation of an exit option may not be enough of a
catalyst for professional sports team owners, given the healthy buy-side demand from wealthy and
successful individuals, who are eager to invest in sports teams as they become available.
Moving on to the literature review of operational disincentives regarding an IPO’s impact
on sports teams’ match performance, the study conducted by Baur and McKeating puts a particular
emphasis on testing whether a stock market listing benefits European football clubs with regard to
their on-pitch performance (Baur and McKeating 2011). Their sample population was all publicly
listed football clubs as of 2011, and they analyzed the clubs’ domestic league and international
UEFA competition match results pre- and post-IPO. Their study concludes that European football
clubs generally do not benefit from a stock market listing. Most clubs performed slightly worse
after the IPO in their home league, while only the lower division clubs, especially those in larger
leagues, benefited from a listing. At the international level, nether lower nor higher division clubs
observed any material post-IPO on-pitch performance improvements. As Baur and McKeating’s
study took place eight years ago, this paper attempts to strengthen the robustness of the analysis
by incorporating the latest data available. Additionally, Baur and McKeating’s study looked at
only the clubs that were then-currently trading, without including those that had once been public
but had delisted for one reason or another; this may have resulted in the introduction of
survivorship bias. Therefore, this study aims to retest the hypothesis that football clubs perform
better in the domestic league after an IPO than before. A similar retest was not executed for the

16
hypothesis that football clubs perform better in international competition after an IPO than before,
however.
Finally, the existing literature on financial disincentives regarding an IPO’s impact on
sports teams’ financial statements seems to be extremely limited. This is the case because financial
measures are difficult to obtain for sports teams pre-IPO; the information is especially unavailable
for the North American major league teams, whereas the data can still be rigorously obtained for
some European football clubs. Most of the existing studies instead address the stock price
movement of sports teams post-IPO. Baur and McKeating analyzed that the stock prices of
publicly listed European football clubs are correlated with their domestic league and international
competition match performance (Baur and McKeating 2011). Another research by Hubman
demonstrates that sports team stocks still provide opportunities for investors to realize capital gains,
although these stocks are very volatile and risky investments (Hubman 2011). He also states that
sports team stocks tend to have a very low correlation to the general market and may even move
in the opposite direction, allowing for diversification opportunities for investors. However, no
existing literature that directly compares pre- and post-IPO financial metrics for professional sports
teams could be found. Hence, this is an area this paper attempts to contribute the most uniquely to
the scholarly community.
For the above reasons, the main null hypothesis this paper attempts to refute is that
professional sports teams benefit from a stock market listing. Asides from the literature review and
empirical analysis for the managerial disincentives, this study formulates two more specific null
hypotheses regarding operational and financial disincentives derived from the main hypothesis.
The first hypothesis focuses on the domestic on-pitch performance of a football club before and
after the IPO, while the second hypothesis analyzes various financial metrics and ratios of a
17
football club before and after the IPO. Given the strong managerial disincentives, should the
differences between pre- and post-IPO for operational and financial measures be statistically
insignificant or significant for worse, then the main alternative hypothesis that professional sports
teams do not benefit from a stock market listing would hold true.
III. Sample Selection Criteria and Data Collection Procedures
This paper’s sample consists of European football clubs that are currently being publicly
traded as well as football clubs that used to be on the stock markets but have since then delisted.
Those that are still public include the 22 listed football clubs quoted on the STOXX Europe
Football Index as of May 3, 2019 plus Manchester United PLC, which is now traded on the New
York Stock Exchange, leading to a total sub-sample population of 23 clubs. The football clubs that
are no longer public include 20 clubs that used to comprise the STOXX Europe Football Index
after its inception in 2002 but have since then delisted; the information on public football clubs
that have delisted prior to 2002 has not been incorporated, however. Therefore, the total sample
population consists of 43 European football clubs, for which the detailed information can be found
in Tables 2 and 3.5 The earliest listing in the sample is Tottenham Hotspur F.C., which was the
first football club to list on the London Stock Exchange in 1983 (Andreff and Szymanski 2013).6
The latest club to IPO is Manchester United PLC, which listed on the New York Stock Exchange
in 2012 under the ownership of the American billionaire Glazer family (Farrell and Pagliery
2012).7 The information in Tables 2 and 3 including each club’s ticker symbol, IPO date, delist
year (when applicable), and whether the club experienced a promotion or relegation during the
observed time frame, was gathered primarily using press releases and the Bloomberg Terminal.
While the entire sample population could be divided into listed and delisted European
football clubs, for a further cross-sectional analysis, another binary categorization regarding

18
country size (in football terms) was undertaken based on the country in which a club operates. This
categorization was based on the rankings provided in the UEFA Country Coefficients system as
of May 3, 2019.8 As Table 4 suggests, clubs that operate in either Spain, England, Italy, Germany,
or France are thus considered to have operated in “large” countries; of the 43 clubs studied in this
paper, 20 clubs qualified for the large-country status. Note that football clubs, such as Preston
North End F.C., that may have played in second or third division leagues, as opposed to the
country’s top-flight division are still considered to have operated in a large country under this
system, bucketed with other teams from the EPL. Here, a country-based categorization of clubs
was favored over a division-based categorization, given the issue of promotion and relegation a
number of clubs in the sample population experienced during the observed timeframe.9
In order to test the first hypothesis regarding operational disincentives, the year-by-year
domestic league performance measures (average points won per game) were collected for the
period of five years both pre- and post-IPO for each club in the sample population. Excluding the
data from the year of IPO, which was not included in the statistical analysis, this resulted in 10
observations per club through time. The average points won per game for the year of IPO was
excluded mainly because the IPO oftentimes occurred in the middle of the season, making the
data’s pre- and post-IPO categorization ambiguous. Moreover, as Tables 2 and 3 suggest, a number
of clubs experienced either a promotion or relegation during the observed timeframe, per the
common practices of European football league system.10 As this skews the domestic performance
data due to these clubs competing at a lower or higher level, this study undertook data
normalization by applying a common multiple to the average points won per game during the
affected seasons. This multiple was calculated by averaging the post-promotion point deflation
rate and the inverse of post-relegation point inflation rate from each of the promotions and

19
relegations observed for the sample population; there were 18 promotions and 10 relegations in
total. The multiple equaled 0.65x, implying that this paper considered a single point won in one
division to be worth the same as 0.65 point won in the division one-level superior; vice versa, this
also implies that a single point won in one division is worth 1.54 points won in the division one-
level inferior. Table 5 illustrates the multiple calculation. For the statistical analysis, both the non-
normalized and normalized observations for average points won per game for the sample
population were examined. Both the domestic results data as well as the promotion and relegation
information for the sample population were obtained from Rec.Sports.Soccer Statistics Foundation.
Finally, in order to test the second hypothesis regarding financial disincentives, various
year-by-year financial metrics and ratios were collected for the period of five years both pre- and
post-IPO for each club in the sample population. Due to data unavailability, however, not all of
these metrics and ratios could be collected for all the sample population during the observed time
frame. Excluding the data from the year of IPO for the same reason in the previous paragraph, data
permitting, this again resulted in 10 observations per club through time for each financial metric
and ratio. The balance sheet empirical constructs collected include assets, liabilities, current assets,
current liabilities, and player registration rights, whereas the income statement empirical constructs
examined include revenue and net income. The player registration rights metric was examined to
understand the relationship between a football club IPO and talent acquisition-related capital
expenditures. In the case when this figure was not specified, player transfer fees payable, total
intangible assets, or net purchase of player registrations in the Cash Flow from Investing was used
as a proxy.11 However, all the metrics observed within each club were held as constant as possible.
Using the financial metrics, various pre- and post-IPO financial ratios such as debt ratio, current
ratio, player registration rights/assets, player registration rights/revenue, return on assets, and net

20
margin were then calculated; debt ratio is liabilities/assets, current ratio is current assets/current
liabilities, return on assets is net income/assets, and net margin is net income/revenue. For the non-
British clubs, the various financial metrics were collected using company websites and the
Bloomberg Terminal. For the British clubs, the metrics were collected directly from Companies
House, an executive agency sponsored by the U.K. government. Besides, the currency used for all
the financial figures have been standardized to the U.K. pound sterling in millions for a better
coefficient analysis in the paper’s statistical regression model, which will be explained in further
detail in the next section. The exchange rate for each observation’s corresponding year was based
on the December 31st last sale price provided by the S&P Capital IQ.
IV. Econometric Framework
The main null hypothesis is that professional sports teams benefit from a stock market
listing. While the null hypothesis in a typical statistical test often implies that there is no significant
difference between specified populations – a zero effect – this is not always the case; the “null” in
null hypothesis derives from the word “nullify” (Van den Brink and Koele 2002). Therefore, the
above main null hypothesis is the precise statement this paper attempts to reject with sample data.
From this were derived two more specific null hypotheses regarding operational and financial
disincentives, as mentioned at the end of Section II. These two hypotheses can be found below. As
the literature review and case studies of precedent professional sports team IPOs suggest the
presence of strong managerial disincentives, should the alternative hypotheses regarding
operational and financial disincentives hold true, then can be concluded that professional sports
teams do not benefit from a stock market listing.
Hypothesis 1 (Operational): There is an improvement in the football clubs’ domestic
league match performance after the listing (IPO) than before the listing.

21
Hypothesis 2 (Financial): There is an improvement in the football clubs’ financial
statements after the listing (IPO) than before the listing.
Given these hypotheses, this paper specifies the following (panel-data) regression model.
𝐷𝑒𝑝𝑒𝑛𝑑𝑒𝑛𝑡 𝑉𝑎𝑟𝑖𝑎𝑏𝑙𝑒𝑖,𝑡
= 𝛼𝑖 + 𝛽1𝐼𝑃𝑂𝑖,𝑡 + 𝛽2𝐿𝑖𝑠𝑡𝑒𝑑𝑖,𝑡 + 𝛽3𝐼𝑃𝑂 × 𝐿𝑖𝑠𝑡𝑒𝑑 + 𝛽4𝐶𝑜𝑢𝑛𝑡𝑟𝑦 𝑆𝑖𝑧𝑒𝑖,𝑡
+ 𝛽5𝐼𝑃𝑂 × 𝐶𝑜𝑢𝑛𝑡𝑟𝑦 𝑆𝑖𝑧𝑒 + 𝜀𝑖,𝑡
The dependent variable for hypothesis 1 is a domestic performance measure – non-
normalized average points won per game and normalized averaged points won per game. The
dependent variable for hypothesis 2 is a financial performance measure – assets, liabilities, current
assets, current liabilities, player registration rights, revenue, net income, debt ratio, current ratio,
player registration rights/assets, player registration rights/revenue, return on assets, and net margin.
Each dependent variable is for football club (i) in year (t). IPO is a dummy variable that is one if
the club is public (after the IPO) and zero if the club is private (before the IPO); this indicates that
no data from the IPO year was included in the statistical analyses for any club. Listed is a dummy
variable that is one if the club is still being traded (currently listed) and zero if the club is no longer
traded (currently delisted), and Country Size is a dummy variable that is one if the club operates
in a large country in football terms (Spain, England, Italy, Germany, or France) and zero if the
club operates elsewhere (Portugal, Turkey, Netherlands, Denmark, Scotland, Sweden, and Poland
for the sample population). The matrix IPO × Listed consists of interaction effects of the IPO
dummy (IPO) and the Listed dummy (Listed) for the currently listed and delisted clubs. The
interaction effects are included to assess the role of a club’s current listing status in the differences
in its dependent variables pre- and post-IPO. The matrix IPO × Country Size consists of interaction
22
effects of the IPO dummy (IPO) and the Country Size dummy (Country Size) for the large and
small-country clubs. The interaction effects are included to assess the role of the size of the country
(in football terms) a club plays in and the differences in its dependent variables pre- and post-IPO.
The error term is given by ε. The parameters to estimate are α, β1, β2, β3, β4, and β5. The parameter
α is a club-specific parameter (hence the subscript i), while the other parameters are estimated for
all clubs.
Club-specific characteristics such as the size of a club are not included explicitly, as they
are accounted for implicitly through the use of a panel model which controls for unobserved (club-
specific) heterogeneity. The regression model is estimated with the fixed-effects estimator.
Furthermore, given that the dependent variable in the above equation is an implicit measure of
relative operational or financial performance within each club both pre- and post-IPO, that is, the
measure itself controls for the presence of non-public football clubs, the study has not included
any private football clubs as a control sample in the analyses. Besides, acquiring an adequate
comparable control club for each public club in the study’s sample would be too difficult,
especially given that the club characteristics change over the observed time frame.
V. Empirical Results
This section presents and illustrates the estimation results of the (panel-data) regression
model specified above for the two hypotheses. As Tables 6, 7, and 8 suggest, three main analyses
were performed by utilizing various specifications of the model. These tables provide the
coefficient estimate, p-value significance, and t-statistic for each dependent variable and
specification. Under each analysis, the corresponding number of observations and R2 for each
dependent variable are also shown. The analyses were performed using SAS (Statistical Analysis
System).

23
Looking at the normalized average points won per game variable, Table 6 indicates that
clubs that listed increased their average points per game in their domestic league by 0.078 points.
In a season of 38 games, which is the case for many European football leagues including those in
Spain, England, Italy, Germany, and France, this implies additional 2.964 points earned in one
season. This is then translated as one additional win or three additional draws per football club
compared to a loss or three losses in previous seasons, respectively. Strictly speaking, this result
suggests that the null hypothesis 1 regarding operational disincentives cannot be rejected, as in
there is an improvement in the football clubs’ domestic league match performance post-IPO than
pre-IPO. However, the coefficient is still quite small, and thus it could be argued that the practical
magnitude of the impact of an IPO to the team’s domestic league performance is marginal.
Although, for a season such as the 2018-19 EPL, in which two clubs, Liverpool F.C. (94 total
points) and Manchester City F.C. (95 total points), fiercely contend for the league title with just
the 38th round remaining as of this writing, the coefficient of 0.078 carries a much greater weight.12
Nevertheless, given the strong managerial disincentives identified in Section II, the finding’s
overall impact to a professional sports team owner’s evaluation of the attractiveness of an IPO may
still be considered likely marginal.
With regard to the financial variables, it can be observed in Table 6 that the size of all
balance sheet line items – assets, liabilities, current assets, current liabilities, and player registration
rights – as well as revenue increased after the IPO at the 1 percent significance level, indicating a
strong positive correlation. It is unclear, however, how much of this post-IPO growth is strictly
due to the stock market listing. The European football industry has overall grown rapidly in the
1990s and 2000s. There is also the possible nominal effect of inflation. Moreover, as additional
capital is obviously raised through an IPO, balance sheet growth is to be expected. However, it is

24
interesting to note that the net income variable has a slight negative coefficient of -2.716 at the 10
percent significance level, which indicates that clubs that listed saw a decrease in their profit by
£2.716 million – a potentially critical financial disincentive from the owner’s perspective. This
may possibly be explained by the existing literature, which identified post-IPO drop in firm
profitability across multiple industries (Pástor, Taylor and Veronesi 2009). As owners wish to
maximize returns when they sell their stake in the firm, they tend to initiate an IPO when the firm’s
prospects are poor. Similarly, football club owners may wish to maximize the capital raised by
undertaking an IPO when the club’s on-pitch and financial prospects are poor. Should a club have
a breakthrough season both operationally and financially, owners may deem it unrealistic to
forecast a sustained future success, given the various uncontrollable variables in sports such as
luck, competition, and even player injuries, thereby being more convinced to initiate an IPO that
season. In fact, according to Figure 2, which plots the study sample population’s mean of average
points won per game over time, football clubs did indeed earn the highest average points per game
in the year of IPO. Furthermore, according to Figure 3, which plots the study sample population’s
mean of various financial ratios over time, the financial health of a football club is also most ideal
in the year of IPO. These relations are uncannily consistent with the theoretical predictions outlined
by Pástor, Taylor, and Veronesi (2009).
On the other hand, the various ratio variables analyzed in Table 6 may offer a much greater
and real insight than just the balance sheet and net income line items, regarding an IPO’s impact
on the financial health of football clubs; a ratio removes the impact of the general industry growth
and inflation. It is important to note that the debt ratio decreased significantly at the 1 percent level
with a coefficient of -0.192. Whereas, the change in current ratio, player registration rights/revenue,
return on assets, and net margin all displayed insignificance. Player registration rights/assets,

25
although significant in the output, does not provide much valuable insight about capital
expenditure related to player acquisition given that the shift in the ratio pre- and post-IPO seems
to be mainly driven by the denominator. Upon examining the coefficients for assets (66.636),
player registration rights (23.886), and revenue (24.646), it can be determined that assets
significantly outgrew the other two after the listing. Overall, these results suggest that the raised
funds through an IPO are primarily used for balance sheet consolidation, primarily regarding debt
reduction, and not for increased investments in player acquisition. This may be due to the added
financial scrutiny post-IPO. Should public ownership imply greater financial discipline, money
raised in an IPO is more likely to be used to deleverage than to be invested in a risky and intangible
asset such as a player, a trend identified in existing literature for a sample of listed companies in
Italy at least (Pagano, Panetta and Zingales 1998). The popular use of IPO proceeds for debt
reduction can also be observed in precedent sports team IPOs. For example, when Manchester
United F.C. listed on the New York Stock Exchange in 2012, its primary motive was to pay down
debt. Included in the club’s prospectus is the statement: “we will use all of our net proceeds from
this offering to reduce our indebtedness…” (Manchester United plc 2012). Meanwhile, a stock
market listing seems to have had no, if not detrimental, impact on the sports team’s profitability,
which is further in line with the prediction that the raised capital was used mainly for balance sheet
consolidation. Lastly, the proceeds not having had much material impact on talent acquisition
could perhaps explain why the coefficient for the average points won per game variable was
marginal; an unchanged level of players would correspond with an unchanged performance result.
Considering the negative net income coefficient and putting emphasis on the ratio analysis, the
validity of the second null hypothesis seems to be weak, although again not completely refutable.
In summary, a stock market listing helps with a football club’s successful deleveraging although
26
it has no significant impact on other key financial ratios, and it may potentially harm the clubs’
bottom line.
Next, the specific model analyzed in Table 7 is 𝐷𝑒𝑝𝑒𝑛𝑑𝑒𝑛𝑡 𝑉𝑎𝑟𝑖𝑎𝑏𝑙𝑒𝑖,𝑡 = 𝛼𝑖 +
𝛽1𝐼𝑃𝑂𝑖,𝑡 + 𝛽2𝐿𝑖𝑠𝑡𝑒𝑑𝑖,𝑡 + 𝛽3𝐼𝑃𝑂 × 𝐿𝑖𝑠𝑡𝑒𝑑 + 𝜀𝑖,𝑡, which examines the effect of a football club’s
stock market listing on the various dependent variables, while factoring in each club’s current
listing status. The first column illustrates the relationship between pre- and post- IPO for only the
currently delisted clubs, whereas the second column illustrates the relationship between listed and
delisted clubs for only the pre-IPO time frame. Most importantly, the third column provides insight
as to whether there was a significant difference between clubs that are currently listed and delisted
with regard to their changes in the dependent variables pre- and post-IPO. This study focuses on
the analysis of the interaction effects – the third column.
With regard to the operational variables, no significant interactions were observed; an IPO
essentially had the same level of operational impact on the listed and delisted clubs. All the
financial metrics exhibited significant interaction effects, however. Assets, liabilities, current
assets, current liabilities, and player registration rights exhibited positive coefficients, implying
that the pre-and post-IPO increases in these metrics were all greater for the currently listed clubs
compared to those that had delisted. There may be an inherent look-ahead bias because the clubs
in the sample population were classified based on their listings as of this writing. Yet, these
financial interaction effects may be explained by the fact that the list of currently public clubs
consists of a much greater number of “perennial top-flight division clubs.” The last column in
Tables 2 and 3 demonstrates that only three of 23 currently listed clubs experienced either a
promotion or relegation, whereas 11 of 20 delisted clubs experienced either a promotion or
relegation during the observed time frame of -5 and +5 years from the IPO (excluding the IPO

27
year). Because the currently listed clubs boasted superior match performance stability during the
observed time frame and were more consistently playing in the top-flight division, the amount of
proceeds raised from the IPO as well as the organic company growth they experienced may have
been greater, hence the interaction effects for the balance sheet line items. Ironically, the currently
listed clubs experienced a greater decrease in net income pre- and post- IPO compared to the
delisted clubs, given the negative coefficient of -6.338 at the 5 percent significance level. This then
translated to negative coefficients for also the dependent variables of return on assets and net
margin. The currently listed clubs incurred a greater loss in profitability post-IPO than the delisted
clubs. However, the interaction effects for player registration rights/assets and player registration
rights/revenue seem to indicate that the listed clubs also spent relatively more on player acquisition;
the coefficient for the player registration rights variable is also noticeably large at 57.641. This
indication of potential overinvestment on players may be the reason why the listed clubs were less
profitable; this may also explain why these clubs had better competitive advantage to enjoy a
greater match performance stability, managing to survive in the top-flight division. Meanwhile,
note that the debt ratio still does not involve a material interaction effect. That said, the implication
could be that the currently listed clubs raised greater IPO proceeds than the delisted clubs. The
amount raised may have been sufficient for the listed clubs to invest in talent acquisition as
spillover in addition to deleveraging. Whereas, the delisted clubs may only have raised enough to
successfully deleverage.
Lastly, the specific model analyzed in Table 8 is 𝐷𝑒𝑝𝑒𝑛𝑑𝑒𝑛𝑡 𝑉𝑎𝑟𝑖𝑎𝑏𝑙𝑒𝑖,𝑡 = 𝛼𝑖 +
𝛽1𝐼𝑃𝑂𝑖,𝑡 + 𝛽4𝐶𝑜𝑢𝑛𝑡𝑟𝑦 𝑆𝑖𝑧𝑒𝑖,𝑡 + 𝛽5𝐼𝑃𝑂 × 𝐶𝑜𝑢𝑛𝑡𝑟𝑦 𝑆𝑖𝑧𝑒 + 𝜀𝑖,𝑡 , which examines the effect of a
football club’s stock market listing on the various dependent variables, while factoring in each

28
club’s country size in football terms. The structure of Table 8 is the same as that of Table 7. Again,
this study focuses on the analysis of the interaction effects – the third column.
Similar to the club’s current listing status, country size in football terms did not exhibit any
interaction effects regarding the differences in the operational variables pre- and post-IPO; an IPO
essentially had the same level of operational impact on football clubs regardless of which country
they are from. However, should a club operate in a “large country” per Table 4 – Spain, England,
Italy, Germany, or France – it experienced a significantly larger pre- and post-IPO increases in
assets, current assets, player registration rights, and revenue; the coefficient of current liabilities
(0.639) is not as big despite also exhibiting a significant positive correlation. A club operating in
a “large country” may likely have been able to raise more substantial IPO proceeds. This finding
seems to be reasonable given that a greater amount of capital in the football market is concentrated
in the above five countries, which are home to Europe’s five largest and most successful leagues
– La Liga, EPL, Serie A, Bundesliga, and Ligue 1 – hence the strong UEFA Country Coefficients
per Table 4. This may also be a reason why clubs operating in a “large country” experienced greater
pre- and post-IPO increases in return on assets and net margin than those operating in a “small
country.” It is still interesting to note that net income did not exhibit any material interaction effect
despite the robust positive coefficients and significance for assets and revenue variables. Further
research may explore how “large country” clubs, in addition to expanding their balance sheets,
managed to improve their profitability margins. Lastly, the fact that the debt ratio did not involve
any interaction effect may again suggest that deleveraging is a top priority for football clubs
regardless of the country they operate in; clubs make sure to raise enough IPO proceeds to at least
successfully deleverage.
29
VI. Limitations and Mitigants
There are a few limitations that may challenge the robustness of the results of this study.
A major limitation arises from the fact that the paper attempts to generalize the operational and
financial findings from its sample population of European football clubs to the overall sports
industry, including leagues that may be based in other geographical regions or focused on other
sports types. However, note that the review of managerial disincentives through the existing
literature and case studies of precedent professional sports team IPOs include the North American
major league sports teams; the managerial disincentives are still considered when evaluating the
validity of the study’s main null hypothesis of whether professional sports teams benefit from a
stock market listing. Moreover, the vast majority of historical sports team IPOs across the globe
indeed only consist of European football clubs. Besides, pre-IPO financial data is not available for
the four North American teams that were historically publicly listed. Therefore, the study has
roughly captured the entirety of historical professional sports team IPOs despite the European- and
association football-concentrated sample population.
With regard to the sample data, for the operational disincentives analysis, international
match performance data may have been incorporated, similar to Baur and McKeating’s prior study
(Baur and McKeating 2011). However, the lack of this information does not undermine the study’s
finding on an IPO’s impact on the European football clubs’ domestic league performance.
Furthermore, a majority of clubs in the sample population did not qualify to compete in the
international UEFA competitions given their domestic league performance results, as the study
includes delisted clubs that were not perennially in the top-flight division. The study also
acknowledges that there were several financial data observations missing particularly for non-
British football clubs pre-IPO. Further research may aim to collect this privately available

30
information and incorporate it into analysis. Similarly, data observations from the IPOs of
European football clubs that delisted prior to 2002 may have been integrated to the study. While
this information was not available through the use of the STOXX Europe Football Index, the
number of these IPOs is expected to be minimal, likely having a marginal impact. Lastly, the data
used for the financial metrics – balance sheet and income statement line items – analyzed involve
the effects of the general football industry growth and inflation. While this was controlled for by
the additional analysis of various financial ratios, a separate set of financial metrics data that has
been normalized based on average inflation rate and European football industry growth rate during
the observed time frame may still have been utilized – another area further research may explore.
In terms of the econometric framework used, the study may have been more robust should
there have been a control sample of private football clubs. However, as discussed earlier in Section
IV, this is mitigated by the fact that the pre- and post-IPO measures analyzed within each club
themselves implicitly control for the presence of non-public football clubs. Furthermore, acquiring
an adequate comparable control club may be an arbitrary process. Finally, the cross-sectional
analysis based on the “Listed” variable may have involved an inherent look-ahead bias, as
mentioned in the previous section; the study grouped the football clubs based on whether they are
still listed today, which the clubs did not know at the time of IPO.
VII. Conclusions
This paper explored the question “why are sports team IPOs uncommon?” by attempting to
refute the main null hypothesis that professional sports teams benefit from a stock market listing.
Not only have professional sports team IPOs been historically uncommon across Europe and North
America, their popularity seemed to have further diminished over the years. The hypothesis was
31
tested through three main lenses: 1) managerial disincentives, 2) operational disincentives, and 3)
financial disincentives.
Reviewing the existing literature and case studies of precedent professional sports team IPOs
suggests a strong presence of managerial disincentives. As an IPO is followed by the demand for
a greater financial discipline, this induces several limitations in managerial freedom. Most notably,
overinvestment in talent acquisition may be discouraged, preventing owners from realizing win-
maximization and even long-term profit maximization. This is further exacerbated by a mismatch
in incentives given that the typical professional sports team owner is an ultra-high-net-worth
individual, likely leaning towards win-maximization as his or her main managerial motive. Other
managerial disincentives are also present, including inferior capital channeling capabilities, firm
value instability due to market exposure, high administrative and opportunity costs, as well as
league oppositions.
In addition to the strong managerial disincentives, this study finds that there is also a lack of
convincing operational incentives. Contrary to the existing literature (Baur and McKeating 2011),
there is a statistically significant positive correlation between pre- and post-IPO average points
won per game in domestic league; operational performance does improve. However, the
coefficient (0.078) is quite small and thus the practical magnitude of the impact of an IPO to the
team’s match performance and its attractiveness to a private owner can be considered marginal.
Whether a club is still listed or operating in a “large country” did not exhibit any interaction effects.
Furthermore, the financial disincentives analyses provide mixed results. Pursuing an IPO helps
a football club to successfully deleverage and potentially grow its balance sheet. However, it may
harm a club’s bottom line, while having no significant impact on the key financial ratios other than
the debt ratio. Overall, the main finding is that the IPO proceeds are primarily used for balance

32
sheet consolidation and not for increased investments in player acquisition. Another interesting
finding was that a football club seems more likely to IPO at the peak of its on-pitch and financial
performance when the future prospects are poor, perhaps similar to traditional firms. Besides, a
club that is currently listed or operating in a “large country” seem to have raised greater IPO
proceeds.
Everything considered, private sports team owners may not find stock market listing as an
attractive strategic alternative for capital raising over debt financing. While there is a lack of both
material operational and financial incentives, the strong managerial disincentives are still present.
The main null hypothesis could thus not be entirely rejected but its validity also seems weak.
Future research could investigate the net proceeds size of precedent professional sports team
IPOs and how exactly the raised capital was used by analyzing sports team filings comparable to
Form S-1. Moreover, further due diligence could be performed on understanding the decision
process of going public for the precedent professional sports team IPOs.
33
References
Andreff, Wladimir, and Stefan Szymanski. 2013. Handbook On The Economics Of Sport.
Cheltenham: Elgar.
Barnard, Michael, Matt Dwyer, and Christopher Winn. 2018. "Annual Review Of Football
Finance 2018". Deloitte. https://www2.deloitte.com/uk/en/pages/sports-business-
group/articles/annual-review-of-football-finance.html.
Baur, Dirk G., and Conor McKeating. 2011. "Do Football Clubs Benefit From Initial Public
Offerings?". International Journal Of Sport Finance 6 (1): 40-59.
https://proxy.library.upenn.edu/login?url=https://proxy.library.upenn.edu:2174/docview/863850
396?accountid=14707.
Bloomberg Opinion Editorial Board. 2018. "Where Have All The Public Companies
Gone?". Bloomberg.Com. https://www.bloomberg.com/opinion/articles/2018-04-09/where-have-
all-the-u-s-public-companies-gone.
Bologna, Stephanie A. 1998. "Funds Eye European Football As It Goes To Market". Int'l Money
Marketing, 34
Cheffins, B. R. 1999. “Playing the stock market: "going public and professional team
sports.” Journal of Corporation Law, 24(3), 641. Retrieved from
https://proxy.library.upenn.edu/login?url=https://proxy.library.upenn.edu:2174/docview/220756
179?accountid=14707
Delsohn, Gary. 1997. "Questions And Answers Surrounding The Kings' Existence In
Sacramento". Sacramento Bee, CI, 1997.
Dietl, Helmut M., Egon Franck, and Markus Lang. 2008. "OVERINVESTMENT IN TEAM
SPORTS LEAGUES: A CONTEST THEORY MODEL". Scottish Journal Of Political
Economy 55 (3): 353-368. doi:10.1111/j.1467-9485.2008.00457.x.
Farrell, Maureen, and Jose Pagliery. 2012. "Manchester United Raises $233 Million In
IPO". CNN Money, 2012. https://money.cnn.com/2012/08/09/investing/manchester-united-
ipo/index.htm.
Franck, Egon. 2010. "Private Firm, Public Corporation Or Member's Association Governance
Structures In European Football". International Journal Of Sport Finance 5 (2): 108-127.
Goode, Cassian. 2014. "The Opportunities And Issues For Sports Teams Considering An
IPO". Law In Sport. https://www.lawinsport.com/topics/articles/corporate-law/item/the-
opportunities-and-issues-for-sports-teams-considering-an-ipo.
Hashimzade, Nigar. 2017. "Dictionary Of Economics". Oxford Univ Press.
Hubman, Joshua. 2011. "A Financial Analysis Of Publicly Traded Professional Sports
Teams". The College At Brockport: Honors Program.
https://digitalcommons.brockport.edu/cgi/viewcontent.cgi?article=1068&context=honors.

34
Kadlec, D. 1998. "An Unhittable Pitch". Time 151 (23): 50.
Keating, Raymond J. 1999. "Sports Pork: The Costly Relationship Between Major League Sports
And Government". Policy Analysis 1: 11-15.
Kesenne, Stefan. 2008. The Economic Theory Of Professional Team Sports. Cheltenham, UK:
Edwin Elgar Publishing.
Kratofil, Gregory. 1999. "Direct Public Offerings Can Fill Business' Capital Needs". Kansas City
Business Journal 17 (42).
Kyriazis, Nicholas, and Theodore Metaxas. 2011. "Path Dependence, Change And The
Emergence Of The First Joint-Stock Companies". Business History 53 (3): 363-374.
doi:10.1080/00076791.2011.565513.
Lebowitz, Larry. 1996. "Panthers Stock: $1,000 Minimum". Sun-Sentinel (Fort Lauderdale,
Fla.), C1, 1996.
Lombardo, Christopher. 2019. "IBISWorld Industry Report 71121A: Sports Franchises In The
US". IBISWorld.
http://proxy.library.upenn.edu:2481/reports/us/industry/default.aspx?entid=1628.
Manchester United plc. 2012. "Prospectus". SEC EDGAR, 9.
https://www.sec.gov/Archives/edgar/data/1549107/000104746912008161/a2210672z424b4.htm.
Nemecek, David, and Austin Glassman. 2019. "Kirkland & Ellis LLP: Debt Facilities - Anatomy
Of Credit Agreements And Practical Examples". Presentation, The Wharton School, , 2019.
Pagano, M., F. Panetta, and L. Zingales. 1998. "Why Do Companies Go Public? An Empirical
Analysis". Journal Of Finance 53 (1): 27-64.
Palomo, Juan R. 1997. "Sports Owners' Blackmail Is An American Tradition". USA Today, ISA,
1997.
Pástor, Ľuboš, Lucian A. Taylor, and Pietro Veronesi. 2009. "Entrepreneurial Learning, The IPO
Decision, And The Post-IPO Drop In Firm Profitability". Review Of Financial Studies22 (8):
3005-3046. doi:10.1093/rfs/hhn082.
Rayner, Bob. 1997. "Go For The Gold: Public Stock Options Offerings Fuel Acquisitions,
Expansions In Stock Car Racing". Richmond Times Dispatch, E1, 1997.
Riess, Steven A. 2017. "Professional Team Sports In The United States". Oxford Research
Encyclopedia Of American History. doi:10.1093/acrefore/9780199329175.013.198.
Ritter, Jay. 2019. "Initial Public Offerings: Updated Statistics". University Of Florida.
https://site.warrington.ufl.edu/ritter/files/2019/04/IPOs2018Statistics-1.pdf.
Russell, Dave. 1997. Football And The English: A Social History Of Association Football In
England, 1863-1995. Preston: Carnegie Pub.

35
Saunders, Laura. 2012. "Are The Green Bay Packers The Worst Stock In America?.". Blog. Wall
Street Journal. https://blogs.wsj.com/totalreturn/2012/01/13/are-the-green-bay-packers-the-
worst-stock-in-america/.
Schaffer, Ryan. 2006. "A Piece Of The Rock : The Viability Of Widespread Public Offerings Of
Professional Sports Franchises". Virginia Sports And Entertainment Law Journal 5: 201.
Schneider, Carl W., Joseph M. Manko, and Robert S. Kant. 1981. "Going Public: Practice,
Procedure, And Consequences". Villanova Law Review 1 (8).
https://digitalcommons.law.villanova.edu/vlr/vol27/iss1/1.
Van den Brink, W.P., and P. Koele. 2002. Statistiek, Deel 3 [Statistics, Part 3]. Amsterdam:
Boom.
Willoughby, Jack. 2019. "Boston Celtics Stock". Barrons.Com.
https://www.barrons.com/articles/SB1045870898333098143.
"German Soccer Rules: 50+1 Explained". 2019. Bundesliga.Com - The Official Bundesliga
Website. Accessed May 4. https://www.bundesliga.com/en/news/Bundesliga/german-soccer-
rules-50-1-fifty-plus-one-explained-466583.jsp.
"If At First You Don’t Succeed". 2012. The Economist. https://www.economist.com/game-
theory/2012/07/12/if-at-first-you-dont-succeed.
"List Of Professional Sports Leagues By Revenue". 2019. En.Wikipedia.Org.
https://en.wikipedia.org/wiki/List_of_professional_sports_leagues_by_revenue.
"List Of Professional Sports Team Owners". 2019. En.Wikipedia.Org.
https://en.wikipedia.org/wiki/List_of_professional_sports_team_owners.
"List Of Publicly Traded Sports Teams". 2019. Investsnips. http://investsnips.com/list-of-
publicly-traded-sports-franchises/.
"Management". 2018. Businessdictionary.Com.
http://www.businessdictionary.com/definition/management.html.
"Member Associations - UEFA Coefficients - Country Coefficients". 2019. UEFA.Com.
https://www.uefa.com/memberassociations/uefarankings/country/#/yr/2019.
"STOXX Digital | STOXX® Europe Football". 2019. Stoxx.Com. https://www.stoxx.com/index-
details?symbol=FCTP.
“English Football League System". 2019. En.Wikipedia.Org.
https://en.wikipedia.org/wiki/English_football_league_system.
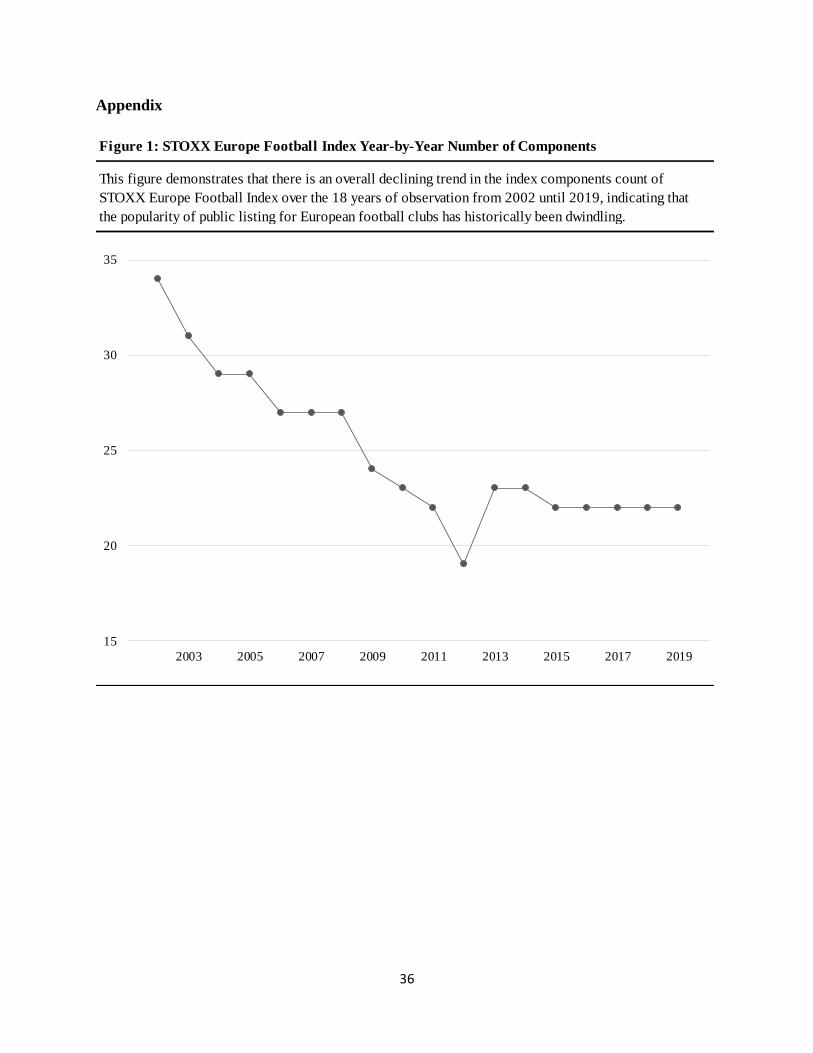
36
Appendix
Figure 1: STOXX Europe Football Index Year-by-Year Number of Components
This figure demonstrates that there is an overall declining trend in the index components count of
STOXX Europe Football Index over the 18 years of observation from 2002 until 2019, indicating that
the popularity of public listing for European football clubs has historically been dwindling.
15
20
25
30
35
2001 2003 2005 2007 2009 2011 2013 2015 2017 2019

37
Figure 2: Mean Non-Normalized and Normalized APPG Over Time
This figure plots the study sample population's mean of domestic league average points won per game over
the time frame observed. It indicates that the football clubs earned the highest average points per game in
the year of IPO - a breakthrough season.
1.500
1.625
1.750
-5 -4 -3 -2 -1 0 1 2 3 4 5
Year from IPO
Non-Normalized APPG
Normalized APPG

38
Figure 3: Mean Financial Ratios Over Time
This figure plots the study sample population's mean of various financial ratios over time. It indicates
that the financial health of a football club is most ideal in the year of IPO - a financial breakthrough apt
for the highest valuation in an IPO. Current ratio was not included for a better graphical representation of
the other five ratios. However, its trend was consistent with that of others with the year of IPO having the
highest current ratio. Its 11 data points through time were: 1.214, 0.472, 0.695, 0.912, 1.646, 4.134,
1.955, 3.881, 1.541, 1.375, 1.191.
-0.500
0.500
1.500
-5 -4 -3 -2 -1 0 1 2 3 4 5
Year from IPO
Debt Ratio
Return on Assets
PRR/Assets
PRR/Rev
Net Margin
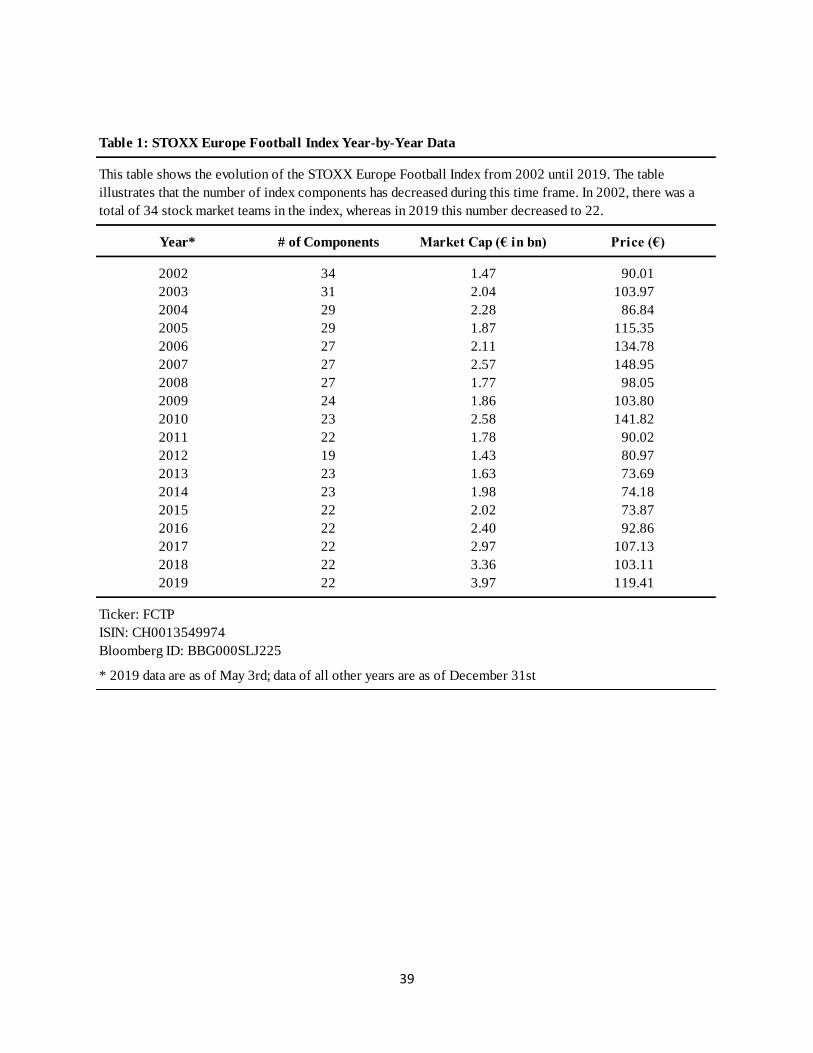
39
Table 1: STOXX Europe Football Index Year-by-Year Data
dYear* # of Components Market Cap (€ in bn) Price (€)
2002 34 1.47 90.01
2003 31 2.04 103.97
2004 29 2.28 86.84
2005 29 1.87 115.35
2006 27 2.11 134.78
2007 27 2.57 148.95
2008 27 1.77 98.05
2009 24 1.86 103.80
2010 23 2.58 141.82
2011 22 1.78 90.02
2012 19 1.43 80.97
2013 23 1.63 73.69
2014 23 1.98 74.18
2015 22 2.02 73.87
2016 22 2.40 92.86
2017 22 2.97 107.13
2018 22 3.36 103.11
2019 22 3.97 119.41
Ticker: FCTP
ISIN: CH0013549974
Bloomberg ID: BBG000SLJ225
* 2019 data are as of May 3rd; data of all other years are as of December 31st
This table shows the evolution of the STOXX Europe Football Index from 2002 until 2019. The table
illustrates that the number of index components has decreased during this time frame. In 2002, there was a
total of 34 stock market teams in the index, whereas in 2019 this number decreased to 22.

40
Ta
ble
2:
Lis
ted E
uro
pea
n F
oo
tba
ll C
lubs
Da
ta (
as
of
Ma
y 3
, 2
01
9)
Clu
bC
ountr
yT
ick
er
IPO
Da
te*
*P
rom
oti
on/R
ele
ga
tio
n
Aal
bo
rg B
old
spil
klub
AS
D
enm
ark
AA
B9
/14
/19
98
X
AF
C A
jax
N.V
.N
ethe
rlan
ds
AJA
X5
/11
/19
98
X
AG
F A
SD
enm
ark
AG
F1
2/1
/20
04
O
AIK
Fo
otb
all
AB
Sw
eden
AIK
B7
/1/2
006
O
AS
Ro
ma
S.p
.AIt
aly
AS
R
5/2
2/2
000
X
Bes
ikta
s F
utb
ol
Yat
irim
lari
San
ayi
ve
Tic
aret
AS
Tur
key
BJK
AS
2/1
9/2
002
X
Bo
russ
ia D
ort
mun
d G
mb
H &
Co
KG
aAG
erm
any
BV
B1
0/3
0/2
000
X
Bro
end
bye
rnes
IF
Fo
dbo
ld A
SD
enm
ark
BIF
B*6
/29
/19
90
X
Cel
tic
PL
CS
cotl
and
CC
P9
/1/1
995
X
Fen
erb
ahce
Fut
bo
l A
ST
urke
yF
EN
ER
9/1
7/2
004
X
Fut
ebo
l C
lub
e D
o P
ort
o
Po
rtug
alF
CP
6/1
/19
98
X
Gal
atas
aray
Sp
ort
if S
inai
ve
Tic
ari
Yat
irim
lar
AS
Tur
key
GS
RA
Y2
/19
/20
02
X
Juv
entu
s F
oo
tbal
l C
lub
S.p
.A.
Ital
yJU
VE
12
/19
/20
01
X
Man
ches
ter
Uni
ted
PL
CE
ngla
ndM
AN
U8
/9/2
012
X
OL
Gro
upe
SA
(O
lym
piq
ue L
yonn
ais
F.C
.)F
ranc
eO
LG
2/1
/20
07
X
Par
ken
Sp
ort
& E
nter
tain
men
t A
/S (
F.C
. C
op
enha
gen)
D
enm
ark
PA
RK
EN
12
/1/1
997
X
Ruc
h C
horz
ow
SA
Po
land
RC
W1
2/0
4/2
008
O
Sil
keb
org
IF
Inv
est A
SD
enm
ark
SIF
9/3
0/1
991
X
So
ciet
a S
po
rtiv
a L
azio
S.p
.AIt
aly
SS
L7
/6/1
998
X
Sp
ort
Lis
bo
a e
Ben
fica
-Fut
ebo
l S
AD
Po
rtug
alS
LB
EN
5/1
/20
07
X
Sp
ort
ing
Clu
be
De
Po
rtug
al -
Fut
ebo
l S
AD
Po
rtug
alS
CP
6/2
/19
98
X
Tet
eks
Tet
ov
oM
aced
oni
aT
ET
E*N
AX
Tra
bzo
nsp
or
Sp
ort
if Y
atir
im v
e F
utb
ol
Isle
tmec
ilig
i T
AS
Tur
key
TS
PO
R4
/15
/20
05
X
*T
he
IPO
dat
es f
or
thes
e cl
ubs
may
be
slig
htly inac
cura
te
** O
or
X indic
ates
whet
her
the
club h
as o
r has
not
exper
ience
d a
ny p
rom
otion o
r re
lega
tion d
uri
ng
the
tim
e fr
ame
of
-5 t
o +
5 y
ears
fro
m t
he
club's
IP
O (
excl
udin
g th
e IP
O y
ear)
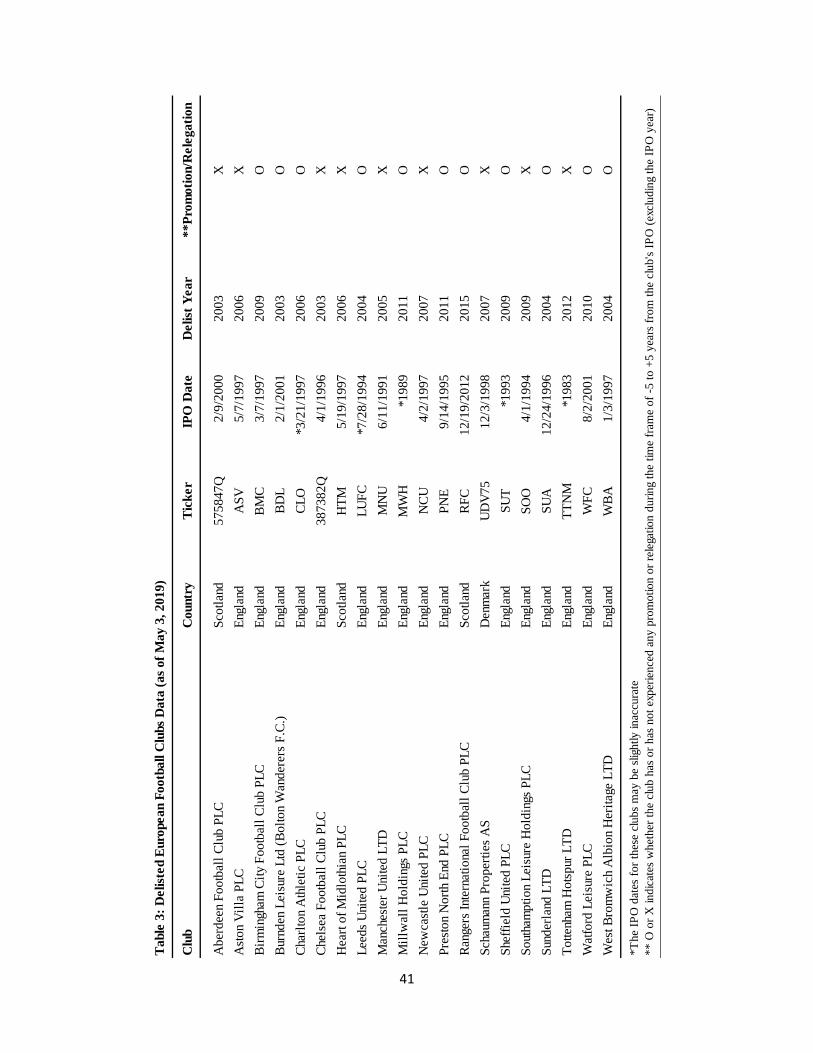
41
Table
3:
Delist
ed E
uro
pean F
ootb
all C
lubs
Data
(as
of
May 3
, 2019)
Clu
bC
ountr
yT
ick
er
IPO
Date
Delist
Year
**P
rom
oti
on/R
ele
gati
on
Aber
dee
n F
ootb
all
Clu
b P
LC
Sco
tlan
d575847Q
2/9
/2000
2003
X
Ast
on
Vil
la P
LC
Eng
land
AS
V5/7
/1997
2006
X
Bir
min
gham
Cit
y F
ootb
all
Clu
b P
LC
Eng
land
BM
C3/7
/1997
2009
O
Bur
nden
Lei
sure
Ltd
(B
olt
on
Wan
der
ers
F.C
.)
Eng
land
BD
L2/1
/2001
2003
O
Cha
rlto
n A
thle
tic
PL
CE
ngla
ndC
LO
*3/2
1/1
997
2006
O
Che
lsea
Footb
all
Clu
b P
LC
Eng
land
387382Q
4/1
/1996
2003
X
Hea
rt o
f M
idlo
thia
n P
LC
Sco
tlan
dH
TM
5/1
9/1
997
2006
X
Lee
ds
Uni
ted P
LC
Eng
land
LU
FC
*7/2
8/1
994
2004
O
Man
ches
ter
Uni
ted L
TD
Eng
land
MN
U6/1
1/1
991
2005
X
Mil
lwal
l H
old
ings
PL
CE
ngla
ndM
WH
*1989
2011
O
New
cast
le U
nite
d P
LC
Eng
land
NC
U4/2
/1997
2007
X
Pre
ston
Nort
h E
nd P
LC
Eng
land
PN
E9/1
4/1
995
2011
O
Ran
gers
Int
erna
tiona
l F
ootb
all
Clu
b P
LC
Sco
tlan
dR
FC
12/1
9/2
012
2015
O
Sch
aum
ann
Pro
per
ties
AS
D
enm
ark
UD
V75
12/3
/1998
2007
X
She
ffie
ld U
nite
d P
LC
Eng
land
SU
T*1
993
2009
O
Sout
ham
pti
on
Lei
sure
Hold
ings
PL
CE
ngla
ndS
OO
4/1
/1994
2009
X
Sun
der
land
LT
DE
ngla
ndS
UA
12/2
4/1
996
2004
O
Totten
ham
Hots
pur
LT
DE
ngla
ndT
TN
M*1
983
2012
X
Wat
ford
Lei
sure
PL
CE
ngla
ndW
FC
8/2
/2001
2010
O
Wes
t B
rom
wic
h A
lbio
n H
erit
age
LT
DE
ngla
ndW
BA
1/3
/1997
2004
O
*T
he
IPO
dat
es f
or
thes
e cl
ubs
may
be
slig
htly inac
cura
te
** O
or
X indic
ates
whet
her
the
club h
as o
r has
not
exper
ience
d a
ny p
rom
otion o
r re
lega
tion d
uri
ng
the
tim
e fr
ame
of
-5 t
o +
5 y
ears
fro
m t
he
club's
IP
O (
excl
udin
g th
e IP
O y
ear)

42
Table 4: UEFA Coefficient-based Country Size* (as of May 3, 2019)
Country Size* UEFA Country Coefficient
Spain Large 103.57
England Large 83.32
Italy Large 74.73
Germany Large 71.78
France Large 58.50
Portugal Small 48.23
Turkey Small 34.60
Netherlands Small 32.43
Denmark Small 27.03
Scotland Small 22.13
Sweden Small 20.90
Poland Small 19.25
* Size in football terms
Of the 43 clubs studied in this paper, 20 clubs are considered to operate in "large" countries; 23 are considered
to operate in "small" countries.

43
Table 5: Promotion / Relegation Normalization Multiple Calculation for Average Points Won per Game (Domestic League)
Post-Promotion APPG Deflator Inverse of Post-Relegation APPG Inflator
0.45 0.34
0.88 0.45
0.56 0.61
0.63 0.64
0.69 0.42
0.71 0.69
0.82 0.48
0.42 0.54
1.23 0.76
0.66 0.69
0.78
0.50
0.69
0.60
0.58
0.91
0.56
0.90
Average: 0.70 0.52
Weighted Average: 0.65x
Each deflator and inflator represents an instance of promotion or relegation for the sample population during the observed time frame
of -5 to +5 years from the club's IPO (excluding the IPO year). There were 18 promotions and 10 relegations in total. The multiple of
0.65x implies that the a single point won in one division is worth the same as 0.65 point won in the division one-level superior.
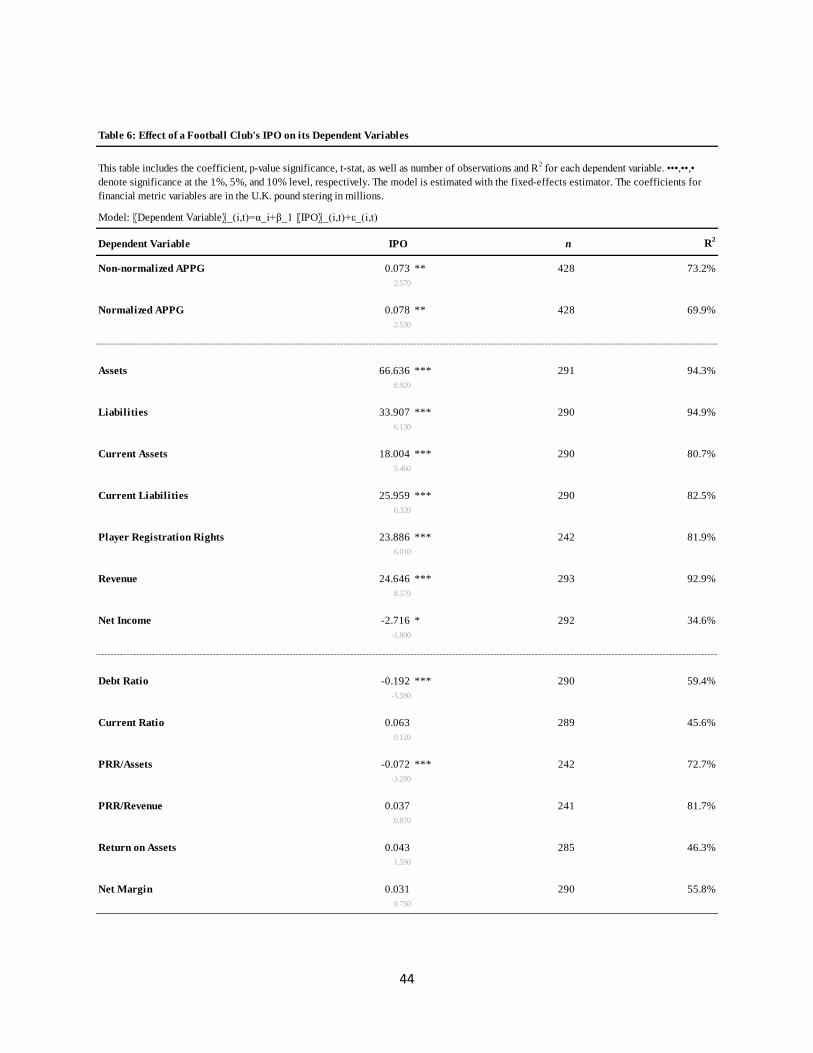
44
Table 6: Effect of a Football Club's IPO on its Dependent Variables
Model: 〖Dependent Variable〗_(i,t)=α_i+β_1 〖IPO〗_(i,t)+ε_(i,t)
Dependent Variable IPO n R2
Non-normalized APPG 0.073 ** 428 73.2%
2.570
Normalized APPG 0.078 ** 428 69.9%
2.530
Assets 66.636 *** 291 94.3%
8.920
Liabilities 33.907 *** 290 94.9%
6.130
Current Assets 18.004 *** 290 80.7%
5.460
Current Liabilities 25.959 *** 290 82.5%
6.320
Player Registration Rights 23.886 *** 242 81.9%
6.010
Revenue 24.646 *** 293 92.9%
8.570
Net Income -2.716 * 292 34.6%
-1.800
Debt Ratio -0.192 *** 290 59.4%
-3.590
Current Ratio 0.063 289 45.6%
0.120
PRR/Assets -0.072 *** 242 72.7%
-3.280
PRR/Revenue 0.037 241 81.7%
0.870
Return on Assets 0.043 285 46.3%
1.590
Net Margin 0.031 290 55.8%
0.750
This table includes the coefficient, p-value significance, t-stat, as well as number of observations and R2
for each dependent variable. •••,••,•
denote significance at the 1%, 5%, and 10% level, respectively. The model is estimated with the fixed-effects estimator. The coefficients for
financial metric variables are in the U.K. pound stering in millions.

45
Table 7: Effect of a Football Club's IPO on its Dependent Variables Interactive with the Current Listing Status
Model: 〖Dependent Variable〗_(i,t)=α_i+β_1 〖IPO〗_(i,t)+β_2 〖Listed〗_(i,t)+β_3 IPO×Listed+ε_(i,t)
Dependent Variable IPO Listed IPO × Listed n R2
Non-normalized APPG 0.092 ** 1.587 *** -0.036 428 73.3%
2.190 16.730 -0.620
Normalized APPG 0.082 1.577 *** -0.007 428 69.9%
1.630 15.250 -0.120
Assets 33.334 *** -55.737 ** 78.085 *** 291 94.9%
5.940 -2.330 5.460
Liabilities 21.526 *** -33.553 * 29.330 *** 290 95.0%
5.730 -1.820 2.650
Current Assets 8.345 *** -4.689 22.881 *** 290 81.6%
5.950 -0.430 3.500
Current Liabilities 8.569 *** -36.151 *** 41.198 *** 290 84.2%
5.720 -2.740 5.210
Player Registration Rights 1.578 -33.372 *** 57.641 *** 242 86.2%
1.520 -2.780 8.090
Revenue 15.420 *** -18.712 * 19.877 *** 293 93.2%
6.520 -1.940 3.520
Net Income 0.177 16.078 *** -6.338 ** 292 35.8%
0.240 3.140 -2.110
Debt Ratio -0.171 * 0.471 ** -0.052 290 59.4%
-1.960 2.600 -0.470
Current Ratio -0.048 7.274 *** 0.262 289 45.6%
-0.210 4.150 0.250
PRR/Assets -0.106 *** 0.561 *** 0.086 * 242 73.1%
-3.420 7.410 1.910
PRR/Revenue -0.109 *** 1.918 *** 0.379 *** 241 83.4%
-2.810 13.890 4.600
Return on Assets 0.102 *** 0.350 *** -0.140 ** 285 47.7%
2.770 3.930 -2.580
Net Margin 0.116 ** 0.943 *** -0.189 ** 290 56.7%
2.080 6.690 -2.260
The statistical components included in this table are the same as that of Table 6. The model is estimated with the fixed-effects estimator. The IPO
specification illustrates the relationship between pre- and post-IPO for only the currently delisted clubs. The Listed specification illustrates the
relationship between listed and delisted clubs for only the pre-IPO time frame. The third column illustrates the difference between listed and
delisted clubs regarding their changes in the dependent variables pre- and post-IPO.

46
Table 8: Effect of a Football Club's IPO on its Dependent Variables Interactive with the Country Size in Football Terms
Model: 〖Dependent Variable〗_(i,t)=α_i+β_1 〖IPO〗_(i,t)+β_4 〖Country Size〗_(i,t)+β_5 IPO×Country Size+ε_(i,t)
Dependent Variable IPO Country Size IPO × Country Size n R2
Non-normalized APPG 0.084 ** 1.398 *** -0.024 428 73.3%
2.220 14.700 -0.420
Normalized APPG 0.079 * 1.265 *** -0.001 428 69.9%
1.890 12.190 -0.020
Assets 41.365 *** -35.148 * 44.854 *** 291 94.5%
5.010 -1.680 3.030
Liabilities 35.314 *** -12.433 -2.513 290 94.9%
4.360 -0.790 -0.230
Current Assets 10.485 *** -12.400 13.424 ** 290 81.0%
4.430 -1.340 2.030
Current Liabilities 25.601 *** -12.108 0.639 *** 290 82.5%
4.180 -1.040 0.080
Player Registration Rights 17.693 *** -13.952 10.377 *** 242 82.0%
4.330 -1.380 1.280
Revenue 9.436 *** -15.533 * 27.074 *** 293 93.5%
5.570 -1.950 4.880
Net Income -4.135 ** 1.149 2.568 292 34.8%
-2.050 0.260 0.850
Debt Ratio -0.128 ** 0.579 *** -0.115 290 -11.5%
-2.480 3.820 -1.070
Current Ratio 0.144 0.548 -0.144 289 45.6%
0.130 0.370 -0.140
PRR/Assets -0.078 *** 0.273 *** 0.009 242 72.7%
-3.510 4.840 0.210
PRR/Revenue 0.138 * 0.597 *** -0.171 *** 241 82.0%
1.790 5.640 -2.010
Return on Assets -0.042 -0.072 0.152 *** 285 48.0%
-1.160 -0.970 2.840
Net Margin -0.076 -0.074 0.192 ** 290 56.7%
-1.230 -0.620 2.300
The statistical components included in this table are the same as that of Table 6. The model is estimated with the fixed-effects estimator.
The IPO specification illustrates the relationship between pre- and post-IPO for only the clubs operating in a "small" country. The Country
Size specification illustrates the relationship between "small" and "large" country clubs for only the pre-IPO time frame. The third column
illustrates the difference between "small" and "large" country clubs regarding their changes in the dependent variables pre- and post-IPO.

47
Endnotes
1 STOXX Europe Football Index was launched on April 22nd, 2002 and therefore historical index
composition prior to 2002 was unfortunately not available.
2 As discussed previously, Green Bay Packers is not considered a true stock market team.
3 Vancouver Canucks’ ownership structure can be found in more detail here: Damsell, Keith. 1998.
"Canucks ' Owner Forced To Halt Stock Offering". FIN. POST, 17, 1998.
4 Some examples include the Los Angeles Dodgers, which used to be owned by Fox Group, a part
of the News Corp. multimedia empire. The Atlanta Braves, Atlanta Hawks, and Atlanta Thrasher
were previously owned by Time Warner. The Anaheim Mighty Ducks and Anaheim Angels used
to be owned by Walt Disney. The Philadelphia 76ers and Flyers used to be owned by Comcast
Corp. The Chicago Cubs used to be owned by the Tribune Co. The Seattle SuperSonics used to be
owned by The Ackerley Group. The Colorado Avalanche and the Denver Nuggets used to be a
part of the Ascent Entertainment Group. The Montreal Canadians used to be owned by Molson
Companies Ltd, and the Toronto Blue Jays used to be owned by Interbrew SA.
5 Two of the 43 clubs observed – Teteks Tetovo and Schaumann Properties AS – provided zero
performance or financial data.
6 Tottenham Hotspur LTD’s IPO of 41 percent of its equity generated net proceeds of £3.3 million
to the company.
7 Manchester United PLC’s IPO of its equity generated $233 million to the company, which was
used primarily to pay down its debt from the Glazer family’s debt-financed takeover of the club in
2005.
8 With regard to how the coefficients are calculated, please refer to:
https://www.uefa.com/memberassociations/uefarankings/country/about/
9 For example, teams such as Watford F.C. or Bolton Wanderers F.C. played five seasons in the
EPL and 5 seasons in the second-division league during the observed timeframe of -5 and +5 years
from the IPO (excluding the IPO year).
10 For example, in the EPL, the bottom three clubs of each season are relegated. These spots are
then filled with three teams from the English Football League Championship (EFLC), which is
England’s second division league; the top two teams of EFLC in each season are automatically
promoted, whereas the next four compete in the playoffs, with the winner securing the third
promotion spot ("English Football League System" 2019).
11 Numerous European football clubs classify player registration rights under intangible assets;
accounting methods differ by club, however
12 Further information on the 2018-19 EPL standings as of the 37th round can be found here:
https://bleacherreport.com/articles/2834941-premier-league-table-final-week-37-2019-standings-
results-and-week-38-fixtures

48
Author’s Note
The author would like to sincerely thank Dr. Matthew C. Cedergren for generously taking his time
to provide mentorship and guidance throughout the process. This paper would not have been
realized without his kindness.
The topic of this paper was inspired by the author’s 2018 summer internship experience being
staffed on a sell-side transaction involving the sale of a Premier League club.