Why are Men Falling Behind? Gender Gaps in College...
34
1 Why are Men Falling Behind? Gender Gaps in College Performance and Persistence Dylan Conger The George Washington University Trachtenberg School of Public Policy and Public Administration 805 21 st Street NW, MPA 601G Washington, DC 20052 202-994-1456 [email protected] Mark C. Long University of Washington Daniel J. Evans School of Public Affairs Box 353055 Seattle, WA 98195-3055 206-543-3787 [email protected] This paper examines the male disadvantage in grade point average (GPA), credits earned, and persistence in college. We use data on enrollees in Florida and Texas four-year colleges to decompose gender differentials in the 1st semester, changes in the differentials between semesters, and persistence through college. We find that males earn lower GPAs and credits in their first semester of college largely because they enter college with lower non-cognitive skills, captured by lower high school grades. After the first semester, males fall further behind their female counterparts in grades and credits. Some of this widening disparity continues to be explained by females' higher non-cognitive abilities, yet gender differences in college course- taking and majors also plays a substantial role in explaining gaps in credits, grades, persistence, and graduation. Keywords: Higher education, gender differences JEL Classifications: I23, J16 __________________________ We thank Marta Tienda, Eric Furstenberg, and Eric Grodsky for helpful comments as well as participants at the Texas Higher Education Opportunity Project Research Workshop at Princeton University and The City University of New York Office of Academic Affairs. We are also grateful to the Florida Department of Education for making the Florida data available and to the Texas Higher Education Opportunity Project for making the Texas data available. Funding for this project was provided by the U.S. Department of Education's Institute of Education Sciences. Ana Karruz, Danielle Fumia, and Jason Williams provided excellent research assistance. Both authors contributed equally and all errors and oversights remain our responsibility.
Transcript of Why are Men Falling Behind? Gender Gaps in College...

1
Why are Men Falling Behind? Gender Gaps in College Performance and Persistence
Dylan Conger
The George Washington University Trachtenberg School of Public Policy and Public Administration
805 21st Street NW, MPA 601G Washington, DC 20052
202-994-1456 [email protected]
Mark C. Long University of Washington
Daniel J. Evans School of Public Affairs Box 353055
Seattle, WA 98195-3055 206-543-3787 [email protected]
This paper examines the male disadvantage in grade point average (GPA), credits earned, and persistence in college. We use data on enrollees in Florida and Texas four-year colleges to decompose gender differentials in the 1st semester, changes in the differentials between semesters, and persistence through college. We find that males earn lower GPAs and credits in their first semester of college largely because they enter college with lower non-cognitive skills, captured by lower high school grades. After the first semester, males fall further behind their female counterparts in grades and credits. Some of this widening disparity continues to be explained by females' higher non-cognitive abilities, yet gender differences in college course-taking and majors also plays a substantial role in explaining gaps in credits, grades, persistence, and graduation.
Keywords: Higher education, gender differences JEL Classifications: I23, J16 __________________________ We thank Marta Tienda, Eric Furstenberg, and Eric Grodsky for helpful comments as well as participants at the Texas Higher Education Opportunity Project Research Workshop at Princeton University and The City University of New York Office of Academic Affairs. We are also grateful to the Florida Department of Education for making the Florida data available and to the Texas Higher Education Opportunity Project for making the Texas data available. Funding for this project was provided by the U.S. Department of Education's Institute of Education Sciences. Ana Karruz, Danielle Fumia, and Jason Williams provided excellent research assistance. Both authors contributed equally and all errors and oversights remain our responsibility.

2
Why are Men Falling Behind? Gender Gaps in College Performance and Persistence
1. Introduction
The gender gap in post-secondary education has taken a remarkable turn. Males' share of
total college enrollment has fallen steadily from 71% in 1947 to 43% in 2005, with 1978 the last year
that males held an advantage (see Figure 1 derived from data in Snyder, Dillow, and Hoffman 2008).
Males also complete college at lower rates than females; 42% of bachelor's degrees went to men in
2005-06 despite males comprising 46% of freshmen in 2002, suggesting that males fall behind even
after they have made the initial decision to obtain a college diploma (Snyder, Dillow, and Hoffman
2008). Gender differences in college enrollment are problematic for college administrators who seek
gender-balanced student populations (see, for example, Gibbs 2008). In addition, while males
remain overrepresented in several high-wage occupations and industries (Blau 1998), the growing
female advantage in college completion is likely to imbalance the labor market in new ways.
The empirical literature has not kept pace with this reversal in gender disparities at the post-
secondary level. Only a few studies explore why males fall behind their female counterparts in
college enrollment, and even fewer examine the completion disparity. All of the enrollment gap
studies document females' higher high school grades and reported post-secondary ambitions (Jacob
2002; Peter and Horn 2005; Reynolds and Burge 2004; Riegle-Crumb no-date). High school grades
tend to explain more of the enrollment gap than performance on academic proficiency exams, which
have led some to conclude that females have higher non-cognitive skills, such as organization,
dependability, and self-discipline (which are captured in grades once performance on academic
exams is held constant) that increase their access to college (Jacob 2002). The completion gap
research (which tends not to condition on the decision to enroll) points to gender differences in
expected returns to a college diploma, where returns are sometimes defined broadly to include

3
marriage markets (Charles and Luoh 2003; Diprete and Buchmann 2006). Yet the persistent female
advantage conditional on college enrollment suggests that expected premiums to a college degree can only
partially explain completion disparities. Open questions remain regarding the relative contribution
of family background, pre-collegiate preparation, and college experiences—university attended and
courses selected, as examples—to gender differences in college performance and persistence.
This paper aims to answer these questions. We use administrative data on enrollees in Florida
and Texas 4-year institutions to examine and explain gender differences in grade point averages
(GPA), college credits, and persistence. We find that males take fewer credits and earn lower grades
than females in their first semester of enrollment. Male students are also less likely to persist and
graduate from college and earn fewer cumulative credits and lower cumulative grades. The male-
female differentials are not generally driven by differences in demographics, the quality of high
schools and neighborhoods, high school test scores, or the selectivity of the university attended by
male and female college enrollees. In fact, many of these factors tend to favor male enrollees.
Instead, male enrollees have lower high school grades upon college entry, and this single factor
(controlling for test scores and other factors) explains approximately three-quarters of the gender
differential in credits earned and GPA in the freshman year. Males disadvantages in the first
semester of college, coupled with their higher propensity to take more difficult college courses, also
explains a large share of their relatively poor performance in later semesters and their lower rates of
persistence.
2. Prior Research on Gender Gaps in Postsecondary Education
Relatively little research has explored why men fall behind at the postsecondary level, and the
research that does exist focuses almost exclusively on college enrollment or college completion.
Research on disparities in credits and grades earned along the way is sparse, despite evidence of
4
additional labor market responsiveness to grades and total credits, even conditional on completion
(Jones and Jackson 1990; Kane and Rouse 1995). Prior studies of female advantages in college
enrollment find that they have higher high school grade point averages than men, are more likely to
graduate from high school, and more likely to take rigorous course loads while in high school (Peter
and Horn 2005; Riegle-Crumb no-date). Prior research also find that girls are advantaged in non-
academic areas, such as parental, peer, and teacher expectations as well as non-cognitive skills, such
as organization, self-discipline, attentiveness, dependability, and seeking help from others (Reynolds
and Burge 2004; Riegle-Crumb no-date; Jacob 2002). Some have used the more easily observed high
school grades as a proxy for these non-cognitive advantages, once academic test scores are held
constant (Jacob 2002). In addition to increasing their likelihood of being accepted to a university,
these non-cognitive advantages may also lower the psychic costs of schooling.
Standard human capital theory proscribes that the ability of college students to perform well and
persist though school is determined by a variety of costs and incentives, all of which may differ for
male and female enrollees. For instance, males are less likely to enroll in college, but those that do
enroll score higher on high school achievement tests and the Scholastic Aptitude Test (SAT) than
females, and require less remediation in college-level mathematics (LoGerfo, Nichols, and Chaplin
2006; Long, Iatarola, and Conger 2009; Rothstein 2004). At the same time, females are less likely to
major in subjects with strict grading standards, such as mathematics and engineering (Turner and
Bowen 1999). Females also attend colleges that have looser admissions requirements and higher
admissions rates (Jacobs 1999). This partly reflects the fact that selective universities often have
larger male-dominated engineering programs, and are less likely to accept part-time students who are
disproportionately female (Jacobs 1999). The higher high school achievement scores of male
entrants should lower the psychic costs of schooling relative to females, yet the less selective

5
institutions and majors chosen by females should lower their psychic and direct costs (through lower
tuition), rendering the net effect of these two forces indeterminate.
The handful of studies that have explored female advantages in college completion rates tend to
find that incentives due to shifting female premiums on college degrees may also be at work. Yet
the incentives are not due to an increase in the wage premium on a college degree for women
relative to men; in fact, with the decline of the manufacturing sector, the wage premium associated
with completing more years of education and with attending a higher quality college have been rising
faster for men than for women (Charles and Luoh 2003; Long forthcoming). Instead, Charles and
Luoh (2003) suggest that greater variation in the returns to a college degree among men relative to
women leads to greater uncertainty for men, which in turn lowers their educational attainment levels.
Taking a slightly more social perspective, DiPrete and Buchmann (2006) suggest that the female
advantage in college completion is more likely due to the male-female differential in what they refer
to as "personal" returns to education, including a higher probability of marriage, a higher standard of
living, and a lower probability of being poor. Neither the Charles and Luoh (2003) or the DiPrete
and Buchmann (2006) papers examine college completion among college enrollees. Therefore, the
importance of expected labor market returns relative to costs (direct, psychic, or opportunity) may
be overstated because the gender gaps in labor market incentives should be relatively small among
college entrants. To elaborate, gender differences in knowledge of the labor market should be
smaller among college entrants (all of whom have made an initial decision to obtain a college degree)
than among middle school or high school students. Differences in the rates at which males and
females complete college may be due to changes in these perceptions of the labor market (e.g. males
expectations of the returns to a college degree become more uncertain as they progress through
college) or, more likely, to the unanticipated costs of college, both direct and psychic. By restricting

6
an analysis of college completion to those who have decided to enroll, we can better isolate the
contribution of the costs of college to gender gaps.
Given the shortage of research on the reversal in the gender post-secondary education gap, we
have much to contribute. First, by examining several measures of college performance, GPAs,
credits earned, and college completion rates, we shed light on whether gender gaps are constant,
growing, or diminishing during the students' years of college enrollment. Second, we control for
many important determinants of college achievement that prior studies have omitted, including
demographic background, educational needs, high school quality, performance on high school
achievement exams, high school grades, college quality, and college major. Finally, we analyze two
complementary, administrative datasets that track the census of college students in two large states
throughout their college careers.
3. Data
The first source of data comes from students who enrolled in one of Florida's eleven public 4-
year universities in 2002-03 in the year immediately following their high school graduation. More
specifically, the dataset consists of a census of Florida public 8th graders in 1997-98 plus any other
student who entered this cohort given normal progression (i.e., new 9th graders in 1998-99 + new
10th graders in 1999-00 + new 11th graders in 2000-01 + new 12th graders in 2001-02). Students
are followed through the 2004-05 school year, and we are able to follow students as they make
movements across Florida's postsecondary public universities. For these students, we have
complete high school and college transcript records, 10th grade test scores, demographic

7
information, and limited measures of employment while in college.1 These data were supplied to the
authors by the Florida Department of Education.
The second data source includes a census of enrollees at the following five Texas institutions:
Rice University in 2000-01; the University of Texas (UT) at Austin in 1999-00; Texas Agricultural &
Mechanical University (A&M) in 1999-00; the University of Texas-Pan American in 1999-00; and
Texas A&M-Kingsville in 1998-99. Students at these universities are followed for six years (except
for students at Rice and Texas A&M-Kingsville, who are followed for five years). For these
students we have records on college credits earned, grade point average, declared major by term of
enrollment, and college graduation. In addition, we have limited information collected on their
college applications, including SAT/ACT scores, high school class rank, high school identifiers,
advanced placement test taking and test passing indicators (for UT-Austin), high school
extracurricular activities (for Texas A&M and Texas A&M - Kingsville), mother's and father's
education (for UT-Austin), and parent's income (for UT-Austin and Texas A&M Kingsville). The
Texas data were compiled and made available to the authors by the Texas Higher Education
Opportunity Project (www.theop.princeton.edu).
These administrative datasets hold several important advantages over national survey data (e.g.
National Educational Longitudinal Study). First, they offer large numbers of students attending
individual postsecondary institutions, which allows us to conduct a more intensive probe than earlier
studies, for instance, by including high school and university fixed effects. Secondly, since we
observed students in each semester, we can evaluate how gender differentials evolve during the
students' college careers. Third, these data provide insight into recent cohorts of college students,
1 We do not have 10th grade test scores for students who entered the Florida secondary system after the 10th grade (7% of students). A very small percentage of students (less than 1%) are missing data on high school rank percentile, age, or foreign-born status. We impute all missing values using multiple imputations by chained equations, creating five multiply-imputed datasets. We also have limited high school course-records for those students who were not observed in all four years of high school (for instance, those who entered the Florida secondary system in the 11th grade).
8
who are subject to current post-secondary and labor market conditions. The data are limited to just
Florida and Texas, but 13% of U.S. freshmen enrollees in 2005 were located in these two states
(Snyder, Dillow, and Hoffman 2008), making the results here relevant for discussions of gender gaps
nationally. To be sure, each dataset has its limitations (for instance, our Florida post-secondary
sample includes only students from public secondary institutions in Florida and our Texas data
include a limited set of control variables), but together, they overcome several data weaknesses.
4. Estimation Strategy
The precise right-hand side variables differ slightly according to the dependent variable and the
sample of universities, but the general estimation strategy is as follows:
(1) Yihj = Giβ1 + Aiβ2 + Riβ3 + Ciβ4+ Xiβ5+ Wiβ6 + Miβ7 + αj + νh + εi.
Yihj is the outcome (GPA, credits earned, persistence to the junior year, and graduation) for student i
from high school h in university j. Gi equals 1 if the student is male; Ai is a vector of high school
achievement test scores; Ri is the student's high school class rank percentile; Ci is a vector of higher-
level high school course-taking and/or performance variables; Xi is a vector of other pre-collegiate
background characteristics, such as race/ethnicity and eligibility for free or reduced-price lunch; Wi
is whether the student earned wages while in college; Mi is a vector of variables capturing the
student's major or the types of post-secondary courses that the student attempted; αj is a vector of
college campus fixed effects; νh is a vector of high school fixed effects; and εi is an error term. We
estimate Eq. (1) with ordinary least squares when the dependent variable is hours or GPA earned
and probit specification when the dependent variable is persistence or graduation.
Each of the variables in this equation is expected to measure some portion of the costs and
incentives males and females face in college, although they are not easily categorized as such. For
example, pre-collegiate characteristics (e.g. poverty, race) and preparation (e.g. high school test

9
scores) measure students' ability to complete college-level material, the returns they expect, and the
direct costs they face. In addition to capturing differences in the quality of the institutions students
attend and the support they receive, the university fixed effects may also measure and control for
some differences in the expected returns to the diploma. The same can be said for the post-
secondary courses that students choose. The residual in Eq. (1) captures the usual list of suspects.
Major possibilities include measurement error (for instance, if high school test scores do not fully
capture cognitive ability) and tastes for schooling or education. Differences in preferences for
schooling between male and female college enrollees who are otherwise equal on all observables
could be attributed to any number of differences, such as family resources and expectations, biology,
socialization, peer support, faculty mentoring, and perceived labor market returns.
We then decompose the portion of the gender gaps that are explained by the sets of
observed covariates shown in Eq. (1), such as the difference between men and women in high
school rank percentile. Assuming one vector of observable characteristics (Z), our general equation
is:
(2) Δμ(M, W) = [μ(ZM) – μ(ZW)]βM + μ(ZM)[ βM- βW]
where Δμ(M, W) is the mean gap between men and women, [μ(ZM) – μ(ZW)]βM captures the
portion of the mean gap that is due to differences between men and women in their observable
characteristics, Z; and μ(ZM)[ βM- βW] measures the portion of the mean gap that is unexplained. Eq.
(2) uses the male coefficients, which tells us how much males would gain if they had the same
observable characteristics as females yet kept the same estimated effect of each characteristic on the
dependent variable. By substituting the female coefficients into Eq. (2), we learn how much of the
gap would be altered if males had the same observable characteristics and estimated effects as
females. We estimate our decompositions using both male and female coefficients.

10
In order to learn more about the within-college gender differences, we then examine gender
gaps for eight institutions from Florida and Texas that vary substantially in their degrees of
selectivity and racial composition of their enrollment (see Appendix Table 1). For our Texas
institutions we are able to model whether the student completed college within five or six years in
addition to the credits and GPA earned along the way. Our goal with these multiple dependent
variables and institutions is to examine the full variation in the college gender gap, and its
determinants, by university and state.
A Note on Differential Self-Selection into College
In our Florida sample roughly 49% of all 2002 high school graduates were male while only 40%
of the fall semester 2002 4-year college entrants were male. Given the disproportionate share of
females enrolling in college, one might be concerned that those males who do enroll may have some
positive unobserved trait that prompts their enrollment. If so, and assuming this unobserved trait is
positively correlated with college performance, then we would expect that the coefficient on Male
from Equation 1 (β1) would be positive as it would absorb this latent positive male characteristic.
However, when we estimate a probit model of college enrollment for the Florida graduating class of
2002, we were able to reduce the gender gap in enrollment to nearly zero when controlling for all of
the observable pre-collegiate characteristics shown in Eq. (1)- specifically, 10th grade achievement
scores, high school class rank, high school courses, demographics, and high school fixed effects.
The male coefficient in an enrollment model without any covariates is -0.065; while in our more fully
specified model with pre-collegiate covariates, the marginal effect of being male is reduced to just -
0.009. Most of the enrollment gap is, in fact, due to female advantages on observable characteristics
and little of the gender gap is based on differences in unobservables conditional on observables.

11
5. Results
Table 1 shows the mean GPA, credit hours, and 6th semester enrollment for students who
enrolled in a Florida 4-year public institution in the fall of 2002 (N=25,612). The "overall sample"
column refers to students who were enrolled in each semester, regardless of whether they were
observed in previous or later semester (conditional on 1st semester enrollment). In the first
semester, females earn an average GPA of 2.90 and males earn an average of 2.73 for a male-female
differential of -0.17. The female GPAs rise slightly over the following five semesters, and gender
gaps widens by a small amount. In addition to earning lower GPAs in each semester, males earn
fewer credit hours and are less likely to remain enrolled; roughly 79% of the female freshman
persisted to the 6th semester compared with only 74% of the male freshman. The credit hour gaps
grows over time from -0.43 in the first semester to -0.79 by the last semester for a differential of
6.56 in cumulative credits through Spring of 2005.
The next two columns in Table 1 show the differentials in GPA, hours earned, and persistence
among the 18,364 students who were continuously enrolled in each of the six semesters. Among
this sub-sample of persisters, the GPA and credit hour gender gap is very small in the first semester,
and smaller in each semester than it is among the overall sample. Yet the increase in the male-
female differential is much larger among the persisters than among the overall sample, and by the
6th semester, the GPA and credit hour differentials among those who are continuously enrolled
reaches parity with the differentials among the overall sample of students. This increased differential
among the subset of students who do not dropout suggests that the disparities observed in the
overall sample are not explained by males who arrive to school with a higher propensity for dropout.
In fact, the relatively equal differential in the first semester combined with the large increase in the
differential among the persisters suggests that somewhere between the 1st and 6th semesters, males
who arrive with equal ability and propensity to persist lose their relative standing.

12
Table 2 provides results from three separate analyses that together explain gender disparities in
first semester GPA. The first column shows the male-female differentials on all variables included
on the right-hand side of the regressions (see Appendix Table 2 for the male and female means on
these variables). The next three columns provide the results of GPA regressions for all students,
then separately for males and females. The last two columns provide the results of our
decomposition analysis.
We condition the first semester GPA regressions on the number of credits attempted in the first
semester. Interestingly, there is no significant gender gap in the number of credits attempted in the
first semester. Thus, the gender gap in the number of credits earned reflects a gender gap in
completing courses with a passing grade. Looking back to their high school experiences reveals that
male enrollees have higher 10th grade math achievement scores, but lower 10th grade reading
achievement scores, and they are nearly five percentage points lower in their high school class rank
distribution. Male enrollees are more likely to have taken advanced placement (AP) or international
baccalaureate (IB) classes in math and science, but less likely to have taken an AP/IB English course.
Finally, on demographics, males are more likely to be Asian (or white as shown in Appendix Table 2)
and less likely to be black; are less likely to have received free- or reduced-price lunch during high
school; but more likely to be older and to have some form of disability (i.e., "Non-Gifted
Exceptionality"). In combination, the gender gaps in these characteristics do not provide a clear
pattern of advantage for female students as several characteristics would seem to suggest male
advantages (for instance, higher 10th grade math achievement scores and advanced math course-
taking).

13
The next three columns in Table 2 provide regression results. With all controls, the gender gap
drops by 60% to a differential of -0.068.2 The coefficients on the college level determinants suggest
that students who attempt more credits earn higher GPAs. All the high school and demographic
variables have the expected influences on freshman GPA; for instance, high achievement scores,
good grades, and more advanced courses associates with higher GPA, while free and reduced-price
lunch eligibility associates with lower GPA. Yet the influence of these determinants of college
performance differ for males and females. For example, the male and female coefficients on high
school reading achievement scores, class rank percentile, and course-taking are comparable, while
the positive relation between math achievement scores and college grades only holds for females.
Also, males who were deemed limited English proficient at some point during high school earn
higher college GPAs, while this relation does not hold for females.
The final two columns in Table 2 (the decomposition results) reveal that a single factor, gender
gaps in high school class rank percentile, explains most of the gap in first semester GPA. If men
earned the same grades as women in high school, the male-female differential in first semester GPA
would decrease by 72.8% (using male coefficients). If men earned the same high school grades and
converted their high school grades into college grades in the same way women do, the gap would
shrink by 74.0%.
Male college enrollees come from high schools whose students earn higher GPAs in college.
That is, male college enrollees are advantaged by the high schools that they attended relative to their
2 Since differences in observable characteristics favor female enrollees, and given their higher rate of enrollment in post-secondary institutions, we conducted a different thought experiment. Suppose that males and females with similar observable characteristics enrolled in four-year, in-state, public colleges at the same rates. What would the gender gap in first year GPA be under this scenario? To address this question, we ran a first-stage probit predicting the likelihood of enrolling in a Florida public four-year institution conditional on pre-collegiate variables (Ai, Ri, Ci, Xi) and high school fixed effects (νh). We then matched each male that attended college with a female (without replacement) based on their likelihood of enrolling. The matched sample consists of 10,249 male and 10,249 female students. For this matched sample, the gender gap in first semester GPA is -0.11 (2.85 for females versus 2.63 for males). That is, the gender gap is reduced 34% (1-0.11/0.17) when matching on the likelihood of enrollment..

14
female college classmates.3 If male college enrollees attended the same high school as female college
enrollees, we would expect the first semester GPA gender gap to widen by 8.4% (using male
coefficients).
Most of the other factors that we examined either had small effects on the college GPA gender
gap, or favored males. For example, high school course-taking modestly favors males and would
widen the gender gap by 3.1% (using male coefficients). Males advantage on math achievement
scores does not explain the first semester GPA gender gap using male coefficients (since the
coefficient on math scores for males is essentially zero). However, if males received the same return
to math scores as females, the gender gap would widen by 5.6% if the gender gap in 10th grade
math scores were eliminated. Put differently, if females catch-up on math scores to their male high
school classmates, we would expect female college grades to improve and the college GPA gap to
widen.
Together, these male-female differences on observables explain between 59% and 62% of the
male-female differential in GPA (depending on whether male or female coefficients are used). The
residual could be due to any number of uncontrolled factors, such as preferences for leisure time,
family circumstances, amount of financial aid, amount of employment, types of classes taken in the
first semester, and motivation to earn good grades in college.
We next evaluate the factors explaining gaps in cumulative credits earned through the sixth
semester. The results are shown in Table 3 (results for other dependent variables will be
summarized in Tables 4 and 5 to simplify the presentation). Data limitations prevented us from
evaluating students progress in Florida universities past three years. However, cumulative credits
3 Male college entrants are, in fact, drawn from schools with lower shares of poor students, and higher test scores and graduation rates than female college entrants. Smaller gender disparities exist among the universe of high school graduates (see Appendix Table 2). Either college-going males disproportionately select into good high schools, or more likely, males need to attend good high schools in order to overcome their deficiencies on other observable characteristics in order to be motivated to attend college.

15
through three years is likely to be highly correlated with the student eventually graduating college;
for the Texas universities that we discuss later, we find that gaps in cumulative credits through three
years are mostly mirrored by gaps in graduation.
In this analysis, we condition on credits earned in the first semester and the share of credits
earned in various subjects as a proxy for college major. Not surprisingly, there is a strong relation
between the number of credits earned in the first semester and cumulative credits earned through six
semesters; an additional credit earned in the first semester would predict an increase of 3.7 credits
earned through six semesters. Moreover, one-quarter of the gender gap in cumulative credits can be
explained by the gender gap in first semester credits earned. Gaps in high school class rank
contribute an additional 19%.4
Interestingly, students with higher 10th grade math achievement scores earn fewer cumulative
credits, and this relationship is true for both males and females. Thus, males advantage on math
scores predicts fewer cumulative credits for males and partially explains the gender gap (7.6% using
male coefficients). Students with higher 10th grade reading achievement scores also earn fewer
cumulative credits, but the relationship is weaker. It is possible that students with high math ability
leave Florida colleges in response to labor market incentives, or that they exit for higher quality
private schools.
The remainder of Table 3 shows gender gaps in college course-taking. Males take more of their
college credits in Business, Engineering/Computer Science, and Natural/Physical Sciences, while
females take more of their credits in Education, Health, Humanities, Social Sciences, Social Work,
and Communications.5 The largest gender gaps are in Education, Health, Engineering/Computer
4 In results that are shown in Table 4b, and discussed subsequently, we show that gaps in high school class rank explain 86% of the gaps in first semester credits earned. Thus, the total contribution of gaps in high school class rank to gaps in cumulative credits is roughly 40% (i.e., 19% + 86% * 25%). 5 The omitted category includes courses that could not be classified into these primary majors, such as physical education courses, military education courses, and library and information studies courses. There was no substantial

16
Science, and Natural/Physical Sciences. Interpreting the regression coefficients in this table is
somewhat challenging. As an example, suppose a student switched 100% of their credits from the
omitted category (Other) to Education. We would expect this student to earn 34.7 additional credits.
Now, compare this coefficient on Education (34.7) to those on Health (26.5), Engineering /
Computer Science (10.1), and Natural / Physical Sciences (-10.5). Clearly, the subjects in which
males are specializing produce fewer cumulative credits than the subjects in which females are
specializing. This could be because students in these majors are required to take fewer credits in
order to graduate: for example, at the University of Florida, Education majors are required to take
more credits than Liberal Arts & Sciences majors.6 Another possibility is that the material in some
courses (e.g. those in Engineering / Computer Science and Natural / Physical Sciences) is so
strenuous that students who take these courses are less likely to earn a passing grade. Overall,
gender gaps in college course-taking subjects explain 28.9% of the cumulative credit gender gap
using male coefficients (or 21.9% using female coefficients).
We have omitted from Table 3 other variables which were controlled for, including student's
high school course-taking, race, and age; indicators of the student's free- or reduced-price lunch
status, foreign born, limited English proficiency, non-gifted exceptionality, and worked during the
years 2002-03 to 2004-05; and high school and university fixed effects. These factors contributed
little; high school fixed effects had the largest effect, predicting a 2% widening of the cumulative
credit gender gap if males and female college enrollees attended the same high schools. In total,
these factors shown in the table and those not shown explain 68.4% to 78.6% of the cumulative
credit gender gap.
gender difference for this omitted category, which accounted for 3.5% of males' courses and 3.8% of females' courses respectively. 6 University of Florida 2002-03 Undergraduate Catalog (http://www.registrar.ufl.edu/catalog.html)

17
In our final analysis, we examine all dependent variables separately across institutions from
Texas and Florida. From Florida, we select the two flagship institutions, University of Florida and
Florida State University, and Florida A&M University an historically black university. From Texas,
we focus on the two flagship institutions UT-Austin and Texas A&M, as well as two less selective
public institutions (UT-Pan American and Texas A&M Kingsville), and Rice University, a private
and extremely selective institution with an average freshman SAT of around 1,400. UT-Pan
American is located along the Mexican border and designated as an "Hispanic-serving institution".
Table 4a provides the first semester gender gaps at each institution in addition to the portion of
the total gaps that are explained by various factors which are shown in Table 4b. The percentages
reveal the amount by which the gender gap would change if males had the same characteristics as
females but if the effect of each characteristic on the dependent variable remained the same (in other
words, the decompositions use the male coefficients). Despite the vast differences across these eight
institutions in their selectivity, the gender gaps in first semester grades are remarkably similar,
ranging from 0.07 at the University of Florida to 0.29 at Texas A&M-Kingsville. To some degree it
appears that more selective institutions have smaller first semester GPA gender gaps. With the
exceptions of Rice and UT-Austin, we are able to explain 43% to 67% of these gaps using first
semester credits attempted and pre-collegiate observable characteristics. For Rice and UT-Austin,
these factors are not collectively able to significantly explain first semester GPA gender gaps.
For first semester credits, we see variance in gender gaps across institutions; significant female
advantages are found at five of the eight institutions, while there are insignificant gender differences
at Rice and UT-Austin, and significant male advantages in credits earned at Texas A&M-Kingsville.
Excluding UT-Pan American, we are able to explain able to explain 27% to 65% of these gaps using
pre-collegiate observable characteristics. For UT-Pan American, these factors are not collectively
able to significantly explain first semester credits earned gender gaps.

18
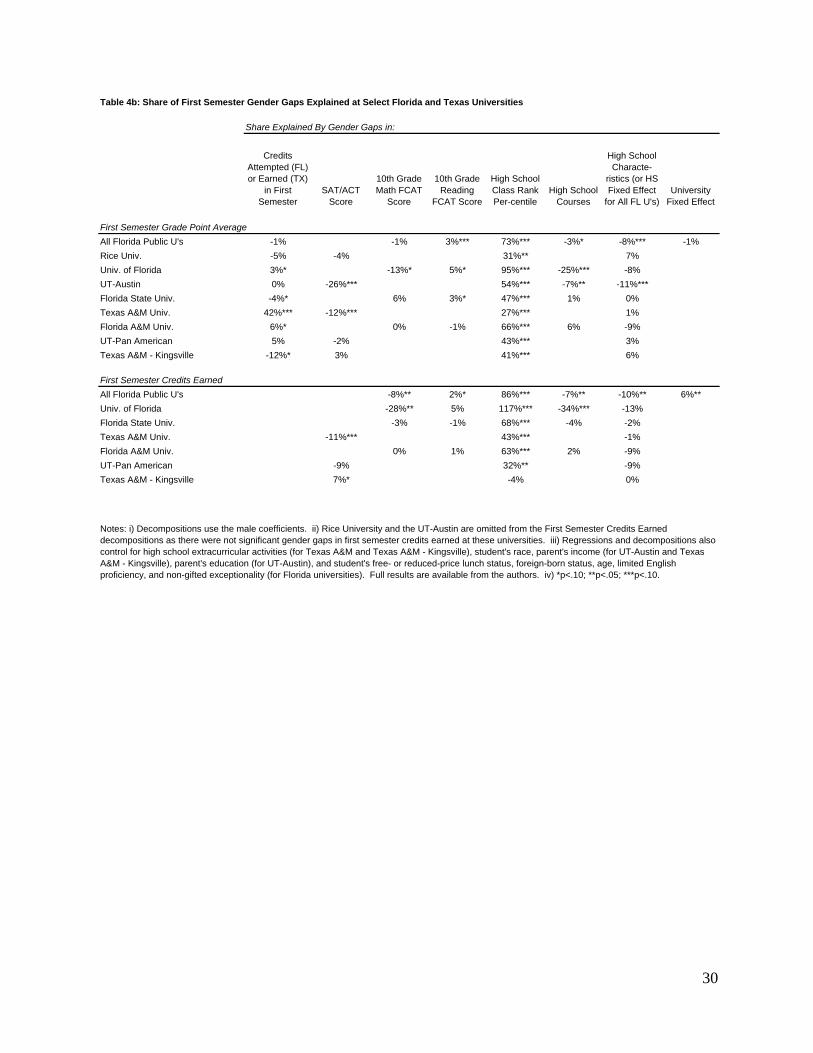
In Table 4b we present the decomposition results for these outcomes. Notably, gaps in high
school class rank percentile significantly explain gaps in first semester GPA, with a range of 27% at
Texas A&M to 95% at the University of Florida. Likewise, with the exception of Texas A&M
Kingsville, where males earned more credits in the first semester than females, gaps in high school
class rank explain 32% to 117% of gender gaps in credits earned.
No other student characteristic has this strong or consistent relationship with gender gaps.
However, there are some interesting individual results. For example, male advantages in 10th grade
math achievement scores and high school courses for students at the University of Florida
substantially lessen gender gaps in GPA and credits. Likewise, male advantages on SAT/ACT
scores lessen gender gaps in GPA and credits at UT-Austin. Finally, at Texas A&M, 42% of the
gender gap in first semester GPA can be explained by females earning more credits in the first
semester. We have omitted from Table 4b the results for high school extracurricular activities (for
Texas A&M and Texas A&M - Kingsville), student's race, parent's income (for UT-Austin and Texas
A&M - Kingsville), parent's education (for UT-Austin), and student's free- or reduced-price lunch
status, foreign-born status, age, limited English proficiency, and non-gifted exceptionality (for
Florida universities). These factors have mostly small and/or insignificant effects on gender gaps.
In Table 5a we show gender gaps in cumulative GPA and credits through three years,
persistence (i.e., attending during the spring of the third year), and graduation for the Texas
universities. Again we see significant female advantages in cumulative GPA ranging from 0.08 to
0.33 and credits ranging from 0.99 to 6.45. The gaps in cumulative credits were again insignificant at
Rice and UT-Austin. At Texas A&M-Kingsville, we find that the male advantage in first semester
credits disappears and becomes a significant male disadvantage by the end of three years.
Additionally, we find significant female advantages in persistence at each of the Florida universities

19
(ranging from 2.5% to 7.0%) and graduation at each of the Texas universities (ranging from 5.4% to
11.1%).7
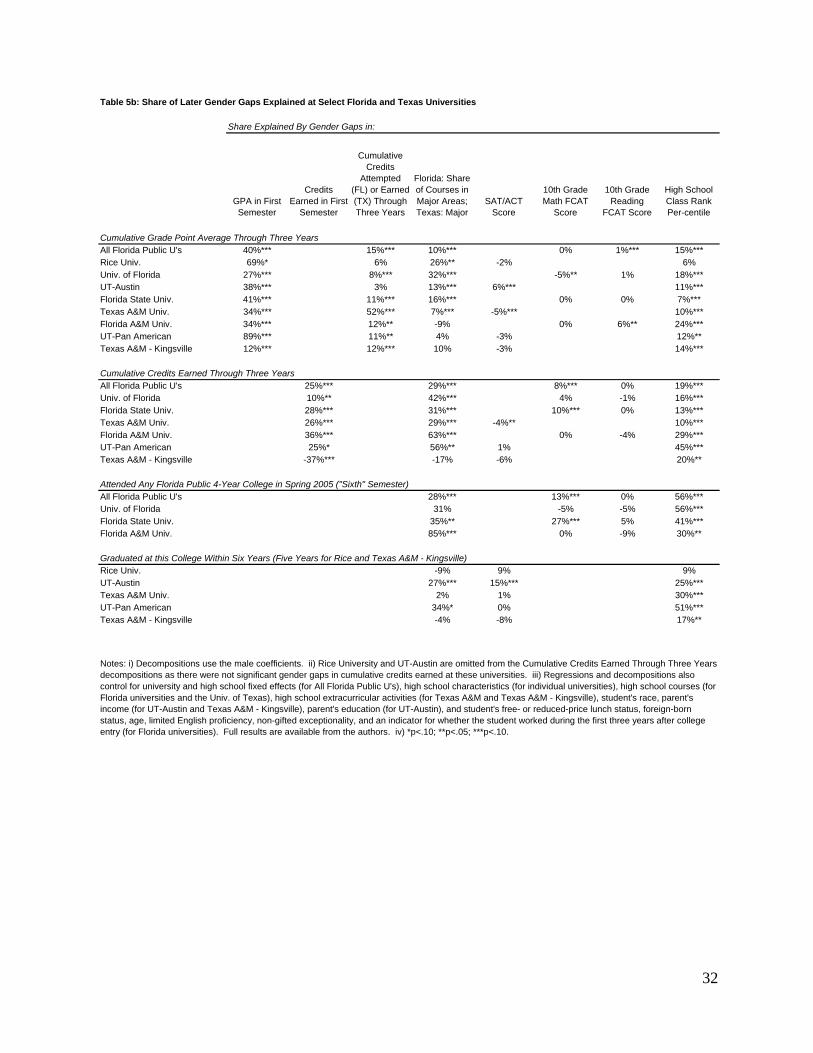
Table 5b shows the decomposition results for these outcomes. Gaps in cumulative GPA is
largely explained by gaps in first semester GPA for each institution ranging from 12% to 89%.
Gaps in cumulative credits attempted also significantly explains gaps in cumulative GPA at six of the
eight universities, and explains 52% of the gap in cumulative GPA at Texas A&M. Students college
course-taking or major choice significantly explains gaps in cumulative GPA at five of the eight
universities, while gaps in high school class rank explains gaps in cumulative GPA at seven of the
eight universities. This latter result is important: gender gaps in high school performance
significantly presage gender gaps in college performance that arise after the first semester. Finally,
differences in test scores explain very little of cumulative GPA gaps at these universities. We also
control for a variety of other factors including whether the student worked for wages during the first
three years of college (see the notes at the bottom of Table 5b). None of these other factors
substantially explained gender gaps in cumulative GPA.
With the exception of Texas A&M Kingsville, the results for cumulative credits through three
years are consistent with those for cumulative GPA, and are perhaps more striking. Gaps in credits
earned in the first semester account for 10% to 36% of gaps in cumulative credits. Differences in
college course-taking and major choice contain sizable predictive power, explaining 29% to 63% of
gender gaps in cumulative credits. And, gaps in high school GPA again contribute 10% to 45%.
Cumulatively, the factors that we control explain 59% to 133% of the gaps in cumulative GPA (see
Table 5a). Texas A&M-Kingsville is notably different from the other institutions, as was previously
noted, as males took more credits than their female classmates in the first semester.
7 In results not shown, with the exception of Rice, we find gaps in persistence at the Texas universities ranging from 1.6% to 8.8%. At Rice, we find males are slightly more likely to persist (0.8%) but significantly less likely to graduate within five years (6.1%).

20
For persistence at the Florida colleges, differences in college course-taking explain 31%-85% and
gaps in high school class rank explain 30%-56% of gaps in persistence. At Florida State University,
controlling for other factors, 10th grade math scores are negatively related to persistence and thus
male advantages in 10th grade math scores explain 27% of the gender gap in persistence at FSU.
For graduation at the Texas colleges, differences in college major have strong explanatory power
at UT-Austin and UT-Pan American, but do not explain gaps in graduation at Rice, Texas A&M, or
Texas A&M - Kingsville. Gaps in high school class rank significantly explain 17% to 51% of gaps in
graduation at four of the five Texas universities, Rice being the exception. At UT-Austin,
controlling for other factors, higher SAT/ACT scores are associated with lower likelihood of
graduation. Thus the male advantage in SAT/ACT scores at UT-Austin explains 15% of the gender
gap in graduation.
To summarize, our analysis of gender gaps across eight institutions of differing quality,
characteristics, and in two different states suggest two major findings: females outpace males in
nearly all institutions and, with some exceptions, the drivers of the gaps are remarkably similar.
7. Conclusions
After decades of research aimed at explaining why girls are less likely to enroll in college than
boys, the attention has recently shifted to the relatively dismal performance of boys at the post-
secondary level. The female advantage persists after enrollment, with females now graduating
college at higher rates than males. In this paper, we examine what happens when boys and girls of
equal prior preparation and family background reach the same college, where boys fall behind, and
why. Specifically, we use administrative data on post-secondary entrants in two of the largest states
in the nation—Texas and Florida—both to quantify gender gaps in college performance and to
provide some explanations.

21
Given that females are more likely than males to enroll in college and, consequently, more likely
to be drawn from lower levels of the unobserved motivation or ability distribution, it is not clear that
females should still outperform males once in college. Our data suggest that, indeed, they do.
Across all 11 public 4-year institutions in Florida, for instance, males earn 0.43 fewer credits than
females in their first semester, and earn even fewer in later semesters, such that by the end of their
sixth semester, males have a cumulative disadvantage of 6.6 credits. Males also earn lower grades
than females in each year of college, with a gender GPA gap for Florida entrants of approximately
0.20 in each semester. In the five Texas universities that we examined for which college completion
could be determined, males are also less likely to graduate.
To explain these differential outcomes, we estimate a series of regressions of gender gaps in
outcomes for all of the Florida entrants and entrants into individual institutions. We begin our
discussion with the factors that appear not to be driving the gaps. Among Florida entrants, we find
that the gaps are mostly robust to controls for demographics (e.g. race/ethnicity) and educational
needs (LEP and exceptionality), high school fixed effects, 10th grade achievement scores, and
advanced high school course-taking. In fact, differences in 10th grade achievement scores and the
high schools attended currently advantage males in college. In addition, the gaps are remarkably
unaltered by the addition of college campus fixed effects.
Instead, what single-handedly substantially reduces the gap at all of these institutions are the
gender gaps in high school class rank percentiles, a measure of their grades relative to their peers in
their high schools. Females earn higher high school grades and class ranks, and these rankings are
far more predictive of credits and collegiate GPA than any other variable in the model, including
high school achievement scores. High school grades also substantially predict college-level
cumulative grades and credits, controlling for first semester grades and credits. This finding is
consistent with other research that points to the tremendous importance of high school grades and,

22
more generally, non-cognitive abilities in predicting success in post-secondary institutions and the
labor market (Bowen and Bok 1998; Heckman and Krueger 2005).
We also find that males are disadvantaged by choosing majors associated with lower GPAs,
lower credits, and lower rates of persistence. For instance, the courses that male college entrants in
Florida take (which are disproportionately in Business, Engineering / Computer Science and Natural
and Physical Sciences) explain 10% of their lower cumulative GPAs, 29% of their lower cumulative
credits, and 28% of their lower likelihood of persistence, conditional on first semester performance.
Finally, though we reduce the gaps substantially with our observables, we are unable to reduce them
to zero in most cases. Thus, despite controls for backgrounds, educational needs, high school
quality and performance, and college quality and major, males are still falling behind. There are
several remaining explanations that we have not addressed. For instance, there is some evidence that
females are more likely to apply for, receive, and respond to tuition and other post-secondary
supports, which lowers the cost of school and may increase their probability of graduation (Angrist,
Lang, and Oreopoulos 2006; Dynarski 2007). Others find that females have greater incentives to
do well in college given male-female differentials in the stability or quality of the returns to a college
degree (Charles and Luoh 2003; DiPrete and Buchmann 2006). Our findings suggest that either our
measure of high school grades does not fully hold these factors constant, or that they grow over
time. Put differently, females non-cognitive advantages (e.g. applying for financial aid) and
incentives to attain may increase as they progress through school.
References
Angrist, Joshua, Daniel Lang, and Philip Oreopoulos. 2006. Lead Them to Water and Pay Them to
Drink: An Experiment with Services and Incentives for College Achievement. NBER Working
Papers 12790.

23
Blau, Francine D. 1998. Trends in the Well-Being of American Women, 1970-1995. Journal of
Economic Literature 36 (March): 112-65.
Bowen, William G., and Derek C. Bok. 1998. The Shape of the River: Long-Term Consequences of
Considering Race in College and University Admissions. Princeton, NJ: Princeton University Press.
Charles, Kerwin K., and Ming-Ching Luoh. 2003. Gender Differences in Completed Schooling. The
Review of Economics and Statistics 85 (3): 559-77.
DiPrete, Thomas, and Claudia Buchmann. 2006. Gender-Specific Trends in the Value of Education
and the Emerging Gender Gap in College Completion. Demography 43 (1): 1-24.
Dynarski, Susan. 2007. Cradle to College: The Puzzle of Gender Differences in Educational
Outcomes. Working paper.
Gibbs, Nancy. 2008. Affirmative Action for Boys. Time Magazine, April 3. [accessed 20 August 2008].
Available from http://www.time.com/time/magazine/article/0,9171,1727693,00.html.
Heckman, James J., and Alan B. Krueger. 2005. Inequality in America: What Role for Human Capital
Policies? Cambridge, MA: The MIT Press.
Jacob, Brian A. 2002. Where the boys aren't: Non-cognitive skills, returns to school and the gender
gap in higher education. Economics of Education Review 21 (6): 589-98.
Jacobs, Jerry A. 1999. Gender and the Stratification of Colleges. The Journal of Higher Education 70 (2):
161-87.
Jones, Ethel B., and John D. Jackson. 1990. College Grades and Labor Market Rewards. Journal of
Human Resources 25 (2): 253-66.
Kane, Thomas J., and Cecilia E. Rouse. 1995. Labor Market Returns to two- and four-year colleges.
The American Economic Review 85 (3): 600-14.

24
LoGerfo, Laura, Austin Nichols, and Duncan Chaplin. 2006. Gender gaps in math and reading gains
during elementary and high school by race and ethnicity. The Urban Institute. [accessed 13 February
2008]. Available from http://www.urban.org/publications/411428.html.
Long, Mark C. Forthcoming. Changes in the Returns to Education and College Quality. Economics of
Education Review.
Long, Mark, Patrice Iatarola, and Dylan Conger. 2009. Explaining Gaps in Readiness for College-
Level Math: The Role of High School Courses. Education Finance and Policy 4 (1): 1-33.
Peter, Katharin, and Laura Horn. 2005. Gender differences in participation and completion of undergraduate
education and how they have changed over time. Washington, DC: National Center for Education
Statistics, U.S. Department of Education. (NCES 2005–169)
Reynolds, John R., and Stephanie W. Burge. 2004. Gender-related changes in educational
expectations: The roles of family, school, and race/ethnicity. Working paper. [accessed 15
February 2008]. Available from http://garnet.acns.fsu.edu/~jreynold/socofed-submitted.pdf.
Riegle-Crumb, Catherine. No-date. More girls go to college: Academic and social factors behind the
female postsecondary advantage. Working paper. [accessed 12 February 2008]. Available from
http://theop.princeton.edu/workingpapers.html.
Rothstein, Jesse M. 2004. College performance predictions and the SAT. Journal of Econometrics 121
(1-2): 297-314.
Snyder, Thomas D., Sally A. Dillow, and Charlene M. Hoffman. 2008. Digest of Education Statistics
2007. Washington, DC: National Center for Education Statistics, Institute of Education Sciences,
U.S. Department of Education. (NCES 2008-022)
Turner, Sarah, and William Bowen. 1999. Choice of Major: The Changing (Unchanging) Gender
Gap. Industrial Labor Relations Review 52 (2): 289-313.

25
Figure 1:
Male's Declining Share of College Enrollment and BA Completion
0.40
0.50
0.60
0.70
0.80
1947
1952
1957
1963
1968
1973
1978
1983
1988
1993
1998
2003
Source: Digest of Education Statistics, 2007.
Male share ofhigh schoolcompleters
Male share ofenrollment inpostsecondarydegree-grantinginstitutions
Male share ofBA recipients

26
FemaleMale-Female
differenceFemale Mean
Male-Female difference
GPAFall 2002 2.90 -0.17*** 3.11 -0.07***Spring 2003 2.90 -0.19*** 3.10 -0.09***Fall 2003 2.92 -0.17*** 3.05 -0.12***Spring 2004 2.99 -0.19*** 3.07 -0.15***Fall 2004 3.06 -0.21*** 3.11 -0.19***Spring 2005 3.09 -0.21*** 3.11 -0.20***Cumulative through Spring 2005 2.89 -0.23*** 3.11 -0.13***
Credits EarnedFall 2002 11.3 -0.43*** 12.0 -0.07*Spring 2003 11.7 -0.68*** 12.4 -0.30***Fall 2003 11.4 -0.58*** 12.0 -0.35***Spring 2004 11.4 -0.57*** 11.8 -0.38***Fall 2004 11.5 -0.93*** 11.8 -0.85***Spring 2005 11.6 -0.79*** 11.7 -0.78***Cumulative through Spring 2005 67.7 -6.56*** 79.9 -3.64***
% who reach 6th semester 79% -5.1%***
Table 1: Gender Differences in GPA, Credits Earned, and Persistence, All 11 4-Year Florida Public Universities
NOTES: i) Both samples include students who graduated from a Florida public high school in 2002 and who enrolled in a Florida state university in the fall of 2002. The overall sample refers to students who were enrolled in the respective semester, regardless of whether they were enrolled in previous or later semesters. In the Fall of 2002, the overall sample included 25,612 students. The continuously enrolled sample consists of students who were enrolled in all 6 semesters. ii) * p<.10; **p<.05; ***p<.01.
Overall SampleContinuously Enrolled Sample (N=18,364)

27
Grade Point Average: Females: 2.90 62.2%*** 58.9%***Grade Point Average: Males: 2.73Raw Gender Gap = -0.17***
Male-Female Difference in Observables Overall Male Female
Using Male Coefficients
Using Female Coefficients
Male -0.068***[0.010]
First Semester Credits Attempted 0.073 0.014*** 0.015*** 0.013*** -0.6% -0.6%[0.002] [0.003] [0.002]
Standardized 10th Grade Math 0.193*** 0.029** 0.002 0.049*** -0.6% -5.6%***[0.012] [0.018] [0.016]
Standardized 10th Grade Reading -0.056*** 0.087*** 0.083*** 0.088*** 2.7%*** 2.9%***[0.012] [0.019] [0.015]
High School Rank Percentile 4.56*** -0.027*** -0.027*** -0.089*** 72.8%*** 74%***[0.000] [0.001] [0.001]
High School AP/IB Courses: -3.1%* -1.5%Math 0.090*** 0.101*** 0.121*** 0.082***
[0.013] [0.021] [0.016]Science 0.069*** 0.051*** 0.059*** 0.050***
[0.013] [0.021] [0.017]English -0.057*** 0.086*** 0.086*** 0.085***
[0.013] [0.022] [0.016]Social Studies 0.007 0.082*** 0.097*** 0.066***
[0.012] [0.021] [0.016]Foreign Language 0.002 0.034** 0.063** 0.017
[0.017] [0.029] [0.021]Race 0.6% -0.7%
Black -0.048*** -0.013 0.029 -0.031[0.019] [0.034] [0.023]
Hispanic 0.000 -0.011 -0.004 -0.019[0.019] [0.030] [0.024]
Asian 0.010*** -0.005 0.034 -0.039[0.022] [0.035] [0.030]
Free or Reduced-Price Lunch -0.033*** -0.033** -0.010 -0.044** -0.2% -0.9%**[0.015] [0.025] [0.018]
Foreign-Born 0.003 0.053*** 0.044 0.052** -0.1% -0.1%[0.018] [0.030] [0.023]
Age as of 2002 0.073*** 0.012 0.011 0.014 -0.4% -0.6%[0.011] [0.017] [0.014]
LEP 0.000 0.058*** 0.106*** 0.03 0% 0%[0.023] [0.037] [0.029]
Non-Gifted Exceptionality 0.020*** 0.006 -0.007 0.03 0.2% -0.3%[0.031] [0.044] [0.045]
University Fixed Effect -0.6% -0.9%
High School Fixed Effect -8.4%*** -6.9%***
Number of observations 25,612 10,249 15,363Note: *p<.10; **p<.05; ***p<.10.
Table 2: Regression and Decomposition of First Semester Grade Point Average, All Florida Public Universities
Total Explained
Regressions Decomposition

28
Credits Earned: Females: 67.7 78.6%*** 68.4%***Credits Earned: Males: 61.1Raw Gender Gap = -6.6***
Male-Female Difference in Observables Overall Male Female
Using Male Coefficients
Using Female Coefficients
Male -2.2***[0.3]
First Semester Credits Earned -0.43*** 3.7*** 3.8*** 3.5*** 24.6%*** 23.1%***[0.0] [0.1] [0.1]
Standardized 10th Grade Math 0.193*** -1.90*** -2.61*** -1.39*** 7.6%*** 4.1%***[0.31] [0.48] [0.39]
Standardized 10th Grade Reading -0.056*** -0.44 -0.59 -0.33 -0.5% -0.3%[0.27] [0.44] [0.35]
High School Rank Percentile 4.56*** -0.28*** -0.28*** -0.27*** 19.2%*** 19%***[0.01] [0.02] [0.02]
Share of College Credits in: 28.9%*** 21.9%***Agriculture -0.001 15.0*** 21.3** 9.4
[5.2] [9.8] [6.5]Architecture 0.000 8.2*** 7.2 11.5***
[3.1] [5.1] [3.9]Business 0.015*** 19.9*** 25.1*** 16.9***
[2.3] [3.5] [3.1]Education -0.025*** 34.7*** 49.9*** 33.3***
[2.6] [6.5] [3.3]Engineering/Computer Science 0.048*** 10.1*** 15.7*** 3.8
[2.5] [3.6] [3.9]Fine Arts -0.002 -6.7*** -8.2** -4.4
[2.4] [3.7] [3.3]Health -0.028*** 26.5*** 40.0*** 24.6***
[2.8] [5.9] [3.6]Humanities -0.010*** -23.8*** -20.5*** -24.3***
[2.4] [3.6] [3.2]Natural/Physical Sciences 0.028*** -10.5*** -11.2*** -8.9***
[2.3] [3.4] [3.2]Social Sciences -0.013*** -4.9** -5.7 -4.3
[2.4] [3.6] [3.2]Social Work -0.006*** 22.6*** 49.2*** 20.6***
[4.3] [11.6] [5.0]Technical/Vocational 0.000 38.4*** 44.4*** 36.7***
[3.0] [5.1] [3.8]Communications -0.008*** 31.8*** 34.0*** 32.0***
[3.1] [5.3] [3.9]
Number of observations 25,612 10,249 15,363
Notes: i) Regressions and decompositions also include: student's high school coursetaking, race, and age; indicators of the student's free- or reduced-price lunch status, foreign born, limited English proficiency, non-gifted exceptionality, and worked during the years 2002-03 to 2004-05; and high school and university fixed effects. Full results are available from the authors. ii) *p<.10; **p<.05; ***p<.10.
Table 3: Regression and Decomposition of Cumulative Credits through Spring 2005 ("Sixth" Semester), All Florida Public Universities
Total Explained
Regressions Decomposition

29
N Female Mean Male Mean Difference Total Explained
First Semester Grade Point AverageAll Florida Public U's 25,612 2.90 2.73 0.17*** 62%***Rice Univ. 613 3.37 3.28 0.09* 25%Univ. of Florida 5,091 3.30 3.23 0.07*** 62%***UT-Austin 7,222 3.04 2.89 0.15*** 8%Florida State Univ. 4,621 2.91 2.69 0.21*** 51%***Texas A&M Univ. 6,561 2.89 2.73 0.16*** 62%***Florida A&M Univ. 1,453 2.51 2.30 0.21*** 67%***UT-Pan American 1,537 2.22 2.00 0.22*** 49%***Texas A&M - Kingsville 1,092 2.53 2.23 0.29*** 43%**
First Semester Credits EarnedAll Florida Public U's 25,612 11.35 10.92 0.43*** 72%***Rice Univ. 613 14.75 14.80 -0.05 --Univ. of Florida 5,091 11.55 11.37 0.18** 65%***UT-Austin 7,222 16.55 16.57 -0.02 --Florida State Univ. 4,621 11.90 11.52 0.38*** 57%***Texas A&M Univ. 6,561 12.25 11.81 0.44*** 40%***Florida A&M Univ. 1,453 11.88 11.02 0.86*** 64%***UT-Pan American 1,537 6.81 6.49 0.32* 12%Texas A&M - Kingsville 1,092 10.37 11.51 -1.14*** 27%**
Notes: i) Decompositions use the male coefficients. ii) *p<.10; **p<.05; ***p<.10.
Table 4a: Share of First Semester Gender Gaps Explained at Select Florida and Texas Universities
30
Table 4b: Share of First Semester Gender Gaps Explained at Select Florida and Texas Universities
Share Explained By Gender Gaps in:
Credits Attempted (FL) or Earned (TX)
in First Semester
SAT/ACT Score
10th Grade Math FCAT
Score
10th Grade Reading
FCAT Score
High School Class Rank Per-centile
High School Courses
High School Characte-
ristics (or HS Fixed Effect
for All FL U's)University
Fixed Effect
First Semester Grade Point AverageAll Florida Public U's -1% -1% 3%*** 73%*** -3%* -8%*** -1%Rice Univ. -5% -4% 31%** 7%Univ. of Florida 3%* -13%* 5%* 95%*** -25%*** -8%UT-Austin 0% -26%*** 54%*** -7%** -11%***Florida State Univ. -4%* 6% 3%* 47%*** 1% 0%Texas A&M Univ. 42%*** -12%*** 27%*** 1%Florida A&M Univ. 6%* 0% -1% 66%*** 6% -9%UT-Pan American 5% -2% 43%*** 3%Texas A&M - Kingsville -12%* 3% 41%*** 6%
First Semester Credits EarnedAll Florida Public U's -8%** 2%* 86%*** -7%** -10%** 6%**Univ. of Florida -28%** 5% 117%*** -34%*** -13%Florida State Univ. -3% -1% 68%*** -4% -2%Texas A&M Univ. -11%*** 43%*** -1%Florida A&M Univ. 0% 1% 63%*** 2% -9%UT-Pan American -9% 32%** -9%Texas A&M - Kingsville 7%* -4% 0%
Notes: i) Decompositions use the male coefficients. ii) Rice University and the UT-Austin are omitted from the First Semester Credits Earned decompositions as there were not significant gender gaps in first semester credits earned at these universities. iii) Regressions and decompositions also control for high school extracurricular activities (for Texas A&M and Texas A&M - Kingsville), student's race, parent's income (for UT-Austin and Texas A&M - Kingsville), parent's education (for UT-Austin), and student's free- or reduced-price lunch status, foreign-born status, age, limited English proficiency, and non-gifted exceptionality (for Florida universities). Full results are available from the authors. iv) *p<.10; **p<.05; ***p<.10.

31
Table 5a: Share of Later Gender Gaps Explained at Select Florida and Texas Universities
N Female Mean Male Mean Difference Total Explained
Cumulative Grade Point Average Through Three YearsAll Florida Public U's 25,612 2.89 2.66 0.23*** 75%***Rice Univ. 613 3.42 3.34 0.08** 97%**Univ. of Florida 5,091 3.31 3.18 0.13*** 77%***UT-Austin 7,222 3.01 2.80 0.22*** 64%***Florida State Univ. 4,621 2.94 2.66 0.28*** 69%***Texas A&M Univ. 6,561 2.96 2.75 0.21*** 76%***Florida A&M Univ. 1,453 2.37 2.09 0.27*** 65%***UT-Pan American 1,537 2.19 2.03 0.16*** 113%***Texas A&M - Kingsville 1,092 2.42 2.09 0.33*** 72%***
Cumulative Credits Earned Through Three YearsAll Florida Public U's 25,612 67.74 61.16 6.57*** 78%***Rice Univ. 613 84.34 83.34 1.00 --Univ. of Florida 5,091 78.50 72.74 5.76*** 65%***UT-Austin 7,222 75.94 74.95 0.99 --Florida State Univ. 4,621 74.41 68.68 5.74*** 90%***Texas A&M Univ. 6,561 73.34 67.73 5.62*** 59%***Florida A&M Univ. 1,453 65.13 58.69 6.45*** 133%***UT-Pan American 1,537 25.84 22.55 3.29*** 131%***Texas A&M - Kingsville 1,092 50.07 44.00 6.07*** -24%
Attended Any Florida Public 4-Year College in Spring 2005 ("Sixth" Semester)All Florida Public U's 25,612 78.9% 73.9% 5.1%*** 103%***Univ. of Florida 5,091 91.3% 88.8% 2.5%*** 61%*Florida State Univ. 4,621 83.1% 78.2% 5%*** 107%***Florida A&M Univ. 1,453 76.8% 69.7% 7%*** 136%***
Graduated at this College Within Six Years (Five Years for Rice and Texas A&M - Kingsville)Rice Univ. 613 95.1% 89.0% 6.1%*** 5%Univ. of Texas 7,222 73.5% 64.2% 9.3%*** 45%***Texas A&M Univ. 6,561 83.4% 77.0% 6.4%*** 25%**UT-Pan American 1,537 16.4% 10.9% 5.4%*** 90%***Texas A&M - Kingsville 1,092 30.1% 19.0% 11.1%*** 23%
Notes: i) Decompositions use the male coefficients. ii) *p<.10; **p<.05; ***p<.10.
32
Table 5b: Share of Later Gender Gaps Explained at Select Florida and Texas Universities
Share Explained By Gender Gaps in:
GPA in First Semester
Credits Earned in First
Semester
Cumulative Credits
Attempted (FL) or Earned (TX) Through Three Years
Florida: Share of Courses in Major Areas; Texas: Major
SAT/ACT Score
10th Grade Math FCAT
Score
10th Grade Reading
FCAT Score
High School Class Rank Per-centile
Cumulative Grade Point Average Through Three YearsAll Florida Public U's 40%*** 15%*** 10%*** 0% 1%*** 15%***Rice Univ. 69%* 6% 26%** -2% 6%Univ. of Florida 27%*** 8%*** 32%*** -5%** 1% 18%***UT-Austin 38%*** 3% 13%*** 6%*** 11%***Florida State Univ. 41%*** 11%*** 16%*** 0% 0% 7%***Texas A&M Univ. 34%*** 52%*** 7%*** -5%*** 10%***Florida A&M Univ. 34%*** 12%** -9% 0% 6%** 24%***UT-Pan American 89%*** 11%** 4% -3% 12%**Texas A&M - Kingsville 12%*** 12%*** 10% -3% 14%***
Cumulative Credits Earned Through Three YearsAll Florida Public U's 25%*** 29%*** 8%*** 0% 19%***Univ. of Florida 10%** 42%*** 4% -1% 16%***Florida State Univ. 28%*** 31%*** 10%*** 0% 13%***Texas A&M Univ. 26%*** 29%*** -4%** 10%***Florida A&M Univ. 36%*** 63%*** 0% -4% 29%***UT-Pan American 25%* 56%** 1% 45%***Texas A&M - Kingsville -37%*** -17% -6% 20%**
Attended Any Florida Public 4-Year College in Spring 2005 ("Sixth" Semester)All Florida Public U's 28%*** 13%*** 0% 56%***Univ. of Florida 31% -5% -5% 56%***Florida State Univ. 35%** 27%*** 5% 41%***Florida A&M Univ. 85%*** 0% -9% 30%**
Graduated at this College Within Six Years (Five Years for Rice and Texas A&M - Kingsville)Rice Univ. -9% 9% 9%UT-Austin 27%*** 15%*** 25%***Texas A&M Univ. 2% 1% 30%***UT-Pan American 34%* 0% 51%***Texas A&M - Kingsville -4% -8% 17%**
Notes: i) Decompositions use the male coefficients. ii) Rice University and UT-Austin are omitted from the Cumulative Credits Earned Through Three Years decompositions as there were not significant gender gaps in cumulative credits earned at these universities. iii) Regressions and decompositions also control for university and high school fixed effects (for All Florida Public U's), high school characteristics (for individual universities), high school courses (for Florida universities and the Univ. of Texas), high school extracurricular activities (for Texas A&M and Texas A&M - Kingsville), student's race, parent's income (for UT-Austin and Texas A&M - Kingsville), parent's education (for UT-Austin), and student's free- or reduced-price lunch status, foreign-born status, age, limited English proficiency, non-gifted exceptionality, and an indicator for whether the student worked during the first three years after college entry (for Florida universities). Full results are available from the authors. iv) *p<.10; **p<.05; ***p<.10.

33
Appendix Table 1: Selectivity of Florida and Texas Universities
UniversityBarron's Guide Year
College Adminissions Selector*
Median SAT
Critical Reading
Median SAT Math
Median Composite
ACT
Percent of Applicants Accepted
Percent White
Percent African
American
Percent Hispanic
Percent Asian
American
Balance: Percent
Not Listed
Rice Univ. 1999 Most Competitive 27 80 202005 Most Competitive 24 53 11 15 21
Univ. of Florida 1999 Highly Competitive 614 630 27 54 77 232005 Most Competitive 625 642 27 48 76 13 11
UT-Austin 1999 Very Competitive 595 617 25 78 66 13 11 102005 Highly Competitive 600 630 25 47 59 13 14 14
Florida State Univ. 1999 Very Competitive 73 76 11 132005 Highly Competitive 590 600 25 59 71 12 17
Texas A&M Univ. 1999 Very Competitive 570 600 73 80 11 92005 Highly Competitive 580 610 25 67 76 24
Florida A&M Univ. 1999 Competitive 20 67 10 86 42005 Competitive 71 94 6
UT-Pan American 1999 Noncompetitive 87 132005 Less Competitive 18 72 87 13
Texas A&M - Kingsville 1999 Less Competitive 17 69 29 62 92005 Less Competitive 29 62 9
Source: 1999 and 2005 Barron's Profiles of American Colleges .Note: Mean SAT Scores shown for UT-Austin for 1999.

34
Male Female Sig. Diff. Male Female Sig. Diff.White 57.4% 55.3% *** 67.0% 63.0% ***Black 21.2% 23.2% *** 14.0% 19.0% ***Hispanic 17.7% 17.8% 13.0% 13.0%Asian 2.5% 2.4% 5.0% 4.0% ***Received Free- or Reduced-Price Lunch 39.7% 40.3% ** 19.0% 23.0% ***Age in 2002 18.72 18.54 *** 18.38 18.31 ***Foreign Born 12.5% 12.9% ** 10.3% 10.0%Limited English Proficient 14.5% 14.4% 8.0% 9.0%Non-Gifted Exceptionality 17.1% 8.8% *** 4.0% 2.0% ***Standardized 10th Grade Math Score 0.271 0.211 *** 0.956 0.763 ***Standardized 10th Grade Reading Score 0.133 0.312 *** 0.770 0.826 ***High School Class Rank Percentile 37.2 28.7 *** 20.8 16.2 ***Took AP/IB Math Course 8.0% 8.6% *** 36.7% 27.7% ***Took AP/IB English Course 8.1% 9.2% *** 35.9% 41.6% ***Took AP/IB Science Course 8.7% 14.7% *** 33.6% 26.7% ***Took AP/IB Social Studies Course 10.9% 15.2% *** 43.1% 42.4%Took AP/IB Foreign Language Course 4.3% 6.7% *** 14.8% 14.7%PSE Credits: Agriculture 0.5% 0.6%PSE Credits: Architecture 0.6% 0.6%PSE Credits: Business 7.5% 6.0% ***PSE Credits: Education 0.8% 3.3% ***PSE Credits: Engineering & Computer Sci. 7.2% 2.4% ***PSE Credits: Art 6.2% 6.4%PSE Credits: Health 1.5% 4.3% ***PSE Credits: Humanities 21.6% 22.6% ***PSE Credits: Math and Science 28.5% 25.7% ***PSE Credits: Social Science 18.1% 19.3% ***PSE Credits: Social Work 0.2% 0.9% ***PSE Credits: Technical & Vocational 1.3% 1.3%PSE Credits: Communications 2.5% 3.4% ***Worked During First Year in PSE 70.8% 70.7%Worked During First Three Years in PSE 89.3% 88.9%High School's Percent FRPL 44.4% 44.7% *** 38.1% 39.1% ***High School's Mean 10th Grade Math Score 0.018 0.022 ** 0.171 0.150 ***High School's Mean 10th Grade Reading Score 0.014 0.020 *** 0.159 0.142 ***
Florida A&M University 6.0% 5.2% ***Florida Atlantic University 6.1% 6.0%Florida Gulf Coast University 2.7% 2.5%Florida International University 7.8% 7.7%Florida State University 18.3% 17.6%University of Central Florida 16.0% 19.1% ***University of Florida 19.6% 20.3%University of North Florida 5.9% 5.8%University of South Florida 15.3% 13.4% ***University of West Florida 2.4% 2.4%
Appendix Table 2: Differences in Mean Characteristics of Florida High School Graduates and Enrollees at Florida Public Universities
NOTES: i) AP/IB refers to advanced placement or international baccalaureate. ii) "PSE Credits" is share of cumulative credits through the 6th semester. iii) * p<.10; **p<.05; ***p<.01.
High School Graduates FL Public Univ. Enrollees