WHSD TSC Data
32
WHSD TSC Data District Tax and Revenue and Spending Trends
-
Upload
freya-crosby -
Category
Documents
-
view
43 -
download
0
description
WHSD TSC Data. District Tax and Revenue and Spending Trends. Department of Education Guidelines Questions. - PowerPoint PPT Presentation
Transcript of WHSD TSC Data

WHSD TSC Data
District Tax and Revenue and Spending Trends

Department of Education Guidelines Questions
• Has the school district experienced any major changes that could dramatically impact the tax base? Are any anticipated? These could include new housing developments, a new shopping center, or the opening or closing of a large business.
• How has the assessed value of taxable property in the school district changed each year over the last five years? How has it changed for residential property only?
• How has the EIT base of the school district changed each year over the last five years?
• How has the PIT base of the school district changed each year over the last five years?
• How are each of these tax bases projected to increase in the coming years? What are the implications for ensuring that the schools have sufficient revenue?

Department of Education Guideline Questions
• What proportion of the school district is at retirement age? Near retirement age?• What percent of households are homeowners and what percent are renters?• What is the average household income in the school district? What is the average
income of homeowners? Of renters?• What percentage of senior citizens would be eligible for Property Tax/Rent Rebate
program?• Which taxes does the school district currently levy?• How much of the school district’s local revenue comes from each type of tax that the
school district levies?• What other local taxes do residents of the school district pay – including county and
municipal property taxes and municipal Earned Income Taxes?• What is the local tax burden for a typical household in the school district?• What is the effect of the local tax burden on different types of households – including
retired homeowners, moderate-income homeowners, high-income homeowners and renters? Note that the expansion of the Property Tax/Rent Rebate Program will reduce the tax burden on some senior citizen residents of the school district.
• What combination of local income and property taxes seems most equitable for the school district’s population?

District Revenue Trends: Nominal vs. Real
WHSD Revenue Trends
$28,000,000
$30,000,000
$32,000,000
$34,000,000
$36,000,000
$38,000,000
$40,000,000
$42,000,000
$44,000,000
$46,000,000
$48,000,000
1992 1994 1996 1998 2000 2002 2004 2006
Nominal Revenues
Real Revenues
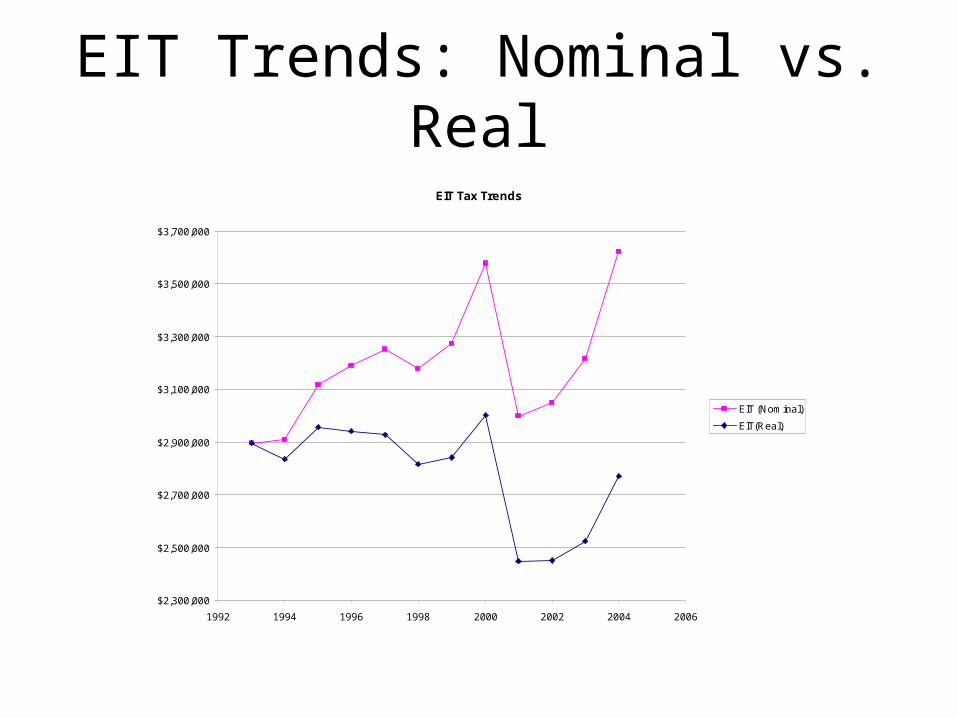
EIT Trends: Nominal vs. Real
EIT Tax Trends
$2,300,000
$2,500,000
$2,700,000
$2,900,000
$3,100,000
$3,300,000
$3,500,000
$3,700,000
1992 1994 1996 1998 2000 2002 2004 2006
EIT (Nominal)
EIT(Real)

EIT as % of District Revenues
EIT as Pecent of Revenue
6.00%
6.50%
7.00%
7.50%
8.00%
8.50%
9.00%
9.50%
1992 1994 1996 1998 2000 2002 2004 2006
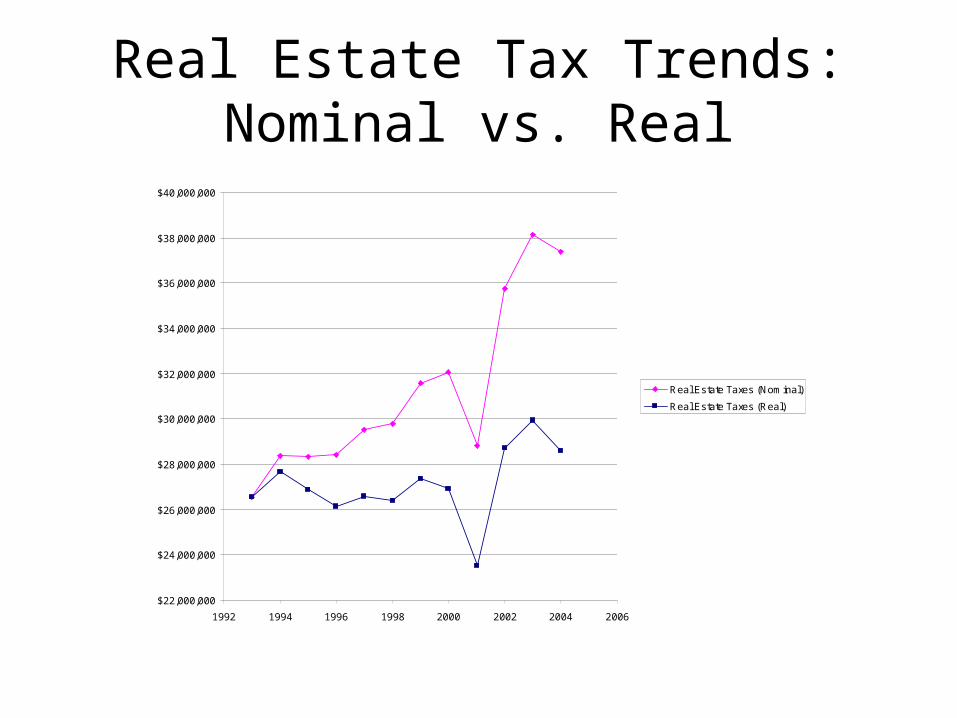
Real Estate Tax Trends: Nominal vs. Real
$22,000,000
$24,000,000
$26,000,000
$28,000,000
$30,000,000
$32,000,000
$34,000,000
$36,000,000
$38,000,000
$40,000,000
1992 1994 1996 1998 2000 2002 2004 2006
Real Estate Taxes (Nominal)
Real Estate Taxes (Real)

Real Estate Taxes as % of District Revenues
Real Estate Tax as Percent of Revenue
80.50%
81.00%
81.50%
82.00%
82.50%
83.00%
83.50%
1992 1994 1996 1998 2000 2002 2004 2006

WHSD Enrollment TrendEnrollment
5500
5600
5700
5800
5900
6000
6100
6200
1992 1994 1996 1998 2000 2002 2004 2006

Real Revenue Per Student (1994 dollars)
Real Revenue per Student (1994 $)
$4,000
$4,500
$5,000
$5,500
$6,000
$6,500
1992 1994 1996 1998 2000 2002 2004 2006
For comparison, PA statewide average expenditure per pupil in 2004 (deflated to 1994 $$) was $7610
(Data from U.S. Statistical Abstract)

WHSD TSC Data
District Tax Burdens

District Demographics (from 2000 Census)What is the average household income in the school district? What is the average income
of homeowners? Of renters?
Borough HouseholdsMedian Income
Braddock 1160 $18,473
Braddock Hills 1018 $30,382
Chalfont 405 $33,125
Churchill 1521 $67,321
East Pittsburgh 948 $21,286
Edgewood 1639 $52,153
Forest Hills 3057 $44,922
North Braddock 2634 $24,335
Rankin 1007 $13,832
Swissvale 4686 $31,523
Turtle Creek 2720 $30,057
Wilkins 3237 $37,439

Real Estate Tax vs. EIT as % of District Revenue
Real Estate Tax vs. EIT as % of Revenue
91%
9%
Real Estate
EIT
Based on average percentage from 1993-2004

Percentage of owners vs. renters in the District
What percent of households are homeowners and what percent are renters? District Renters vs. Owners
58%
42%
Own
Rent
From 2000 Census Data

Estimated % of Senior Homeowners by Municipality
What proportion of the school district is at retirement age? Near retirement age?
Estimated % of Senior Homeowners
0.00%
5.00%
10.00%
15.00%
20.00%
25.00%
30.00%
35.00%
40.00%
45.00%
50.00%
Braddock Braddock
Hills
Chalfont Churchill East
Pittsburgh
Edgewood Forest Hills North
Braddock
Rankin Swissvale Turtle Creek Wilkins

Seniors Eligible for RebatesWhat percentage of senior citizens would be eligible for Property Tax/Rent Rebate program?
Estimate of Senior s E legible f or Gaming Funded Rebates
0
50
100
150
200
250
300
350
Br addock Br addock
Hi l l s
Chal f ont Chur chi l l E ast
P i ttsbur gh
E dgewood For est Hi l ls Nor th
Br addock
Rankin Swissvale T ur tle Cr eek Wilkins

Allegheny County Trends
From the Allegheny Places Housing and Socio-Demographic TrendsPrepared by the University Center for Social and Urban Research
Sabina Deitrick, Christopher Briem, & Angela Williams FosterUniversity of PittsburghPittsburgh, PA 15260
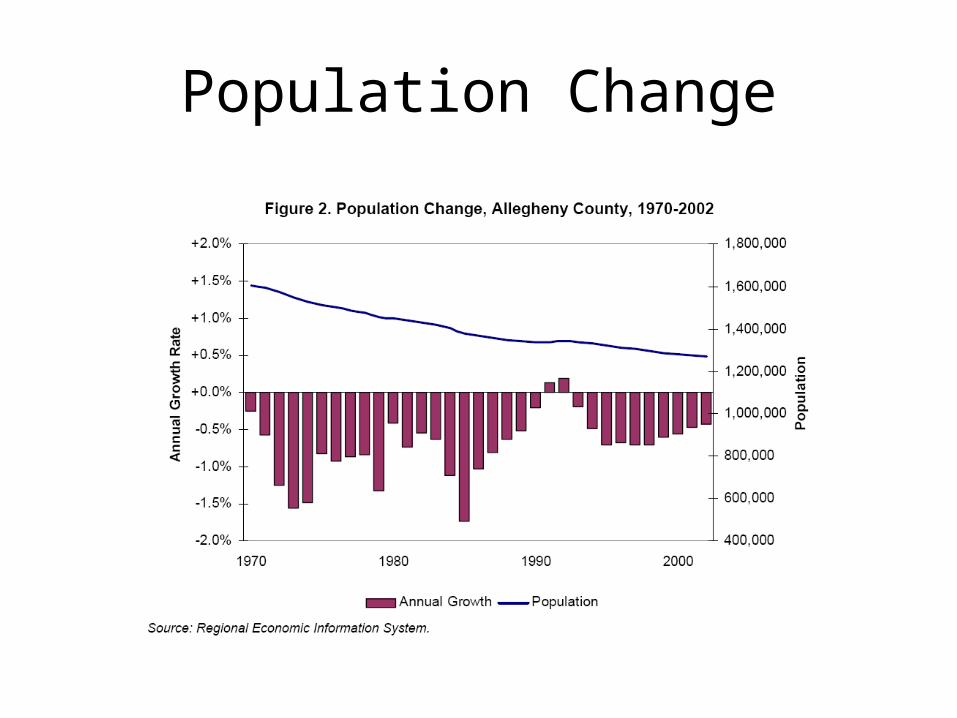
Population Change

Distribution of Population Changes Across Allegheny County

Foreign Migration Trends
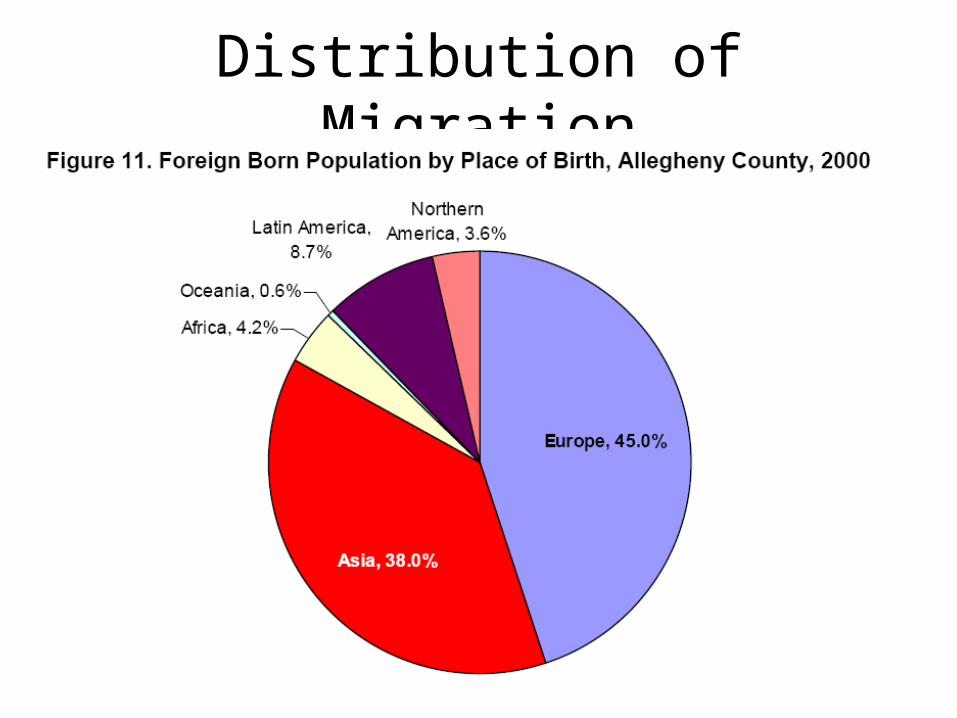
Distribution of Migration

Distribution of Migration

Elderly Population Trends

Population Age 0-64

Distribution of Elderly Population Across County

Top Ten Elderly Municipalities

Compensation Trends Inferred from WHSD EIT Collection Data
Inferred Compensation Trends
$400,000,000
$450,000,000
$500,000,000
$550,000,000
$600,000,000
$650,000,000
$700,000,000
$750,000,000
1992 1994 1996 1998 2000 2002 2004 2006
Compensation (Nominal)
Compensation (Real)

Distribution of Median Household Income Across County
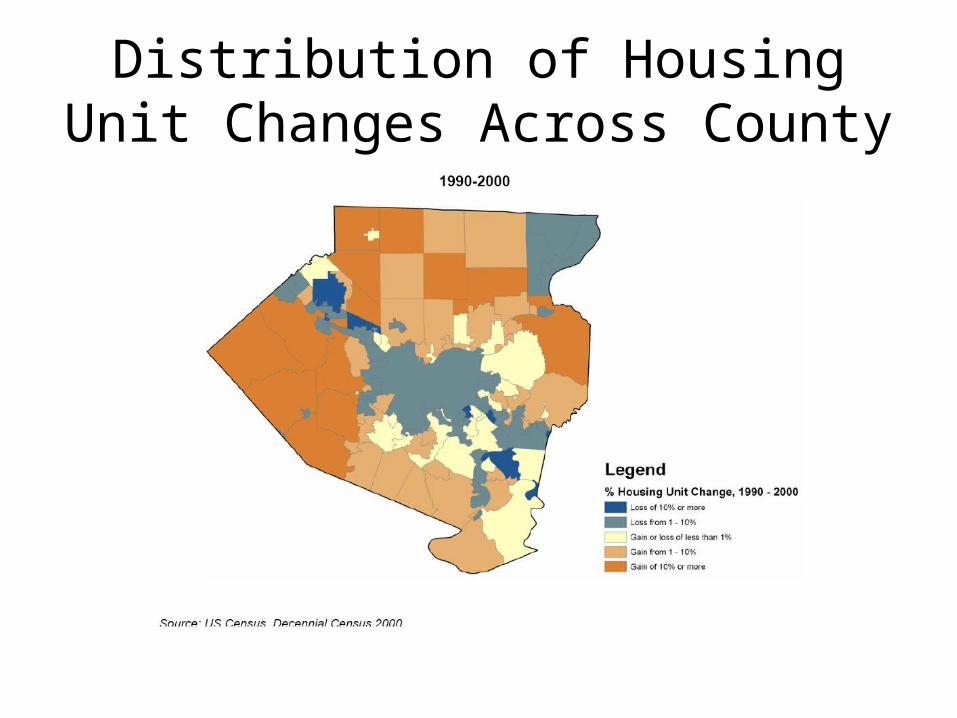
Distribution of Housing Unit Changes Across County
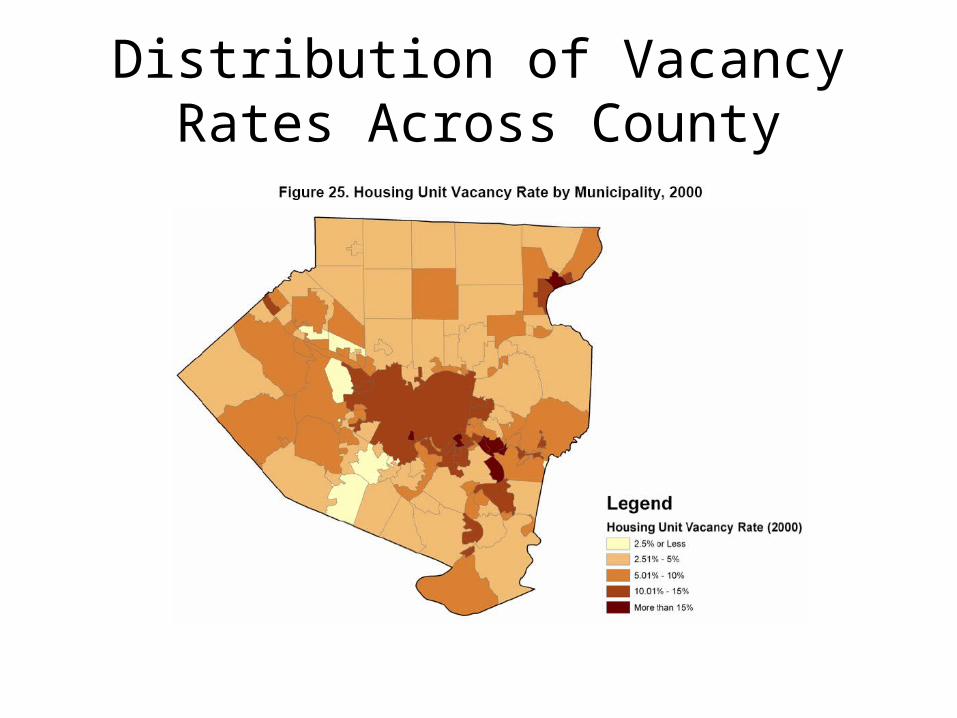
Distribution of Vacancy Rates Across County

Owner Occupied Housing

Population Projections