Whose fate and whose wealth? An analysis of the ...
166
i Whose fate and whose wealth? An analysis of the Bhagyalakshmi scheme in Karnataka Suggestions for creating new pathways to empowerment of girls Public Expenditure Analysis Series 2 of 8 Policy Brief based on this study is also available 2019
Transcript of Whose fate and whose wealth? An analysis of the ...

i
Whose fate and whose wealth? An
analysis of the Bhagyalakshmi scheme in
Karnataka
Suggestions for creating new pathways to
empowerment of girls
Public Expenditure Analysis Series 2 of 8
Policy Brief based on this study is also available
2019

ii
All Rights Reserved @United Nations Children Fund (UNICEF) 2019
This joint report reflects the activities of individual agencies around an issue of common
concern. The principles and policies of each agency are governed by the relevant
decisions of its governing body.
Each agency implements the interventions described in this document in accordance
with these principles and policies and within the scope of its mandate.
The text has not been edited or fact-checked to official publications standards and
UNICEF accepts no responsibility for error.

iii
All Rights Reserved
@United Nations Children Fund (UNICEF) 2019
Research and Writing by the following members of Centre for
Budget and Policy Studies (CBPS), Bangalore:
Jyotsna Jha, Sridhar R. Prasad, Anusha Iyer, Niveditha Menon, Thyagarajan R., Srinivas Alamuru, Puja Minni, Vasudha
Ramakrishnan, Pramod Kumar K.S., Shreekanth Mahendiran, Madhusudhana B V Rao
.
This paper can be quoted in part, with the full citation.
Suggested citation: Jha, Jyotsna, Menon, Niveditha, Iyer, Anusha, P. R. Sridhar and Minni, Puja, Whose fate and whose wealth:
Recommendations for creating new pathways for empowerment of girls, UNICEF and Centre for Budget and Policy Studies, New
Delhi, 2019
Centre for Budget and Policy Studies and United Nations
Children Fund, India.
iv
Table of Contents Executive Summary ..................................................................................................................... 1
Acknowledgements ..................................................................................................................... 6
List of Tables ................................................................................................................................. 7
List of Figures ............................................................................................................................. 10
List of Abbreviations ................................................................................................................. 11
Chapter 1: Introduction ............................................................................................................. 13
1.1. The issue: Gender equality ....................................................................................... 13
1.2. The intervention: Bhagyalakshmi scheme .............................................................. 13
1.3. The framework of the current study and the report ............................................. 21
Chapter 2: Cash Transfers: Experiences, issues and effectiveness ...................................... 23
2.1. Cash transfers in the international context.................................................................. 23
2.1.1. Origins of cash transfers ................................................................................... 23
2.1.2. Documented impact of CCTs ........................................................................... 24
2.1.3. Conditional and unconditional cash transfers ............................................... 26
2.2. Cash transfers in the Indian context: Focusing on the girl child ......................... 27
2.3. First phase: Desk review ........................................................................................... 32
2.3.1. Preconditions ...................................................................................................... 33
2.3.2. Impact enablers .................................................................................................. 34
2.3.3. Critical decision areas ........................................................................................ 36
Chapter 3: Methodology ........................................................................................................... 46
3.1. Qualitative methods .................................................................................................. 47
3.2. Quantitative methods ................................................................................................ 48
3.3. Description of our sample......................................................................................... 49
3.3.1. Social distribution of the households .............................................................. 49
3.3.2. Profile of the respondent ................................................................................... 51
Chapter 4: Functioning of the BL Scheme .............................................................................. 55
4.1 Engagement with enrolment .................................................................................... 57
4.1.1. Targeting BPL families ...................................................................................... 57
4.1.2. Moving against son preference ........................................................................ 65
4.2 Understanding conditionalities ............................................................................... 68
4.2.1 Immunisation.......................................................................................................... 68
4.2.2 Education ................................................................................................................ 73
4.2.3 Child marriage and child labour ......................................................................... 78
4.3 Structural processes of BL ......................................................................................... 82
v
4.3.1 Geographical variation of BL scheme ................................................................. 82
4.3.2 Implementation processes .................................................................................... 86
4.3.3 Budgetary and financial review ........................................................................... 89
Chapter 5: Redesigning BL: Options and Alternatives ........................................................ 95
5.1 MODEL 1: Empowerment Strategies + BL Redesign ............................................ 96
5.1.1 Change in the coverage/eligibility: Universalization of scheme ..................... 96
5.1.2 Comparative cost estimates and advantage ....................................................... 98
5.1.3 Process simplification / reengineering ................................................................ 99
5.1.4 Change in conditionality pertaining to education .......................................... 102
5.1.5 Integration/linking of other education related schemes into BL ................... 104
5.1.6 Scholarships .......................................................................................................... 104
5.1.7 Other provisions ................................................................................................... 108
5.1.8 Empowerment strategies .................................................................................... 110
5.1.9 Pathways to empowerment ................................................................................ 111
5.1.10 Rebranding BL .................................................................................................. 113
5.1.11 Parental death, accidental and disability benefits ....................................... 114
5.2 MODEL 2 – Empowerment Strategies only (Discontinue BL) .......................... 114
5.2.1. (In)efficacy of cash transfers ........................................................................... 114
5.2.2 Social norms and empowerment ....................................................................... 116
5.2.3 Pre-conditions of success .................................................................................... 117
5.2.4 Cost implications .................................................................................................. 119
5.3 MODEL 3 – Empowerment Strategies + Multi-tier cash transfer scheme ....... 119
Chapter 6: Conclusion ............................................................................................................. 123
References ................................................................................................................................. 126
Annexure 1 Table A1. 1: Percentage of households according to the number of
daughters in the household .................................................................................................... 130
Annexure 2 ................................................................................................................................ 139
Annexure 3 ................................................................................................................................ 142
Annexure 4 ................................................................................................................................ 143
Annexure 5 ................................................................................................................................ 144
Annexure 6 ................................................................................................................................ 145
Notes .......................................................................................................................................... 157
Notes .......................................................................................................................................... 158
Notes .......................................................................................................................................... 159
Notes .......................................................................................................................................... 160

1
Executive Summary
When we consider gender equality in Karnataka, we find that Karnataka lags behind on
several social indicators. For instance, Karnataka reported the lowest sex ratio at birth
among four south Indian states that include Andhra Pradesh, Kerala and Tamil Nadu
according to the Census of India 2011 report, and appears to be continually declining, if
we examine the data in the fourth National Family Health Survey (NFHS-IV).
Additional evidence from the Data from the Civil Registration System (CRS) indicates
that while the exact sex ratio at birth varies between 910 and 927 in 2014-15, there is a
disturbing trend of missing girls in the population (Rajanet al, 2017).
In order to tackle the issue of gender disparity in the state, Karnataka introduced a
scheme of conditional cash transfers, known as Bhagyalakshmi (BL), in 2006-07.
According to the scheme, all girl children, subject to certain defined eligibility criteria,
born in BPL families after 31st March 2006, are eligible to be enrolled as beneficiaries
under the scheme. The government issues a bond in the name of the girl child at the
time of enrolment, which is to be encashed once she turns 18, subject to the fulfilment of
defined conditions. The scheme is available only to Below Poverty Line (BPL) or
economically backward households. The rationale for restricting the scheme to BPL
families was to provide financial incentives to resource-poor families so as to improve
gender-friendly outcomes such as lower Maternal Mortality Rate (MMR)parity in birth
as well as higher social outcomes in terms of girl education.
Since its inception in 2006 till March 2015, more than 22 lakh girl children have been
enrolled in the scheme across the state and the government has spent a total of Rs.
4,161.98 crore on the scheme (DWCD Circular, 2014). Currently, the cash transfer is in
the form of a bond issued and managed by the Life Insurance Company (LIC), a public
sector enterprise. At the time of maturity of the bond, which is when the girl turns 18,
she is expected to submit relevant certificates of fulfilling the applicable conditions (e.g.,
immunisation, enrolment to anganwadi, elementary school completion, as listed above)
from the respective departments/authorities to be able to claim the matured amount.
To better understand the ways in which the Bhagya Lakshmi scheme works, the
Department of Women and Child Development (DWCD) Karnataka which implements
the scheme and UNICEF Hyderabad Field office agreed to commission a study on the
current levels of awareness about the scheme and the nature of demand or support (in
addition to cash) that girls who have enrolled for the cash transfer under the

2
Bhagyalakshmi Scheme might require to delay their age for marriage. The Centre for
Budget and Policy Studies (CBPS) was engaged by UNICEF, Hyderabad Field Office as
a knowledge partner to undertake the study. The objectives of the study was to review
the scheme since its inception in 2006-07 from the perspectives of the scheme’s rationale
and objectives, to deepen our understanding of the scheme’s functioning at the field
level, to assess the preliminary impact of the study on its intended recipients, to
document the experiences of stakeholders (including family members, community
members, anganwadi workers, department officials etc.) in administrating the scheme,
and to explore the potential role of Mahila Samakhya (MS) in empowering BL using
their experience with adolescent girls.
In order to address the major objectives, we examined the functioning of the scheme in
three separate, but interconnected areas: (1) in terms of its administration, (2) in terms of
its process, and (3) in terms of its impact. We were able to do a desk review of the
scheme based on the analysis of government notifications, rules and circulars and
budget documents in addition to the review of monitoring data generated through its
management information system (MIS) especially designed for the monitoring of the BL
scheme. Additionally, we also conducted a basic overview of the scheme process based
on preliminary consultations with the DWCD and interviews with various government
officials including the anganwadi workers, the BL supervisors, and the CDPOs. We also
collected primary data through quantitative surveys as well as qualitative focus group
interviews with primary stake holders such as adolescent girls, mothers’ groups,
fathers’ groups, and community members.
Our evaluation of the BL scheme was conducted in two phases. The first phase was a
desk-based study conducted between January 2017 and June 2017. The analysis and
findings from this review was the background for designing the second phase of the
study. This consisted of field-based study conducted between July 2018 to March 2019
with the objective of gaining a deeper understanding of the scheme and redesigning the
scheme in collaboration with the Department of Women and Child Development,
Government of Karnataka. In our analysis, we focused on the current perceptions and
attitudes of the respondents, their experience with the scheme, as well the issues that
has been faced with the implementation and administration of the scheme. This helped
us answer a few important questions about the scheme design, its rationale and its
sustainability.
3
One of the major factors that defines the BL scheme is its specific targeting of the BPL
population. It was considered to be of primary importance, as the cash transfer is likely
to help these populations educate their daughters or support them financially in order
to discourage child marriage or female foeticide. The total enrolment in the programme
shows a varying trend over the ten-year period in which the scheme has been
operational. The enrolment has gone up and down from year to year, showing a
declining trend first during the three-year period of 2007-08 to 2009-10, and then again
during the last three years.
We also found some exclusions from the BL scheme. Most of these have been because of
the lack of proper documentation or delay in processing of applications. From our
primary survey, we found that the exclusion error was close to 2% of the total sample
size i.e. 1497 households. Moreover, we found that from our entry into the field that the
time and money spend in procuring all the required document to ‘prove’ one’s BPL
status was difficult to bear, especially for BPL families.
An obvious objective of the BL scheme is to influence the prevalence of son preference
and female foeticide so as to make corrections to the skewed child sex ratio in the state.
By examining the data provided by the WCD department, we found that although the
scheme allows for up to two girl children to be enrolled per family, the enrolment of
second girl child is much lower as compared to the first girl child (87.73% as compared
to 12.25%). Additionally, we observed in our field visits that there is hardly any
difference between the attitudes and perceptions toward the girl child between the APL
and BPL families. Issues of mobility and accessibility are a big constraint household
irrespective of their economic status.
We also found that the problems of infrastructure (availability of schools) and mobility
(lack of buses) and prevailing attitudes towards girls are pervasive in nature. Responses
from all stakeholders indicate that all girls (regardless of income or caste status) would
benefit by being supported for their education, through the provision of educational
resources as well as community support towards empowerment and realisation of
rights to development. It is also very clear from the FGDs that regardless of a
behavioural shift, there is an expressed attitude that parents have aspirations for their
daughters’ to go through higher education. Feedback from FGDs overwhelmingly
emphasise scholarship funds for girls and that a continued reinforcement and
encouragement of girls’ education through scholarship funds might help to motivate
4
parents. FGDs also indicate that the bond amount should be emphasized as support for
girls’ education rather than wedding expenses.
When we reviewed all of the information related to enrolment, conditionalities, as well
as the implementation of the scheme, we came up with several recommendations for
the re-design of the scheme that can help the BL scheme achieve its objective. As part of
the recommendations, we have three primary models. The objective in creating these
options is to provide the Government of Karnataka with three different scenarios so as
to use it for a considered decision after weighing all the pros and cons of each model.
One of the primary guiding principles for re-designing the options for the BL scheme is
that there is considerable emphasis and demand for empowerment of girls or
empowerment plus cash transfer model where cash is one of the instruments for
behavioural change. This is based on the premise that most sustained change in girls
and women’s positioning comes from change in social and gender relations, and
therefore, empowerment-based strategies enabled changes are both faster and
sustainable.
The first model suggests rebranding BL and has the following major components: (i)
introduction of women’s and girls’ empowerment programme in a major way (using
Mahila Samkahya and mentorship models) (ii) reformed BL scheme in terms of
coverage or eligibility, conditionalities and processes and (iii) the use of bond /
insurance. The second model suggests doing away with the CCT and only engaging
with (i) empowerment, (ii) strengthening of public services (education, training, etc.),
and (iii) use of bursaries for need-based support. The third model argues for the
removal of bond as an instrument and suggests an addition of three components: (i)
direct transfer of cash linked to progress in secondary or higher education; (ii)
staggered payment (direct transfer) of the final amount; and (iii) empowerment-based
strategies in schools.
These recommendations come from our analysis of the MIS data, and our own field
work collecting quantitative and qualitative data, which suggest that CCTs are not the
appropriate vehicle to create empowering outcomes While cash in the hands of young
girls is very useful and critical in many resource-poor contexts, unless there is a
mechanism whereby girls are able to use that money for their own welfare (as opposed
to the welfare of their families), the cash disbursement fails to reach its intended
objective. What girls are currently facing are structural and social barriers such as
inaccessible schools, lack of teachers, lack of schools and safe transportation facilities,
5
regressive attitudes towards mobility of girls as well as their educational and career
prospects after schooling. Karnataka is one of the progressive states which has made
university education available at affordable costs for girls from below poverty line
households. However, the number of seats available at the university level necessary
do not match the number of takers who complete secondary or pre-university. This by
design is exclusionary for girls as they will be discouraged from participating in higher
education and employment outside home for both social and structural barriers
mentioned above. While CCTS do help in increasing the economic capacity of the
households, they are unable to tackle these very real barriers to gender equality and
participation.
In sum, we argue that in order to fundamentally change the lives of women and to
move towards gender equality, both the situation of empowerment and an empowering
situation has to be put in place (Rowlands, 1996). The situation of empowerment is seen
as spaces in which women and girls are able to become aware of the power dynamics,
develop capacities to gain control over their lives, exercise this control and also are able
to support empowerment initiatives, and an empowering situation is seen as a process
to do so. We argue that instead of focusing on providing girls financial incentives, we
have to work towards creating a space where girls build their own future.
6
Acknowledgements
This study would not have been possible without the active support of the Department of Women
and Child Development (WCD), Government of Karnataka. We appreciate their transparency in
sharing the programmes internal data, which has so far not been in public domain. A special
thanks to the former Principal Secretary, WCD, Ms. Uma Mahadevan Dasgupta and Director,
WCD, Dr. Arundhati Chandrashekhar for their continuous engagement with the study.
We would like to especially thank the CDPOs, Anganwadi supervisors, Anganwadi workers,
Taluk Health Officials, Block Education Officers and other stakeholders in the four taluks namely
Madhugiri (Tumkur), Saundatti (Belagavi), Raichur taluk (Raichur) and Nenjungud (Mysore)
who shared valuable information during the course of the fieldwork. We would also like to
acknowledge the inputs given by the Bhagyalakshmi scheme in-charge at the Life Insurance
Corporation of India (LIC), Bangalore and Mr. V. Sasthamani, former Assistant General Manager,
State Bank of India (SBI). We also thank the National Informatics Centre (NIC), Karnataka State
Unit, for the cooperation extended to us in accessing data.
We would like to mention the fieldwork support provided by Mr. Uday Kumar and his team at
Public and Social Research Centre (PSRC), Bangalore. Also, Ms. Latha R. for conducting the Focus
Group Discussions (FGD) and semi-structured interviews with the key stakeholders. We would
also like to thank Mrs. Amutha S. for her efforts in translating the FGD and interview transcripts.
We would also like to extend our thanks to the UNICEF for the financial support. A special thanks
to Ms. Reeni Kurien, Dr. Antara Lahiri and Ms. Sumita Dawra from UNICEF for their constant
support and inputs to the study.
Research Team at Centre for Budget and Policy Studies (CBPS), Bangalore:
Jyotsna Jha
Sridhar R. Prasad
Anusha Iyer
Niveditha Menon
Thyagarajan R.
Srinivas Alamuru
Puja Minni
Vasudha Ramakrishnan
Pramod Kumar K.S.
Shreekanth Mahendiran
Madhusudhan B V Rao
Writing Team at Centre for Budget and Policy Studies (CBPS), Bangalore:
Jyotsna Jha
Niveditha Menon
Anusha Iyer
Sridhar R. Prasad
Puja Minni
7
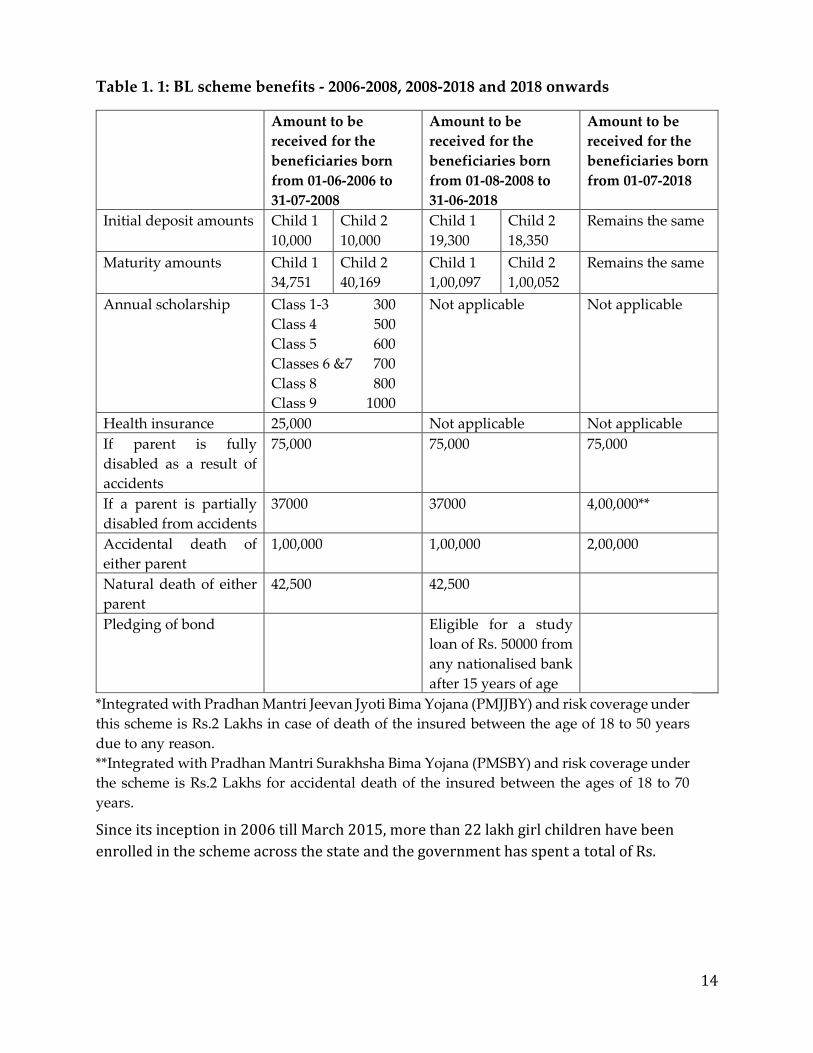
List of Tables Table 1. 1: BL scheme benefits - 2006-2008, 2008-2018 and 2018 onwards......................... 14
Table 1. 2: List of changes in conditionalities in BL .............................................................. 16
Table 1. 3: Supporting documents required for enrolment and claims for BL ................. 18
Table 2. 1: Factors impacting CCTs…………………………………………………………..32
Table 2. 2: Socio-economic indicators of Belgaum ................................................................ 42
Table 2. 3: Socio-economic indicators of Raichur .................................................................. 43
Table 2. 4: Socio-economic indicators of Tumkur ................................................................. 43
Table 2. 5: Socio-economic indicators of Mysore ................................................................... 44
Table 3. 1: Phases of the study .................................................................................................. 46
Table 3. 2: Summary of quantitative and qualitative methods used .................................. 48
Table 3. 3: Caste and religion of the households ................................................................... 50
Table 3. 4: Type of housing ....................................................................................................... 50
Table 3. 5: Income classification, based on nature of ration card held by the survey
respondents ................................................................................................................................. 51
Table 3. 6: Highest education level of the respondent .......................................................... 53
Table 3. 7: Distribution of eligible households for BL .......................................................... 54
Table 4. 1: BL Scheme design, rationale, and objectives……………………………………56
Table 4. 2: Poverty estimates in Karnataka: Headcount of people living below the
poverty line (BPL) ...................................................................................................................... 57
Table 4. 3: Poverty estimates in India: Headcount of people living below the poverty
line (BPL) ..................................................................................................................................... 58
Table 4. 4: Enrolment of BL scheme, as compared with total registered live birth of girls
....................................................................................................................................................... 59
Table 4. 5: Enrolment as against total registered live births of girls (in percentages)...... 60
Table 4. 6: BL enrolment without the card details ................................................................. 62
Table 4. 7: Enrolment of girls in the BL scheme, as relates to social categories ................ 62
Table 4. 8: Types of ration cards possessed by different households in Karnataka ......... 63
Table 4. 9: Out-of-pocket expenditure incurred by beneficiary households ..................... 64
Table 4. 10 : Distribution of enrolment by birth-order of the child .................................... 65
Table 4. 11: Child sex-ratios as per wealth quintile in Karnataka ....................................... 66
Table 4. 12: Conditionalities documented (in numbers) in terms of immunisation,
enrolment in anganwadi and enrolment in schools (2005-2006 to 2016-2017) .................. 70
Table 4. 13: Conditionalities documented (in percentages) in terms of immunisation,
enrolment in anganwadi and enrolment in school (2005-2006 to 2016-17) ....................... 71
Table 4. 14: Conditionalities related to enrolment in education (in 2017) ......................... 73
8
Table 4. 15: Purposes of using the matured bond amount .................................................. 77
Table 4. 16: Child marriage among girls against wealth quintile in Karnataka ............... 79
Table 4. 17: District-wise comparison of proportional BPL population and BL enrolment
....................................................................................................................................................... 83
Table 4. 18: Percentage of people aware of compensation for death of parent ................. 88
Table 4. 19: Percentage of people aware of compensation for disability of parent .......... 88
Table 4. 20: Budget allocation and expenditure for the BL scheme (Rs. In crores) .......... 89
Table 4. 21: Expenditure on BL Scheme as a percentage of total DWCD budget (Rs. in
crores) .......................................................................................................................................... 90
Table 4. 22: Amounts required* versus budget allocated for the scheme .......................... 91
Table 4. 23: Details of insurance claims under the BL scheme (2006-07-2013-14)* ........... 93
Table 5. 1: Three models of BL re-design ............................................................................... 95
Table 5. 2: Suggestions for change in enrolment process of BL .......................................... 97
Table 5. 3: Percentage of households by distribution of card .............................................. 98
Table 5. 4: Expenditure on all girls for BL scheme (in crores) ............................................. 99
Table 5. 5: Vidyasiri pre-matric scholarships ....................................................................... 105
Table 5. 6: Expenditure of scholarship scheme for all girls in Karnataka ........................ 105
Table 5. 7: Vidyasiri post-matric scholarships ..................................................................... 107
Table 5. 8: Vidyasiri special incentives ................................................................................. 107
Table 5. 9: Availability of secondary and higher secondary schools as per enrolment . 117
Table A1. 1: Percentage of households according to the number of daughters in the
household .................................................................................................................................. 130
Table A1. 2: Household distribution by type of card in sample population ................... 130
Table A1. 3: Child marriage among girls against wealth quintile in Karnataka ............ 130
Table A1. 4: Child sex ratios in Karnataka ........................................................................... 131
Table A1. 5: Percentage of households where the daughters can go to school on their
own (as part of the total applicable households) ................................................................ 131
Table A1. 6: Percentage of households where the daughters can go to the market on
their own (as part of the total applicable households) ....................................................... 132
Table A1. 7: Percentage of households where the daughters can go to the district HQ on
their own (as part of the total applicable households) ....................................................... 132
Table A1. 8: Percentage of households depicting decision-making power within a
household .................................................................................................................................. 133
Table A2. 1: Educational facilities available for girls in Karnataka……………………...139
Table A3. 1: Statistics related to girl education…………………………………………….142
Table A4. 1: Incidence of poverty at district-level 2011-12……………………………….143
9
Table A5. 1: District-wise child sex ratio (0-6 years)………………………………………144
Table A6. 1: District-wise and cohort-wise total number of BL enrolments……………145
Table A6. 2: District-wise percentage of total children who had immunisation ............ 146
Table A6. 3: District-wise percentage of total children who ever attended an anganwadi
..................................................................................................................................................... 148
Table A6. 4: District-wise percentage of total children who ever attended school ........ 150
Table A6. 5: District-wise year-wise number of claims and their respective amounts .. 152
Table A6. 6: Year-wise number of claims on parents’ deaths, accidents and disabilities
..................................................................................................................................................... 153
Table A6. 7: Critical indicators of conditionalities for Karnataka ..................................... 156
Table A6. 8: Total registered female live births ................................................................... 156
10
List of Figures
Figure 2. 1: Process of data collection in phase 1 ................................................................... 33
Figure 3. 1: Occupational profile of the respondent………………………………………..52
Figure 4. 1: Annual registration of girls in the BL Scheme………………………………...58

11
List of Abbreviations
ABAD Apni Beti Apna Dhan
AE Actual Expenditure
ANM Auxiliary nurse/midwife
APL Above Poverty Line
ASHA Accredited Social Health Activist
BL Bhagyalakshmi
BPL Below Poverty Line
C&AG Comptroller and Auditor General
CBPS Centre for Budget and Policy Studies
CCT Conditional cash transfers
CDPO Child Development Project Officer
CRS Civil Registration System
DLHS District Level Household Survey
DoE Department of Education
DoH Department of Health
DWCD Department of Women and Child Development
ECE Early Childhood Education
GPI Gender Parity Index
GoK Government of Karnataka
HCR Head Count Ratio
HSNP Hunger Safety Net Programme
ICDS Integrated Child Development Services
IFA Iron/Folic Acid tablets
IIPS Indian Institute of Population Sciences
LIC Life Insurance Corporation
MDG Millennium Development Goals
MIS Management Information System
MMR Maternal Mortality Rate
MPCC Monthly per capita consumption
NFHS National Family and Healthy Survey
NPAG Nutrition Programme for Adolescent girls
NSS National Sample Survey
NSSO National Sample Survey Organization
PAHELI People’s assessment on health, education and livelihoods

12
PRAF Programa de Asignacion Familiar
RTE Right to Education
SASSA South African Social Security Administration
SC Scheduled Caste
ST Scheduled Tribe
UNFPA United Nations Population Fund
UNICEF United Nations Children’s Fund

13
Chapter 1: Introduction
1.1. The issue: Gender equality
Karnataka, one of the southern Indian states, falls mid-way in terms of development
indicators among Indian states and is often placed in the ‘above-average’ range in
comparison to the all-India statistics. This does not mean that the state does not have its
own development challenges. While performing well on the economic front, Karnataka
lags behind on several social indicators, especially when we examine gender disparities.
For instance, Karnataka reported the lowest sex ratio at birth among four south Indian
states that include Andhra Pradesh, Kerala and Tamil Nadu according to the Census of
India 2011 report, and appears to be continually declining, if we examine the data in the
fourth National Family Health Survey (NFHS-IV). Additional evidence from the Data
from the Civil Registration System (CRS) indicates that while the exact sex ratio at birth
varies between 910 and 927 in 2014-15, there is a disturbing trend of missing girls in the
population (Rajan t al, 2017). This level of discrimination continues to children’s
education as well, where we find that there is still a significant problem of gender
inequality in the state with respect to girl’s access to education (CBPS Report, 2015).
1.2. The intervention: Bhagyalakshmi scheme
In order to tackle the issue of gender disparity in the state, Karnataka introduced a
scheme of conditional cash transfers, known as Bhagyalakshmi (BL), in 2006-07.
According to the scheme, all girl children, subject to certain defined eligibility criteria,
born in BPL families after 31st March2006, are eligible to be enrolled as beneficiaries
under the scheme. The government issues a bond in the name of the girl child at the
time of enrolment, which is to be encashed once she turns 18, subject to the fulfilment of
defined conditions. The scheme was revised in 2008 with changes in the conditionalities
and benefits; the previous set of benefits included scholarships for girls going to
schools. These scholarship amounts increased with the completion of each successive
class. Health insurance was also an ancillary that was afforded to the girl that has since
been removed. The ancillary benefits that have remained with some fair consistency is
the insurance coverage in case of accidental death of the girl’s parents (Table 1.1). The
scheme is available only to Below Poverty Line (BPL) or economically backward
households. The rationale for restricting the scheme to BPL families was to provide
financial incentives to resource-poor families so as to improve gender-friendly
outcomes such as lower MMR, parity in birth as well as higher social outcomes in terms
of girl education.
14
Table 1. 1: BL scheme benefits - 2006-2008, 2008-2018 and 2018 onwards
Amount to be
received for the
beneficiaries born
from 01-06-2006 to
31-07-2008
Amount to be
received for the
beneficiaries born
from 01-08-2008 to
31-06-2018
Amount to be
received for the
beneficiaries born
from 01-07-2018
Initial deposit amounts Child 1
10,000
Child 2
10,000
Child 1
19,300
Child 2
18,350
Remains the same
Maturity amounts Child 1
34,751
Child 2
40,169
Child 1
1,00,097
Child 2
1,00,052
Remains the same
Annual scholarship Class 1-3 300
Class 4 500
Class 5 600
Classes 6 &7 700
Class 8 800
Class 9 1000
Not applicable Not applicable
Health insurance 25,000 Not applicable Not applicable
If parent is fully
disabled as a result of
accidents
75,000 75,000 75,000
If a parent is partially
disabled from accidents
37000 37000 4,00,000**
Accidental death of
either parent
1,00,000 1,00,000 2,00,000
Natural death of either
parent
42,500 42,500
Pledging of bond Eligible for a study
loan of Rs. 50000 from
any nationalised bank
after 15 years of age
*Integrated with Pradhan Mantri Jeevan Jyoti Bima Yojana (PMJJBY) and risk coverage under
this scheme is Rs.2 Lakhs in case of death of the insured between the age of 18 to 50 years
due to any reason.
**Integrated with Pradhan Mantri Surakhsha Bima Yojana (PMSBY) and risk coverage under
the scheme is Rs.2 Lakhs for accidental death of the insured between the ages of 18 to 70
years.
Since its inception in 2006 till March 2015, more than 22 lakh girl children have been
enrolled in the scheme across the state and the government has spent a total of Rs.
15
4,161.98 crore on the scheme. As mentioned earlier, in order to enrol into the scheme, the
families must meet the following eligibility criteria (DWCD Circular, 2014)1:
a. Enrolment is allowed up to one year of the birth of the girl child on the submission
of the birth certificate.
b. It is mandatory to have a joint bank account of the eligible girl with her mother.
c. Enrolment is restricted to two girl children of one couple belonging to the BPL
category, and in order to be eligible for the scheme, the father, mother or legal
guardian should have undergone terminal family planning methods and the total
number of children in the family should not exceed three (later changed to two).
d. The enrolment of second girl child is subject to submission of documentary proof of
the terminal family planning method adopted by one of the two parents/legal
guardians.
There are also conditions to be fulfilled in order to be able to benefit from the scheme
and to receive the final transfer. The child has to:
a. Be immunised as per the programme of the Department of Health (DoH).
b. Be enrolled in the anganwadi centre within six months of the birth till the child
attains six years of age.
c. Be enrolled in a school recognised by the Department of Education (DoE).
d. Complete at least Class VIII.
e. Ensure that she is not engaged in any form of child labour.
f. Not marry until she reaches the legal age of marriage (18 years).
These conditions have undergone several changes since the year of inception. Table 1.2
provides the changes in the conditionalities that have changed since 2006.
1 Some of these criteria were modified in the later years, which will be discussed in detail later.

16
Table 1. 2: List of changes in conditionalities in BL
Conditionalities 2006 2015
a. Immunisation Vaccinated for immunity
from Department of
Health
b. Early education Child between 0-6 years
regular at anganwadi
c. School education Admitted to school
recognised by DoE and
completes education from
classes I to VIII
Completes education from
classes I to VIII
d. Child labour Should not be a child
labourer as per the Child
Labour Act, 1986
Should not be a child labourer as
per the Child Labour Act, 1986
e. Child marriage Should not be married
before 18 years of age
Should not be married before 18
years of age
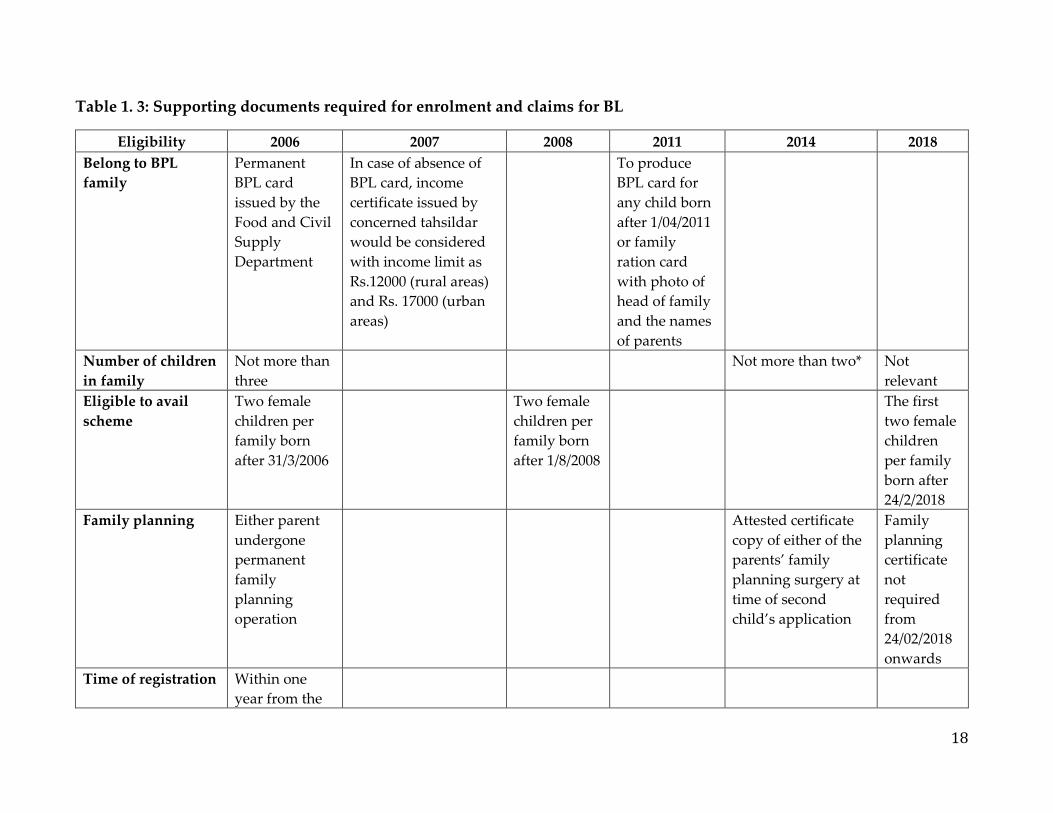
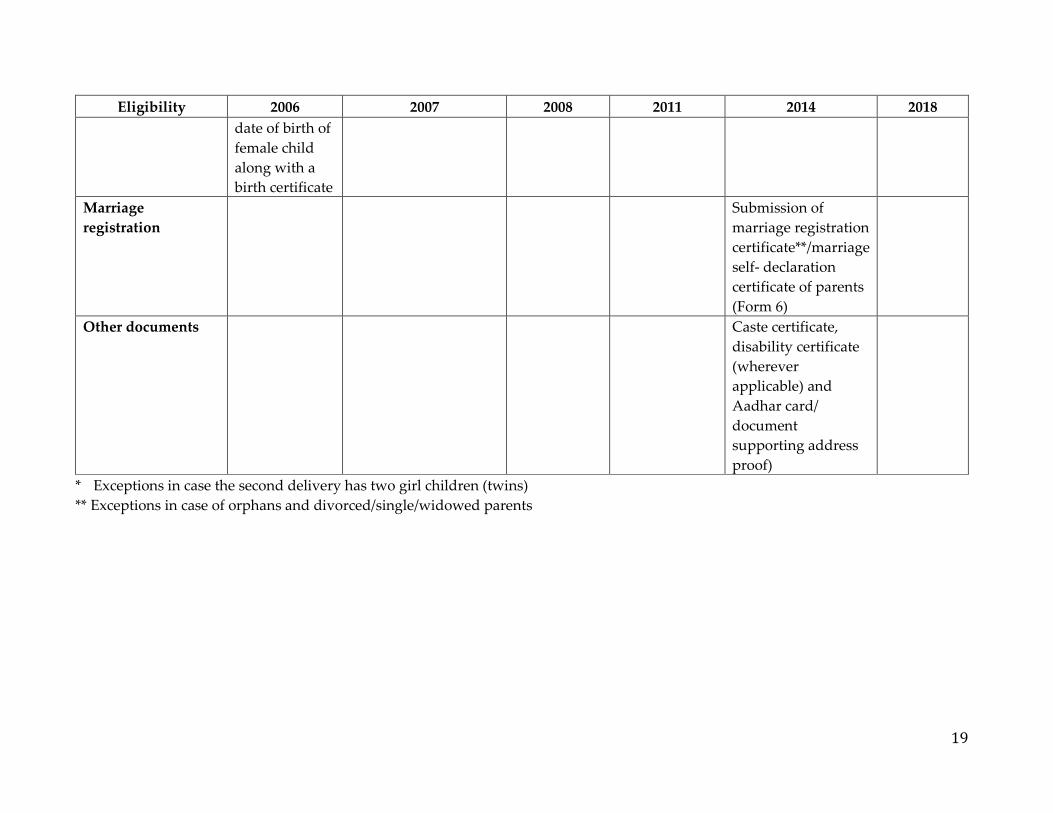
The documents required for supporting the eligibility to enrol or for supporting the
conditionality to claim the benefits have also undergone changes in some cases. Table
1.3 shows the various documents required for fulfilling the eligibility criteria and the
changes that have been introduced over time.
18
Table 1. 3: Supporting documents required for enrolment and claims for BL
Eligibility 2006 2007 2008 2011 2014 2018
Belong to BPL
family
Permanent
BPL card
issued by the
Food and Civil
Supply
Department
In case of absence of
BPL card, income
certificate issued by
concerned tahsildar
would be considered
with income limit as
Rs.12000 (rural areas)
and Rs. 17000 (urban
areas)
To produce
BPL card for
any child born
after 1/04/2011
or family
ration card
with photo of
head of family
and the names
of parents
Number of children
in family
Not more than
three
Not more than two* Not
relevant
Eligible to avail
scheme
Two female
children per
family born
after 31/3/2006
Two female
children per
family born
after 1/8/2008
The first
two female
children
per family
born after
24/2/2018
Family planning Either parent
undergone
permanent
family
planning
operation
Attested certificate
copy of either of the
parents’ family
planning surgery at
time of second
child’s application
Family
planning
certificate
not
required
from
24/02/2018
onwards
Time of registration Within one
year from the
19
Eligibility 2006 2007 2008 2011 2014 2018
date of birth of
female child
along with a
birth certificate
Marriage
registration
Submission of
marriage registration
certificate**/marriage
self- declaration
certificate of parents
(Form 6)
Other documents Caste certificate,
disability certificate
(wherever
applicable) and
Aadhar card/
document
supporting address
proof)
* Exceptions in case the second delivery has two girl children (twins)
** Exceptions in case of orphans and divorced/single/widowed parents

20
Currently, the cash transfer is in the form of a bond issued and managed by the Life
Insurance Company (LIC), a public sector enterprise. At the time of maturity of the
bond, which is when the girl turns 18, she is expected to submit relevant certificates of
fulfilling the applicable conditions (e.g., immunisation, enrolment to anganwadi,
elementary school completion, as listed above) from the respective
departments/authorities to be able to claim the matured amount. Since the scheme is
still only ten years old, and none of the girls have reached the eligibility age, this aspect
of the scheme cannot be explored. It is assumed that depending on the year the child
gets registered; the respective conditions would apply for claims at the time of maturity.
The process of enrolment is driven by the anganwadi worker. She is provided the
responsibility of motivating the mothers to apply for a BPL card during mothers’
meetings, even before the birth of the child. After the child is born, the parents are
supposed to go to the anganwadi worker with their application and related papers for
enrolment in the scheme. If for any reason, they are unable to bring all the documents
and ensure the enrolment, the anganwadi worker is expected to go and collect all the
documents from their homes. The anganwadi worker and the Integrated Child
Development Services (ICDS) supervisor are supposed to meet twice a month, where
the worker hands over all applications to the supervisor who then enters the data
online. This is followed up by the Child Development Project Officer (CDPO), then the
Deputy Director, followed by the Director and finally confirmed by the LIC which
issues the bond. The supervisor is also expected to update the online database every
year.
The funds for the scheme come directly from the state government to the Director, who
then passes it on to the LIC. When the enrolled girl turns 18, she is expected to
personally go to the CDPO with the original bond. The CDPO would verify it through
supervisors at the field level and check for fulfilment of all relevant conditions before
issuing a recommendation to the Deputy Director, who recommends it to the Director,
who authorises the LIC to release the amount into the joint account.
To better understand the ways in which this scheme works, there have been several
studies evaluating the progress of the scheme. For example, the scheme has been
reviewed by the Comptroller and Auditor General (C&AG), the United Nations
Population Fund (UNFPA), and the United Nations Children’s fund (UNICEF). These
studies have primarily reviewed the scheme with other similar schemes of conditional
cash transfers that aim to improve the status of girl child. However, the government of
21
Karnataka (GoK) itself has not commissioned any formal evaluation or review of the
scheme.
In order to understand the functioning and relevance of the Bhagyalakshmi scheme,
Centre for Budget and Policy Studies conducted a review based study with full
cooperation of WCD and financial support of UNICEF Hyderabad. Later, the study was
expanded to include field work, with support of UNICEF Delhi office and concurrence
of UNICEF Hyderabad office. This report combines the two studies. The details of the
study are in the following section.
1.3. The framework of the current study and the report
The objectives of the current study are the following:
a. To review the scheme since its inception in 2006-07 from the perspectives of the
scheme’s rationale and objectives;
b. To deepen our understanding of the scheme’s functioning at the field level;
c. To assess the experiences of and influences of the scheme on its intended
recipients, in terms of intermediate benefits, awareness levels, attitudinal change
and behavioural shifts;
d. To document the experiences of stakeholders (including family members,
community members, anganwadi workers, department officials etc.) in
administrating the scheme;
e. To explore the potential role of Mahila Samakhya (MS) in empowering BL using
their experience with adolescent girls.
In order to address the major objectives, we will be examining the functioning of the
scheme in three separate, but interconnected areas: (1) in terms of its administration, (2)
in terms of its processes including enrolment, claims of intermediate benefits, data
management, etc. and (3) in terms of its influences on attitude and behaviour and will
consist of four major components:
a. Desk review of the scheme based on the analysis of government notifications, rules
and circulars and budget documents

22
b. Review of monitoring data generated through its management information system
(MIS) especially designed for the monitoring of the BL scheme2
c. Basic overview of the scheme process based on preliminary consultations with the
DWCD and interviews with various government officials including the anganwadi
workers, the BL supervisors, and the CDPOs.
d. Primary data collection elicited through quantitative surveys as well as qualitative
focus group interviews with primary stake holders such as adolescent girls, mothers’
groups, fathers’ groups, and community members.
This report summarises the data gathered from of all these sources that have been used
to gain an in-depth understanding of the scheme and the status of the conditionalities
fulfilled within the scheme. Because of the information gathered, the report also
contains recommendations for redesigning the scheme that will allow for the objectives
of the scheme, namely, promoting gender equality, to be fulfilled more effectively.
The report is divided into six chapters. This first chapter outlines the basic structure of
the scheme as well as the objectives of the study. The second chapter examines, in-
depth, the literature on conditional and unconditional cash transfers that framed our
understanding of the factors responsible for success stories, and reasons for failure. The
third chapter describes the methodology that was used to collected the data. Chapter
four analyses the scheme on its design, conditionalities, and processes using the various
data sources such as the MIS data generated, the primary and secondary data collected
and also analyses the budgetary and financial data of BL. The fifth chapter proposes the
various re-design options based on the analysis conducted in the fourth chapter. The
final and sixth summarises the report and provides directions for future research on
conditional cash transfers.
2 This is the first time that the DWCD has shared the MIS data with an external agency. CBPS
acknowledges and appreciates their commitment to transparency.
23
Chapter 2: Cash Transfers: Experiences, issues and effectiveness
2.1. Cash transfers in the international context
In recent times, cash transfers are increasingly being adopted as part of government
schemes to serve as a magic bullet for poverty alleviation and for achieving social
policy-related goals across the developing world. Cash transfers are a form of social
assistance wherein money is handed over to individuals or households in lieu of, or in
addition to, public provisioning of goods and services. Typically, a cash transfer is an
instrument through which the state extends cash or purchasing power to the beneficiary
to buy specific goods, instead of taking the responsibility of transferring the goods
itself(Narayanan, 2011). The latter part of the transfer is known as cash-assisted-kind
transfer wherein individuals are provided cash or vouchers to buy specific goods
and/or services. In-kind transfers have also been a special provision in social assistance
schemes across the globe, including India.
Cash or in-kind transfers can be of two types: conditional and unconditional, depending
on the desired outcome of the scheme and the target beneficiary group. Unconditional
cash transfers are unilateral grants to specific vulnerable groups in society on the basis
of certain pre-determined eligibility criteria. These often do not have any strings
attached and can be spent on anything based on the needs/wishes of the beneficiary
(Prabhu, 2009; Narayanan, 2011) Conditional cash transfers (CCTs) are programmes
that transfer cash, generally to poor households, on the condition those households
make specified expenses on particular aspects, such as investing in the human capital of
the household or in their children (Schady, 2009).
2.1.1. Origins of cash transfers
The origin of cash transfers can be traced back to the 1990s in Latin American countries
as a means to address inequalities of income and wealth (Arnold, 2011; Vyasulu 2010) in
the short run, and improvement of human capabilities in the long-run (Son 2008;
Vyasulu 2010). In fact, unconditional cash transfers are highly advocated because they
guarantee freedom of choice with respect to expenditure preferences. On the other
hand, Conditional Cash Transfers (CCTs) are considered cost-effective with
comparatively lower transaction costs as compared to direct delivery and tend to
contribute to the local economy (Narayanan 2011). It also reduces the need for public
procurement and hence, lesser scope for diversion of resources (Ghatak et al 2016).
Electronic cash transfers are also simpler to implement and regular audits ensure that
the money is reaching those for whom it is intended (Vyasulu 2010).

24
Essentially, it is believed that CCTs seek to alter the behaviour of the people and enable
them to take responsibility for themselves. This indicates the slow withdrawal of the
state being the provider of social care, making people co-responsible for determining
their own welfare. Co-responsibility is the key feature of CCT programmes and this
reflects the fact that social security is no longer seen as residing solely with the state.
Instead, it now involves a co-management of risk, where the family and the community
must also play their part (Joseph, 2016). CCTs are considered simple and easy to
implement as they do not involve any procurement and distribution, often a source of
leakages, and offer flexibility to the families in terms of real spending and adjustments.
The first wave of CCTs began in a few municipalities in Brazil and Mexico and mainly
addressed the issues of health and education. This trend gradually spread to almost the
whole of Latin America. In the second wave, these schemes were rolled out in certain
South Asian and African countries and addressed issues pertinent to them such as those
related to schooling and maternal health (Schady, 2009). A major presumption while
rolling out CCT schemes in any country is that the economy has a strong, efficient and
functional system of educational and health services and the CCTs will be instrumental
in creating the necessary demand for the same (Schady, 2009; Son, 2008).
2.1.2. Documented impact of CCTs
CCTs lead to quick and significant change in school enrolment and attendance if those
are the conditionalities. As a result, the average years of schooling usually improves
among the target group. This is a clear message from a large number of countries in
Africa, Asia, South America and the selected developed countries where the
programmes have been in operation in some form or the other. However, the timings of
the payments/release of the transfer amounts matter. The impacts on enrolment are
higher when a portion of benefits are delayed until the child starts coming to the next
grade/re-enrolment, suggesting that linking benefits to completion and enrolment in the
next level can provide higher impacts on enrolment than simply conditioning benefits
to regular attendance.
Certain countries implemented comprehensive packages of schemes that had the
potential to address supply-side issues while also providing cash transfers. For instance,
the Red Solidaria programme implemented in El Salvador has a three-pronged strategy
that includes cash transfer, a component for infrastructure development and one that
supports income-generation (Prabhu, 2009). The CCT scheme Bolsa Familia was also part
of a larger programme known as the Fome Zero strategy that covered aspects of family

25
agriculture, income-generation and social organisation and was instrumental in
reducing poverty and inequality (Vyasulu, 2010). Thus, CCTs helped in shifting the
emphasis of the state from the supply-side alone to a supply plus demand-driven
solution.
In the case of education, the impact on enrolment and attendance is significantly higher
at secondary levels as compared to primary stage. This is a fairly universal conclusion.
The impact on schooling is higher in poorer families/countries. However, the impact on
the poorest/most vulnerable families tends to be insignificant if the transfer amount is
very low. The impact on non-eligible peers or siblings is not completely conclusive. In
most cases, the impact on enrolment and attendance have helped in creating a positive
social norm and other children in the family have also started going to schools more
regularly whereas in some cases, non-eligible siblings have been retained in order to
release the eligible ones from work and other responsibilities. The impact on learning
and quality of education is less evident. In most cases, the impact has not been found to
be significant. In cases where the impact on enrolment and attendance lead to sudden
overcrowding, it might lead to dilution in quality if the supply side measures (adequate
number of teachers, textbooks, training to deal with large classes, etc.) are not addressed
immediately (Jha, 2010).
However, the downside of cash transfers is that they might provide adversarial
incentives resulting in certain households or individuals trying to purposely maintain a
lower income level in order to be eligible for a particular CCT scheme. Individuals
might also get completely dependent on the state for benefits and may not engage in
productive employment. Scholars term this phenomenon ‘work disincentive’ (Bastagli,
2011). Prioritisation of expenditure is critical and it can lead to greater vulnerability of
women and the elderly, leading to household conflicts. The Bolsa Familia scheme in
Brazil tackled this by transferring the money to the woman in the family who takes
decisions on food and nutrition (Vyasulu 2010). Underdeveloped rural markets and
absence of banking facilities can also pose serious constraints (Ghatak et al 2016).
Very few CCTs have included aspects of empowerment such as parental education or
marriage age. The gendered impact of such programmes has not always been covered
by evaluations but available evidence, though limited, point towards mixed results. For
instance, in Latin America where women were targeted, it led to greater control over
money and therefore, voice in intra-household decisions, but it also reinforced their
mothering roles and expectations (Soares and Silva, 2010; Jha, 2018).
26
2.1.3. Conditional and unconditional cash transfers
Both conditional and unconditional cash transfers have their own set of pros and cons
and their success depends on the context in which they operate and, on the goals, it set
out to achieve. Unconditional cash transfers can largely be categorized under social
assistance programs that involve non-contributory transfers to eligible populations on
the basis of their vulnerability or poverty. (Slater, 2006)). The major goal of an
unconditional cash transfer is to smoothen the consumption of goods and services in an
economy(Slater, 2006). There are two advantages associated with this kind of transfer.
One, there are no strings attached of fulfilling a set of conditionalities to be eligible to
receive the transfer. (Prabhu, 2009; Narayanan, 2011) Two, there are no restrictions
imposed by the State on the kind of goods and services that can be purchased by the
beneficiary.
Unconditional cash transfers are best suited for schemes that serve as safety net
interventions. Another context where UCTS have proven to be effective are in volatile
and insecure environments such as post-conflict situations or curfewed areas(Slater,
2006). UCTs have successfully reduced poverty for the ageing population in various
countries such as Namibia, South Africa and India while also ensuring human capital
investments in the future generations through the means of pension
schemes(Narayanan, 2011). Unconditional cash transfers tend to have very little impact
on education as was observed in Malawi. With respect to health and nutrition, cash
transfers have shown slight impact in terms of dietary diversity and improved child
nutritional status in South Africa(Narayanan, 2011). In India especially, it has been
proven that cash transfers tend to have lower leakages than a Public Distribution
System and hence, there have been debates on replacing the rations with direct
provision of cash. Hence, introduction of conditionalities or the absence of it within a
cash transfer can be best decided on the desired outcomes and objectives. Literature
largely suggests that UCTs seem to work best with respect to social security pensions
while CCTs are the most effective when investments in human capital.is the desired
objective(Narayanan, 2011).
At the same time, the political economy and the socio-economic context of the
country/state also has a strong bearing on the success of the cash transfers. While cash
bears the advantage of increasing consumption and thus stimulating the economy, it
also runs the risk of increasing localized inflation. This was largely true in several
districts in Ethiopia where the government did not increase the supply of food grains to
27
meet the increased demand from the beneficiaries of the Productive Safety Net
Programme (Slater, 2006).Hence, just like CCTs, some of the preconditions and critical
decision areas are similar for UCTs as well. Issues of targeting, size of transfer, duration
of scheme, strong supply side, etc. are all critical aspects to be considered while
designing an UCT. One of the major downsides of unconditional cash transfers is that
beneficiaries might use it for unproductive purposes that undermine the stated goals of
the cash transfer itself.
As stated above, the design of any cash transfer is both context-dependent and goal-
dependent on the basis of which certain unique decisions need to be undertaken. At the
same time, certain areas of decision remain common across both kinds of cash transfers
so that the beneficiaries and the economy can reap the maximum benefits off it.
2.2. Cash transfers in the Indian context: Focusing on the girl child
As mentioned earlier, CCTs have been used in India since the 1990s. They have been
adopted with different design and targeting options to incentivise institutional
deliveries and for availing health and education facilities. Most of them were
introduced with an aim to reduce gender gaps and the adverse child sex ratios. One of
the only CCT scheme fully funded by the central government was the Dhanlakshmi
scheme, launched in 2008. Under this scheme, cash transfers are made based on
immunisation at different stages as well as the enrolment and completion of different
classes until the completion of upper primary school (Class 8) (Sekher, 2010). The Ladli
Lakshmi scheme in Madhya Pradesh which was launched in 2007 allowed cash to be
transferred to those families where the parents had undergone sterilisation and had
only two children. Period cash transfers were made at the time of admission to Class VI
and then, at Class IX and Class XI respectively and a lump sum payment was given to
the girl child at the completion of 18 years of age (Sekher 2010). Other such state-level
schemes include the Girl Child Protection Scheme in Andhra Pradesh, the Ladli Scheme
in Delhi, the Rajalakshmi Scheme in Rajasthan3, the Balika Samridhi Yojana and
3It has since been discontinued.
28
Kunwar Bainu Mameru schemes in Gujarat, the Beti Hain Anmol and Indira Gandhi
Ballika Suraksha Yojana schemes in Himachal Pradesh, the Rakshak Yojana in Punjab,
the Mukhya Mantri Kanya Suraksha Yojana and Mukhya Mantri Kanya Vivah Yojana
schemes in Bihar, Mukhyamantri Lakshmi Ladli Yojana in Jharkhand, Kanyashree
Prakalpa Scheme in West Bengal, the Mukhya Mantri Kanyadaan Yojana in Madhya
Pradesh, Kalyana Lakshmi / Shaadi Mubarak Scheme in Telangana, Biju Kanya Ratan
Yojana in Odisha and the Manjhi Kanya Bhagyashree Scheme in Maharashtra .
When we examine only the conditional cash transfer, we find that the Apni Beti Apna
Dhan (ABAD) scheme in Haryana was one of the first CCTs started in India in 1994,
which was remodelled in 2004. The scheme initially targeted all socio-economic
disadvantaged girls but was revised in 2005 to restrict it to the second girl child of all
groups, doing away with the targeting. The scheme offered two points of transfer: (1) a
small cash disbursement to mothers (Rs 500) within 15 days of delivering an eligible
girl; and (2) within three months of birth, and on enrolment into the scheme, a savings
bond of Rs. 2,500 in the name of the new-born girl which was redeemable at maturity of
Rs. 25,000 when she turned 18, provided the girl was fully immunised, remained
unmarried and continued schooling.
Since the scheme has been in operation for about two decades, it allows itself to be
evaluated against long-term goals, and therefore, has been evaluated using both large-
scale sample survey data (e.g. data from different rounds of the National Family Health
Survey (NFHS) and District Level Health Survey (DLHS) and primary fieldwork (Jha,
2018). Studies revealed that the programme contributed positively to girl child survival
rates (Sinha and Yoong, 2009), but others have concluded that these improvements
cannot be attributed to the scheme as the small size of the transfer was not influential in
changing deep-rooted biases of the community (Mazumdar, 2012). Additionally, it
appeared that the scheme was not influential in having any impact on the self-efficacy4
4Self-efficacy here has been defined as the confidence in one’s own capacity to undertake tasks and higher
aspirations.
29
of girls (Nanda, Dutta & Das, 2014; Krishan et al, 2014). In fact, there appeared to be no
significant difference in the proportion of girls with high self-efficacy between
beneficiary and non-beneficiary groups in both older and younger cohorts (Jha, 2018).
Other evaluations of these schemes have indicated that while the scheme improves
basic indicators related to education and health, it fails to positively impact societal
views and perceptions about the girl child. In fact, some evaluations indicate that the
benefits do not even travel past the first girl child and sometimes have negative impact
on the second girl child (Krishnan et al, 2014).
Certain state governments have also tried to alter the form of such schemes, like the
cash-assisted kind transfer to provide greater impact. For example, cycles are provided
to girls on enrolment in secondary school (in Bihar and Chhattisgarh) and on
completion of education (Uttar Pradesh) (Ghatak et al, 2016). Evaluations of the
Saraswati cycle scheme in Chhattisgarh indicate that such schemes have led to
increased girls’ enrolment in secondary education, enhanced their confidence and
positively influenced parents’ attitude towards their daughter’s education (Midstream
Marketing & Research Pvt. Ltd. ). The evaluation also found that such schemes were
more cost-effective in increasing secondary enrolment than cash transfer programmes.
The Bihar cycle scheme is believed to have increased girls’ age-appropriate enrolment in
secondary school by 30 per cent and also reduced the gender gap in age-appropriate
secondary school enrolment by 40 per cent. The impact on enrolment holds good even
after introducing controls for household demographics (caste and religion), socio-
economic status and village characteristics, including closeness to facilities
(Muralidharan and Prakash, 2013).
But these effects do not appear to be universal. The feedback from Gujarat suggests that
the distribution of bicycles alone does not make much difference (UNICEF, undated).
The Bihar scheme was applicable to all girls enrolling in class IX whereas the Gujarat
scheme was limited to the girls from BPL households. This could be one of the factors
that explain the success of the Bihar programme. High numbers of girls using bicycles
create a critical mass and therefore, could be more effective in changing norms,
especially in a social milieu where all girls face some kind of disadvantage (Jha, 2018). A
bigger collective of girls could together take the cycles to school and therefore cut the
transport cost while also addressing safety concerns. The presence of all girls, including
those from upper castes and upper income groups help in creating new social norms. If
girls from other families are not using bicycles, it is difficult for girls from BPL families

30
alone to use bicycles and create the critical mass required to make any form of changes
in the social narratives(Jha et al., 2016). The Bihar experience also suggests that bicycling
was viewed as safe because schools were not located very far from residences. Distance
could potentially be the reason for the poorer response in Gujarat for poorer response
where the spread of government schools is very wide, especially in rural areas (Jha et
al., 2016).
If we focus primarily on cash-based incentives that provide staggered incentives tied to
desirable outcomes, West Bengal’s Kanyashree Prakalpa Scheme appears to be
addressing concerns related to retention of school and preventing child marriage. With
respect to this scheme, the first incentive consists of an annual grant of Rs 750 for
unmarried girls between ages 13 to 18 and enrolled in grades VIII to XII or equivalent.
This is termed as KP1. The second incentive is a one-time grant of Rs 25,000 upon the
attainment of 18 years, conditional upon her remaining both unmarried and pursuing
educational / vocational training / technical training / sports training till that age. This is
termed as KP2.
Compared to other CCT schemes, Kanyashree Prakalpa is different on two counts. One,
it appears to incentivise positive educational outcomes for girls and reducing child
marriage by introducing two simultaneous conditionality of continued education and
remaining unmarried till 18 years of age. Second, it requires girls to register themselves
at the age of thirteen. This creates far stronger ownership and aspirational effects
among adolescent girls in achieving the scheme outcomes. In the first few years since its
introduction in 2013, the scheme was very effective in reducing under-age marriage and
early dropout among teenage girls in West Bengal. A recent evaluation of the scheme
also indicated that there were some improvements in the empowerment of girls, in that
they were able to express that they would make their own decisions regarding who
they would get married to, and when they would get married (Sen, 2018).
Another scheme that has resulted in positive results is the Janani Suraksha Yojna which
shows that there have been surges in institutional deliveries because of the scheme
(Dongre, 2013). In 2014, the newly formed state of Telangana also introduced the
Kalyana Lakshmi / Shaadi Mubarak scheme wherein an assistance of one lakh rupees is
provided to financially distressed families with the simultaneous objectives of reducing
child marriage and allows families to supplement marriage expenses. Within this
scheme, a girl resident in Telangana, over 18 years of age, belonging to any community
with a combined annual income of her parents not exceeding two lakh rupees is eligible

31
for this scheme. More recently in 2019, the Bruhat Bengaluru Mahanagara Palike
(BBMP) announced the Mahalakshmi Scheme wherein any baby girl born in the 24
BBMP maternity hospitals and within the current financial year, will be given a 15-year
maturity bond of Rs one lakh to assist the girl child financially for either her education
or marriage. A sum of Rs 60 crore has been set aside for this scheme by the BBMP for
this scheme.
Therefore, it appears that despite middling to no results in terms of results, India has
started investing heavily in CCTs to combat the problems of gender equality. To
understand the structural reasons why some of the CCTs appear to have results, and
others are still to show any, we can examine the reasons why CCTs have been
historically effective, and what are the impact enablers and decision-areas that will
allow for any CCT addressing gender equality to work. What makes CTs effective
A review of the literature provides pointers towards the preconditions that help a CT
work and what the key features of an effective CT scheme are. These may be grouped
under three heads as shown in the table below:

32
Table 2. 1: Factors impacting CCTs
PRECONDITIONS IMPACT ENABLERS CRITICAL DECISION
AREAS
Strong supply and array of
services and easy access
Use of technological
solutions
Rationale for scheme
Easy access to procurement of
documents
Mass awareness
programmes driving
behavioural change
Number and choice of
conditionalities with respect
to objectives
Proper integration between
government departments
Employment and income-
generating schemes
Costs involved in targeting,
transferring and monitoring
Income is the major constraint Female recipient High private and social costs
Targeting designs
Size of transfer, duration of
scheme and exit strategy
Method of enrolment into
schemes
Evaluation studies
2.3. First phase: Desk review
The first phase of the study was conducted with the explicit purpose of understanding the
design and implementation of the BL Scheme. Consequently, information from the literature
on CCTs, previous evaluations of other CCTS, and any previous evaluations of the BL scheme
was absolutely critical to frame the nature of enquiry into the functioning of the BL scheme.
Moreover, given that we wanted to know the intentions, motivations, and purpose of the
scheme, we interviewed officials in the WCD, including those who were in charge of the
scheme, who were in charge of the MIS data as well as other supportive personnel. We also
closely examined all the government orders and documents related to the BL scheme. This
was primarily undertaken to understand the trajectories that the BL scheme has embarked
on, since its inception. Due to this extensive review, we were able to trace the various
inclusions and exclusions of the scheme, and the rationale for it, over the course of the BL
scheme. Additionally, with the help of the WCD department, we were able to access the
monitoring data of BL beneficiaries, and were able to review the status and fulfilment of
conditionalities from MIS data and other secondary source.
All of these processes were complimentary to each other and the data collected from each of
the sources provided insight into the process of implementation. The data derived was
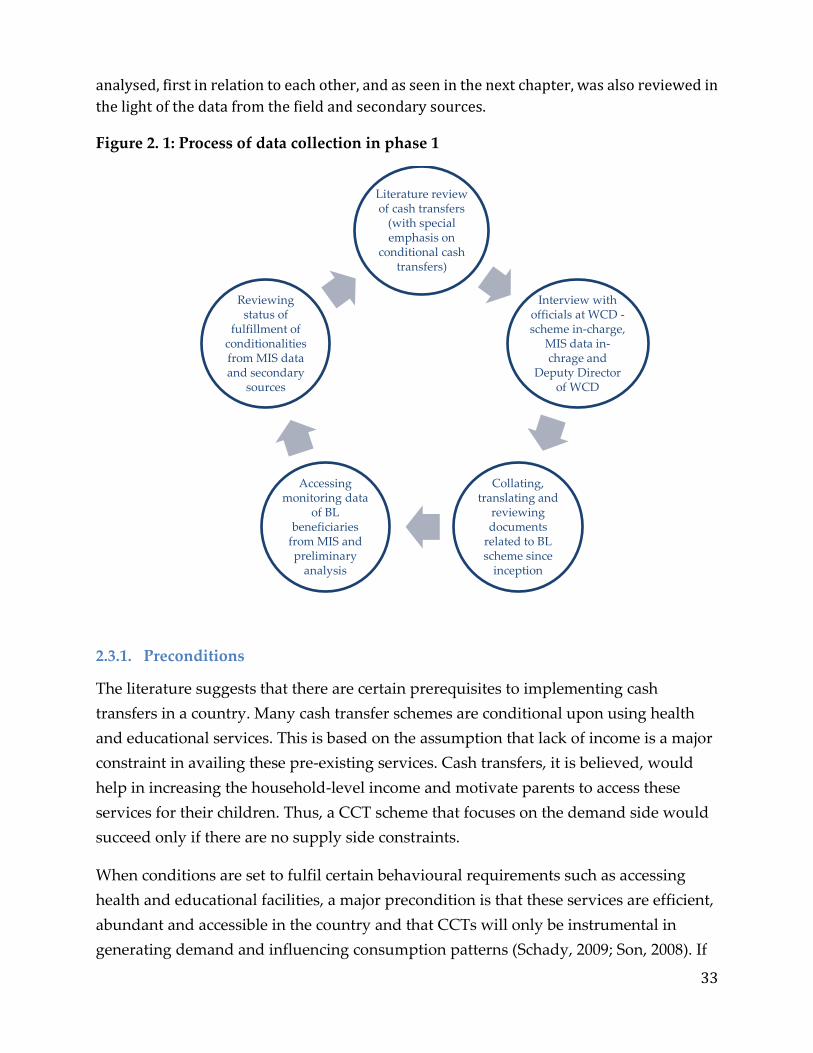
33
analysed, first in relation to each other, and as seen in the next chapter, was also reviewed in
the light of the data from the field and secondary sources.
Figure 2. 1: Process of data collection in phase 1
2.3.1. Preconditions
The literature suggests that there are certain prerequisites to implementing cash
transfers in a country. Many cash transfer schemes are conditional upon using health
and educational services. This is based on the assumption that lack of income is a major
constraint in availing these pre-existing services. Cash transfers, it is believed, would
help in increasing the household-level income and motivate parents to access these
services for their children. Thus, a CCT scheme that focuses on the demand side would
succeed only if there are no supply side constraints.
When conditions are set to fulfil certain behavioural requirements such as accessing
health and educational facilities, a major precondition is that these services are efficient,
abundant and accessible in the country and that CCTs will only be instrumental in
generating demand and influencing consumption patterns (Schady, 2009; Son, 2008). If
Literature review of cash transfers
(with special emphasis on
conditional cash transfers)
Interview with officials at WCD -scheme in-charge,
MIS data in-chrage and
Deputy Director of WCD
Collating, translating and
reviewing documents
related to BL scheme since
inception
Accessing monitoring data
of BL beneficiaries
from MIS and preliminary
analysis
Reviewing status of
fulfillment of conditionalities from MIS data and secondary
sources
34
that is not the case, schemes should be designed in a comprehensive manner in order to
address issues of supply and demand simultaneously. For instance, CCTs such as Red de
Proteccion Social and Programa de Asistencia Familiar were implemented in low-income
Latin American countries (in Nicaragua and Honduras) where there were significant
investments in infrastructure, apart from the demand component of the cash transfer. A
part of the programme’s budget was set aside for building schools and health centres as
well as improving school conditions (Son, 2008). Increasing demand for services with
inadequate social infrastructure can prove to be counterproductive. For instance, if one
of the conditionalities requires the child to enrol in a school and it positively affects
enrolment rates, there is a risk of increasing teacher-pupil ratios (since the state is not
equipped to supply more teachers) affecting learning levels. (Arnold, 2011).
Good governance and strong political support are also major preconditions before
rolling out CCT schemes (Son, 2008). There should be clear vertical as well as horizontal
integration between various departments and agencies concerned with the scheme.
Field-level issues of monitoring, coordination between different departments,
implementing agencies and financial institutions at the ground level also need to be
addressed before the scheme is rolled out (Sekher 2010). According to the anecdotal
experience of a community-level implementer in the Ladli evaluation scheme, out of
every 100 people, only 40 would have the relevant documents and even after five or six
years of submitting the necessary documents to the authorities, beneficiaries would not
have received the required certificates. Bureaucratic delays like these obstruct the roll-
out of the scheme at its very first stage (Krishnan et al, 2014). We already know from
our experience with the Rajalakshmi scheme in Rajasthan that getting the partner
financial agency on board is important before going out to implement the scheme
(Sekher, 2010).
2.3.2. Impact enablers
There are certain facilities and services not absolutely necessary for implementing a
CCT scheme, but the existence of which augment the impact accrued from CCTs. A
major argument against CCTs is their limited focus on outputs and lagged performance
on the outcomes. While there was a significant increase in the enrolment rates of
secondary schools as a result of Progresa (Son, 2008), the educational achievements were
termed as ‘dismaying’. Similarly, the outcome for Brazil’s Bolsa Familia were also quite
bleak, indicating that ‘beneficiary children are almost four percentage points more
likely than non-beneficiaries to fail at school’ (Prabhu, 2009).
35
On the other hand, CCT programmes in Bangladesh and Nicaragua improved the
primary school enrolment rates by a huge margin (Son, 2008). CCTs have also proven to
reduce inequalities in society on a large scale. After Bolsa Familia was introduced, there
has been a reduction in the Gini coefficient from 0.593 to 0.552 in Brazil between 2001
and 2007 (Vyasulu, 2010).
While these gains are encouraging, it is important to note that CCTs generally do not
exhibit a long-term sustainable change in outlook and behaviour. For instance, in the
Laadli scheme it was observed that there was no change in the community mindset
even if there were improvements in the utilisation of health and educational services. A
World Bank evaluation of the ABAD scheme using NFHS data showed that it had a
positive effect on the sex ratio of surviving children but inconclusive effects on mothers’
preferences for having female children as well as total desired fertility (Krishnan et al,
2014). Studies in eastern Turkey suggested that socio-cultural biases against schooling
for girls played a bigger role than cash incentives (Son, 2008). In order to combat this,
the scheme should be accompanied by awareness campaigns and sessions that attach
behavioural values to desired outcomes.
A comprehensive package of schemes that focus on income generation while also
improving the supply of services and providing cash benefits have proven to be more
successful among CCT schemes. For instance, the Red Solidaria programme
implemented in El Salvador has a three-pronged strategy that includes a cash transfer, a
component for infrastructure development and one that supports income generation.
(Prabhu, 2009). The CCT scheme Bolsa Familia was also part of a larger programme
known as the Fome Zero strategy that covered aspects of family agriculture, income
generation and social organisation and was instrumental in reducing poverty and
inequality (Vyasulu, 2010).
Technology and tech-based applications have been adopted in various models across
the world for different purposes such as making cash transfers seamless, avoiding
leakages, reducing targeting errors, optimising costs, etc. For instance, Cadastro Unico, a
register maintained by the federal government of Brazil to screen potential family
beneficiaries has helped in smoothening out the implementation and monitoring
processes in the Fome Zero strategy adopted by Brazil. The municipalities use this same
database in order to monitor beneficiaries (Vyasulu, 2010). For the same scheme,
switching to electronic benefit cards issued by a state-owned financial institution helped
cut the administrative cost of delivering Bolsa Família grants nearly seven-fold, from 14.7

36
percent to 2.6 percent of grant value disbursed. The Northern Kenya Hunger Safety Net
Programme (HSNP) for pastoralists also managed to increase the holders of bank
accounts, following use of smart card and finger-print recognition technology for
payments of cash transfers by Equity Bank agents who are local traders in the
community (Arnold, 2011). Even in Colombia, cash transfers are routed through banks
to make the process seamless (Bastagli, 2011).
The prioritisation of expenditure is critical and might lead to greater vulnerability of
women and the elderly, leading to household conflicts. When women spend a greater
proportion of the money under their control on children’s education, health and
nutritional requirements, it is prudent to ensure that cash transfers are made in the
name of the women in the household.
2.3.3. Critical decision areas
Decisions with respect to certain aspects related to the design and strategy of the
scheme require trade-offs and choices that determine the success of the schemes. The
first and foremost decision is with respect to the rationale of the scheme. The state needs
to assess the current level of specific human capital outcomes and identify key
constraints of low outcomes in human capital (Arnold, 2011). Thereafter, it needs to
identify the best ways to tackle these constraints and decide whether, given the current
circumstances, cash transfers would be the optimal solution.
Selecting the appropriate set of conditions is another major aspect of decision-making
under the design component of CCTs. It is important to understand the direct and
indirect linkages between the desired outcomes and the usage of the services outlined
in the scheme. When Haryana started the ABAD scheme in 1994, the main aim was to
improve the sex-ratio at birth, but its evaluation a decade later revealed that the
community perceived it as a ‘scheme that supports the marriages of children from poor
families’ (Krishnan et al, 2014). Schemes with multiple conditionalities and eligibility
criteria become cumbersome to track and increase private costs incurred by individuals
and households. More importantly, the focus is diverted from the programme goals and
desired outcomes among the variegated pool of conditionalities that need to be fulfilled
(Sekher 2010).
The size of the cash transfer also determines how much an individual or household is
incentivised to fulfil the pre-set conditionalities (Schady, 2009). Setting the cash amount
at a minimal level would not encourage the individual to access services and setting it

37
too high might create undesirable incentives. Certain households or individuals might
try to purposely maintain a lower income level in order to be eligible for a particular
CCT scheme. To avoid this, certain schemes such as PRAF II in Honduras, kept cash
benefits at lower levels so as to prevent adverse selection by the richer households
(Prabhu, 2009).
Decisions regarding timings of entry and exit are also vital at this stage. A prominent
question is when the state should stop cash transfers so as to avoid increased
dependence on it. At the same time, the limited time period must ensure that the
desired outcomes have been achieved. In Nicaragua, the families were entitled to cash
benefits for a maximum period of three years irrespective of the eligibility criteria
(Bastagli, 2011). Enrolling eligible people into the beneficiaries should also be done
systematically in order to avoid exclusions. In Cambodia, programme rules specify that
information posters will be placed in all pertinent schools, on the commune council
notice board and in the health centres, markets and pagodas. Sometimes community
representatives are also appointed in order to enrol beneficiaries into the scheme. The
2014 impact study of Dhanlakshmi revealed that announcing in gram sabha meetings
and public announcements were the most effective ways of publicising the scheme. But
this could prove risky if the on-ground implementation itself has faltered as was the
case with the Ladli scheme in Haryana where it was found that there was poor
involvement of the DoH, local government, NGOs and women’s groups.
Targeting is a game-changing element in any social assistance scheme and the same
holds true for CCTs as well. The decision on targeting and methods of targeting depend
on technical and fiscal analysis as well as on administrative capacity and political
acceptability. In practice, the best results are often achieved by combining two or more
forms of targeting (Arnold, 2011). In most cases, CCTs are targeted at certain specific
sections of society and are not universal in nature. These target groups are either
defined on the basis of poverty or some type of social exclusion. Targeting on the basis
of economic criteria is similar to the procedure adopted while designing any other
social assistance programme (Schady, 2009). Hence, already existing poverty lines are
usually used as a measure to target households and individuals.
In many Latin American countries, beneficiaries are identified through proxy means
tests. Instead of using income or consumption as criteria, a welfare score is computed to
rank potential beneficiaries. One of the ways of identifying beneficiaries is also through
limiting the scheme to certain geographical regions (Prabhu, 2009). Targeting errors are
38
common in CCT schemes just like in any other social assistance scheme. Although
inclusion errors can be avoided by setting the cash benefits at lower levels, exclusion
errors are more difficult in nature. In recent times, public oversight networks and social
audits are emerging as a means to keep the targeting errors at the minimum (Prabhu,
2009). Generally, it has been found that programmes which are universal in nature reap
the maximum impact which was reflected in the evaluation of the Ladli scheme in
Haryana as well (Krishnan et al, 2014).
CCT schemes also involve certain exclusive costs that are generally absent from other
kinds of social assistance programmes. Firstly, there are costs involved in the
identification and targeting of beneficiaries. If the targeting mechanism is itself weak
then it would lead to many leakages from the scheme in the long-run (Son, 2008). But
studies also prove that targeting costs are high at the start of the programme and
gradually taper down during the course of the programme. For example, in Mexico,
during 1997, the first year of the implementation of Progresa, the cost of targeting was 65
percent of the cost of the programme which subsequently declined to 11 percent by
2000. However, the reverse was the case with the costs associated with the monitoring
of the conditionality which rose from eight percent in 1997 to 24 percent by 2000.
Whereas in 1997, the actual delivery of transfers to beneficiaries was only eight percent,
it increased by 2000 to 41 percent.
Targeting also involves certain social costs as was the case in Mexico where certain
groups expressed resentment because of the benefits handed over to beneficiaries as
opposed to the non-beneficiaries (Bastagli, 2011). Secondly, there are major private costs
incurred at the individual or household level. The eligible beneficiaries incur huge
expenditures in order to access educational and health facilities and to comply with the
multiple conditionalities (Vyasulu, 2010). This also includes the money and time costs
involved in procuring necessary identification proof and documents to be eligible for
the scheme.
Thirdly, costs are also incurred in the process of providing cash benefits. Recently, a
number of innovative methods have been devised in order to make these transfers more
cost-effective, one of them being the usage of tech-based applications, as was mentioned
earlier in the section. Reducing the number of intermediaries in the process is another
way of making the transfer process cost-effective (Bastagli, 2011). Upgrading payment
mechanisms substantially reduce the cost to government by leveraging the involvement
of the private sector or community players. For instance, the South African Social

39
Security Administration (SASSA) saw its costs of delivering social transfers drop 62
percent (to less than US$2 per payment) after moving to bank accounts offered by the
private banking sector. (Arnold, 2011). In Mexico, a fairly low-tech Brinks truck model
is still the main payment modality. Households are paid in cash at temporary pay
points that use available infrastructure (such as community centres), with
transportation and payment of the money contracted to the Mexican post and telegraph
office. In Kenya, payments are made through the post office. A pilot programme in
Tanzania disburses funds to community representatives who, in turn, make the
payments (Prabhu, 2009).
The largest expenditures in CCTs are incurred on monitoring the fulfilment of
conditions especially in cases where there are multiple conditionalities to monitor. A
comparative study conducted across Nicaragua, Honduras and Mexico found that the
monitoring costs are anywhere between 2 to 24 per cent of the total programme costs.
Evaluating compliances and accountability become costly affairs as they are the single
biggest indicators to understand the impact of a CCT scheme. (Son, 2008). By design,
some programmes involve a social worker who, in the case of non-compliance, will
reach out to the beneficiaries (e.g., El Salvador, Jamaica). Colombia’s Familiasen Acción
used a system of sample-based site monitoring or ‘spot checks’ as internal process
evaluation. Interviews were conducted every six months in a sample of 20
municipalities. For participants, programme officials, and local governments,
interviewers use defined questionnaires that cover 400 indicators of various programme
aspects (including inscription processes, verification of compliance with conditions,
payment systems, appeals, and quality of the health education component). To some
extent, that is the approach followed by Chile’s Solidario programme.
Evaluation studies are hard to implement in the case of cash transfer schemes since it is
difficult to measure a change in the behavioural component of households and
communities. In the absence of a control group and because of rapid changes in social
structures, it is difficult to attribute any kind of impact as an effect of the scheme
(Krishnan et al, 2014). A randomised control trial experiment which was done in
Malawi to evaluate its impact which found that conditional and unconditional schemes
resulted in the same level of impact in on the context.
Keeping in mind these various factors that allow for CCTs to work and CCTs to fail, we
decided to engage with the BL scheme in multiple ways. As mentioned earlier, we
wanted to engage with the administration of the scheme, as that is central to the way

40
the beneficiaries are able to access them. At the same time, we also wanted to
understand the perspective and understanding of the beneficiaries so as to bring their
experience central to our evaluation of the scheme. In order to do this in a systematic
manner, we analysed information available from the MIS, data collected through
surveys and interactions with various stakeholders through focus group discussions
and interviews. The next chapter provides a brief description of the methodology that
we followed to collect and analyse the data.
2.4. Second phase: Mixed-methods framework
There are some limitations to the desk review, as illustrated in Box 1. Therefore, we also
adopted a mixed-methods framework that employed both quantitative and qualitative
methods to collect information from the field. We conducted primary data collection in
four districts, which were chosen and finalised in consultation with the Ministry of
Woman and Child Development and UNICEF. The selected districts were Belgaum,
Raichur, Mysuru and Tumkur, each of which is located in an administrative region in
Karnataka. Raichur was also chosen, as it happens to be an aspirational district5, as
declared by NITI Aayog. – one in each administrative region in Karnataka. Raichur also
happens to be an aspirational district, as declared by NITI Aayog.
5Niti Aayog in India has identified a number of ‘aspirational districts’ for concentration of development
funds and efforts based on an index of education, health, access to agriculture and water resources,
financial inclusion and presence of basic infrastructure.
41
Box 1: Issues related with data definition, objective, consistency and veracity: Some
illustrations
a. The date of birth is not validated properly as a date field. Hence the date formats
are inconsistent in different districts and years. Even within the same district, the
formats are constantly changing. The formats are varying between
DD/MM/YYYY and MM/DD/YYYY. Even the separators used in the date format
are varying from ‘/’ to ‘-
b. There are instances where the school field is empty and the class field is filled
which makes it unclear what field to consider for verifying if the student is
enrolled in a school at all
c. The maximum number of immunisation rounds is different in every district of
the state; in some places it is six and in others seven. It is not clear whether, if the
number of rounds is 0, it means that the girls are not immunised at all or
immunisation details have not been recorded. The assumption is that unfilled
cases are ones that are unrecorded
d. The BL also has details of housing, health conditions, IFA tablet intake, NPAG
enrolment scheme etc. This gives rise to question as to why this data which are
not relevant to BL’s MIS are collected. Although it might be a good practice to
have unified data for anganwadi and BL to enable coordinated monitoring, it is
not clear from the database that this is the case
e. The income field also mentions Rs.0 as the income, especially in the later years of
the data (2016, 2017). Does this mean that there is no income at all (which is
spurious) or the field has not been filled? It is also not clear if the income
recorded is on a monthly or an annual basis
f. When are the details on marriage captured and are, they even being updated? If
yes, then from where and what is the means of verification? The same question
obtains with child labour
We selected one taluk in each of the four districts based on the sex-ratios within each of
the districts. We picked the taluk with the highest sex ratio within each of the districts.
The reason for picking sex-ratio as a selection criteria was because the BL scheme was
designed to combat gender inequality especially in the context of ‘missing’ girls. So, we
wanted to examine its influence on taluks that faced this challenge the most.
Additionally, since the study was being conducted in parallel to evaluating other
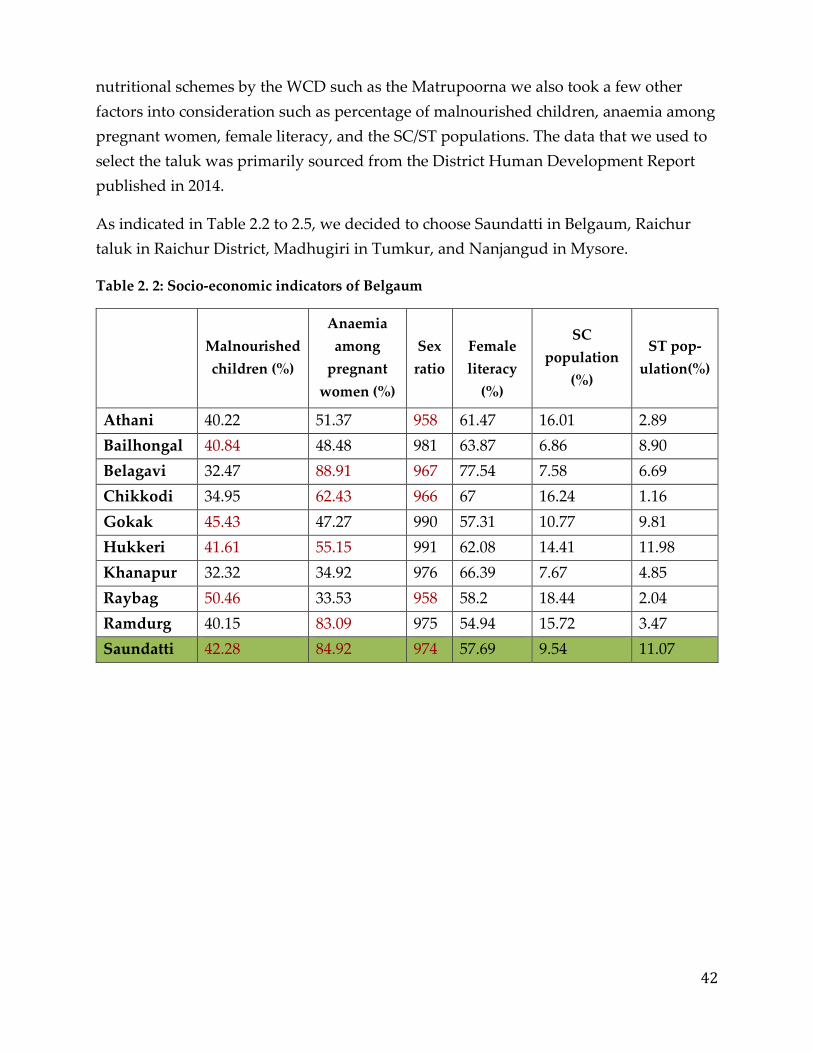
42
nutritional schemes by the WCD such as the Matrupoorna we also took a few other
factors into consideration such as percentage of malnourished children, anaemia among
pregnant women, female literacy, and the SC/ST populations. The data that we used to
select the taluk was primarily sourced from the District Human Development Report
published in 2014.
As indicated in Table 2.2 to 2.5, we decided to choose Saundatti in Belgaum, Raichur
taluk in Raichur District, Madhugiri in Tumkur, and Nanjangud in Mysore.
Table 2. 2: Socio-economic indicators of Belgaum
Malnourished
children (%)
Anaemia
among
pregnant
women (%)
Sex
ratio
Female
literacy
(%)
SC
population
(%)
ST pop-
ulation(%)
Athani 40.22 51.37 958 61.47 16.01 2.89
Bailhongal 40.84 48.48 981 63.87 6.86 8.90
Belagavi 32.47 88.91 967 77.54 7.58 6.69
Chikkodi 34.95 62.43 966 67 16.24 1.16
Gokak 45.43 47.27 990 57.31 10.77 9.81
Hukkeri 41.61 55.15 991 62.08 14.41 11.98
Khanapur 32.32 34.92 976 66.39 7.67 4.85
Raybag 50.46 33.53 958 58.2 18.44 2.04
Ramdurg 40.15 83.09 975 54.94 15.72 3.47
Saundatti 42.28 84.92 974 57.69 9.54 11.07
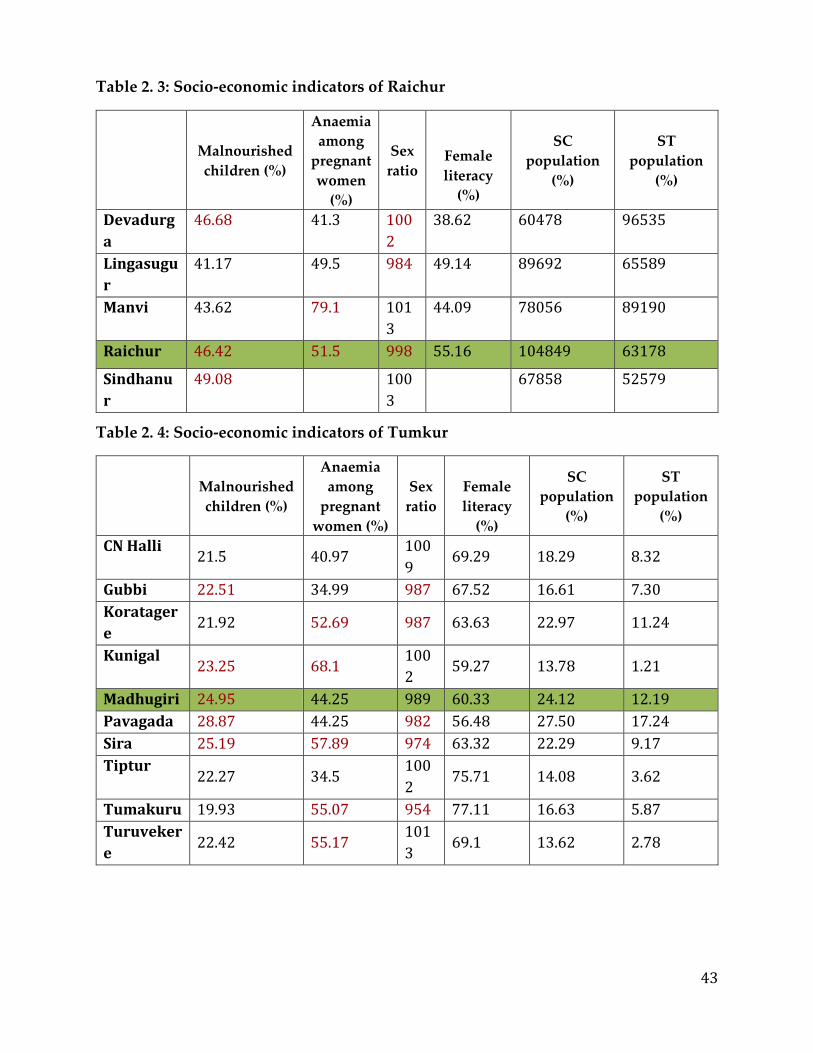
43
Table 2. 3: Socio-economic indicators of Raichur
Malnourished
children (%)
Anaemia
among
pregnant
women
(%)
Sex
ratio
Female
literacy
(%)
SC
population
(%)
ST
population
(%)
Devadurg
a
46.68 41.3 100
2
38.62 60478 96535
Lingasugu
r
41.17 49.5 984 49.14 89692 65589
Manvi 43.62 79.1 101
3
44.09 78056 89190
Raichur 46.42 51.5 998 55.16 104849 63178
Sindhanu
r
49.08
100
3
67858 52579
Table 2. 4: Socio-economic indicators of Tumkur
Malnourished
children (%)
Anaemia
among
pregnant
women (%)
Sex
ratio
Female
literacy
(%)
SC
population
(%)
ST
population
(%)
CN Halli 21.5 40.97
100
9 69.29 18.29 8.32
Gubbi 22.51 34.99 987 67.52 16.61 7.30
Koratager
e 21.92 52.69 987 63.63 22.97 11.24
Kunigal 23.25 68.1
100
2 59.27 13.78 1.21
Madhugiri 24.95 44.25 989 60.33 24.12 12.19
Pavagada 28.87 44.25 982 56.48 27.50 17.24
Sira 25.19 57.89 974 63.32 22.29 9.17
Tiptur 22.27 34.5
100
2 75.71 14.08 3.62
Tumakuru 19.93 55.07 954 77.11 16.63 5.87
Turuveker
e 22.42 55.17
101
3 69.1 13.62 2.78

44
Table 2. 5: Socio-economic indicators of Mysore
Malnourished
children (%)
Anaemia
among
pregnant
women
(%)
Sex
ratio
Female
literacy
(%)
SC
population
(%)
ST
population
(%)
Pariyapatna 30.23 34.63 948 62.09 17.21 8.48
Hunsur 32.76 28.55 980 59.32 18.87 16.50
Krishnarajanagar 30.69 35.98 997 60.33 15.00 6.96
Mysuru 27.46 37.05 986 78.7 12.98 7.32
H.D. Kote 31.43 61.45 987 56.86 27.78 23.61
Nanjangud 33.11 52.36 994 55.83 22.63 13.84
T Narasipur 28.29 21.93 997 57.17 26.31 13.79
In Tumkur, we decided to choose the taluk of Madhugiri even with the presence of
other taluks that were doing poorly in terms of the socio-economic indicators. The
reason it was chosen was because Madhugiri has been the flagship taluk for many other
programmes by the WCD such as the Matrupoorna scheme. Therefore, in consultation
with the WCD, Madhugiri was chosen to help us analyse the processes and systems that
have aided in the efficient implementation of the WCD programmes and schemes. It
was also useful for us to examine the ways in which a prolonged engagement with the
State helps or harms the implementation of a programme.
After the taluks were chosen, we examined the local records to select the 25 anganwadi
centers who formed the base of our analysis. These local records were obtained from the
taluk-level office – the CDPO – which maintains all the records pertaining to the
beneficiaries enrolled in WCD schemes. With the active cooperation of the WCD
department, hard or soft copies of the number of beneficiaries were first examined.
Then, we selected anganwadi centres that had a minimum of 5 beneficiaries under each

45
of the three categories of beneficiaries (Bhagyalaksmi6, Mathrupoorna and
Ksheerabhagya/Srushti) that we were interested in. Within each of the categories, an
anganwadi was assigned a serial number. Then, a random generator was used to
identify 25 Anganwadis chosen for the survey.
All of the 25 anganwadis that were chosen formed the base of our analysis. Out of these
25 anganwadis, we also chose every 5thanganwadi on the list for a more in-depth
analysis. Therefore, the survey was conducted in all of the 25 villages where our
anganwadis were located, and focus groups interviews and semi-structured interviews
were conducted in the 5 anganwadis chosen among the 25.
The next step was to identify households so that they could undertake the survey. First,
we collected all the information regarding beneficiaries who had enrolled for the
Bhagylakshmi, Matrupoorna, and the Ksheer Bhagya/Egg Supply Scheme. By using a
random number generator, we identified two things: a list of respondents, and a
replacement list in the case we are not able to access the respondents or if they refuse to
participate in the study.
6Data for this study was collected jointly in a survey with another study which evaluated the
Bhagyalashmi scheme of the Karnataka Government.
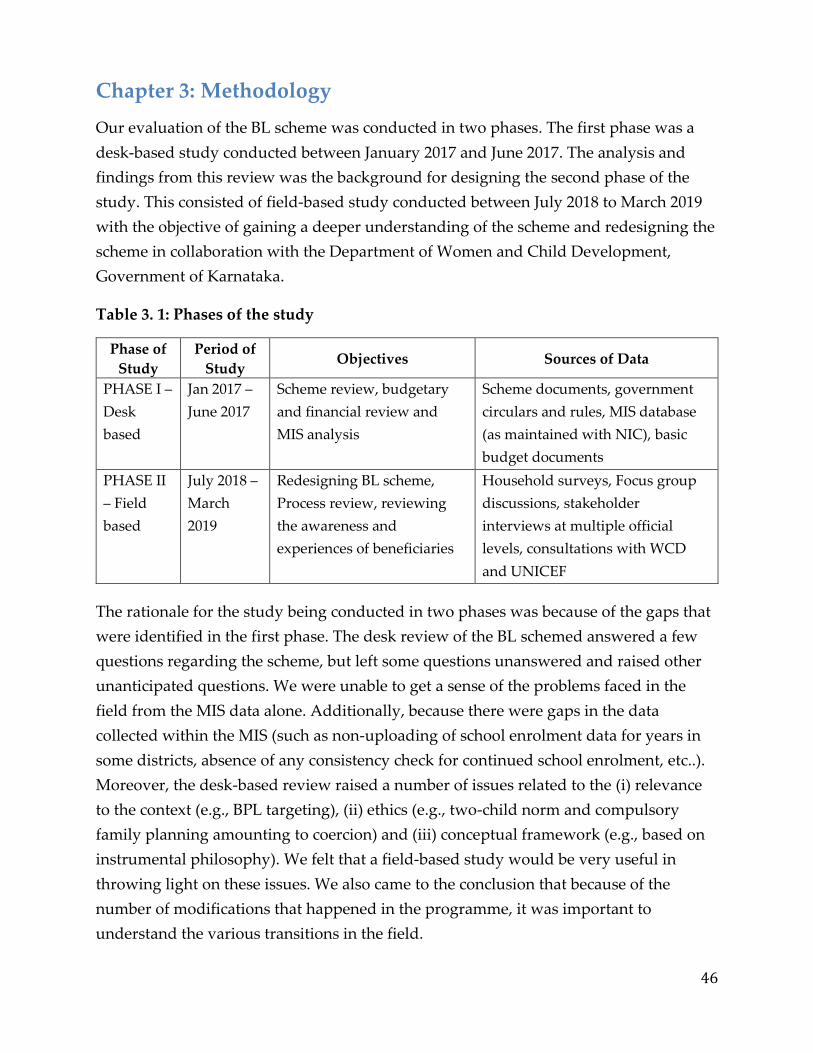
46
Chapter 3: Methodology
Our evaluation of the BL scheme was conducted in two phases. The first phase was a
desk-based study conducted between January 2017 and June 2017. The analysis and
findings from this review was the background for designing the second phase of the
study. This consisted of field-based study conducted between July 2018 to March 2019
with the objective of gaining a deeper understanding of the scheme and redesigning the
scheme in collaboration with the Department of Women and Child Development,
Government of Karnataka.
Table 3. 1: Phases of the study
Phase of
Study
Period of
Study Objectives Sources of Data
PHASE I –
Desk
based
Jan 2017 –
June 2017
Scheme review, budgetary
and financial review and
MIS analysis
Scheme documents, government
circulars and rules, MIS database
(as maintained with NIC), basic
budget documents
PHASE II
– Field
based
July 2018 –
March
2019
Redesigning BL scheme,
Process review, reviewing
the awareness and
experiences of beneficiaries
Household surveys, Focus group
discussions, stakeholder
interviews at multiple official
levels, consultations with WCD
and UNICEF
The rationale for the study being conducted in two phases was because of the gaps that
were identified in the first phase. The desk review of the BL schemed answered a few
questions regarding the scheme, but left some questions unanswered and raised other
unanticipated questions. We were unable to get a sense of the problems faced in the
field from the MIS data alone. Additionally, because there were gaps in the data
collected within the MIS (such as non-uploading of school enrolment data for years in
some districts, absence of any consistency check for continued school enrolment, etc..).
Moreover, the desk-based review raised a number of issues related to the (i) relevance
to the context (e.g., BPL targeting), (ii) ethics (e.g., two-child norm and compulsory
family planning amounting to coercion) and (iii) conceptual framework (e.g., based on
instrumental philosophy). We felt that a field-based study would be very useful in
throwing light on these issues. We also came to the conclusion that because of the
number of modifications that happened in the programme, it was important to
understand the various transitions in the field.

47
Therefore, a field-based study at the second stage was conducted to supplement this
analysis. So, apart from the desk review of the scheme, we were also to conduct surveys
and focus group discussions (among other methods) to understand whether the scheme
has potential to enhance the ‘freedoms’ and reduce the ‘unfreedoms’ experienced by
girls.
3.1. Qualitative methods
The qualitative component of the study included focus group discussions (FGDs) and
stakeholder interviews. As mentioned earlier, every 5th Anganwadi Centre from the list
of 25 Anganwadi centres in each taluk were selected for the qualitative component of
the study. This totalled to 20 Angwanwadi centres across 4 districts. FGDs were
conducted with a variety of stakeholders that included mothers, fathers, village elders,
adolescent girls, community members and members of self-help groups. FGDs were
used to collect in-depth information on the perceptions regarding the usefulness of the
schemes as well as the efficacy with which the schemes are being implemented. This
tool was also useful in eliciting recommendations from both the beneficiaries and
workers on the ways in which the implementation of the schemes can be improved.
Interviews were conducted with officials at various levels in the organizational
structure starting from the Anganwadi workers to the taluk level officials till the CDPO
level. These were coupled with interviews with related stakeholders such as the LIC
representatives, WCD officials, BL in-charge, etc. Information was obtained on the
resources available with the Anganwadis, supply chain challenges that they are facing
as well as the feasibility of implementation of the schemes through Anganwadi
workers. These interviews shed light on the various mechanisms involved in the
process of enrolment and access of benefits of the scheme. A summary of the methods
used is provided below.
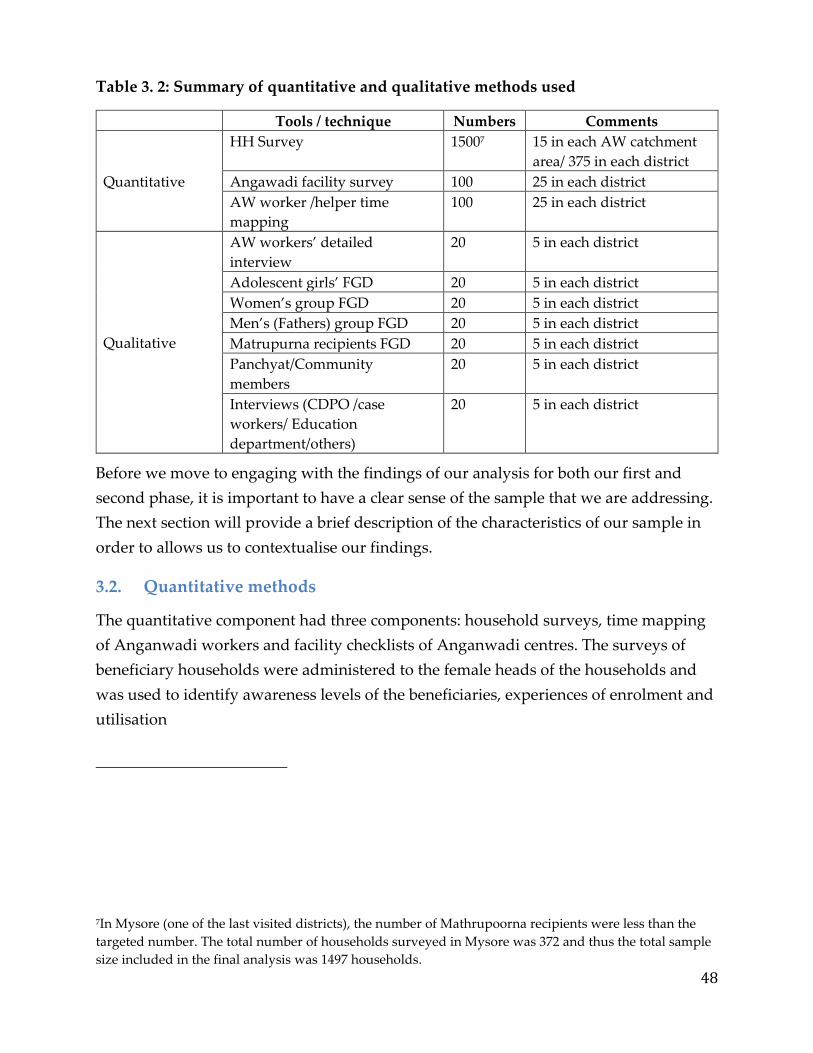
48
Table 3. 2: Summary of quantitative and qualitative methods used
Tools / technique Numbers Comments
Quantitative
HH Survey 15007 15 in each AW catchment
area/ 375 in each district
Angawadi facility survey 100 25 in each district
AW worker /helper time
mapping
100 25 in each district
Qualitative
AW workers’ detailed
interview
20 5 in each district
Adolescent girls’ FGD 20 5 in each district
Women’s group FGD 20 5 in each district
Men’s (Fathers) group FGD 20 5 in each district
Matrupurna recipients FGD 20 5 in each district
Panchyat/Community
members
20 5 in each district
Interviews (CDPO /case
workers/ Education
department/others)
20 5 in each district
Before we move to engaging with the findings of our analysis for both our first and
second phase, it is important to have a clear sense of the sample that we are addressing.
The next section will provide a brief description of the characteristics of our sample in
order to allows us to contextualise our findings.
3.2. Quantitative methods
The quantitative component had three components: household surveys, time mapping
of Anganwadi workers and facility checklists of Anganwadi centres. The surveys of
beneficiary households were administered to the female heads of the households and
was used to identify awareness levels of the beneficiaries, experiences of enrolment and
utilisation
7In Mysore (one of the last visited districts), the number of Mathrupoorna recipients were less than the
targeted number. The total number of households surveyed in Mysore was 372 and thus the total sample
size included in the final analysis was 1497 households.
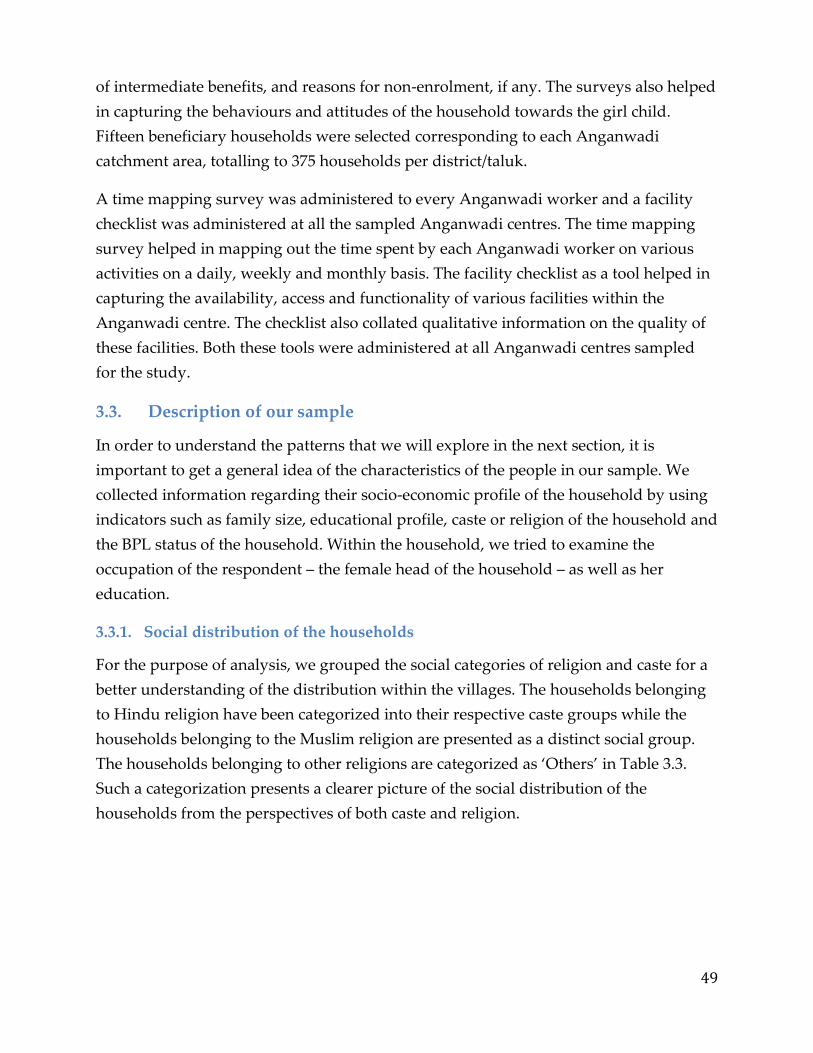
49
of intermediate benefits, and reasons for non-enrolment, if any. The surveys also helped
in capturing the behaviours and attitudes of the household towards the girl child.
Fifteen beneficiary households were selected corresponding to each Anganwadi
catchment area, totalling to 375 households per district/taluk.
A time mapping survey was administered to every Anganwadi worker and a facility
checklist was administered at all the sampled Anganwadi centres. The time mapping
survey helped in mapping out the time spent by each Anganwadi worker on various
activities on a daily, weekly and monthly basis. The facility checklist as a tool helped in
capturing the availability, access and functionality of various facilities within the
Anganwadi centre. The checklist also collated qualitative information on the quality of
these facilities. Both these tools were administered at all Anganwadi centres sampled
for the study.
3.3. Description of our sample
In order to understand the patterns that we will explore in the next section, it is
important to get a general idea of the characteristics of the people in our sample. We
collected information regarding their socio-economic profile of the household by using
indicators such as family size, educational profile, caste or religion of the household and
the BPL status of the household. Within the household, we tried to examine the
occupation of the respondent – the female head of the household – as well as her
education.
3.3.1. Social distribution of the households
For the purpose of analysis, we grouped the social categories of religion and caste for a
better understanding of the distribution within the villages. The households belonging
to Hindu religion have been categorized into their respective caste groups while the
households belonging to the Muslim religion are presented as a distinct social group.
The households belonging to other religions are categorized as ‘Others’ in Table 3.3.
Such a categorization presents a clearer picture of the social distribution of the
households from the perspectives of both caste and religion.
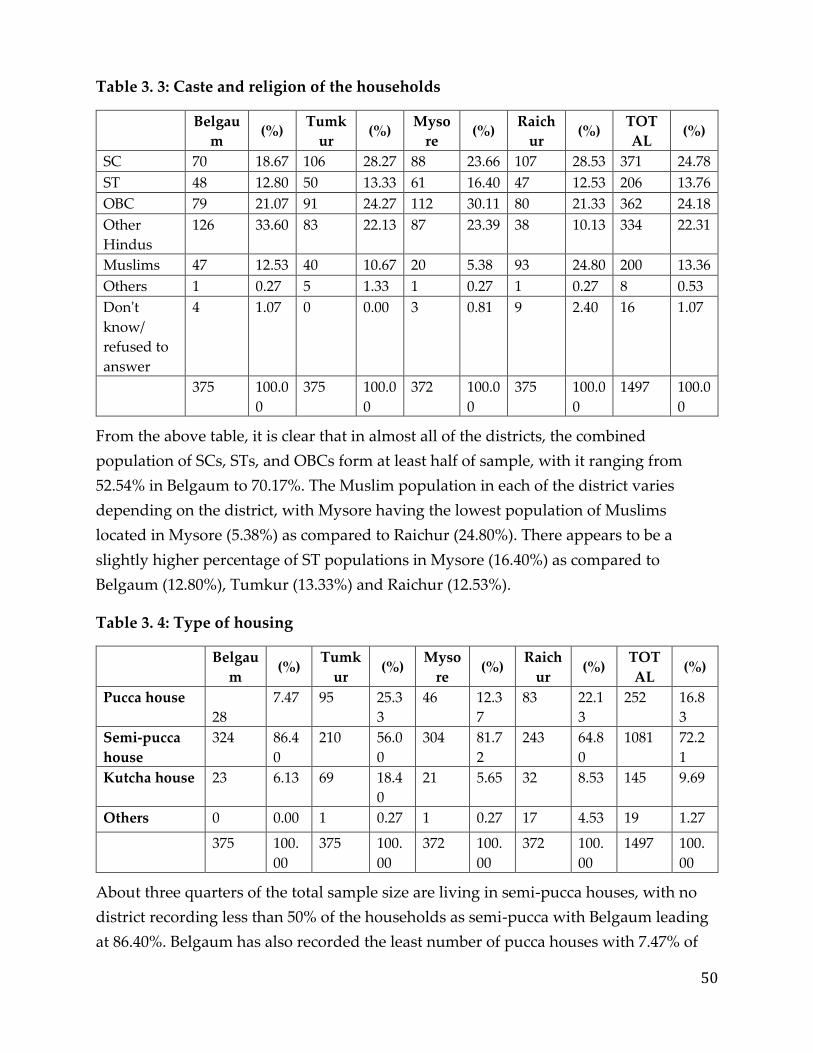
50
Table 3. 3: Caste and religion of the households
Belgau
m (%)
Tumk
ur (%)
Myso
re (%)
Raich
ur (%)
TOT
AL (%)
SC 70 18.67 106 28.27 88 23.66 107 28.53 371 24.78
ST 48 12.80 50 13.33 61 16.40 47 12.53 206 13.76
OBC 79 21.07 91 24.27 112 30.11 80 21.33 362 24.18
Other
Hindus
126 33.60 83 22.13 87 23.39 38 10.13 334 22.31
Muslims 47 12.53 40 10.67 20 5.38 93 24.80 200 13.36
Others 1 0.27 5 1.33 1 0.27 1 0.27 8 0.53
Don't
know/
refused to
answer
4 1.07 0 0.00 3 0.81 9 2.40 16 1.07
375 100.0
0
375 100.0
0
372 100.0
0
375 100.0
0
1497 100.0
0
From the above table, it is clear that in almost all of the districts, the combined
population of SCs, STs, and OBCs form at least half of sample, with it ranging from
52.54% in Belgaum to 70.17%. The Muslim population in each of the district varies
depending on the district, with Mysore having the lowest population of Muslims
located in Mysore (5.38%) as compared to Raichur (24.80%). There appears to be a
slightly higher percentage of ST populations in Mysore (16.40%) as compared to
Belgaum (12.80%), Tumkur (13.33%) and Raichur (12.53%).
Table 3. 4: Type of housing
Belgau
m (%)
Tumk
ur (%)
Myso
re (%)
Raich
ur (%)
TOT
AL (%)
Pucca house
28
7.47 95 25.3
3
46 12.3
7
83 22.1
3
252 16.8
3
Semi-pucca
house
324 86.4
0
210 56.0
0
304 81.7
2
243 64.8
0
1081 72.2
1
Kutcha house 23 6.13 69 18.4
0
21 5.65 32 8.53 145 9.69
Others 0 0.00 1 0.27 1 0.27 17 4.53 19 1.27
375 100.
00
375 100.
00
372 100.
00
372 100.
00
1497 100.
00
About three quarters of the total sample size are living in semi-pucca houses, with no
district recording less than 50% of the households as semi-pucca with Belgaum leading
at 86.40%. Belgaum has also recorded the least number of pucca houses with 7.47% of
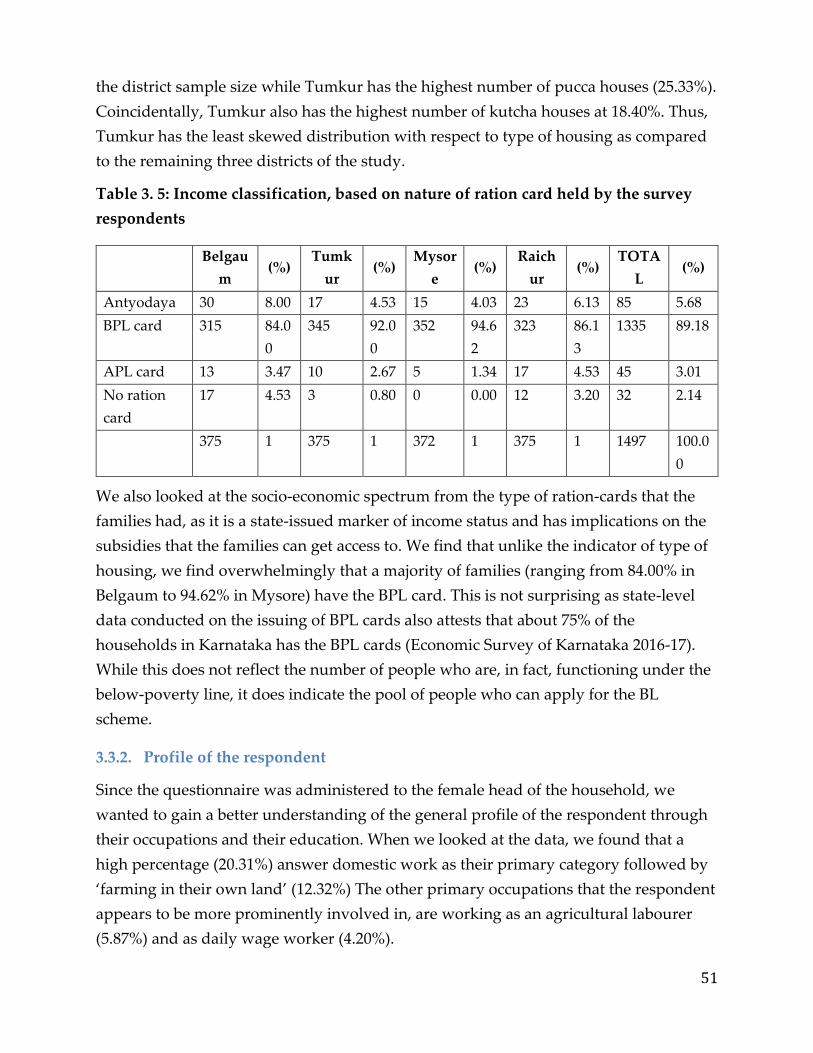
51
the district sample size while Tumkur has the highest number of pucca houses (25.33%).
Coincidentally, Tumkur also has the highest number of kutcha houses at 18.40%. Thus,
Tumkur has the least skewed distribution with respect to type of housing as compared
to the remaining three districts of the study.
Table 3. 5: Income classification, based on nature of ration card held by the survey
respondents
Belgau
m (%)
Tumk
ur (%)
Mysor
e (%)
Raich
ur (%)
TOTA
L (%)
Antyodaya 30 8.00 17 4.53 15 4.03 23 6.13 85 5.68
BPL card 315 84.0
0
345 92.0
0
352 94.6
2
323 86.1
3
1335 89.18
APL card 13 3.47 10 2.67 5 1.34 17 4.53 45 3.01
No ration
card
17 4.53 3 0.80 0 0.00 12 3.20 32 2.14
375 1 375 1 372 1 375 1 1497 100.0
0
We also looked at the socio-economic spectrum from the type of ration-cards that the
families had, as it is a state-issued marker of income status and has implications on the
subsidies that the families can get access to. We find that unlike the indicator of type of
housing, we find overwhelmingly that a majority of families (ranging from 84.00% in
Belgaum to 94.62% in Mysore) have the BPL card. This is not surprising as state-level
data conducted on the issuing of BPL cards also attests that about 75% of the
households in Karnataka has the BPL cards (Economic Survey of Karnataka 2016-17).
While this does not reflect the number of people who are, in fact, functioning under the
below-poverty line, it does indicate the pool of people who can apply for the BL
scheme.
3.3.2. Profile of the respondent
Since the questionnaire was administered to the female head of the household, we
wanted to gain a better understanding of the general profile of the respondent through
their occupations and their education. When we looked at the data, we found that a
high percentage (20.31%) answer domestic work as their primary category followed by
‘farming in their own land’ (12.32%) The other primary occupations that the respondent
appears to be more prominently involved in, are working as an agricultural labourer
(5.87%) and as daily wage worker (4.20%).
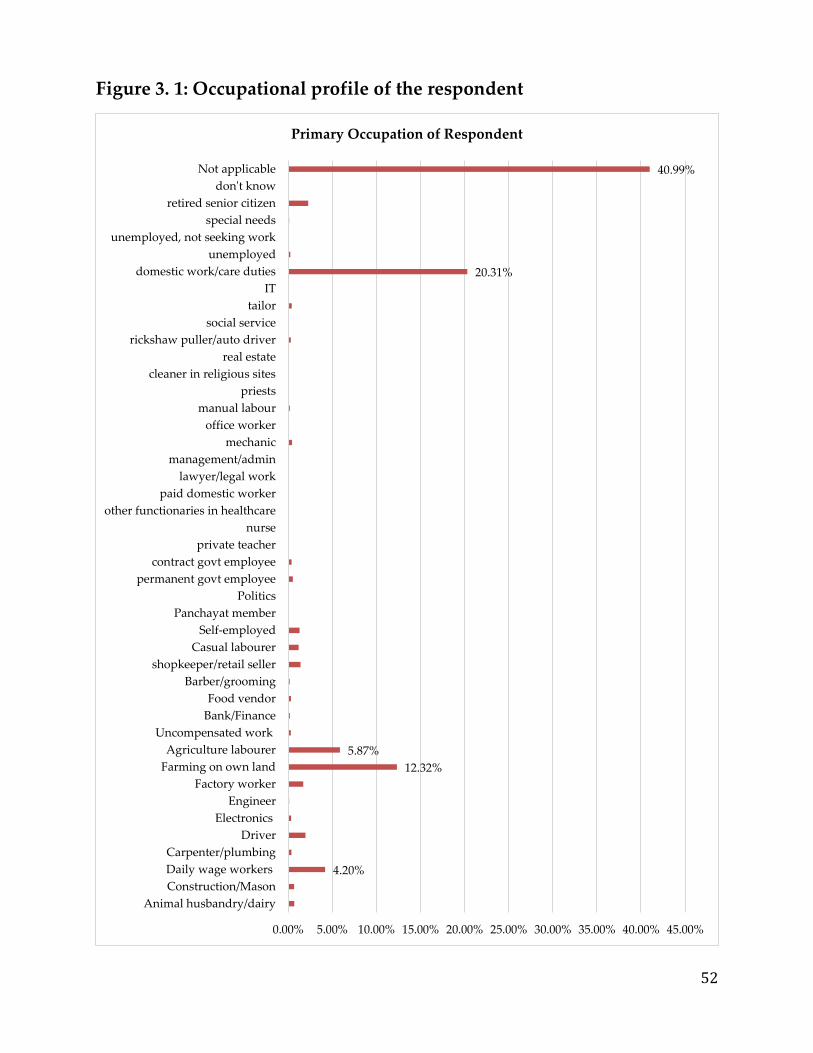
52
Figure 3. 1: Occupational profile of the respondent
4.20%
12.32%
5.87%
20.31%
40.99%
0.00% 5.00% 10.00% 15.00% 20.00% 25.00% 30.00% 35.00% 40.00% 45.00%
Animal husbandry/dairy
Construction/Mason
Daily wage workers
Carpenter/plumbing
Driver
Electronics
Engineer
Factory worker
Farming on own land
Agriculture labourer
Uncompensated work
Bank/Finance
Food vendor
Barber/grooming
shopkeeper/retail seller
Casual labourer
Self-employed
Panchayat member
Politics
permanent govt employee
contract govt employee
private teacher
nurse
other functionaries in healthcare
paid domestic worker
lawyer/legal work
management/admin
mechanic
office worker
manual labour
priests
cleaner in religious sites
real estate
rickshaw puller/auto driver
social service
tailor
IT
domestic work/care duties
unemployed
unemployed, not seeking work
special needs
retired senior citizen
don't know
Not applicable
Primary Occupation of Respondent
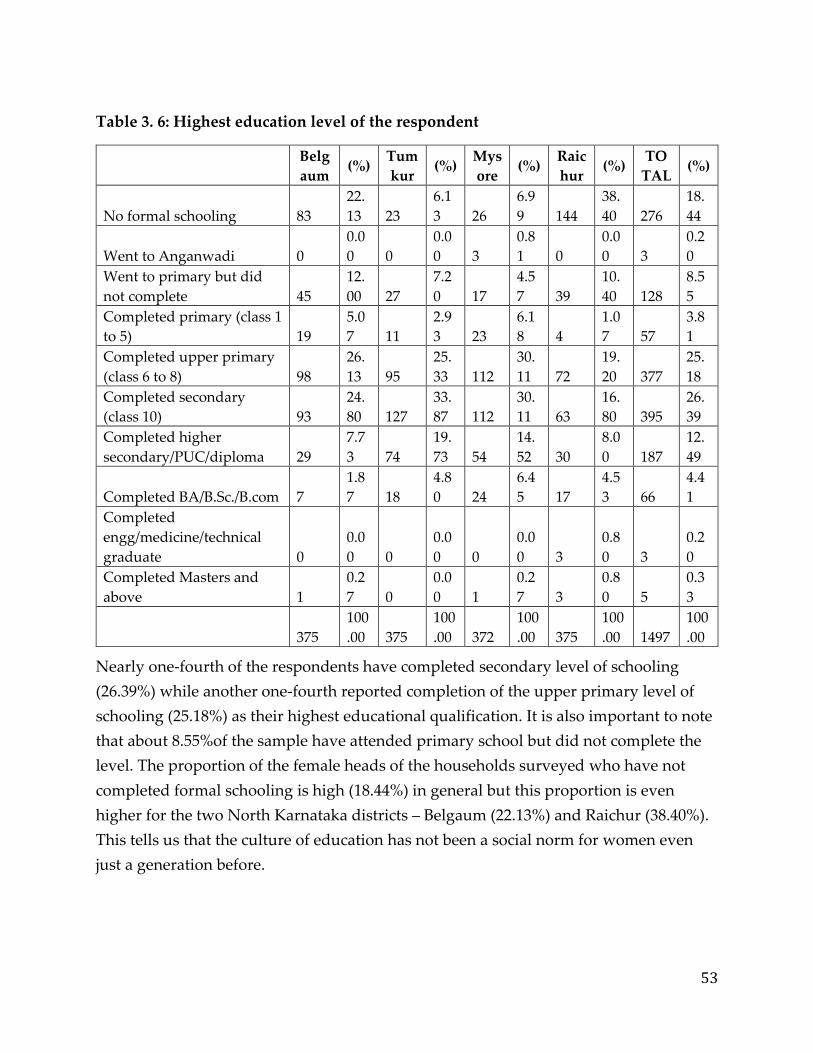
53
Table 3. 6: Highest education level of the respondent
Belg
aum (%)
Tum
kur (%)
Mys
ore (%)
Raic
hur (%)
TO
TAL (%)
No formal schooling 83
22.
13 23
6.1
3 26
6.9
9 144
38.
40 276
18.
44
Went to Anganwadi 0
0.0
0 0
0.0
0 3
0.8
1 0
0.0
0 3
0.2
0
Went to primary but did
not complete 45
12.
00 27
7.2
0 17
4.5
7 39
10.
40 128
8.5
5
Completed primary (class 1
to 5) 19
5.0
7 11
2.9
3 23
6.1
8 4
1.0
7 57
3.8
1
Completed upper primary
(class 6 to 8) 98
26.
13 95
25.
33 112
30.
11 72
19.
20 377
25.
18
Completed secondary
(class 10) 93
24.
80 127
33.
87 112
30.
11 63
16.
80 395
26.
39
Completed higher
secondary/PUC/diploma 29
7.7
3 74
19.
73 54
14.
52 30
8.0
0 187
12.
49
Completed BA/B.Sc./B.com 7
1.8
7 18
4.8
0 24
6.4
5 17
4.5
3 66
4.4
1
Completed
engg/medicine/technical
graduate 0
0.0
0 0
0.0
0 0
0.0
0 3
0.8
0 3
0.2
0
Completed Masters and
above 1
0.2
7 0
0.0
0 1
0.2
7 3
0.8
0 5
0.3
3
375
100
.00 375
100
.00 372
100
.00 375
100
.00 1497
100
.00
Nearly one-fourth of the respondents have completed secondary level of schooling
(26.39%) while another one-fourth reported completion of the upper primary level of
schooling (25.18%) as their highest educational qualification. It is also important to note
that about 8.55%of the sample have attended primary school but did not complete the
level. The proportion of the female heads of the households surveyed who have not
completed formal schooling is high (18.44%) in general but this proportion is even
higher for the two North Karnataka districts – Belgaum (22.13%) and Raichur (38.40%).
This tells us that the culture of education has not been a social norm for women even
just a generation before.
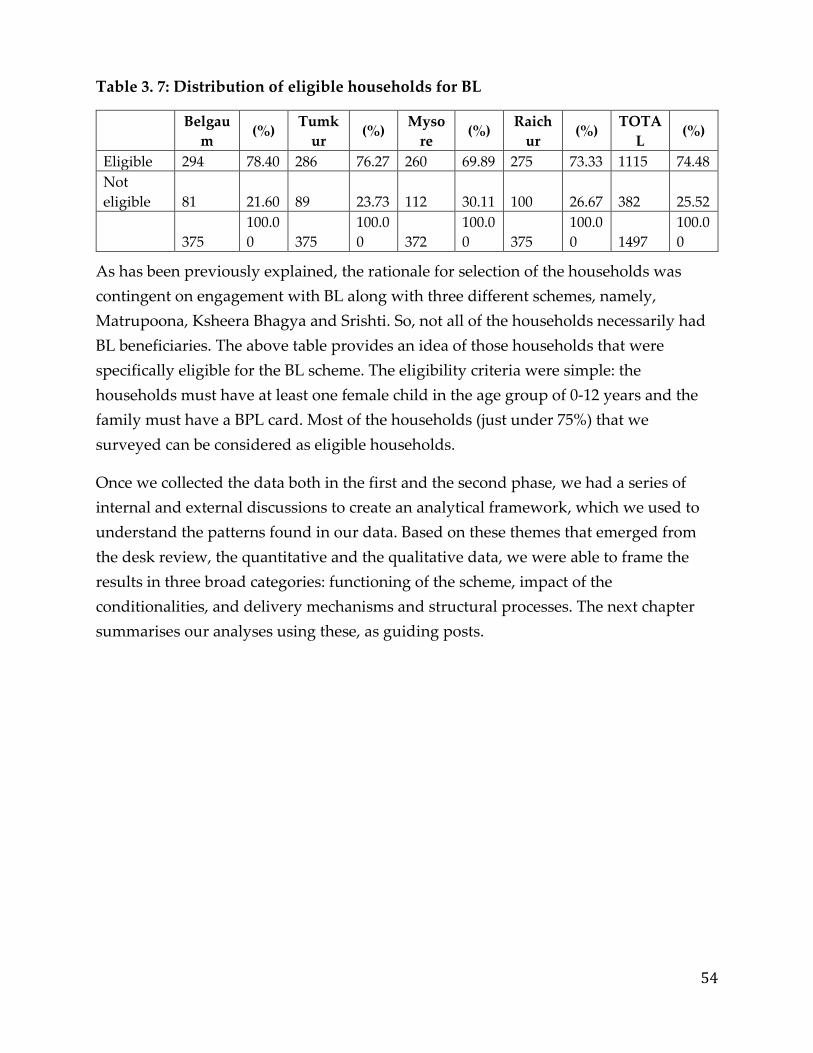
54
Table 3. 7: Distribution of eligible households for BL
Belgau
m (%)
Tumk
ur (%)
Myso
re (%)
Raich
ur (%)
TOTA
L (%)
Eligible 294 78.40 286 76.27 260 69.89 275 73.33 1115 74.48
Not
eligible 81 21.60 89 23.73 112 30.11 100 26.67 382 25.52
375
100.0
0 375
100.0
0 372
100.0
0 375
100.0
0 1497
100.0
0
As has been previously explained, the rationale for selection of the households was
contingent on engagement with BL along with three different schemes, namely,
Matrupoona, Ksheera Bhagya and Srishti. So, not all of the households necessarily had
BL beneficiaries. The above table provides an idea of those households that were
specifically eligible for the BL scheme. The eligibility criteria were simple: the
households must have at least one female child in the age group of 0-12 years and the
family must have a BPL card. Most of the households (just under 75%) that we
surveyed can be considered as eligible households.
Once we collected the data both in the first and the second phase, we had a series of
internal and external discussions to create an analytical framework, which we used to
understand the patterns found in our data. Based on these themes that emerged from
the desk review, the quantitative and the qualitative data, we were able to frame the
results in three broad categories: functioning of the scheme, impact of the
conditionalities, and delivery mechanisms and structural processes. The next chapter
summarises our analyses using these, as guiding posts.
55
Chapter 4: Functioning of the BL Scheme
The functioning of the BL scheme is difficult to assess as the outcome of the scheme –
the cash transfer – has not yet been delivered to its intended recipients. This makes it
harder to engage with the transformatory nature of the scheme. Instead, we will focus
on the current perceptions and attitudes of the respondents, their experience with the
scheme, as well the issues that has been faced with the implementation and
administration of the scheme. This helps us answer a few important questions about the
scheme design, its rationale and its sustainability. This information is the necessary and
critical building block to making recommendations for the redesign of the scheme.
Therefore, the chapter examines our analysis of the data obtained from the department,
the primary data obtained from the field, as well as secondary data available on the
subject to engage with the enrolment criteria, the conditionalities, as well as the
administrative and structural processes that are critical for the scheme to function.
Because the scheme had various objectives, we argue that the criteria for eligibility and
enrollment as well as the conditionalities of fulfilment is foundational in the design of
the scheme. Moreover, the elements of protection that is included in the scheme also
helps us map whether the scheme is utilized in the manner intended. Summarised in
the table 4.1 are the major components of the scheme as well as the objectives of the
scheme. We will be examining each of these in turn to understand the scheme itself.
As is clearly seen in the table 4.1 as well as the literature that we have reviewed in
chapter 2, the rationale for CCTs lie in their conditionalities. The idea is that the
provision of cash to the families or the girl would motivate households and individuals
to act differently towards their girl-child. So, the primary objective with which the BL
scheme has been conceptualized is to change the attitudes and behavior of families and
communities towards the girl child. This has been translated in various criteria of
engagement including tackling female foeticide, educational outcomes, child marriage
and child labour, as well as immunization of children. While examining these intended
consequences, it is important to note that given that the scheme is only ten years old, it
is difficult to gauge whether BL has had any impact on child marriage or labour – as the
children are not of marriageable age yet, and it is difficult to assess a preventative
conditionality. Additionally, because the conditionalities of immunization and
anganwadi enrolment have been removed, we will be examining it only to the extent
that it was relevant for those who enrolled when it was still a conditionality.

56
Table 4. 1: BL Scheme design, rationale, and objectives
Scheme
provisions/conditions Rationale / objective
Eligibility requirements for
enrolment
1. Only girls To influence the son preference among the couples; to
encourage them to have girls
1. BPL only The incidence of all the aspects that the scheme is trying to
address (not registering the birth, no bank account, high birth
rate, son preference, lack of early care and education, school
drop-out, etc.) is higher among BPL populations; the lure of
lump sum cash at a future date (about two decades later)
would influence them to demand for all these that they would
have otherwise not done.
2. Registered birth certificate To enable them to register the births, even if the birth is not
institutional for better records and governance
3. Only two girls and
terminal family planning for
one parent after the second
child
To reduce the birth rate among the couples and encourage
only two-child per couple norm
4. Joint bank account Financial inclusion and enhancing women’s role in financial
decisions
Conditions for accessing the
benefits
5. Complete Immunization
of the enrolled child
To Influence infant and under 5 child mortalities (now
discontinued)
6. Anganwadi enrolment To ensure early childhood care and education for girls (now
discontinued)
Scheme
provisions/conditions
Rationale / objective
7. Continued and complete
schooling till class VIII
To prevent drop outs and enable school completion among
girls
8. No participation in paid
labour
To prevent child labour
9. Girl has to remain
unmarried till she is 18
To prevent child marriage
Social Protection
10. Health insurance for the
girl
To ensure health care for the girl child; to prevent negligence
in health care of girls (Now discontinued)
11. Insurance cover on case
of parental death/ accident
To ensure financial protection to the girl in case of parental
death/disability

57
We first start with the enrolment criteria of being BPL and having adopted terminal
family planning, and move to the conditionalities of immunization, participation in
education, and no participation in child labour and child marriage. We will also engage
with the implications of social protection policies such as health insurance. Lastly, we
will examine the processes of implementation and administration that are particularly
relevant.
4.1 Engagement with enrolment
4.1.1. Targeting BPL families
One of the major factors that define the BL scheme is its specific targeting of the BPL
population. It was considered to be of primary importance, as the cash transfer is likely
to help these populations educate their daughters or support them financially in order
to discourage child marriage or female foeticide. In the years of the implementation of
the BL scheme, it appears that the BPL population in Karnataka has steadily declined
from nearly 21 million in 1993-94 to about 13 million in 2011-12. The proportion of the
BPL population in the total population declined from nearly 50per cent to 21 per cent
during the same period. In fact, the rate of decline in the number of poor people as well
as the ratio of the BPL population, has been higher for Karnataka as compared to all-
India (see accompanying tables). This includes the period when BL had already been
introduced.
Table 4. 2: Poverty estimates in Karnataka: Headcount of people living below the
poverty line (BPL)
Year
Rural Urban Total
% of poor
No. of
poor
(million)
% of poor
No. of
poor
(million)
% of poor
No. of
poor
(million)
1993-94 56.6 16.7 34.2 4.1 49.5 20.8
2004-05 37.5 13.5 25.9 5.2 33.4 18.7
2009-10 26.1 9.7 19.6 4.5 23.6 14.2
2011-12 24.5 9.3 15.3 3.7 20.9 13.0

58
Table 4. 3: Poverty estimates in India: Headcount of people living below the poverty
line (BPL)
Year
Rural Urban Total
% of poor
No. of
poor
(million)
% of poor
No. of
poor
(million)
% of poor
No. of
poor
(million)
1993-94 50.1 327.7 31.8 74.9 45.3 403.0
2004-05 41.8 325.8 25.7 81.4 37.2 407.2
2009-10 33.8 278.2 20.9 76.5 29.8 354.7
2011-12 25.7 216.7 13.7 53.1 21.9 269.8
Note: Estimates are based on MRP of distribution of monthly per capita consumption
expenditure of the National Sample Survey (NSS)
Source: Reproduced from Economic Survey, 2013-14, Table 7.2 (Government of Karnataka,
Programme Monitoring and Statistics Department, 2013-14)
Do these trends imply that the enrolment for BL should also be declining? The initial
perusal of BL data does not necessarily confirm this trend. The total enrolment in the
programme shows a varying trend over the ten-year period in which the scheme has
been operational. The annual enrolment has varied from year to year, and remained in
the range of 1,45,000 to almost 2,60,000 with an exception of nearly 3,00,000 in 2010-11
(see adjoining figure). It is clear that the BL enrolment does not necessary match with
the consistently declining trend of the BPL population. The enrolment has gone up and
down from year to year, showing a declining trend first during the three-year period of
2007-08 to 2009-10, and then again during the last three years.
Figure 4. 1: Annual registration of girls in the BL Scheme
Source: BL computerised database, WCD, Karnataka
0
100000
200000
300000
400000
2006-07 2007-08 2008-09 2009-10 2010-11 2011-12 2012-13 2013-14 2014-15 2015-16
Annual Enrolment

59
Table 4.4 clearly indicates that the BL enrolment has been consistently higher than the
estimated registered birth of girls among BPL families in respective years from 2010-11
to 2015-16. This could be due to several reasons. One, our estimate of registered birth of
girls among BPL families may itself be an underestimate. Considering that the birth rate
is generally higher for lower socio-economic strata, the share of girls among live births
may be higher for the BPL population. The second probable reason could be the
definition of BPL itself; if the definition has changed over the years, it could affect the
eligibility of enrolment for BL scheme. This, to a large extent, seems to be the real
reason.
Table 4. 4: Enrolment of BL scheme, as compared with total registered live birth of
girls
Year
Total BL
enrolment
Total registered
births (girls)
Estimated number of girls
born in BPL families* (HCR)
% of eligible girls
covered (based on
HCR estimates)
2010-11 2,93,865 6,06,581 1,43,154 205
2011-12 1,79,027 5,38,216 1,27,012 141
2012-13 2,21,398 5,31,853 1,11,157 199
2013-14 2,25,141 5,45,013 1,13,908 198
2014-15 1,89,752 5,27,015 1,10,146 172
2015-16 1,45,194 4,60,617 96,269 151
* based on the BPL headcount ratio estimates for Karnataka in 2009-10 as 23.6 percent (used for
2010-11), and that of 20.9 percent in 2011-12 (used for that and subsequent years);
Source: District Census Handbook, 2011 (also assuming that the share of girls in BPL
households will be same as the share of BPL counts in the population. The data for registered
births segregated by sex is available only for the period 2010-11 onwards in District Handbooks.
Before 2010, the live births of each district are not disaggregated by sex)
The requirement for a BPL card for registration to BL was changed in 2007 when
income certificates were also considered as a valid document to claim the BPL status for
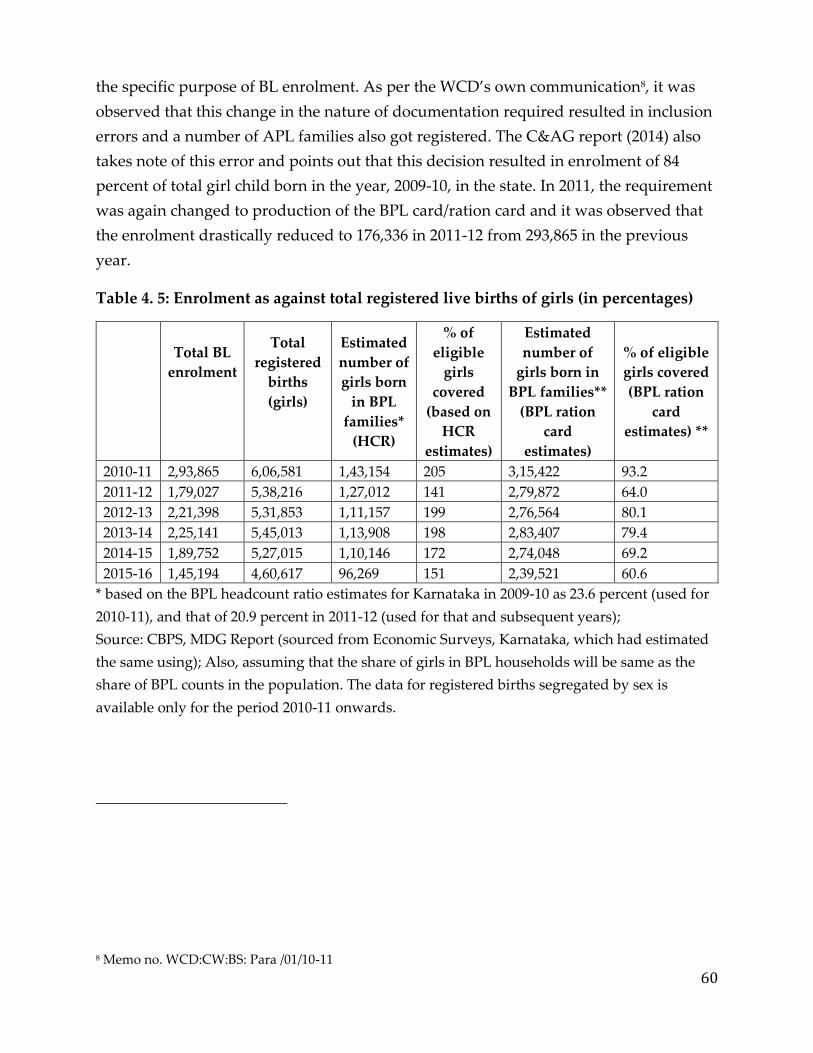
60
the specific purpose of BL enrolment. As per the WCD’s own communication8, it was
observed that this change in the nature of documentation required resulted in inclusion
errors and a number of APL families also got registered. The C&AG report (2014) also
takes note of this error and points out that this decision resulted in enrolment of 84
percent of total girl child born in the year, 2009-10, in the state. In 2011, the requirement
was again changed to production of the BPL card/ration card and it was observed that
the enrolment drastically reduced to 176,336 in 2011-12 from 293,865 in the previous
year.
Table 4. 5: Enrolment as against total registered live births of girls (in percentages)
Total BL
enrolment
Total
registered
births
(girls)
Estimated
number of
girls born
in BPL
families*
(HCR)
% of
eligible
girls
covered
(based on
HCR
estimates)
Estimated
number of
girls born in
BPL families**
(BPL ration
card
estimates)
% of eligible
girls covered
(BPL ration
card
estimates) **
2010-11 2,93,865 6,06,581 1,43,154 205 3,15,422 93.2
2011-12 1,79,027 5,38,216 1,27,012 141 2,79,872 64.0
2012-13 2,21,398 5,31,853 1,11,157 199 2,76,564 80.1
2013-14 2,25,141 5,45,013 1,13,908 198 2,83,407 79.4
2014-15 1,89,752 5,27,015 1,10,146 172 2,74,048 69.2
2015-16 1,45,194 4,60,617 96,269 151 2,39,521 60.6
* based on the BPL headcount ratio estimates for Karnataka in 2009-10 as 23.6 percent (used for
2010-11), and that of 20.9 percent in 2011-12 (used for that and subsequent years);
Source: CBPS, MDG Report (sourced from Economic Surveys, Karnataka, which had estimated
the same using); Also, assuming that the share of girls in BPL households will be same as the
share of BPL counts in the population. The data for registered births segregated by sex is
available only for the period 2010-11 onwards.
8 Memo no. WCD:CW:BS: Para /01/10-11
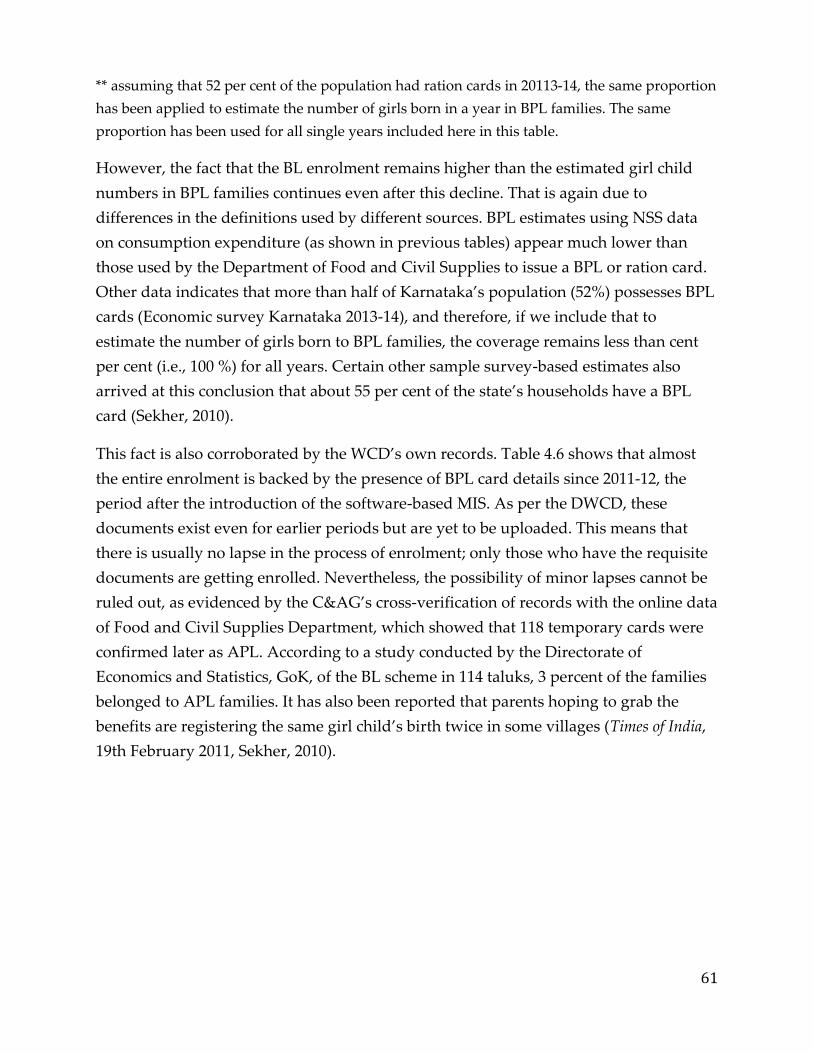
61
** assuming that 52 per cent of the population had ration cards in 20113-14, the same proportion
has been applied to estimate the number of girls born in a year in BPL families. The same
proportion has been used for all single years included here in this table.
However, the fact that the BL enrolment remains higher than the estimated girl child
numbers in BPL families continues even after this decline. That is again due to
differences in the definitions used by different sources. BPL estimates using NSS data
on consumption expenditure (as shown in previous tables) appear much lower than
those used by the Department of Food and Civil Supplies to issue a BPL or ration card.
Other data indicates that more than half of Karnataka’s population (52%) possesses BPL
cards (Economic survey Karnataka 2013-14), and therefore, if we include that to
estimate the number of girls born to BPL families, the coverage remains less than cent
per cent (i.e., 100 %) for all years. Certain other sample survey-based estimates also
arrived at this conclusion that about 55 per cent of the state’s households have a BPL
card (Sekher, 2010).
This fact is also corroborated by the WCD’s own records. Table 4.6 shows that almost
the entire enrolment is backed by the presence of BPL card details since 2011-12, the
period after the introduction of the software-based MIS. As per the DWCD, these
documents exist even for earlier periods but are yet to be uploaded. This means that
there is usually no lapse in the process of enrolment; only those who have the requisite
documents are getting enrolled. Nevertheless, the possibility of minor lapses cannot be
ruled out, as evidenced by the C&AG’s cross-verification of records with the online data
of Food and Civil Supplies Department, which showed that 118 temporary cards were
confirmed later as APL. According to a study conducted by the Directorate of
Economics and Statistics, GoK, of the BL scheme in 114 taluks, 3 percent of the families
belonged to APL families. It has also been reported that parents hoping to grab the
benefits are registering the same girl child’s birth twice in some villages (Times of India,
19th February 2011, Sekher, 2010).
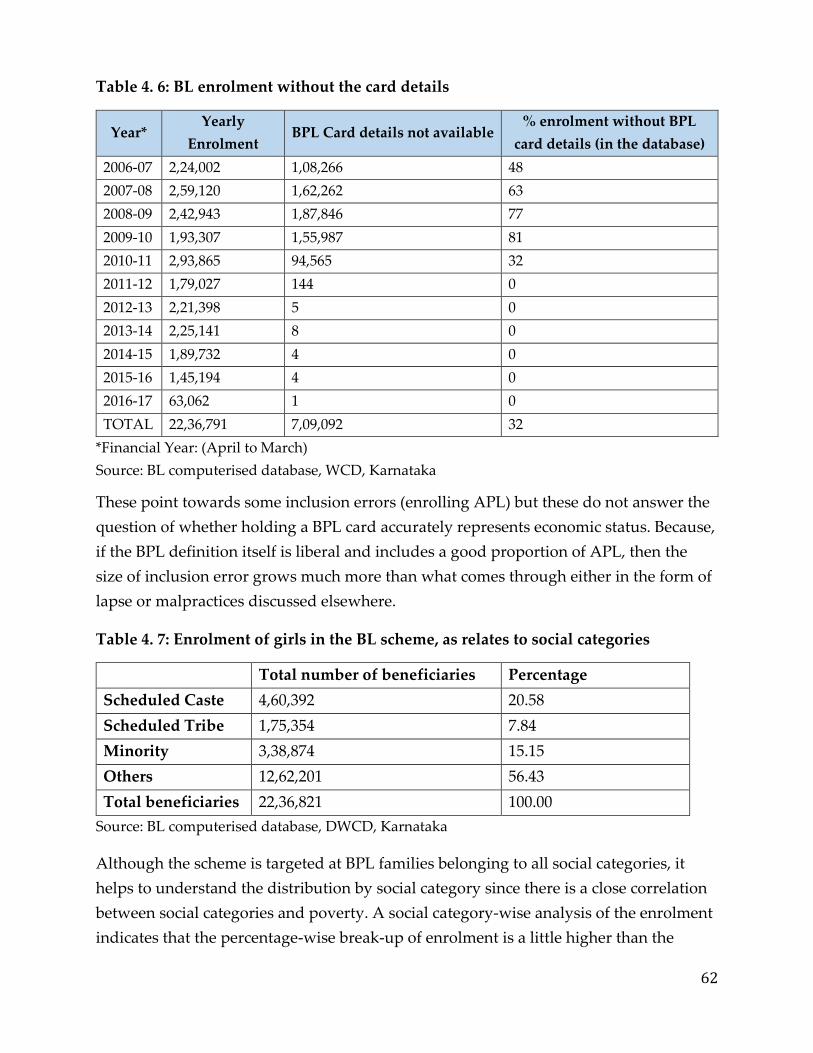
62
Table 4. 6: BL enrolment without the card details
Year* Yearly
Enrolment BPL Card details not available
% enrolment without BPL
card details (in the database)
2006-07 2,24,002 1,08,266 48
2007-08 2,59,120 1,62,262 63
2008-09 2,42,943 1,87,846 77
2009-10 1,93,307 1,55,987 81
2010-11 2,93,865 94,565 32
2011-12 1,79,027 144 0
2012-13 2,21,398 5 0
2013-14 2,25,141 8 0
2014-15 1,89,732 4 0
2015-16 1,45,194 4 0
2016-17 63,062 1 0
TOTAL 22,36,791 7,09,092 32
*Financial Year: (April to March)
Source: BL computerised database, WCD, Karnataka
These point towards some inclusion errors (enrolling APL) but these do not answer the
question of whether holding a BPL card accurately represents economic status. Because,
if the BPL definition itself is liberal and includes a good proportion of APL, then the
size of inclusion error grows much more than what comes through either in the form of
lapse or malpractices discussed elsewhere.
Table 4. 7: Enrolment of girls in the BL scheme, as relates to social categories
Total number of beneficiaries Percentage
Scheduled Caste 4,60,392 20.58
Scheduled Tribe 1,75,354 7.84
Minority 3,38,874 15.15
Others 12,62,201 56.43
Total beneficiaries 22,36,821 100.00
Source: BL computerised database, DWCD, Karnataka
Although the scheme is targeted at BPL families belonging to all social categories, it
helps to understand the distribution by social category since there is a close correlation
between social categories and poverty. A social category-wise analysis of the enrolment
indicates that the percentage-wise break-up of enrolment is a little higher than the

63
proportion of population for respective social categories. According to the 2011 Census,
Karnataka has 17.1 per cent Scheduled Caste population and 7 per cent Scheduled Tribe
population9. However, given that the share of SCs and STs in the BPL population is
larger than their respective population percentages in the total population10(Planning,
Programme Monitoring & Statistics Department, 2013-14), BL registration should also
have a higher than proportional population representation of these two social groups.
This is indicative of exclusion errors: SC and ST representation in BL is less than their
representations in the BPL population.
Moreover, as can be seen from the subsequent table, about 52 per cent of households
possess BPL cards and about only about 30 per cent of those possessing BPL cards really
belong to the BPL category as defined by the NSS. Regardless of the reasons that has led
to such anomalies, what is evident is that in the absence of a clear definition of BPL, and
the indicators used for the purpose of identification, the targeting of the poor can be
compromised owing to high inclusion errors. And as the evidence when we examine
social categories indicates, there are also high chances of exclusion errors, even though
they are likely to be hidden: non-inclusion of eligible girls from the poor households
cannot even be identified without going into the field.
Table 4. 8: Types of ration cards possessed by different households in Karnataka
No Card Anthyodaya BPL Other (APL) Total
Rural
Above poverty line 10.2 4.7 44.6 15.9 75.5
Below poverty line 2.8 1.9 17.4 2.5 24.5
Total - Rural Karnataka 13.0 6.6 62.0 18.5 100.0
Urban
Above poverty line 34.7 1.1 24.1 24.8 84.7
9 Census 2011 Figures at a Glance
http://www.censusindia.gov.in/2011census/PCA/PCA_Highlights/pca_highlights_file/karnataka/Figures_
Glance_Karnataka.pdf
10 Please refer to Table 7.6 from Economic Survey 2013-14 (page 165)

64
No Card Anthyodaya BPL Other (APL) Total
Below poverty line 1.6 1.7 10.3 1.7 15.3
Total - Urban Karnataka 36.4 2.7 34.3 26.6 100.0
Total (Rural + Urban)
Above poverty line 19.1 3.4 37.2 19.2 78.8
Below poverty line 2.4 1.8 14.8 2.2 21.2
Total Karnataka state 21.4 5.2 52.0 21.4 100.0
Source: Reproduced from Economic survey Karnataka 2013-14 (Table 7.8, p167) (Analysis based
on monthly per capita consumption (MPCC) data from the National Sample Survey
Organisation (NSSO)
While our fieldwork was not extensive, we did find evidence from our FGDS that there
have been exclusions from the BL scheme. Most of these have been because of the lack
of proper documentation or delay in processing of applications. From our primary
survey, we found that the exclusion error was close to 2% of the total sample size.
Moreover, we found that from our entry into the field that the time and money spend in
procuring all the required document to ‘prove’ one’s BPL status was difficult to bear,
especially for BPL families. For example, as per our primary survey, about 57% of the
sampled households had incurred on an average Rs. 873 as transactional costs as part of
the enrolment process (mainly towards transportation, middleman fees and
photocopies) (refer Table 4.10). Hence, the process of enrolment itself for BPL families
provided to be quite a financial burden for them.
Table 4. 9: Out-of-pocket expenditure incurred by beneficiary households
District Average expenditure incurred (in Rs.)
Belgaum 650
Tumkur 1325
Mysore 775
Raichur 685
Total 858.75
Now, the question that was naturally raised with these findings was whether the
targeting of poor or BPL families is even required or appropriate in this. In addition to
the fact that targeting remains fraught with high levels of both inclusion and exclusion
errors, as well as high costs of implementation, we also want to question the basic
premise of BPL families alone facing the consequences of gender inequality. For
example, if the objectives of the BL scheme are to tackle the issues of son preference,
65
education, immunisation and preventing child marriage and child labour, these
problems are endemic across almost all social categories of caste, class, and religion.
Instead, given sex ratios among children is lower (indicative of higher prevalence of son
preference) and the incidence of child marriage higher in districts in North Karnataka, a
framework of geographical targeting may make some sense.
However, given there are socio-political issues such as migration and intra-regional
inequalities that are at play, it is likely to be difficult to implement, but it is clear, based
on the data, that a targeted approach towards BPL is not necessarily the best vehicle to
achieve the scheme’s objectives. To understand this in further detail, we now turn to a
very prominent criteria for enrolment that has since been discontinued.
4.1.2. Moving against son preference
An obvious objective of the BL scheme is to influence the prevalence of son preference
and female foeticide so as to make corrections to the low child sex ratio in the state. As
stated earlier, though Karnataka has a higher sex ratio that a number of other states, the
sex ratio at birth is not only low but also declining in the state; it declined from 922 in
2005-06 to 910 in 2015-16 (NFHS III and IV). Therefore, it is indeed an important area
that needs policy attention and hence, a legitimate policy objective. The BL scheme had
dealt with it primarily through propagating family planning practices and penalizing
families, if they choose to have more than two children. To understand whether this
has, in fact, changed the way families have behaved, we examined the compliance
issues related to these stipulations.
By examining the data provided by the WCD department, we found that although the
scheme allows for up to two girl children to be enrolled per family, the enrolment of
second girl child is much lower as compared to the first girl child (87.73% as compared
to 12.25%). In the scheme, there is a provision for enrolling a third child (in case of twins
in the first birth), and it looks like at least 489 families have utilised the scheme this
way.
Table 4. 10 : Distribution of enrolment by birth-order of the child
Enrolment (in numbers) Enrolment (%)
First girl child 19,64,991 87.73
Second girl child 2,74,341 12.25
Third girl child 489 0.02
Total Enrolment 22,39,821 100.00
Source: BL computerised database, DWCD, Karnataka (calculated)
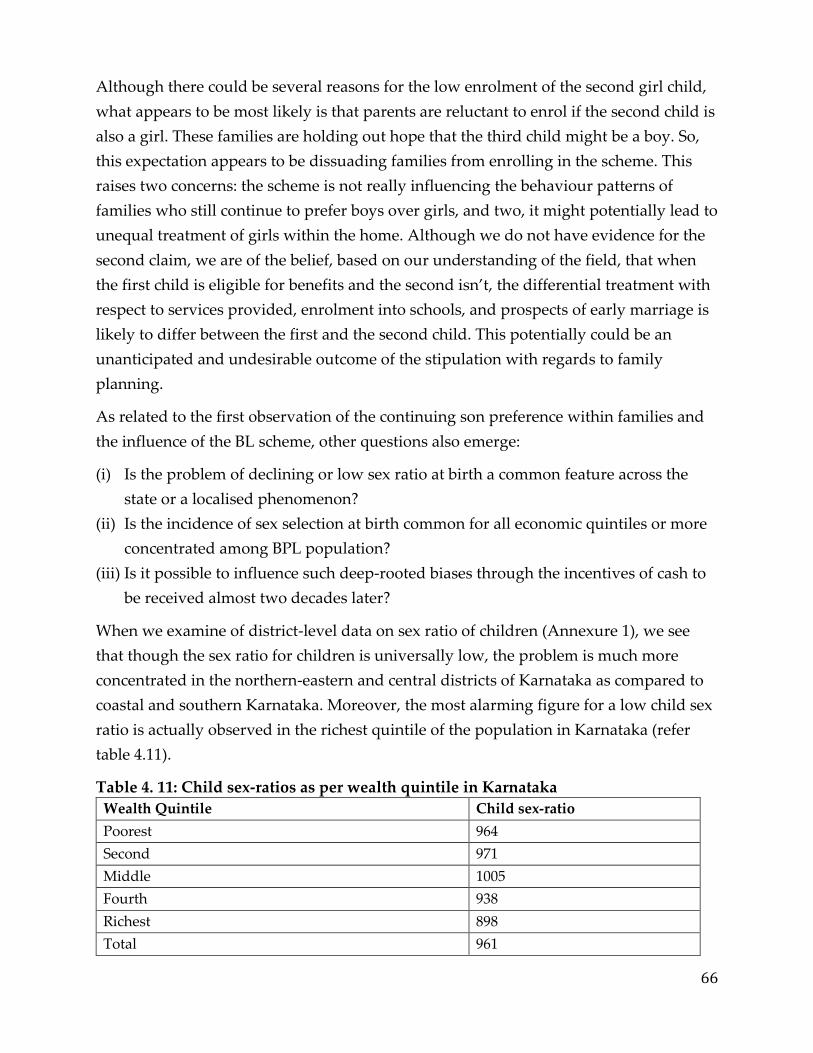
66
Although there could be several reasons for the low enrolment of the second girl child,
what appears to be most likely is that parents are reluctant to enrol if the second child is
also a girl. These families are holding out hope that the third child might be a boy. So,
this expectation appears to be dissuading families from enrolling in the scheme. This
raises two concerns: the scheme is not really influencing the behaviour patterns of
families who still continue to prefer boys over girls, and two, it might potentially lead to
unequal treatment of girls within the home. Although we do not have evidence for the
second claim, we are of the belief, based on our understanding of the field, that when
the first child is eligible for benefits and the second isn’t, the differential treatment with
respect to services provided, enrolment into schools, and prospects of early marriage is
likely to differ between the first and the second child. This potentially could be an
unanticipated and undesirable outcome of the stipulation with regards to family
planning.
As related to the first observation of the continuing son preference within families and
the influence of the BL scheme, other questions also emerge:
(i) Is the problem of declining or low sex ratio at birth a common feature across the
state or a localised phenomenon?
(ii) Is the incidence of sex selection at birth common for all economic quintiles or more
concentrated among BPL population?
(iii) Is it possible to influence such deep-rooted biases through the incentives of cash to
be received almost two decades later?
When we examine of district-level data on sex ratio of children (Annexure 1), we see
that though the sex ratio for children is universally low, the problem is much more
concentrated in the northern-eastern and central districts of Karnataka as compared to
coastal and southern Karnataka. Moreover, the most alarming figure for a low child sex
ratio is actually observed in the richest quintile of the population in Karnataka (refer
table 4.11).
Table 4. 11: Child sex-ratios as per wealth quintile in Karnataka
Wealth Quintile Child sex-ratio
Poorest 964
Second 971
Middle 1005
Fourth 938
Richest 898
Total 961

67
This is further corroborated by other studies conducted, such as the study on
Dhanalakshmi and by the UNFPA that indicates that child sex ratios are adverse across
economic strata, but are more skewed among the richly provided for (UNFPA-Kumar,
2015). Additionally, we observed in our field visits that there is hardly any difference
between the attitudes and perceptions toward the girl child between the APL and BPL
families. Issues of mobility and accessibility are a big constraint across all kinds of
economic households (refer tables in Annexure). Even if we look at other behavioural
factors such as the decision-making authorities in the family, we find that irrespective of
the income bracket, the patriarch, often the father of the recipient, is usually the
decision-maker of the family (refer tables in Annexure). Thus, limiting the scheme only
to BPL families is not justified, if the issues of gender bias, gender attitudes, and
gendered behaviour are fairly common across all strata of society.
As regards whether the BL scheme can address deep-rooted bias against the girl child,
the scheme engages with this aspect by directly trying to influence female foeticide. By
limiting only two children and having the provision that there is a need for certification
of family planning, it was pushing families towards choosing between anticipated
financial resources and social resources. This enrolment criteria raises ethical and
policy-prudence questions. The ethical questions are related to whether the state has a
right to determine the number of children any family wants to have. The answer
especially in a democracy is no, as it amounts to intrusion into the personal realm and
violates individual freedom. It becomes particularly questionable when it is linked with
access to a financial scheme meant only for BPL populations, as it makes this provision
also discriminatory. Those who are not accessing the scheme are free to have as many
children as they wish, but only BPL families are required to have family planning, if
they require means for some form of social and economic mobility.
The second point is whether it is the right policy vehicle for changing deep-rooted belief
systems. We know, from experience and from the literature, that the best way to reduce
birth rate is to educate and empower women. So, even from the policy-prudence
perspective, this measure alone appears to be ineffective. It might also be irrelevant,
given the birth rates across the spectrum have been historically going down. If we
consider that the total fertility rate of Karnataka was 1.9 (2011) which is lower than the
national average of 2.43. (Niti Aayog, 2013) and about 61 percent of the population had
already adopted some or the other form of family planning methods (IIPS, 2012-13), this
condition seems to be quite unnecessary.

68
Moreover, as per the latest rounds of NFHS, there has been a significant reduction in
the percentage of women who reported birth order of 3 and above i.e. it reduced from
28.8% in 2006 to 17% in 2016 (NFHS round 3, NFHS round 4). Our survey also
suggested that a very marginal number of households, only around 9% have more than
three daughters within the entire sample (refer table A47). The low enrolment of the
second girl child also clearly indicates that the scheme on its own is not able to engage
with the desire to have a son, and it is unlikely that a scheme of deferred cash transfer
without any additional measures or systems of creating empowerment is likely to
change these strong social norms.
It is postulated, based on these findings, that if the scheme is universally accessible to
all girls, it has to first tackle any inclusion and exclusions errors of targeting. The social
norms that are prevalent in all strata of society (including the upper classes) are also
addressed by the scheme, if it becomes universal. Moreover, we are able to limit intra-
household discrimination of girls, and more importantly, there is equal opportunities
for all girl children.
4.2 Understanding conditionalities
Now that we have examined the findings related to the enrolment, we will now
examine the various conditionalities that require fulfilment for the families to gain the
benefits of the scheme. We first start with the influence on immunisation, and then
move to education, child labour, and child marriage.
4.2.1 Immunisation
To consider the impact of immunization, it is important to examine the children who
are likely to be affected by the scheme. Given that the scheme was introduced in 2005-
2005 and that the completion of elementary stage of education has remained critical
markers for the scheme, we have decided to take the date of birth, 1st June, as the cu-off
date. We are also using this date based on the fact that DoE in Karnataka generally uses
this date for their age-appropriate admissions. The following two tables presents the
absolute as well as the percentages of those BL beneficiaries who have received
immunisation and have enrolled in an anganwadi centers, as per the MIS data.
Before we engage with the findings, it is important to note the timing of our data
collection. We were able to access this data in early 2017, and it is a reasonable
assumption to make that all those who are born at least before June 2010 (6 years and
above) should have been fulfilling all conditions. We have estimated the percentage of

69
those who received at least one immunisation, would have been enrolled in anganwadi
in the past and now in school. This proportion is very low, lower than even those who
fulfil at least one condition. As you will see in the following tables:
a. The number as well as proportion of those who fulfil even one of the three
conditions remains much lower than the total registration.
b. The number of those who fulfil all three conditionalities remain even lower. This
means that even those who fulfil one conditionality are not necessarily fulfilling the
others.

70
Table 4. 12: Conditionalities documented (in numbers) in terms of immunisation,
enrolment in anganwadi and enrolment in schools (2005-2006 to 2016-2017)
Cohort description
Total BL
enrolme
nt or
registrati
on
Number of
immunisations
received
(ever immunised /
cumulative data)
Ever
enroll
ed in
angan
-wadi
Ever
enroll
ed in
school
Three
conditio
ns
fulfille
d*
Born between (except
Row 1)
> 6 betwe
en 4 &
6
Betwe
en 1
&3
1 Born before 1.6.2006 43,476 9,065 10,669 831 12,205 26,937 9,094
2 1.6.2006 and 31.5.2007 1,85,769 41,54
9
51,307 4,181 57,898 1,25,59
6
39,679
3 1.6.2007 and 31.5.2008 1,40,697 29,37
5
38,129 3,726 41,195 1,02,77
9
22,392
4 1.6.2008 and 31.5.2009 41,465 15,24
8
20,015 2,700 22,313 17,839 3,420
5 1.6.2009 and 31.5.2010 2,24,598 14,61
4
17,504 2,990 20,870 307 43
6 1.6.2010 and 31.5.2011 2,60,599 9,767 13,133 2,572 13,849 21 0
7 1.6.2011 and 31.5.2012 2,30,986 3,939 7,661 1,514 6,815 1 0
8 1.6.2012 and 31.5.2013 2,15,702 1,831 3,674 1,053 3,053 0 0
9 1.6.2013 and 31.5.2014 2,64,355 1,408 1,978 832 1,149 2 0
1
0
1.6.2014 and 31.5.2015 1,90,484 597 1,272 514 448 0 0
1
1
1.6.2015 and 31.5.2016 2,22,460 11 346 353 47 0 0
1
2
1.6.2016 and 31.5.2017 2,16,198 0 58 123 0 0 0
22,36,789 1,27,4
04
1,65,7
46
21,389 1,79,84
2
2,73,48
2
74,628
*those who had received any immunisation ever, had ever been enrolled in an anganwadi and
had ever been enrolled in school.
Source: BL computerised database, DWCD, Karnataka (calculated)

71
Table 4. 13: Conditionalities documented (in percentages) in terms of immunisation,
enrolment in anganwadi and enrolment in school (2005-2006 to 2016-17)
Cohort description Proportion of those who
received immunisation*
Ever
enrolled
in
anganwa
di
Ever
enrolle
d in
school
Three
condition
s
fulfilled*
Born between (except
Row1) > 6
betwee
n 4 and
6
Betwee
n 1 and
3
1 Born before 1.6.2006 20.9
% 24.5% 1.9% 28.1% 62.0% 20.9%
2 Born between 1.6.2006
and 31.5.2007
22.4
% 27.6% 2.3% 31.2% 67.6% 21.4%
3 Born between 1.6.2007
and 31.5.2008
20.9
% 27.1% 2.6% 29.3% 73.0% 15.9%
4 Born between 1.6.2008
and 31.5.2009
36.8
% 48.3% 6.5% 53.8% 43.0% 8.2%
5 Born between 1.6.2009
and 31.5.2010 6.5% 7.8% 1.3% 9.3% 0.1% 0.0%
6 Born between 1.6.2010
and 31.5.2011 3.7% 5.0% 1.0% 5.3% 0.0% 0.0%
7 Born between 1.6.2011
and 31.5.2012 1.7% 3.3% 0.7% 3.0% 0.0% 0.0%
8 Born between 1.6.2012
and 31.5.2013 0.8% 1.7% 0.5% 1.4% 0.0% 0.0%
9 Born between 1.6.2013
and 31.5.2014 0.5% 0.7% 0.3% 0.4% 0.0% 0.0%
1
0
Born between 1.6.2014
and 31.5.2015 0.3% 0.7% 0.3% 0.2% 0.0% 0.0%
1
1
Born between 1.6.2015
and 31.5.2016 0.0% 0.2% 0.2% 0.0% 0.0% 0.0%
1
2
Born between 1.6.2016
and 31.5.2017 0.0% 0.0% 0.1% 0.0% 0.0% 0.0%
Note: Percent distribution for respective year’s enrolment/registration with BL
*those who had received any immunisation ever, had ever been enrolled in an anganwadi and
had ever been enrolled in school.
Source: BL computerised database, DWCD, Karnataka
The proportion of children fully immunized in Karnataka went up to about 63 percent
in 2015-16 (NFHS IV) from 55 percent in 2005-06 (NFHS III). In the absence of complete
data, it is not clear if the BL scheme played any role in enabling the improvement or
72
not. If the MIS data were complete, a comparison with BL enrolees versus total
population could be made for the years for which NFHS data is available. Although this
conditionality has since been dropped, when examining the records, there was
ambiguity with respect to the language used for describing this conditionality:
‘vaccinated for immunity from health department’. This conditionality does not
elaborate on how many rounds were necessary as a condition for the scheme and at
what age they were needed.
When asked about this discrepancy between the registrations and the level of
immunisation, the WCD department informed us that the MIS data does not reveal the
actual picture as these have remained unfilled, and therefore absent data does not
necessarily imply that they are not fulfilling the conditions. Instead, it simply means
that that the details are not yet filled. This is mainly attributed to a large number of
vacancies in the department and the consequent lack of human resources to collect the
data from various departments and then fill it for every individual. Because
immunisation data is collected from Department of Health and the school data is
collected from the Department of Education, they do not always have up-to-date
information on the same11. In such a situation, the following concerns arise.
The purpose of the MIS becomes largely redundant if it is not used for the purpose of
monitoring, even with a time lag. If there is no cut-off date for filling the information
and report generation, the data collected becomes an exercise that has no fruitful end.
The other concern is that if the MIS is not being updated continually, especially in a
cash transfer scheme, where conditionalities are time-sensitive, it can result in recipients
not able to receive the benefits because of a gap in information. For example, if
intermittent interventions do not take place to ensure that the conditionalities are being
fulfilled, it is highly possible that at the age of 18, a girl is denied her due because she
has not fully been immunised or received early care education. Early tracking, up-to-
11Source: Interview with Assistant Director, DWCD dated July 31, 2017.

73
date records and continuous monitoring, therefore, is critical for the scheme to function
effectively.
Our secondary data analysis has pointed out that with increased emphasis on
immunisation by the Department of Health, the rates of immunisation everywhere has
been going up (CBPS, 2016). We argue that this is also one of the reasons why this
conditionality was dropped from the list. However, the fact remains that though the
situation has improved, all children are still not fully immunised. Sex-segregated data is
not easily available but it is likely that the situation is worse for girls, and needs
attention. Also, CCT programmes in other contexts have shown impact on
immunisation, especially if income poverty is the reason and if the benefits are
immediate and directly linked. In this case, there was no direct link, as no benefit was
being transferred immediately as a result of immunisation. Now, we will examine the
more critical conditionalities that do have to be fulfilled in order to receive benefits from
the scheme: participation in education.
4.2.2 Education
With regard to age-appropriate enrolment in schools, the following table indicates the
distribution of BL recipients across the classes. When we examine the data for all girls
born before 1st June 2006 who should be studying in class IV or V, we find that about
half of these are studying I to III. The pattern is similar for other cohorts as well. This
reveals that the MIS is not facing only the issue of missing data but also the veracity of
the data being filled.
Table 4. 14: Conditionalities related to enrolment in education (in 2017) Presently enrolled* in schools as per the enrolled class
Cohort Class
I
Class
II
Class
III
Class
IV
Class
V
Class
VI
Class
VII
Class
VIII
Born before
1.6.2006
4,811 2,545 5,182 11,094 3,008 293 4 0
Born between
1.6.2006 and
31.5.2007
19,780 18,064 41,125 40,673 5,604 338 8 2
Born between
1.6.2007 and
31.5.2008
14,705 39,113 41,264 7,185 471 37 3 0
Born between
1.6.2008 and
31.5.2009
4,791 10,473 2,314 243 15 3 0 0
*data collected in early 2017
Source: BL computerised database, DWCD, Karnataka

74
These patterns might have a relationship with the scholarship programme that was part
of the original scheme as an interim incentive to promote continued schooling and
promotion in schools. This was discontinued since mid-2008. The amount for girls
registered during the period when the benefit was part of the scheme is being now
added to the bond amount so that she receives it along with the lump sum maturity
amount. The amount was earlier being deposited to the joint bank account of the girl
and her mother after a process of verification with the concerned anganwadi worker
along with the supervisor. Once the pass certificate from the head of the school is
received, the supervisor enters the data into the online database, which is then verified
by CDPO, followed by Deputy Director, and finally, the Director of the DWCD. After
all the rounds of recommendation, the amount is transferred to the LIC.
The main reason for the discontinuation was evidently the difficulty associated with
locating the child and therefore, in administering the annual disbursement of the
amount. Huge gaps were recorded in the allocated amount for scholarships and the
spent amount. Due to these inclusion errors, the scholarship was removed. The
Department plans on restarting these once the MIS is linked to that of the DoE, where
the Aadhar card details of all children are listed. This would help in reducing the
inclusion errors and make tracking easier.12
The objective of the scholarships was to incentivise continued schooling and since the
final claim is subject to verification of elementary school completion, it was considered
logical to merge the scholarship with final disbursal. But as mentioned earlier, it is not
clear what happens if the girl is not attending the school. There is no measure to check
this and intervene in absence of timely and regular updating of the data. Another
argument given by the DWCD is that the subsequent introduction of the Right to
Education (RTE) Act in 2009 that made detention at the elementary stage illegal also
made the scholarships irrelevant.
12Source: Interview with Assistant Director, DWCD dated July 31, 2017.
75
Another conditionality that was dropped was related to enrolment in anganwadi. The
dropping of this conditionality was taken to ensure that girls could go to any early
childcare facility and it was perhaps not critical to only go to an anganwadi. However,
the fact that the condition has not been replaced by enrolment in any other pre-school
or child care centre effectively means that this condition is entirely dropped. As with
immunisation, this condition also faced the problem of unclear definition: it was not
clear if ‘attending an anganwadi regularly’ implied enrolment or attendance or both.
Again, as in case of immunisation, in absence of complete BL data, any examination of
the impact is not possible.
However, the issue of poor coverage of children in general, and girls in particular, on
early childhood care and education remains an issue (Kaul., V. et al, 2017). It is not clear
dropping of this conditionality serves the purpose of the scheme. It is, of course,
encouraged that children are provided early childhood care and education, but it is
important to note, as has been pointed out in Chapter 2, that participation in education
can be incentivised only if the supply of institutions and educational resources are
universal and high-quality. CCTs alone cannot enable the demand. In other words,
although there is a need to push for and expand the participation of children, especially
girls, in the early childhood care and education services, it is difficult to be sure about
the fact that CCT-based schemes are the best policy solution towards that end.
These patterns are also reflected in our primary data. We found, especially through our
FGDs that the problems of girls’ education are not necessarily related to the wishes of
the parents, nor is it related to lack of financial resources (BPL families). We found that
the problems of infrastructure (availability of schools) and mobility (lack of buses) and
prevailing attitudes towards girls are pervasive in nature. Responses from all
stakeholders indicate that all girls (regardless of income or caste status) would benefit
by being supported in their education, through the provision of educational resources
as well as community support. Although many parents and community members feel
that educational prospects have improved for both girls and boys and they do commit
to educating their daughters and sons equally, many adolescent girls do not hold these
views. Many girls feel that while they were treated equally when they were younger,
the difference in treatment between their brothers and them appears to expand as they
are growing up. For example, parents appear to always delay purchasing things or
clothes for the girls, but they will attend to the needs of their brothers immediately.
They also feel that they do not show the same kind of love.
76
This difference in the treatment is also reflected in the disappearance of their friends
and classmates from the schools. In some of the villages, many girls report that their
classmates in 7th and 8th class are currently married or are at home. The dropout rates,
even in our small survey sample, appears to be at least 18% among SC and ST groups,
and as high as 55% in Muslim families. So, it was not surprising that there were several
girls in the focus group discussions whose parents discontinued their studies after 8th.
When asked the reason, the reasons were vague, and often centred around concerns of
distance and ‘safety’. When asked what they could potentially do about it, the girls felt
that given there was no way to convince their parents, they could do nothing.
Some of the children were clearly aware that their educational prospects were limited
because of the severe financial constraints under which their families lived in. It was
observed that the dropout rates were higher among the households having more than 5
family members as compared to lower family members, signalling some distress and
pressure with regards to sustenance of the family. Even school-going children report
working in the fields before heading to school as a way to support their families. While
their aspirations are to become a doctor, a teacher, and a lawyer, some children,
especially those who have dropped out, appear to understand that structural
constraints of going to school are too high to surmount.
When we tried to engage with these adolescent girls about negotiating for their futures
through the benefits derived from the BL scheme, they appeared to have a very limited
understanding of the BL scheme. While they were able to state the rationale and the use
of the scheme, they do not seem to know about the various benefits of the scheme, and
show no evidence to indicate any ownership of the bond money that they are due to
receive. In most of the focus group discussions, the girls (as well as their parents and
community members) indicate that the bond money is most likely to be used to mitigate
wedding expenses, rather than fund their education.
Part of these structural constraints are the social narratives and roles of being a ‘good
daughter’. Many adolescents feel powerless to make their own decisions with regards
to education, marriage and livelihood choices without the permission of their parents or
because they feel that later these decisions would ultimately rest with the members at
the marital home. The parents also feel that there is no point in further education when
marriage is the ultimate destiny for the girls. In fact, in one of the interviews, one of our
respondents clearly stated that a girl’s education is often dependent on the norms of
education held by the community. If the boys do not pursue higher education, it is
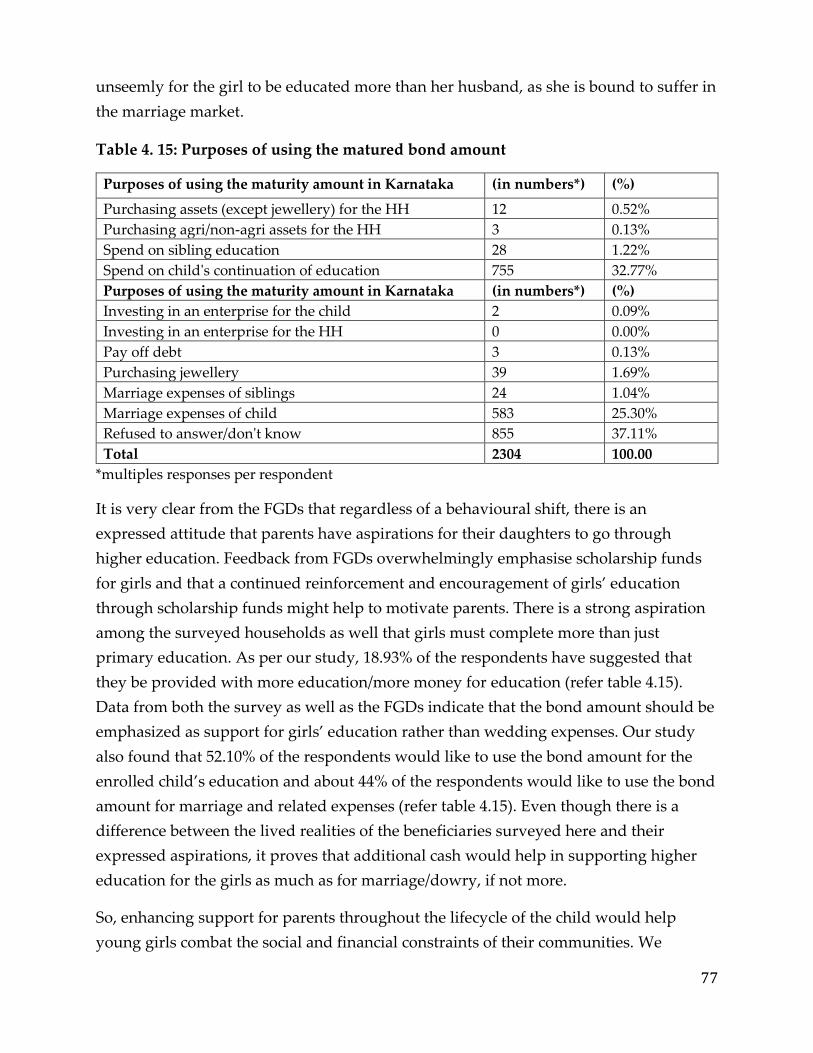
77
unseemly for the girl to be educated more than her husband, as she is bound to suffer in
the marriage market.
Table 4. 15: Purposes of using the matured bond amount
Purposes of using the maturity amount in Karnataka (in numbers*) (%)
Purchasing assets (except jewellery) for the HH 12 0.52%
Purchasing agri/non-agri assets for the HH 3 0.13%
Spend on sibling education 28 1.22%
Spend on child's continuation of education 755 32.77%
Purposes of using the maturity amount in Karnataka (in numbers*) (%)
Investing in an enterprise for the child 2 0.09%
Investing in an enterprise for the HH 0 0.00%
Pay off debt 3 0.13%
Purchasing jewellery 39 1.69%
Marriage expenses of siblings 24 1.04%
Marriage expenses of child 583 25.30%
Refused to answer/don't know 855 37.11%
Total 2304 100.00
*multiples responses per respondent
It is very clear from the FGDs that regardless of a behavioural shift, there is an
expressed attitude that parents have aspirations for their daughters to go through
higher education. Feedback from FGDs overwhelmingly emphasise scholarship funds
for girls and that a continued reinforcement and encouragement of girls’ education
through scholarship funds might help to motivate parents. There is a strong aspiration
among the surveyed households as well that girls must complete more than just
primary education. As per our study, 18.93% of the respondents have suggested that
they be provided with more education/more money for education (refer table 4.15).
Data from both the survey as well as the FGDs indicate that the bond amount should be
emphasized as support for girls’ education rather than wedding expenses. Our study
also found that 52.10% of the respondents would like to use the bond amount for the
enrolled child’s education and about 44% of the respondents would like to use the bond
amount for marriage and related expenses (refer table 4.15). Even though there is a
difference between the lived realities of the beneficiaries surveyed here and their
expressed aspirations, it proves that additional cash would help in supporting higher
education for the girls as much as for marriage/dowry, if not more.
So, enhancing support for parents throughout the lifecycle of the child would help
young girls combat the social and financial constraints of their communities. We

78
already know that Karnataka has attained gender parity almost at all levels of education
and is a little away from attaining universal enrolment even at elementary level. The
situation is worse at secondary and tertiary level (CBPS 2015). Therefore, enhancing the
demand for education, especially at upper primary and secondary levels, is a stated
need, not only looking at our data, but also from the children themselves. But given that
the expansion of educational services at the secondary and tertiary levels has happened
primarily in the fee-paying private sector and also that access is an issue for both girls
and boys, one can again not be sure if a CCT-based policy, especially if the support
comes at the end of 18 years, is the best option.
It is, however, important to add that, all districts have not attained gender parity at all
levels of schooling and, therefore, the need for a differentiated approach still exists. A
need to re-engage with the scheme and its proposed objectives is illustrated also
through our examination of child marriage and child labour, two sociological outcomes
that the BL scheme aims to address.
4.2.3 Child marriage and child labour
As illustrated in the previous sections, we already know that while prenatal sex
selection and female foeticide continue to be major concerns that require to be
addressed through public policy, they are not restricted only to BPL families. In fact,
there seems to be little justification for restricting the scheme to BPL households as
“child sex ratios were adverse across economic strata, but were more skewed among the
well-off” (Kumar, 2015). The economically better off households being particular about
keeping the family size small, in fact, attach greater importance to having at least one
male child and are prone to prenatal sex selection. Moreover, access to sex-selection
choices is available only to those who can afford them and therefore skewed against the
poor. Data from secondary sources such as DLHS also shows that the incidence of child
marriage and low child sex ratios are not limited to the lowest income quintiles of the
population alone. The incidence of child marriage, as a phenomenon, is prevalent
(although unequally) across all the income quintiles of the population in Karnataka.
Though the prevalence is higher for the poorer quintiles (refer table 4.16) the richest
class is no exception to the phenomenon of child marriages. Additionally, the
relationship between poverty and early marriage is also generally weak in places where
the practice is more prevalent due to a number of social customs and traditions (Jha et
al, 2016). This includes parts of Andhra Pradesh, Gujarat, Rajasthan and North
Karnataka. Similarly, girls’ engagement in labour is largely in the form of care work or
contributions to home-based work, highly unlikely to be reported in any form.

79
Table 4. 16: Child marriage among girls against wealth quintile in Karnataka
Wealth quintile Percentage of child marriage among girls
Poorest 47.15
Second 34.70
Middle 21.65
Fourth 13.12
Richest 3.03
Total 22.61
(Calculated by taking the (number of married in a particular age group) * (100)/ (total number
married) (**Married Since January 1st 2004)
Source: DLHS 3 - 2007-2008 - Household Survey)
Another point for discussion is the assumption that if a child is enrolled in school, then
she is unmarried and also not engaged in labour.13In fact, if we examine our data, we
find that girls are overwhelmingly performing gendered work such as cleaning the
house work, washing vessels and clothes, and helping out with cooking. They are also
very clear that apart from occasionally helping out their family by doing a few farm
chores, boys rarely perform any ‘house work’, and are mostly playing. In some areas,
girls are also performing paid work or family farm work as a way of supporting their
families, often before school hours and at times, after school hours too. It is abundantly
clear from the study that the girls rarely have any leisure time, and these norms around
care work are so strict that girls often dismiss the question regarding their brothers
doing similar kinds of work.
It is undeniable that care work is important for the development of the family, but the
unequal distribution of the care work has implications not just on the time distribution
of girls and the enshrining of the ‘second shift’ (Hoschild, 1989) for young girls, but also
on the shrinking of opportunities for developing their own capabilities. The reason why
norms around care work are particularly important to examine and question at the
13Source: Interview with Assistant Director, DWCD dated July 31, 2017

80
adolescent age is because it is a strong indication of the socialisation of the young girl
into specific roles and responsibilities. These duties are often typified into rigid gender
roles and expectations and are ultimately linked to experiences of well-being (Bulender
2010).
These norms, therefore, have implications beyond the educational prospects of young
women, but also on the way in which they are able to engage with the ‘naturalness’ of
this role construction. Without accounting for this very important aspect of girls’ lives,
expansion and support for educational opportunities are likely to have limited success.
In the case of marriage, this assumption can be highly suspect as examples of continued
schooling after marriage are not rare (Jha, et al, 2016). A related and more important
question about this particular conditionality is whether this scheme is being
systematically used towards ensuring that girls get married instead of girls being
education. The design of the scheme itself appears to encourage this. For instance, the
fact that enrolled girls would now receive a single cash transfer once they turn 18 could
be viewed as a dowry payment and hence promote regressive behaviours which is
clearly not the intention of the policy. Even the name Bhagya Lakshmi (meaning someone
who is feted to bring wealth) is regressive (Ghatak& Narayanan, 2013; Sekher, 2012)
and suggestive of an instrumental approach towards women’s education. In general, in
the absence of any focus on empowerment, the scheme remains not only instrumental
but also weak in its design, especially given the challenges.
As mentioned before, the evaluations of such schemes elsewhere, especially in India,
have clearly shown that they fail to change the social norms towards and social
positioning of women. One of the key areas in which this is clear, even to the girls
themselves, is in the area of physical mobility. Many girls feel that that their mobility
has remarkably decreased as they are growing up. About 70% of the respondents in our
FGDs shared that the level of care work to be performed, the dangers of sexual
harassment, and the fear of parents that the girls will ‘fall in love’ are all reasons for
these restrictions. Parents often prohibit children’s schooling acting on all of these fears.
In one instance, one of the children reported that she had to stop going to school, even
though her parents were willing to send her, because her neighbours convinced her
parents that she would be ‘spoilt’ by college. Therefore, fearing community
disapproval, the parents did not want to send her. Girls also report that their parents
have started restricted them on playing and going out alone as ‘boys will be there’.
81
The restrictions placed upon the girls in the guise of ‘safety’ or protecting her honour
falls within the social norms of ensuring that women and girls do not exercise their
right to education, to public space, and to their own lives. Moreover, the problem of
creating this discourse of the ‘safety of girls’ is that it accepts the reality of sexual
harassment, but refuses the reality of rape, sexual abuse, and domestic violence
experienced by girls within their own homes. So, one form of violence is seen and
accepted as a way to restrict mobility of girls, while the other is not openly
acknowledged as a frequent experience of adolescent girls within their ‘safe’ homes.
We already know that a third of all girls in most countries of the world report
experiencing significant levels of violence before they reach the age of 18, and the
likelihood of this violence increases in the cases of child marriage (Bruce, 2011). So, it is
not surprising that even in our small sample, some of the girls had witnessed,
experienced, and had knowledge about violence. For example, one of the girls told us
that the men often take money from their families to drink, and occasionally, they will
fight and kill their loved ones. One of the girls narrated a story where her uncle hit his
wife who fell in a well and drowned. In fact, the girls held very sophisticated and
informed views about the relationship between dowry, marriage, violence, and suicide.
While some of this knowledge might be derived from exposure to mass media, it also
appears that the knowledge comes from their own personal experience of watching
their mothers being hit by their fathers, and on some occasions, experiencing it
themselves. We found that children’s aspirations are often coloured by the experience
of violence. In one instance, a girl told us that she wanted to be a policewoman so that
she could stop the violence that happens in homes like hers.
It is clear from the focus group discussions that the girls do not connect the violence
that they experience within the home to the one that they experience outside of the
home. They do not necessarily see that it originates from the same narrative that
subjugates women’s bodies to violence. The girls are also sometimes unaware of the
dissonance that they are narrating: they are often very aware that the violence in and of
itself is wrong and unfair, and yet, they are also accepting of its presence in their life.
This normalisation of violence and the false narrative of ‘safety’ within the home that
restricts their access to public life and modes of knowledge, therefore, has to be more
critically addressed to truly empower young women.
In these circumstances, it is difficult to imagine that a cash transfer at the end of 18 years
is likely to transform social narratives that have already trapped women into social

82
roles, fundamentally harmful to them. Instead, it is better to engage with a process-
based empowerment process (such as the one employed in Mahila Samakhya) to truly
address the problems of girl child education, child marriage, or child labour. If specific
measures have to be taken, they also must engage with community acceptance and be
addressed at the community level, instead of merely operating in the individual level.
For instance, the much-celebrated bicycle scheme in Bihar which a number of
evaluations have identified as a major success in terms of enabling girls’ mobility and
secondary school participation has apparently succeeded because it was a universal
scheme allowing a critical number of girls coming together and using their bicycles. In
this process, social norms dictating that girls do not ride cycles, do not go to school, and
do not go out of the villages were addressed through a simple process. The fact that it
included all castes and classes also helped, as gendered social norms are not applicable
only to the lower socio-economic strata (Ghatak, Kumar and Mitra, 2013; MMR
undated; Muralidharan and Prakash, 2013; Sumangala, undated).What also helped was
that secondary schools were available within a radius of three to five kilometres – a
longer distance would have been difficult to negotiate, as shown by the Gujarat
experience where a similar programme did not lead to similar results (Jha, et al, 2016).
Therefore, it is very important for the programme to take into consideration the
discursive and structural power that social norms hold over many of these practices,
and have to address these more directly.
In order for us to understand exactly how this process could unfold, we also
investigated the implementation of the scheme, from the point of view, of the
government, especially in relation to the associated social protections aspects of the
scheme. We tried to gain a better understanding of the overall distribution of the uptake
of the scheme, the structural processes necessary for implementation and reviewed the
budgetary and financial spending, in order for us to create a framework of
recommendations.
4.3 Structural processes of BL
4.3.1 Geographical variation of BL scheme
As indicated in the previous sections, instead of focusing on BPL families, there appears
to be some indications that a universal approach or a regional approach to tackling
gender inequality might be in order. In order for us to get a clear picture of the intra-
state level dynamics, we carried out disaggregated analysis of districts in view of the
83
fact that inter-district disparities for various development and gender-disparity
indicators are sharp in Karnataka.
A comparison of district-wise distribution of BL enrolment and BPL populations reveals
some very interesting patterns and raises questions difficult to answer. Based on BPL
estimates for the districts and respective sizes of BPL population in every district, we
estimated the proportion of the total state BPL population for each district. This exercise
uses the 2011 population figures as sourced from the Census of India. Then, we
compared this percentage with the proportion of the total BL enrolment of each district
in comparison to the total state enrolment. We have estimated BL enrolment shares for
districts for two financial years, 2010-11 and 2011-12, given that the enrolment was high
in one (2010-11) and low in another (2011-12); a comparison with BPL numbers would
tell us if there was any shift in the comparative picture. These two years also used two
different documents to support the BPL status for BL enrolment. A comparison between
these two time periods could also indicate if the said documentation makes the
difference in terms of comparison with BPL population share. The relative share of BPL
population is assumed to be constant and, therefore, those estimates are only for one
year for which poverty estimates are available, 2011-12.
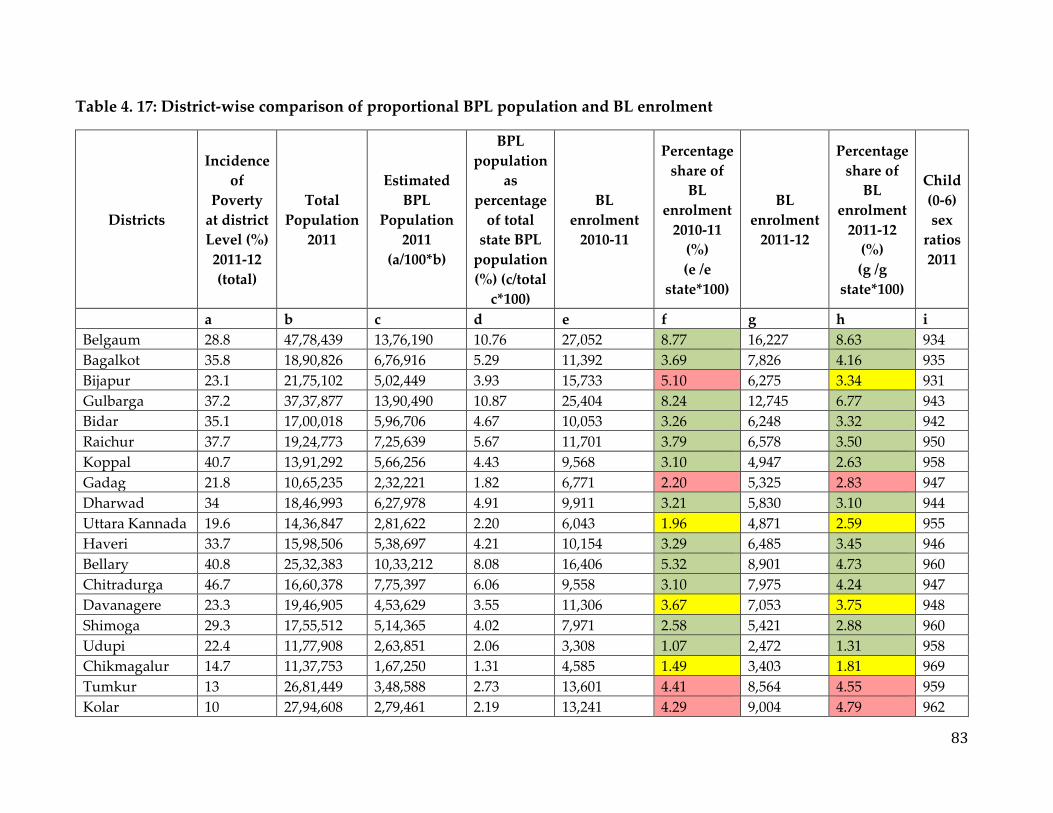
83
Table 4. 17: District-wise comparison of proportional BPL population and BL enrolment
Districts
Incidence
of
Poverty
at district
Level (%)
2011-12
(total)
Total
Population
2011
Estimated
BPL
Population
2011
(a/100*b)
BPL
population
as
percentage
of total
state BPL
population
(%) (c/total
c*100)
BL
enrolment
2010-11
Percentage
share of
BL
enrolment
2010-11
(%)
(e /e
state*100)
BL
enrolment
2011-12
Percentage
share of
BL
enrolment
2011-12
(%)
(g /g
state*100)
Child
(0-6)
sex
ratios
2011
a b c d e f g h i
Belgaum 28.8 47,78,439 13,76,190 10.76 27,052 8.77 16,227 8.63 934
Bagalkot 35.8 18,90,826 6,76,916 5.29 11,392 3.69 7,826 4.16 935
Bijapur 23.1 21,75,102 5,02,449 3.93 15,733 5.10 6,275 3.34 931
Gulbarga 37.2 37,37,877 13,90,490 10.87 25,404 8.24 12,745 6.77 943
Bidar 35.1 17,00,018 5,96,706 4.67 10,053 3.26 6,248 3.32 942
Raichur 37.7 19,24,773 7,25,639 5.67 11,701 3.79 6,578 3.50 950
Koppal 40.7 13,91,292 5,66,256 4.43 9,568 3.10 4,947 2.63 958
Gadag 21.8 10,65,235 2,32,221 1.82 6,771 2.20 5,325 2.83 947
Dharwad 34 18,46,993 6,27,978 4.91 9,911 3.21 5,830 3.10 944
Uttara Kannada 19.6 14,36,847 2,81,622 2.20 6,043 1.96 4,871 2.59 955
Haveri 33.7 15,98,506 5,38,697 4.21 10,154 3.29 6,485 3.45 946
Bellary 40.8 25,32,383 10,33,212 8.08 16,406 5.32 8,901 4.73 960
Chitradurga 46.7 16,60,378 7,75,397 6.06 9,558 3.10 7,975 4.24 947
Davanagere 23.3 19,46,905 4,53,629 3.55 11,306 3.67 7,053 3.75 948
Shimoga 29.3 17,55,512 5,14,365 4.02 7,971 2.58 5,421 2.88 960
Udupi 22.4 11,77,908 2,63,851 2.06 3,308 1.07 2,472 1.31 958
Chikmagalur 14.7 11,37,753 1,67,250 1.31 4,585 1.49 3,403 1.81 969
Tumkur 13 26,81,449 3,48,588 2.73 13,601 4.41 8,564 4.55 959
Kolar 10 27,94,608 2,79,461 2.19 13,241 4.29 9,004 4.79 962

84
Districts
Incidence
of
Poverty
at district
Level (%)
2011-12
(total)
Total
Population
2011
Estimated
BPL
Population
2011
(a/100*b)
BPL
population
as
percentage
of total
state BPL
population
(%) (c/total
c*100)
BL
enrolment
2010-11
Percentage
share of
BL
enrolment
2010-11
(%)
(e /e
state*100)
BL
enrolment
2011-12
Percentage
share of
BL
enrolment
2011-12
(%)
(g /g
state*100)
Child
(0-6)
sex
ratios
2011
a b c d e f g h i
Bangalore urban 1.5 95,88,910 1,43,834 1.12 19,286 6.25 5,858 3.11 944
Bangalore Rural 15.7 9,87,257 1,54,999 1.21 4,430 1.44 2361 1.25 951
Mandya 16.4 18,08,680 2,96,624 2.32 9,499 3.08 6,655 3.54 939
Hassan 11.6 17,76,221 2,06,042 1.61 8,161 2.65 6,006 3.19 973
Dakshina
Kannada 1.6 20,83,625 33,338 0.26 3,156 1.02 3,131 1.66 948
Kodagu 1.5 5,54,762 8,321 0.07 1,529 0.50 985 0.52 978
Mysore 15.5 29,94,744 4,64,185 3.63 13,653 4.43 10,296 5.47 961
Chamarajanagar 1.6 10,20,962 16,335 0.13 5,616 1.82 4,532 2.41 953
Ramanagar 10.5 10,82,739 1,13,688 0.89 4,777 1.55 3,053 1.62 962
Total 21.2 635,58,066 127,88,283 100.00 3,08,460 100.00 1,88,128 100.00
*NOTE: Yadagir and Chikballapur have been carved out of Gulbarga and Kolar in 2010 and 2007 respectively. Separate population and
poverty estimates are not available for these two districts. Hence, BL enrolments and total population have been included in their
erstwhile districts for the purpose of this table. Sources: Total Population 2011 from Census of India, 2011; BPL percentages from Draft
MDG Report, GoK (based on MPCC-based estimates using NSS data), BL enrolment from BL computerised database, DWCD, Karnataka;
Child sex ratios – Census 2011 and District Handbooks 2011.

85
Given that the scheme is for BPL alone, in an ideal situation, the percentage share of
BPL population and percentage share of BL enrolment should match for respective
districts, if the distribution is equal across all districts. However, this is not necessarily
true in most cases. In general, the districts with higher BPL populations, mostly located
in north-east and central parts of the state, had relatively lower representation in BL
enrolment (indicated in green in the table above), and districts with relatively lower
share of BPL populations in coastal and southern Karnataka had a relatively higher
share of BL enrolment (indicated in red in the table above). Nevertheless, Belgaum and
Gulbarga (including Yadgir) districts with more than ten per cent of the state’s BPL
population each also had the highest percentage share of the state’s BL enrolment in
both the years. Bijapur and Gadag in the north, Uttar Kannada on the coast, Davangere
and Bangalore rural among central districts have somewhat matching BPL and BL
enrolment percentages (shown in yellow in the table above). Bangalore urban with a
share of slightly higher than one per cent BPL population, had more than 6 per cent
share in 2010-11, which came down to a little higher than 3 per cent in the following
year.
These variations continued even after the requirement of proving BPL changed from
income certificate to the BPL card. It is difficult to understand the reasons for this
pattern through the analysis of literature or limited consultations that we have had at
the state level for this study. One can only surmise that the high level of awareness in
relatively developed districts coupled with probably higher efforts from the
administration resulted in higher enrolment in these districts. But this is also a worrying
pattern given that while the child sex ratio is adverse in all the districts, it is generally
(not universally) worse than others in the northern districts.
Considering that the MIS data is far from complete, any district-wise analysis is not
going to depict the correct picture. However, a perusal of data on immunisation,
anganwadi enrolment and school enrolment shows that though all districts have major
backlogs, certain districts such as Belgaum, Udupi and Dakshina Kannada seem better
than others in terms of having relatively less proportion of missing data (Annex 1). To
gain a better understanding of the process of implementation, we did conduct a
detailed review of anganwadi activities to shed some light on these patterns.
86
4.3.2 Implementation processes
From our understanding of the literature review as well as our field observations and
interactions, we know that in the BL scheme, the Anganwadi Worker (AWW) is
primarily responsible for identifying the eligible girl child. She is the one providing the
application form and collecting all the relevant documents (BPL Card, caste certificate,
marriage certificate/affidavit, birth certificate, etc.) from the beneficiary households. As
per our primary survey, about 23% of the total beneficiary responses have suggested
that the documentation required for enrolment be reduced and about 15% of them have
suggested that the Anganwadi be made a single point for all the paperwork (refer Table
1.2). In a few focus group discussions (FGDs) as part of our study, the village
community elders shared that they are unable to understand as to why all the
documents required for enrolment cannot be collected at the time of the child’s delivery
itself.
The enrolment process also contains multiple levels of scrutiny and review before the
final approval is granted by the DWCD. The semi-structured interviews and a review of
secondary documents from the Department has provided certain insights into the entire
process of clearances and approvals at various levels of the Department. Firstly, the
AWW forwards the application along with the supporting documents to the supervisor.
Interviews with supervisors revealed that on an average, they spend about 0.5-1 days a
month to verify all the documents after which it is forwarded to the BL case worker
(appointed at the Taluk level). The case worker is most likely a supervisor or a first
division assistant (FDA)/accountant who has been given an additional responsibility of
managing all the BL scheme related processes and issues. Most BL case workers
perform two rounds of verification – once, upon the receipt of the application along
with all the supporting documents from the Supervisor and, again, when the
information has been uploaded online on to the MIS by the computer operator.
Depending upon the number of applications to be verified, a BL case worker spends
anywhere between 1-2 days a month on this activity.
The Child Development Project Officer (CDPO) then tallies all the submitted documents
and other details submitted by the supervisor through the online portal and forwards
all the correct eligible applications to the Deputy Director. These applications are then
verified again by the Deputy Director with respect to the eligibility criteria and then a
final sanction order is issued. The BL case worker is also involved in coordinating this
entire approval process with both the CDPO and the Deputy Director and again

87
depending upon the number of applications; the case worker spends about 4-8 days a
year on these two activities. A BL bond ID is issued after the computerized registration
and a receipt for the same is handed over to the AWW for eligible applications, who, in
turn, distributes it to the concerned applicants. The sanctioned applications are then
forwarded to LIC for issuing a bond in the name of the beneficiary. The case worker
also spends about 8-10 days a year in maintaining and updating all the BL records
online and about 15-20 days a year on systematically filing all the hardcopies
(beneficiary applications along with all the supporting documents). This is a mandatory
compliance requirement since the records could be scrutinized during periodic audits.
Even though an MIS has been developed for maintaining these records, as evidenced
earlier, it is not being filled and updated regularly (CBPS, 2017). In the absence of a
proper and functional system of online submission/scanning of documents, the
hardcopies need to be preserved in good condition by the DWCD till the child turns 18
years of age. This is a highly daunting and challenging task for the supervisors. As per
LIC, the multiple levels of verification and approvals have also led to significant delays
in receiving the applications along with the supporting documents. This results in a
reduction of the lock-in period for the bond that directly affects the final maturity
amount,
There is a delay in the distribution of LIC bonds to the beneficiaries despite submission
of all the documents from the WCD to LIC. The frontline AWWS face a lot of pressure
from the local community and elected representatives because of this. It would help to
have a system of voluntary disclosure where WCD annually announces a taluk-wise list
of registered births of girls and BL enrolment (BPL or all, as the case may be) ID, and
gives the details of (i) submission of records and transfer of money to LIC, (ii) issue of
bonds by LIC and (iii) pending cases.
At present, all bonds first go to CDPO who has the responsibility of distributing it
further. Since bond is an individual instrument, LIC can be asked to send the bond
directly to the household while a true copy may be sent to CDPO, who in turn, can
share the list of true copies received in Gram Sabha or any other public meeting.
On the other hand, currently, there is no reporting system or communication between
LIC and CDPO when a health, accident or death insurance claim amount has been
processed and directly transferred to the bank account of the concerned beneficiary. A
reporting structure needs to be put in place so that the CDPO could also track the status
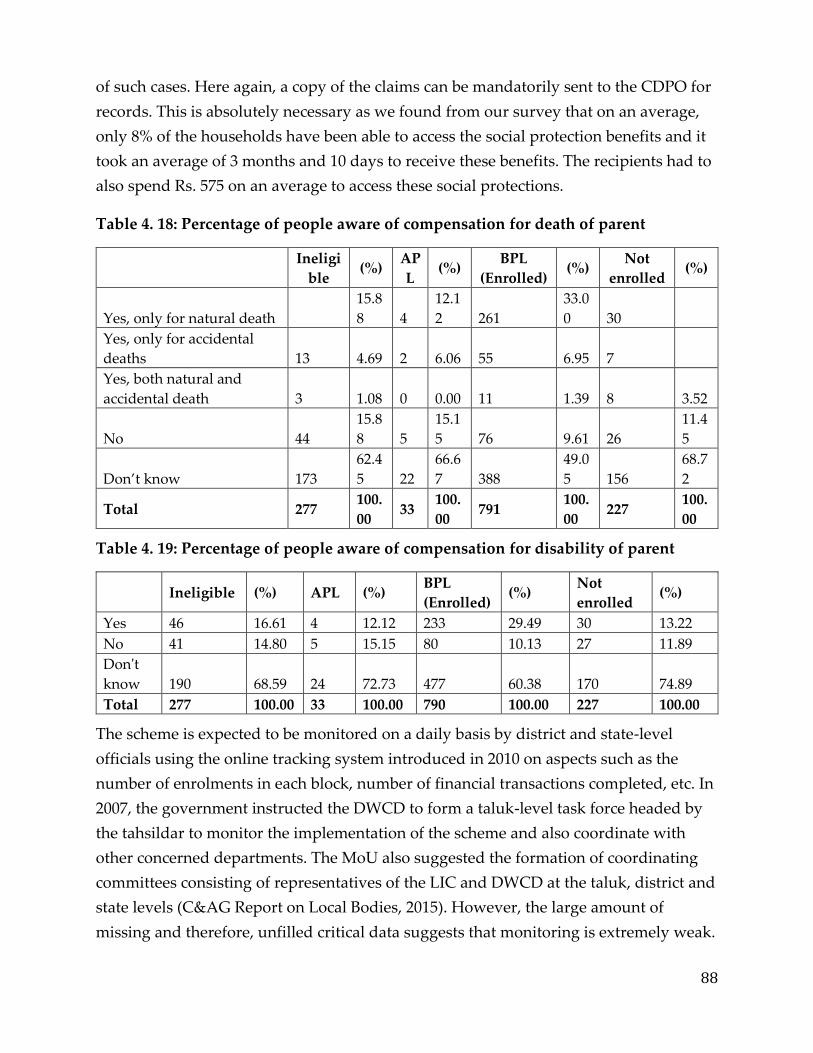
88
of such cases. Here again, a copy of the claims can be mandatorily sent to the CDPO for
records. This is absolutely necessary as we found from our survey that on an average,
only 8% of the households have been able to access the social protection benefits and it
took an average of 3 months and 10 days to receive these benefits. The recipients had to
also spend Rs. 575 on an average to access these social protections.
Table 4. 18: Percentage of people aware of compensation for death of parent
Ineligi
ble (%)
AP
L (%)
BPL
(Enrolled) (%)
Not
enrolled (%)
Yes, only for natural death 44
15.8
8 4
12.1
2 261
33.0
0 30 13.22
Yes, only for accidental
deaths 13 4.69 2 6.06 55 6.95 7 3.08
Yes, both natural and
accidental death 3 1.08 0 0.00 11 1.39 8 3.52
No 44
15.8
8 5
15.1
5 76 9.61 26
11.4
5
Don’t know 173
62.4
5 22
66.6
7 388
49.0
5 156
68.7
2
Total 277 100.
00 33
100.
00 791
100.
00 227
100.
00
Table 4. 19: Percentage of people aware of compensation for disability of parent
Ineligible (%) APL (%) BPL
(Enrolled) (%)
Not
enrolled (%)
Yes 46 16.61 4 12.12 233 29.49 30 13.22
No 41 14.80 5 15.15 80 10.13 27 11.89
Don't
know 190 68.59 24 72.73 477 60.38 170 74.89
Total 277 100.00 33 100.00 790 100.00 227 100.00
The scheme is expected to be monitored on a daily basis by district and state-level
officials using the online tracking system introduced in 2010 on aspects such as the
number of enrolments in each block, number of financial transactions completed, etc. In
2007, the government instructed the DWCD to form a taluk-level task force headed by
the tahsildar to monitor the implementation of the scheme and also coordinate with
other concerned departments. The MoU also suggested the formation of coordinating
committees consisting of representatives of the LIC and DWCD at the taluk, district and
state levels (C&AG Report on Local Bodies, 2015). However, the large amount of
missing and therefore, unfilled critical data suggests that monitoring is extremely weak.
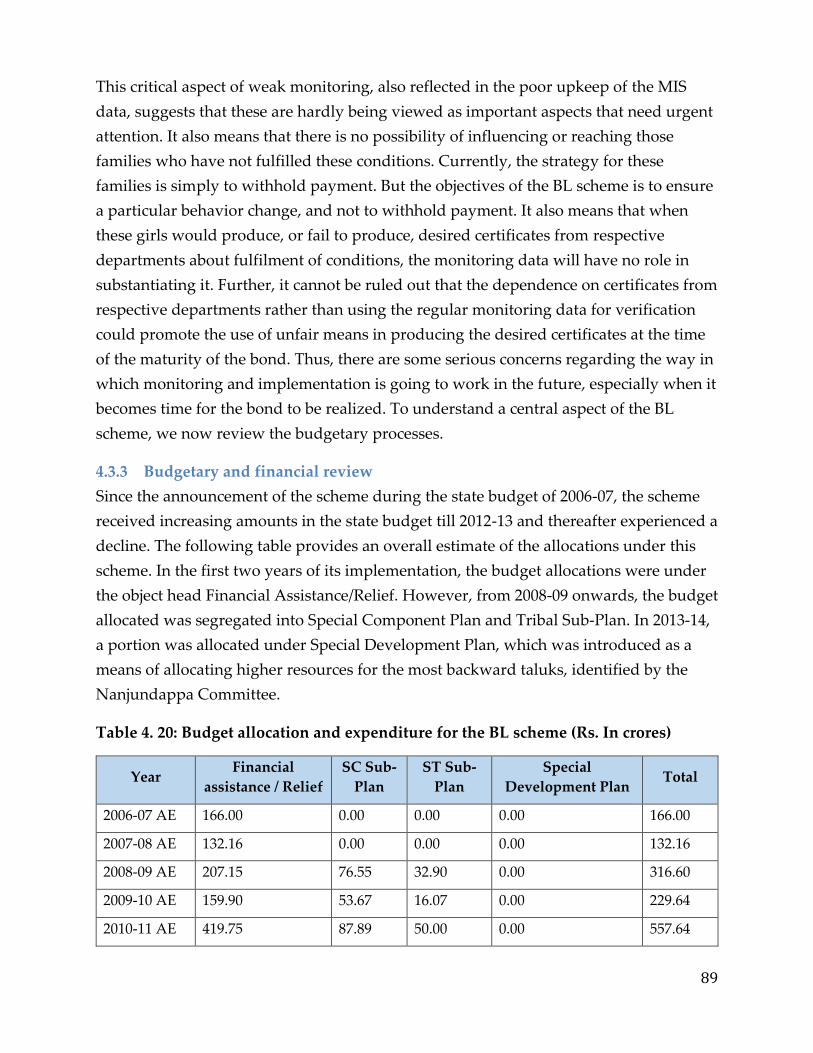
89
This critical aspect of weak monitoring, also reflected in the poor upkeep of the MIS
data, suggests that these are hardly being viewed as important aspects that need urgent
attention. It also means that there is no possibility of influencing or reaching those
families who have not fulfilled these conditions. Currently, the strategy for these
families is simply to withhold payment. But the objectives of the BL scheme is to ensure
a particular behavior change, and not to withhold payment. It also means that when
these girls would produce, or fail to produce, desired certificates from respective
departments about fulfilment of conditions, the monitoring data will have no role in
substantiating it. Further, it cannot be ruled out that the dependence on certificates from
respective departments rather than using the regular monitoring data for verification
could promote the use of unfair means in producing the desired certificates at the time
of the maturity of the bond. Thus, there are some serious concerns regarding the way in
which monitoring and implementation is going to work in the future, especially when it
becomes time for the bond to be realized. To understand a central aspect of the BL
scheme, we now review the budgetary processes.
4.3.3 Budgetary and financial review
Since the announcement of the scheme during the state budget of 2006-07, the scheme
received increasing amounts in the state budget till 2012-13 and thereafter experienced a
decline. The following table provides an overall estimate of the allocations under this
scheme. In the first two years of its implementation, the budget allocations were under
the object head Financial Assistance/Relief. However, from 2008-09 onwards, the budget
allocated was segregated into Special Component Plan and Tribal Sub-Plan. In 2013-14,
a portion was allocated under Special Development Plan, which was introduced as a
means of allocating higher resources for the most backward taluks, identified by the
Nanjundappa Committee.
Table 4. 20: Budget allocation and expenditure for the BL scheme (Rs. In crores)
Year Financial
assistance / Relief
SC Sub-
Plan
ST Sub-
Plan
Special
Development Plan Total
2006-07 AE 166.00 0.00 0.00 0.00 166.00
2007-08 AE 132.16 0.00 0.00 0.00 132.16
2008-09 AE 207.15 76.55 32.90 0.00 316.60
2009-10 AE 159.90 53.67 16.07 0.00 229.64
2010-11 AE 419.75 87.89 50.00 0.00 557.64

90
Year Financial
assistance / Relief
SC Sub-
Plan
ST Sub-
Plan
Special
Development Plan Total
2011-12 AE 318.92 132.37 34.80 0.00 486.09
2012-13 AE 640.23 83.95 31.21 0.00 755.39
2013-14 AE 181.61 115.19 44.78 30.00 371.58
2014-15 AE 251.87 62.85 25.14 0.00 339.87
2015-16 RE 344.06 83.06 46.23 0.00 473.35
2016-17 BE 242.27 59.08 32.31 0.00 333.66
Total 3,063.92 754.61 313.45 30.00 4,161.98
Source: Calculated using GoK budget documents for the period 2006-2017; AE: Actual
expenditure; RE: Revised expenditure estimates; BE: Budgeted expenditure
Table 4. 21: Expenditure on BL Scheme as a percentage of total DWCD budget (Rs. in
crores)
Year BL scheme budget DWCD Budget % of DWCD Budget
2006-07 AE 166.00 624.87 27
2007-08 AE 132.16 742.86 18
2008-09 AE 316.60 988.78 32
2009-10 AE 229.64 1349.03 17
2010-11 AE 557.64 1742.88 32
2011-12 AE 486.09 1958.56 25
2012-13 AE 755.39 2461.33 31
2013-14 AE 371.58 2347.23 16
2014-15 AE 339.87 2722.88 12
2015-16 RE 473.35 3297.35 14
2016-17 BE 333.66 3383.20 10
Source: Calculated using GoK Budget documents for the period 2006-2017; AE: Actual
expenditure; RE: Revised expenditure estimates; BE: Budgeted expenditure
This scheme is one of the most important implementation programmes of DWCD, GoK,
along with the ICDS. The expenditure on the scheme, as a percentage of the total
DWCD budget has been fluctuating between 26.57 per cent in 2006-07 and 30.69 per
cent in 2012-13. After 2012-13, the share of expenditure on this scheme has been almost
halved to around 12-15 per cent. From the previous table, we can see the details of these
these fluctuations, which could also be a result of reduced enrolment over the last three
to four years.
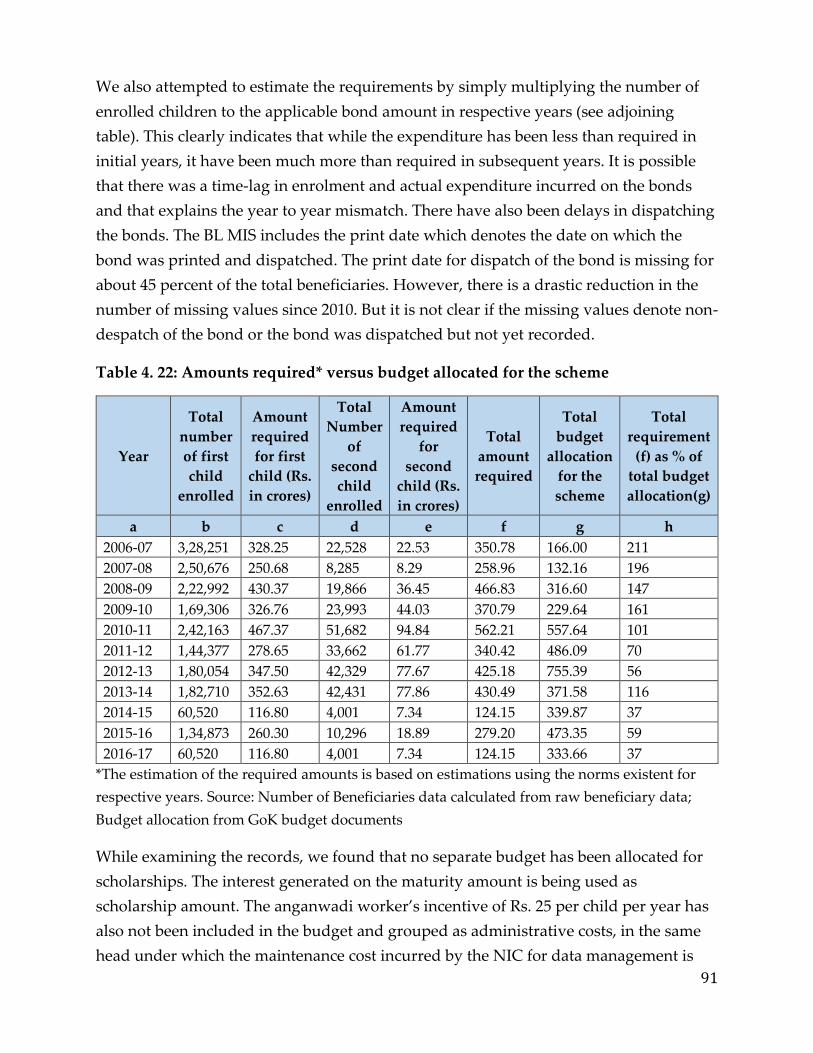
91
We also attempted to estimate the requirements by simply multiplying the number of
enrolled children to the applicable bond amount in respective years (see adjoining
table). This clearly indicates that while the expenditure has been less than required in
initial years, it have been much more than required in subsequent years. It is possible
that there was a time-lag in enrolment and actual expenditure incurred on the bonds
and that explains the year to year mismatch. There have also been delays in dispatching
the bonds. The BL MIS includes the print date which denotes the date on which the
bond was printed and dispatched. The print date for dispatch of the bond is missing for
about 45 percent of the total beneficiaries. However, there is a drastic reduction in the
number of missing values since 2010. But it is not clear if the missing values denote non-
despatch of the bond or the bond was dispatched but not yet recorded.
Table 4. 22: Amounts required* versus budget allocated for the scheme
Year
Total
number
of first
child
enrolled
Amount
required
for first
child (Rs.
in crores)
Total
Number
of
second
child
enrolled
Amount
required
for
second
child (Rs.
in crores)
Total
amount
required
Total
budget
allocation
for the
scheme
Total
requirement
(f) as % of
total budget
allocation(g)
a b c d e f g h
2006-07 3,28,251 328.25 22,528 22.53 350.78 166.00 211
2007-08 2,50,676 250.68 8,285 8.29 258.96 132.16 196
2008-09 2,22,992 430.37 19,866 36.45 466.83 316.60 147
2009-10 1,69,306 326.76 23,993 44.03 370.79 229.64 161
2010-11 2,42,163 467.37 51,682 94.84 562.21 557.64 101
2011-12 1,44,377 278.65 33,662 61.77 340.42 486.09 70
2012-13 1,80,054 347.50 42,329 77.67 425.18 755.39 56
2013-14 1,82,710 352.63 42,431 77.86 430.49 371.58 116
2014-15 60,520 116.80 4,001 7.34 124.15 339.87 37
2015-16 1,34,873 260.30 10,296 18.89 279.20 473.35 59
2016-17 60,520 116.80 4,001 7.34 124.15 333.66 37
*The estimation of the required amounts is based on estimations using the norms existent for
respective years. Source: Number of Beneficiaries data calculated from raw beneficiary data;
Budget allocation from GoK budget documents
While examining the records, we found that no separate budget has been allocated for
scholarships. The interest generated on the maturity amount is being used as
scholarship amount. The anganwadi worker’s incentive of Rs. 25 per child per year has
also not been included in the budget and grouped as administrative costs, in the same
head under which the maintenance cost incurred by the NIC for data management is

92
allocated. There is hardly any allocation for mobilisation and monitoring except for the
MIS building and maintenance.
Primarily because social protection aspects of the scheme does not seem to have been
utilised, we also looked at the expenditure related to the insurance provided. As has
already been discussed, the aspect of health insurance was given during the period of
2006-2008, and will be given to all those enrolled within this time period, until they
complete 18 years of age.14 In this case, the verification is done by the doctor at the
hospital where the beneficiary is who issues a receipt for the expenses. A total of Rs.
25,000 per annum was allocated for each beneficiary. The health insurance has been
discontinued since 2008 and the insurance claims is now directly credited to the
beneficiary's account by the LIC after the verification process is completed. It does not
go through the DWCD. As per data provided by the LIC and shared by the DWCD, a
total of 196 claims were settled amounting to Rs. 26.33 lakhs by the LIC during 2006-07
to 2007-08 (Annex 1). Though this data is dated 2016, it does not report any claim after
2007-08; it is not clear if those girls enrolled during this period are still entitled or not.
All beneficiaries are also entitled to life insurance for either of their parents. This
insurance covers death due to natural as well as accidental causes. It also covers
physical disability (partial and complete) due to accidents. The following table gives the
details of the amounts disbursed with respect to insurance. This data is not available
within the state budget documents as this component is included within the scheme
bond issued by the LIC. Hence, for every beneficiary, death of either or both parents is
covered within the scheme bond itself and hence separate allocation of budget is not
necessary by the DWCD.
The C&AG2014 report also pointed out that a number of issues also led to the denial of
scheme benefits to those enrolled. Non-nomination of the second parent for insurance
coverage led to denial of insurance and scholarship benefits on the death of one of the
parents. A number of accidental death claims were settled as natural deaths due to lack
14Source: Interview with Assistant Director, DWCD dated July 31, 2017

93
of documents. This is problematic as the amount of insurance coverage was lower for
natural deaths. On account of the death of the beneficiary, LIC refunds the deposit
amount to the government. However, there were delays in submission of information
and requisite documents (i.e. LIC certificate and death certificate) by the CDPOs
(C&AG, 2014).
Table 4. 23: Details of insurance claims under the BL scheme (2006-07-2013-14)*
Year Number of claims Total amount disbursed (Rs lakhs)
2006-07 3,708 159.575
2007-08 3,635 1617.775
2008-09 2,912 1084.915
2009-10 1,761 552.6
2010-11 1,177 367.50
2011-12 544 170.85
2012-13 350 106.80
2013-14 95 29.40
Total 14,182 4,089.42
*The distribution across different kinds of claims is not available
Source: LIC, data shared by the DWCD, March 2017 (Detailed data in Annex 1)
This scheme was announced during the state budget of 2006-07 with an initial allocation
of Rs. 234 crores. A trust was created for the purpose of this scheme initially and in July
2007, the LIC was appointed as the fund manager for the scheme. LIC was expected to
provide long-term investment for the budget allocated for this scheme, leading to
interest accrual based on rates announced by LIC (CAG, 2014). Based on a detailed
audit conducted by the C&AG of India in 2014 (C&AG, 2014), a number of issues
related to the financial management of the schemes were brought to light. CAG audits
found that despite the appointment of LIC as the fund manager in 2007, the trust was
not dissolved till 2012, leading to losses in interest. They also found that the database
maintained did not capture the complete financial status of the scheme. Delays in
release of funds to the LIC were also observed which led to short realisation of maturity
value and rejection of insurance claims relating to parental deaths. This also defeated
the purpose of providing social security net to the beneficiaries in cases of parental
death. Errors of miscalculation of interest were also indicated in the C&AG report.
Inclusion of additional benefits, such as scholarships under the Shiksha Sahayog Yojana
on completion of secondary and senior secondary classes led to an inflated maturity

94
value, as noted in the audit. It was also found that there were differences in the
maturity value in LIC certificates as the government had deposited Rs.850 less than the
stipulated amount. In conclusion, our examination of the records has led to some
concerns relating to the financial management of the scheme. These concerns do have to
be addressed before the first bond payments become due, as it should not lead to
rightful beneficiaries being inconvenienced or denied their due.
When we reviewed all of the information related to enrolment, conditionalities, as well
as the implementation of the scheme, we came up with several recommendations for
the re-design of the scheme that can help the BL scheme achieve its objective. The next
chapter presents these various options.

95
Chapter 5: Redesigning BL: Options and Alternatives
We are presenting three models to choose from with arguments for and against. Within
the models, there are a few options. Our primary objective in creating these options is to
provide the Government of Karnataka various scenarios so as to use it for a considered
decision after weighing all the pros and cons of the models.
One of the primary guiding principles for re-designing these options was that there is
considerable emphasis on the empowerment or empowerment plus cash transfer model
where cash is one of the instruments. This is based on the premise that most sustained
change in girls and women’s positioning comes from change in social and gender
relations, and therefore, empowerment-based strategies enabled changes both faster
and sustainable. Cash is also an important instrument in situations where both the
presence of cash is scarce and control over cash is unequal. With these in view, the three
models, in summary are:
Table 5. 1: Three models of BL re-design
Model 1 Model 2 Model 3
This model (empowerment +
cash) suggests rebranding BL
and has two major
components:
(i) Introduction of women’s
and girls’ empowerment
programme in a major way
(using Mahila Samkahya and
mentorship models)
(ii) Reformed BL scheme in
terms of coverage or
eligibility, conditionalities
and processes
(iii) Use of bond/insurance as
a tool continues
This model argues for
doing away with cash
and focus on:
(i) Empowerment
(ii) Strengthening of
public services
(education, training,
etc.)
(iii) Use of bursaries
for need-based support
This model (cash plus
empowerment) argues for
removal of bond as an
instrument, and has two
main components:
(i) Direct transfer of cash
linked to progress in
secondary or higher
education
(ii) Staggered payment
(direct transfer) of the final
amount
(iii) Empowerment based
strategies in schools

96
5.1 MODEL 1: Empowerment Strategies + BL Redesign
This model is the same in terms of using insurance as an instrument for cash pay-out
through the use of bonds that where the money grows and also covers the risk of
parental death and accidents. In this case, we are suggesting process reforms and
changes in the eligibility as well as conditionalities, apart from bringing in the
component of empowerment in a big way. We first discuss the suggestions made for
the BL reform followed by a discussion on empowerment strategies.
5.1.1 Change in the coverage/eligibility: Universalization of scheme
5.1.1.1 Option 1 – All girls within the household (from only BPL households)
The first redesign suggestion focuses on making the scheme available to all girls within
a household. Currently, the scheme is limited to only two girl children within a family.
The suggestion is based on the following rationales:
a. The most ethical rationale for this redesign suggestion is that no girl child should be
discriminated within a single household. This is irrespective of the number of girls
born to a couple.
b. It would reduce the cost of verification that the girl child is indeed either first or
second born.
One question that we faced in the field was if this would incentivise couples to have
more and more children. Our analysis, illustrated in the earlier chapter suggests that
this is unlikely. Studies around fertility and birth rates across various countries in the
world point towards the fact that birth rate always reduces with time and never
increases, no matter the situation. The suggested option would definitely not run the
risk of affecting the birth rate within households in Karnataka adversely as the crude
birth rate has been reducing consistently year on year.
5.1.1.2 Option 2 – All girls within one household (from Antyodaya, APL and BPL
families)
(the argument for all girls within one household can be referred to from option 1)
Social welfare schemes in India are not privy to the issues of inclusion and exclusion
and the same holds true for the Bhagyalakshmi scheme in Karnataka as well. With this
context, one of the suggested redesign options at the enrolment stage is to universalize
the BL scheme to the entire female child population irrespective of their birth order or
the economic class they belong to. One of the suggestions that emerged from the field
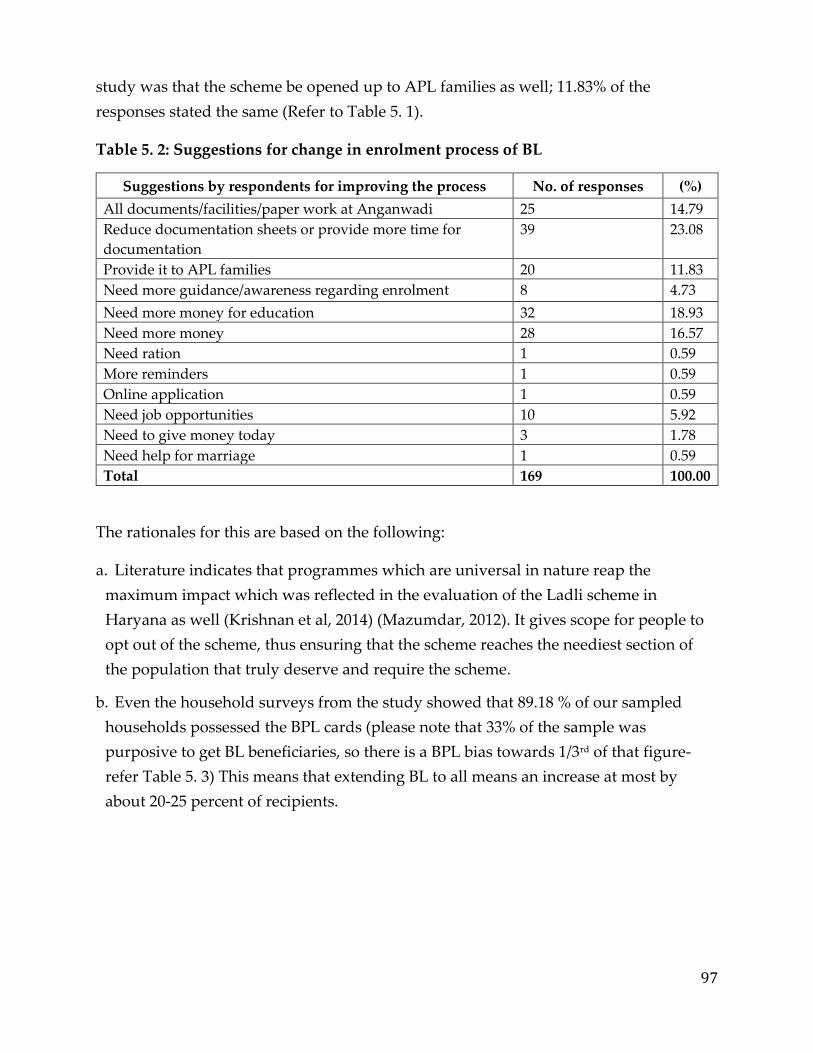
97
study was that the scheme be opened up to APL families as well; 11.83% of the
responses stated the same (Refer to Table 5. 1).
Table 5. 2: Suggestions for change in enrolment process of BL
Suggestions by respondents for improving the process No. of responses (%)
All documents/facilities/paper work at Anganwadi 25 14.79
Reduce documentation sheets or provide more time for
documentation
39 23.08
Provide it to APL families 20 11.83
Need more guidance/awareness regarding enrolment 8 4.73
Need more money for education 32 18.93
Need more money 28 16.57
Need ration 1 0.59
More reminders 1 0.59
Online application 1 0.59
Need job opportunities 10 5.92
Need to give money today 3 1.78
Need help for marriage 1 0.59
Total 169 100.00
The rationales for this are based on the following:
a. Literature indicates that programmes which are universal in nature reap the
maximum impact which was reflected in the evaluation of the Ladli scheme in
Haryana as well (Krishnan et al, 2014) (Mazumdar, 2012). It gives scope for people to
opt out of the scheme, thus ensuring that the scheme reaches the neediest section of
the population that truly deserve and require the scheme.
b. Even the household surveys from the study showed that 89.18 % of our sampled
households possessed the BPL cards (please note that 33% of the sample was
purposive to get BL beneficiaries, so there is a BPL bias towards 1/3rd of that figure-
refer Table 5. 3) This means that extending BL to all means an increase at most by
about 20-25 percent of recipients.
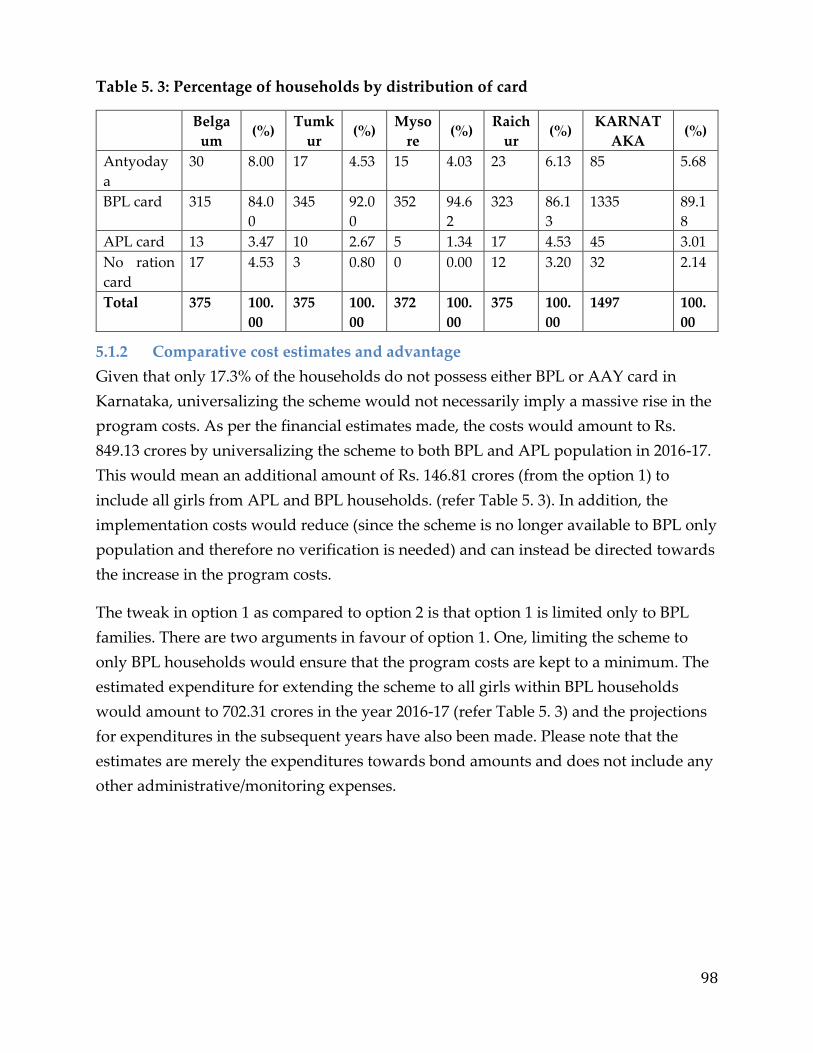
98
Table 5. 3: Percentage of households by distribution of card
Belga
um (%)
Tumk
ur (%)
Myso
re (%)
Raich
ur (%)
KARNAT
AKA (%)
Antyoday
a
30 8.00 17 4.53 15 4.03 23 6.13 85 5.68
BPL card 315 84.0
0
345 92.0
0
352 94.6
2
323 86.1
3
1335 89.1
8
APL card 13 3.47 10 2.67 5 1.34 17 4.53 45 3.01
No ration
card
17 4.53 3 0.80 0 0.00 12 3.20 32 2.14
Total 375 100.
00
375 100.
00
372 100.
00
375 100.
00
1497 100.
00
5.1.2 Comparative cost estimates and advantage
Given that only 17.3% of the households do not possess either BPL or AAY card in
Karnataka, universalizing the scheme would not necessarily imply a massive rise in the
program costs. As per the financial estimates made, the costs would amount to Rs.
849.13 crores by universalizing the scheme to both BPL and APL population in 2016-17.
This would mean an additional amount of Rs. 146.81 crores (from the option 1) to
include all girls from APL and BPL households. (refer Table 5. 3). In addition, the
implementation costs would reduce (since the scheme is no longer available to BPL only
population and therefore no verification is needed) and can instead be directed towards
the increase in the program costs.
The tweak in option 1 as compared to option 2 is that option 1 is limited only to BPL
families. There are two arguments in favour of option 1. One, limiting the scheme to
only BPL households would ensure that the program costs are kept to a minimum. The
estimated expenditure for extending the scheme to all girls within BPL households
would amount to 702.31 crores in the year 2016-17 (refer Table 5. 3) and the projections
for expenditures in the subsequent years have also been made. Please note that the
estimates are merely the expenditures towards bond amounts and does not include any
other administrative/monitoring expenses.

99
Table 5. 4: Expenditure on all girls for BL scheme (in crores)
Year Est Exp on BL
Enrolment
BL
Allocation
BPL AAY APL BPL+AA
Y
Total
2016-17 249.16 338.79 642.96 59.35 146.814 702.31 849.13
2017-18 221.53 321.28 614.13 56.69 140.2306 670.82 811.05
2018-19 196.97 309.43 586.59 54.15 133.9423 640.74 774.68
2019-20 175.14
560.28 51.72 127.9361 612.01 739.94
2020-21 155.72 535.16 49.40 122.1992 584.56 706.76
Calculation: The above Table displays the estimated expenditure on BL girls for the period
2016-17 to 2019-20 using the actual estimates of various ration card holders in the state. Since
82.71% of households have BPL + AAY ration card holders and using this assumption for the
proportion of BL BPL + AAY girls, the budget would amount to 702.31 crores (BPL + AAY
Expenditure). This expense is merely on bond amount.
One should also note that it has been assumed that all the girls within BPL households
enrol into the scheme unlike the current budget estimates where not all eligible girls
may have been enrolled. Hence, the projected figures for option 1 may be overestimated
when compared to the current budget figures of WCD.
One major argument in favour of option 1 is that even if the perception towards the girl
child does not vary much with the economic condition of the household; a conditional
CASH transfer is not the best instrument to incite a behavioural change. Since these are
non-poor families, cash as an instrument may not be an effective public policy and
expenditure instrument. Hence, one of the variants under this redesign option is to limit
the scheme to all girls within a BPL household.
5.1.3 Process simplification / reengineering
5.1.3.1 Enrolment Process
Our field-based research process clearly indicates that the current enrolment process is
both time-taking and cumbersome. There is indeed a case for making this process more
efficient and also more easily accessible. the administrative officials also emphasize on
the need for an enrolment process that could be less time-consuming and easier to
monitor and approve.
Given this background data, a redesign recommendation with respect to the enrolment
process is to piggy-back on the mandatory requirement of birth registration as laid
down by the state. As per the NFHS-4 Survey conducted in 2016, births of almost all
children (95%) under five years of age were registered with the civil authorities and
86.7% of female children in Karnataka possess a birth certificate. Considering that our
100
earlier recommendations of extending the benefits of Bhagyalakshmi scheme to all the
girls gets implemented, every girl child can be given a BL identity card with a unique
number attached to it along with her Birth Certificate by the Registrar of Births and
Deaths itself. Hence, there is no need for a separate process for enrolling into the
Bhagyalakshmi scheme. In the event that the scheme is limited to only BPL families, the
burden of documentation still remains low for the eligible applicant. Along with the
documents required for obtaining the Birth Certificate, the applicant only needs to
furnish the priority household ration card as an additional proof for enrolling into the
scheme. And the process of issuing s BL card and unique number attached to it can still
be followed. This will considerably reduce the burden on the applicant and avoid the
need to once again procure and submit all the documents for Bhagyalakshmi
enrolment, thus resulting in lower transactional costs.
In this simplified process, the main responsibility of the Anganwadi worker is only to
ensure that the simultaneous process for obtaining a birth certificate and enrolment into
BL scheme gets done before the child reaches the age of two. Any reduction of the
demand for her time has a direct impact on Anganwadi’s functioning (for instance,
more time for early childhood education) as most research studies point out to them
being majorly overloaded with responsibilities. This simplified process also
significantly would reduce the administrative efforts of both the supervisor (about 15-20
days per year) and the case worker (at least on an average 40 to 50 person-days a year).
This redesign suggestion does require that new coordination mechanisms are
developed between the DWCD and the office of Chief Registrar of Births and Deaths
within the state of Karnataka. Even if the new association between the two Departments
would demand concerted efforts, it would minimize the exclusion errors in the long run
and save time and efforts at various levels of the enrolment process. Since time has an
opportunity cost, especially in the context of programme delivery of ICDS and other
schemes such as Mathrupurna, any time saved on this is likely to have a better impact
on others.
5.1.3.2 Monitoring of Girls’ progress in the school
So far, the issue of verifying fulfilment of conditions such as completion of class 8th has
not arisen because the scheme started in 2006 and hence no girl would have turned 18
as yet. As mentioned above, the scholarships linked with class progression has been
subsequently discontinued in 2008, but the department is liable to continue with the
scholarships for those who enrolled in the first two years. Going by the feedback from

101
the field, updating the school records of the beneficiaries (post completion of
Anganwadi education) who are entitled to receive annual scholarships is extremely
challenging. This is especially in cases of migrant families. In this respect, the
administrative officials suggested that the DWCD can monitor till the girl child is
enrolled in the Anganwadi but the Education Department is in a better position to track
her academic progress, as soon as she begins schooling at the age of 6 years.
In this context, we are making two suggestions:
1. Integration of the BL unique number to the unique ID-based Child tracking. The
Government of Karnataka has initiated a unique ID based child tracking system
starting from primary to tertiary education and also employment. Given that the
state has been successfully managing many IT based governance interventions, it is
well-placed to integrate the BL ID to this to be able track the girl’s progression. It
can start at pre-school/Anganwadi itself and then can easily be tracked in later
years. This suggestion is based on the assumption that our suggestion of creating
this ID alongside birth registration is accepted.
2. Integration of BL records in UDISE. UDISE allows creation of state specific codes
and it would make sense to report on admissions and progression of BL girls
separately if the scheme continues to be meant only for BPL. If the scheme becomes
universal, this becomes redundant.
We argue that tracking girls’ progress is crucial even in the absence of scholarships
linked with their progress from one class to another, as one of the objectives of the
scheme is to enable their schooling participation. Since we are also suggesting to
include empowerment based strategies as a foreground to this scheme, tracking will
help in examining the links between community/women/girls empowerment strategies
and their schooling participation. Also, at the end of the cycle, when the girl would turn
18, it would be easy to verify the education related conditionality before disbursing the
amounts.
5.1.3.3 Distribution of Bonds, claims, delays and the lines of accountability
A number of issues related to the distribution of receipt of bonds, information
pertaining to accident claims surfaced during our research. These exists a demand for
urgent attention to improve the efficiency and also having a clear line of accountability.
A simpler process to pay out the insurance claim amount to the legal guardian of the
girl child in the event of the death of both parents needs to be explored.
102
5.1.4 Change in conditionality pertaining to education
5.1.4.1 Option 1 – Completion of education till class 8 (presently existing)
This option hints that there should be no change in the redesign with respect to the
conditionality of education. This is because of two main reasons. First and foremost,
initial consultations with WCD officials and data from FGDs with out-of-school girls in
two south Karnataka districts revealed that financial constraints at home are not the
main reason for girls to drop out of primary education. As mentioned in the earlier
chapter, it was found that various issues such as lack of safe transport (which is also
affordable) to schools, menstruation related beliefs, fear of girls ‘falling in love’,
pressure of care work at home, pressure of working for some extra income, lack of
proper roads to schools, degrading quality of teachers, etc. acted as huge obstacles on
the pathway to pursuing secondary and higher education by girls. With issues of
mobility, access, control and safety acting as major constraints, it is least likely that a
higher cash amount would incentivise them to complete education of further classes.
Hence, efforts need to be directed towards strengthening supply side and implementing
empowerment strategies instead of attempting to drive demand that may not drive
behaviourial change. The argument is that no amount of money would push the girls
towards secondary education because the problem does not lie within the economic
capacity of the households but somewhere else.
Secondly, there is a general ethical argument that girls who are unable to pursue higher
education should not be disadvantaged with a lower maturity amount for non-
completion of higher education. On the contrary, such girls are gravely in need of
money for reasons not directly linked to education but other cases such as care work
and lack of income within households. CCTs are not the right framework to alleviate
these other issues but the least possible solution is to keep the conditionality at the
lowest possible level that is achievable and hence, the maturity amount acts as a strong
scaffolding against adversaries as mentioned above.
5.1.4.2 Option 2 – Completion of education till class 10
According to the current scheme, the girl child is entitled to receive the final maturity
amount at the age of 18 if she has at least completed class 8, is not a child labourer and
remains unmarried. The redesign of the scheme strongly professes a strong focus on the
education of girl children and hence would keep the clauses of child marriage and child
labour untouched. This is also because there is a strong assumption derived from
literature that with promotion of higher education, the age of child marriage and child

103
labour would also automatically be delayed. With regards to the completion of
education, the redesign suggests that the girl child be given the maturity amount at 18 if
and only if the girl child has at least completed class 10. Secondary sources also show
that most of the CCTs introduced in India have conditionalities of completion of higher
education and not just completion of primary education (Sekher, 2010). Schemes such as
Ladli Lakshmi scheme in Madhya Pradesh, Ladli scheme in Haryana, Balika Samridhi
Yojana and Ladli scheme in Delhi have the conditionality of passing at least class 10th
for receiving the final maturity amount. Schemes such as the Girl Child Protection
Scheme in Andhra Pradesh have moved one step ahead and mandated passing of class
12 as a conditionality to receive the final maturity amount. Given that most CCTs in the
states of India are already moving towards goals of higher education for girls, this
redesign suggestion states that Karnataka also raises the limit for the completion of
education for its girl children.
It has also been found from the survey study that a very small proportion of our
respondents have gone on to complete upper primary (13.62%) and secondary
education (11.45%) (refer table 4.2). Hence there is an urgent need to create a structure
where girls and their respective households are incentivised to go for post-primary
education. FGDs with adolescent girls also indicate instances of dropping out of school
before secondary education. Further deep-diving into the reasons for the same, as
discussed earlier in the context of option 1, revealed that most girls drop out of school at
the primary level because of issues of safety, mobility, accessibility, household level
restrictions imposed by the family and social barriers of class, caste and religion. Hence,
the next two redesign suggestions aim at working around these other challenges in
order to achieve the stated goals of the scheme.
Given that there is already an increased focus on education with the progress made
towards universalisation of secondary education (class 9 to 12) and increase in the
number of secondary schools, there are fewer impediments towards the achievement of
this goal for the girl children. The CABE Committee on Right to Education for extension
till Secondary is working on extending RTE to all children under 18 years of age and
universalization of secondary education has been mentioned in the 12th FYP as well.
Hence, addition of this clause in the scheme will push the girls to secondary education
and incentivise them to complete higher secondary thus contributing to universalisation
of Secondary Education. Further, secondary data shows that the gross enrolment ratio
(GER) and Net Enrolment Ration (NER) for boys and girls has improved for the period
between 2012-13 and 2015-16 for secondary and higher secondary education (refer table
104
3.7). There has also been an improved transition rate from secondary to higher
secondary education overall (25.09 in 2013-14 to 52.01 in 2015-16) (refer to Table 3.6).
Even though in terms of the availability, the total number of schools for secondary
education and number of girls’ hostels have increased for the period between 2013-14
and 2015-16 (refer table 3.4 & 3.5); there should be a stronger emphasis on increasing the
number of government secondary schools proportionally to the enrolment rates. Hence,
as the desire for higher education increases, the State must also create an efficient
system for making the means of public higher education available and affordable to all.
5.1.5 Integration/linking of other education related schemes into BL
The redesign for BL under Model 1 aims to provide better incentives and opportunities
through provision of secondary and higher education and empowerment strategies as
well as simplification of processes and universalization of the scheme. This becomes
especially important if the instrument of bond and insurance is to be retained, which
makes it difficult to introduce period releases and staggering of pay-outs. This redesign
suggestion aims to retain the focus on education for girls by proposing an integrated
and collaborative model where other schemes related to education be combined with
BL. These other schemes are not directly related to provision of education but augment
the access, affordability and quality of education through other means. The goal is to
prioritize the following schemes for BL girls (instead of the limiting it to the current
target group of beneficiaries in respective schemes) so as to make education available to
all girls universally.
5.1.6 Scholarships
As per the redesign suggestion, the existing scholarship schemes in Karnataka should
be extended to all the beneficiaries under the BL scheme. Since the conditional cash
transfer by itself would not help in incentivizing girls towards pursuing secondary or
higher education, it is expected that the scholarship schemes would provide additional
financial assistance for the same. Some of the FGDs with adolescent girls depicted that
economic burden due to transport and educational expenses were the reasons for their
dropouts. A few responses also hinted at the family environment of households such as
financial constraints, chronic unemployment, and alcohol addiction contributing for
low academic performance. Although it was clear that financial constraints are not a
major reason for adolescent girl drop-outs, scholarships have the ability to provide
some kind of assistance for combatting certain aspects of access and mobility. Hence the
redesign suggests that the following schemes could be expanded beyond their current
scope to be made available to the BL enrolees as well.

105
5.1.6.1 Vidyasiri scholarships For OBC students (pre-matric pre-scholarships)
This scholarship is given to OBC students studying in government/ government
recognised aided and unaided schools from Class 1 to Class 10 at different rates
annually as mentioned below. For a student to avail this scheme, he/she must have 75%
attendance or more in the previous class. Those students who have failed in the
previous class and those who are studying in government/government-run
hostels/housed schools, are not eligible for these scholarships.
Table 5. 5: Vidyasiri pre-matric scholarships
Class Boy / Girl Adhoc Grant Total
1 to 5 250 / - 500 / - 750 / -
6 to 8 400 / - 500 / - 900 / -
9 to 10 500 / - 500 / - 1000 / -
Source:
http://backwardclasses.kar.nic.in/BCWDEducational_Scholarships.aspx?Name=PreMetricScl
By extending this scheme to all BL girls, the proportion of population would extend
from about 60% of the population to 82.71% of the population (which is the number of
BPL+AAY card holders in Karnataka). Since the department is already spending 171
crores on the scheme for OBCs, it may mean an additional expenditure of 183 crores in
order to include all the BL girls as beneficiaries for this scheme (Refer to table 5. 6).
Table 5. 6: Expenditure of scholarship scheme for all girls in Karnataka
2016-17
Elementary
Class (1-8)
Secondary
Class (9-10)
Proportion of ST Enrolment to Total Enrolment 8 6.8
Proportion of SC Enrolment to Total Enrolment 19 18
Proportion of OBC Enrolment to Total Enrolment 59.2 60.3
Proportion of Muslim Enrolment to Total Enrolment 15.5 4
Total Enrolment in Elementary Classes 8363839 1800250
Total Number of ST Enrolment to Total Enrolment 669107.1 122417
Total Number of SC Enrolment to Total Enrolment 1589129 324045
Total Number of OBC Enrolment to Total Enrolment 4951393 1085551
Total Number of Muslim Enrolment to Total Enrolment 1296395 72010
Sex Ratio (973 girls per 1000 boys) 2509576 550203.2
Total OBC girls (Sex Ratio of 973 girls per 1000 boys) 2441817 535347.8
Estimated Expenditure on OBC girls 201.44 53.53
Total OBC BPL girls 2002290 438984.5
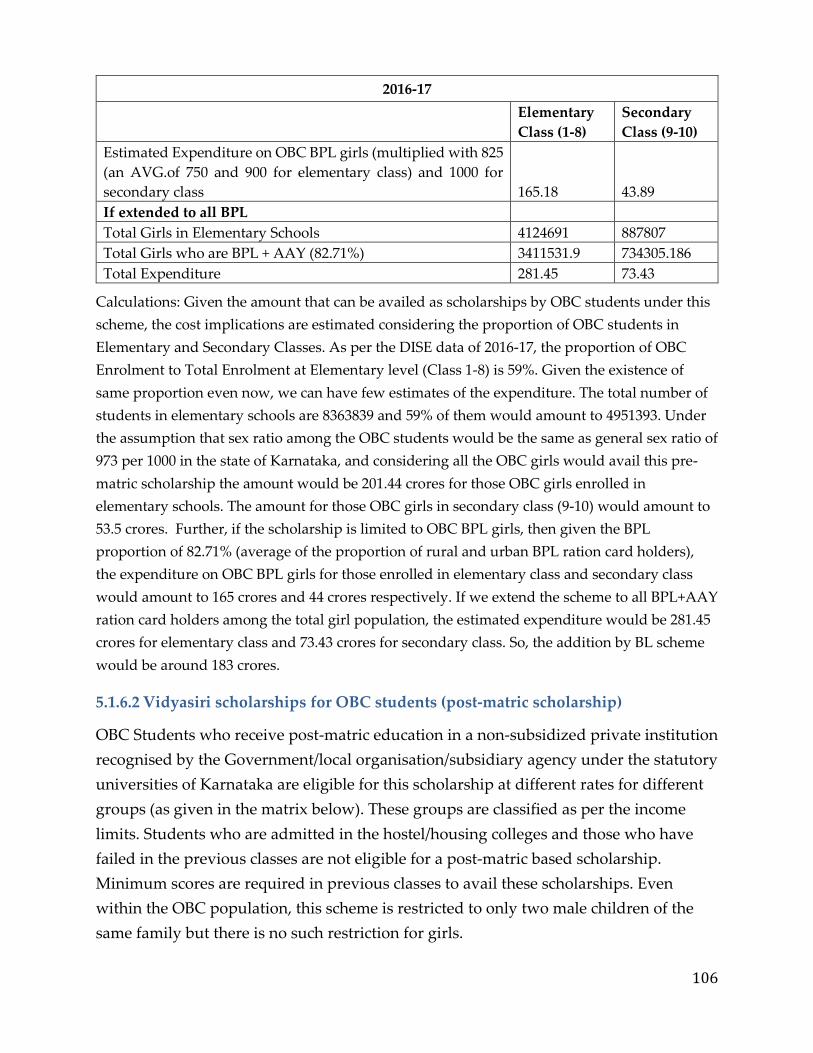
106
2016-17
Elementary
Class (1-8)
Secondary
Class (9-10)
Estimated Expenditure on OBC BPL girls (multiplied with 825
(an AVG.of 750 and 900 for elementary class) and 1000 for
secondary class 165.18 43.89
If extended to all BPL
Total Girls in Elementary Schools 4124691 887807
Total Girls who are BPL + AAY (82.71%) 3411531.9 734305.186
Total Expenditure 281.45 73.43
Calculations: Given the amount that can be availed as scholarships by OBC students under this
scheme, the cost implications are estimated considering the proportion of OBC students in
Elementary and Secondary Classes. As per the DISE data of 2016-17, the proportion of OBC
Enrolment to Total Enrolment at Elementary level (Class 1-8) is 59%. Given the existence of
same proportion even now, we can have few estimates of the expenditure. The total number of
students in elementary schools are 8363839 and 59% of them would amount to 4951393. Under
the assumption that sex ratio among the OBC students would be the same as general sex ratio of
973 per 1000 in the state of Karnataka, and considering all the OBC girls would avail this pre-
matric scholarship the amount would be 201.44 crores for those OBC girls enrolled in
elementary schools. The amount for those OBC girls in secondary class (9-10) would amount to
53.5 crores. Further, if the scholarship is limited to OBC BPL girls, then given the BPL
proportion of 82.71% (average of the proportion of rural and urban BPL ration card holders),
the expenditure on OBC BPL girls for those enrolled in elementary class and secondary class
would amount to 165 crores and 44 crores respectively. If we extend the scheme to all BPL+AAY
ration card holders among the total girl population, the estimated expenditure would be 281.45
crores for elementary class and 73.43 crores for secondary class. So, the addition by BL scheme
would be around 183 crores.
5.1.6.2 Vidyasiri scholarships for OBC students (post-matric scholarship)
OBC Students who receive post-matric education in a non-subsidized private institution
recognised by the Government/local organisation/subsidiary agency under the statutory
universities of Karnataka are eligible for this scholarship at different rates for different
groups (as given in the matrix below). These groups are classified as per the income
limits. Students who are admitted in the hostel/housing colleges and those who have
failed in the previous classes are not eligible for a post-matric based scholarship.
Minimum scores are required in previous classes to avail these scholarships. Even
within the OBC population, this scheme is restricted to only two male children of the
same family but there is no such restriction for girls.
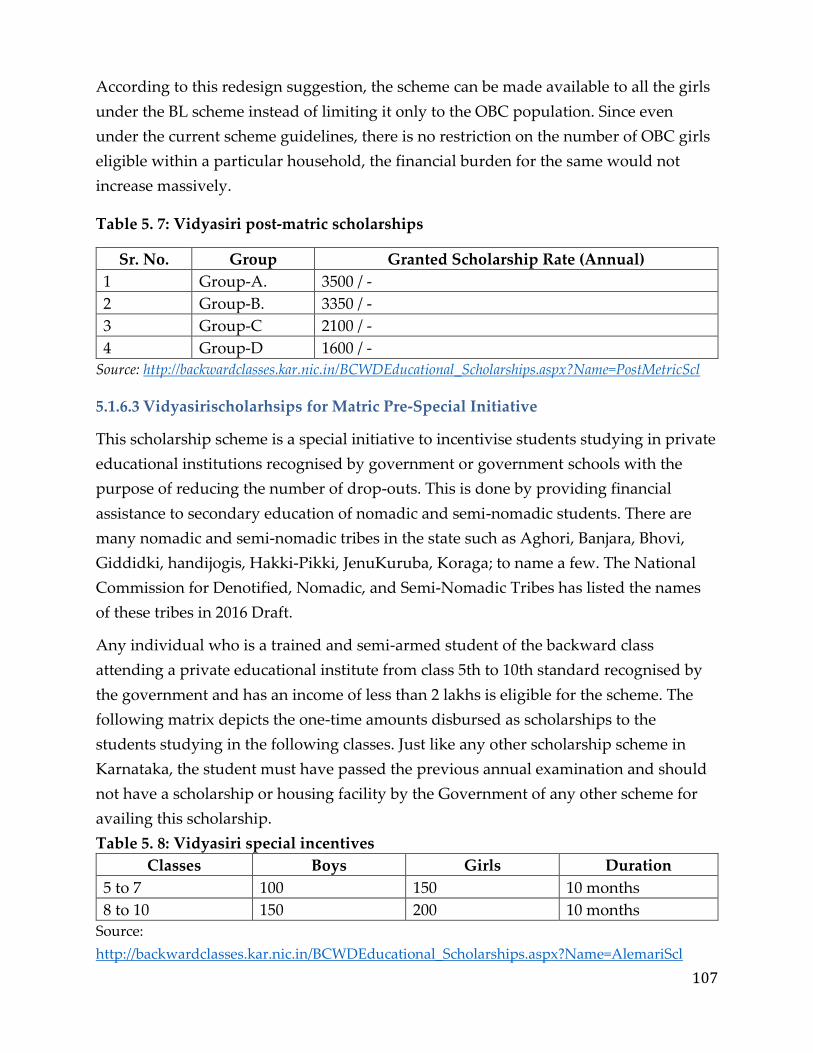
107
According to this redesign suggestion, the scheme can be made available to all the girls
under the BL scheme instead of limiting it only to the OBC population. Since even
under the current scheme guidelines, there is no restriction on the number of OBC girls
eligible within a particular household, the financial burden for the same would not
increase massively.
Table 5. 7: Vidyasiri post-matric scholarships
Sr. No. Group Granted Scholarship Rate (Annual)
1 Group-A. 3500 / -
2 Group-B. 3350 / -
3 Group-C 2100 / -
4 Group-D 1600 / -
Source: http://backwardclasses.kar.nic.in/BCWDEducational_Scholarships.aspx?Name=PostMetricScl
5.1.6.3 Vidyasirischolarhsips for Matric Pre-Special Initiative
This scholarship scheme is a special initiative to incentivise students studying in private
educational institutions recognised by government or government schools with the
purpose of reducing the number of drop-outs. This is done by providing financial
assistance to secondary education of nomadic and semi-nomadic students. There are
many nomadic and semi-nomadic tribes in the state such as Aghori, Banjara, Bhovi,
Giddidki, handijogis, Hakki-Pikki, JenuKuruba, Koraga; to name a few. The National
Commission for Denotified, Nomadic, and Semi-Nomadic Tribes has listed the names
of these tribes in 2016 Draft.
Any individual who is a trained and semi-armed student of the backward class
attending a private educational institute from class 5th to 10th standard recognised by
the government and has an income of less than 2 lakhs is eligible for the scheme. The
following matrix depicts the one-time amounts disbursed as scholarships to the
students studying in the following classes. Just like any other scholarship scheme in
Karnataka, the student must have passed the previous annual examination and should
not have a scholarship or housing facility by the Government of any other scheme for
availing this scholarship.
Table 5. 8: Vidyasiri special incentives
Classes Boys Girls Duration
5 to 7 100 150 10 months
8 to 10 150 200 10 months
Source:
http://backwardclasses.kar.nic.in/BCWDEducational_Scholarships.aspx?Name=AlemariScl
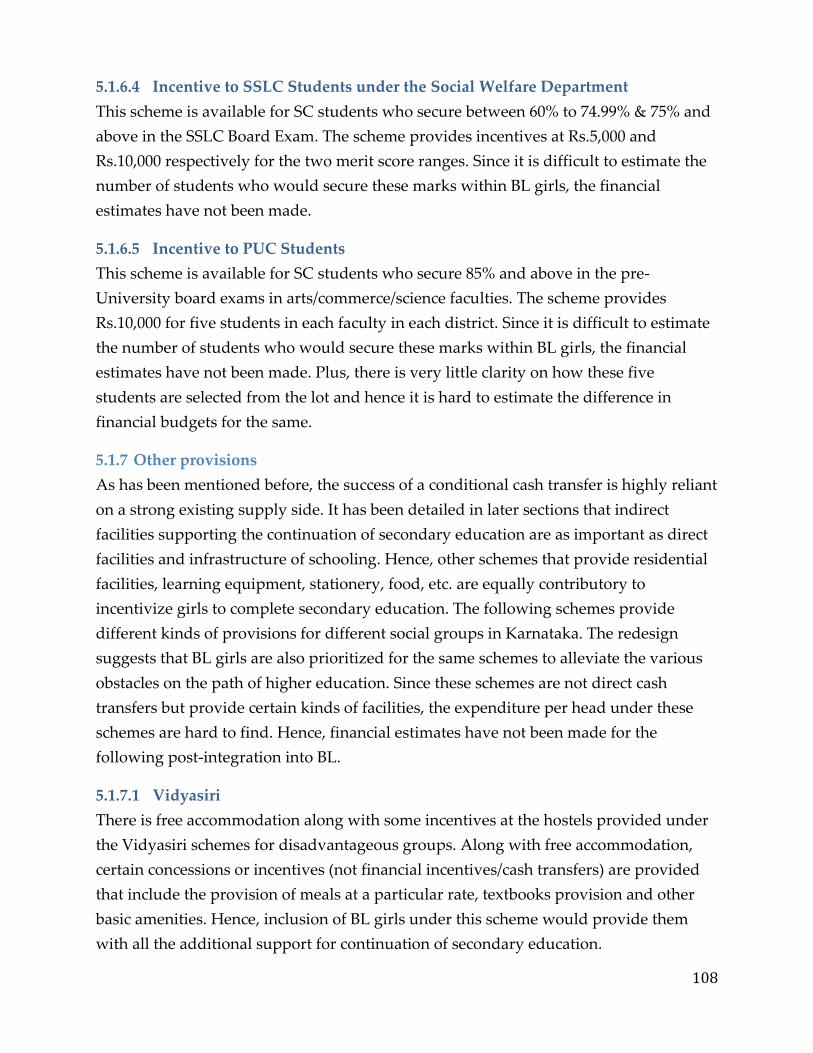
108
5.1.6.4 Incentive to SSLC Students under the Social Welfare Department
This scheme is available for SC students who secure between 60% to 74.99% & 75% and
above in the SSLC Board Exam. The scheme provides incentives at Rs.5,000 and
Rs.10,000 respectively for the two merit score ranges. Since it is difficult to estimate the
number of students who would secure these marks within BL girls, the financial
estimates have not been made.
5.1.6.5 Incentive to PUC Students
This scheme is available for SC students who secure 85% and above in the pre-
University board exams in arts/commerce/science faculties. The scheme provides
Rs.10,000 for five students in each faculty in each district. Since it is difficult to estimate
the number of students who would secure these marks within BL girls, the financial
estimates have not been made. Plus, there is very little clarity on how these five
students are selected from the lot and hence it is hard to estimate the difference in
financial budgets for the same.
5.1.7 Other provisions
As has been mentioned before, the success of a conditional cash transfer is highly reliant
on a strong existing supply side. It has been detailed in later sections that indirect
facilities supporting the continuation of secondary education are as important as direct
facilities and infrastructure of schooling. Hence, other schemes that provide residential
facilities, learning equipment, stationery, food, etc. are equally contributory to
incentivize girls to complete secondary education. The following schemes provide
different kinds of provisions for different social groups in Karnataka. The redesign
suggests that BL girls are also prioritized for the same schemes to alleviate the various
obstacles on the path of higher education. Since these schemes are not direct cash
transfers but provide certain kinds of facilities, the expenditure per head under these
schemes are hard to find. Hence, financial estimates have not been made for the
following post-integration into BL.
5.1.7.1 Vidyasiri
There is free accommodation along with some incentives at the hostels provided under
the Vidyasiri schemes for disadvantageous groups. Along with free accommodation,
certain concessions or incentives (not financial incentives/cash transfers) are provided
that include the provision of meals at a particular rate, textbooks provision and other
basic amenities. Hence, inclusion of BL girls under this scheme would provide them
with all the additional support for continuation of secondary education.
109
5.1.7.2 Residential Schools for SC students from Class I to V
Under this scheme, free education with boarding & lodging facilities will be provided to
SC students who are already admitted and studying in between classes 1 to 5.
Secondary data shows that 68 residential Schools are functioning in SC populated
localities.
5.1.7.3 Concessions for those SC students in Technical courses
Supporting equipment such as scientific calculators, mini drafter will be given to the
students at Rs.700 in the beginning of the course.
5.1.7.4 Pre-Matric Hostels
Rural SC students who are studying between classes 5 to 10 and who are residing more
than 7 kms. away from the schools are given admission in the hostel. The students are
provided free boarding and lodging, stationery, beddings, uniforms, soaps, hair oil etc.
5.1.7.5 Upgradation of Merit
To get admission in Technical & Medical Courses, SC students who are studying in IX
to XII Std. will be given coaching for CET @ Rs.15,000/- per annum per student
including food charges, pocket money, stationery, text books and honorarium to
Principals & Guest Lecturers.
5.1.7.6 Expansion of Public Secondary Schooling System through schools and
hostels
It is important to reiterate here that a number of these schemes pertain to supporting
students in private schools. While this may be helpful to some extent, one of the best
public policy investment option is to strengthen the public secondary schooling and
higher education systems. While the Government of Karnataka has waived tuition fees
for girls at all levels of education in public institutions, it is also important to widen
their spread and go there where private, profit-making institutions are not ready to
invest. Enhanced provisions for hostels where those are also used for mentoring and
empowerment-based interventions. Success of cash transfer programmes in pushing the
demand for girls’ education is often linked to the presence of functioning public
schooling systems. Presence of high-quality public institutions also acts as a natural
regulatory mechanism for private institutions. For instance, the presence of high quality
Jayadeva Heart Hospital in Bangalore has apparently helped in keeping a check on the
fees charged and the quality of service being provided for cardiac care in the city.
110
5.1.8 Empowerment strategies
5.1.8.1 Importance of changing social norms
Gender equality and empowerment of women and girls are one of the MDGs that are
highly valued in and of itself and not merely as a way of ensuring other socially
relevant development goals (Kabeer, 2005). Measures and policies taken to reduce
gender inequities and inequalities often take into consideration the barriers to education
of women, their workforce participation, their participation in public life, and their
expectations and experience of a violence-free life. In this context, it is important for any
policy that is targeting the girl child to engage critically with the processes that lead to
her participation in the empowerment process, instead of being a recipient of
development policies.
To ensure that the BL scheme can empower the girl child, the scheme has to engage
more centrally with narratives, the customs, the gendered roles, and the social norms
that bind young women and girls into submissive roles and responsibilities. For
example, any redressal of discriminatory social practices brings to fore some pertinent
questions: What do women and communities lose when they have to let go of
something they have lived with their whole lives? How do we dismantle social
practices that appear to be inimical to one’s identity and way of living? How do we
engage with young adolescent girls who do not just function from their gender identity,
but also from their caste and community identity? If the BL policy has to truly
influential, it has to incorporate within its framework engaging with these powerful
social narratives that prevent young women from being fully-functioning citizens.
In order to illustrate the different ways in which addressing social norms through an
empowerment approach is critical for the success of the BL scheme, we engage with
three inter-related concepts that we have observed in the literature as well as in the
field: education, care work, and safety. Through these examples, we will posit that with
existing resources, an added methodology that incorporates a systematic approach to
empowerment will truly ensure the empowerment of young girls.
5.1.8.1 Education
The social norms around education are changing – all of the community members feel
that girls should participate equally in the educational systems and in the job markets.
However, these attitudes come up against entrenched social norms that do not allow for
the girls to reap the broader and transformational experience of education, as has been
explained extensively in Chapter 4.
111
5.1.8.2 Care work
One of the key areas in which gendered inequalities all over the world is most
prominent is care work. Women and young girls bear the brunt of all care work
responsibilities in the household (Folbre, 2006), and the findings from our study is
consistent with this trend. The fact that this care work is not often considered part of
women’s and girl’s labour is also detrimental to our understanding of restrictions that
women and girls face with regards to education and livelihoods.
5.1.8.3 Safety
When we ask adolescent girls about gender equality, many of these girls report that
there is no significant difference between girls and the boys, and that their families treat
them equally. But on further examination or minimal probing, they hesitantly talk
about the ways in which their lives are different from that of boys.
In order to do tackle each of these concerns, the BL scheme must be able to provide
accompanying processes and tools so that young women are able to understand their
own experiences and to question the connection between dowry, violence, mobility,
care work, and education. This way, they are more likely to use their knowledge and
abilities to utilise the BL scheme more effectively towards their own empowerment.
5.1.9 Pathways to empowerment
Our understanding of the BL scheme makes it clear that the medium of cash transfer
alone will not provide any movement towards changing attitudes and behaviours that
influence girls’ education or son-preference. Without accompanying empowerment
processes, the potential transformative nature of providing financial resources to young
girls can be defeated due to the prevailing social norms, narratives and structures. The
policy implications for these trends are fairly simple: (1) there is a need to provide safe
spaces for young girls and women to come together and collective, (2) critical thinking
skills and discourses of empowerment have to be included as part of the policy drive,
and (3) engagement with families and communities have to be deeper in order to
engage with the social norms and narratives surrounding young girls.
One of the most feasible ways to do all of these is to use a methodology and programme
already in place within the WCD: Mahila Samakhya (MS). It has been established
through numerous studies (including our own {Jha et al, forthcoming}) that one of the
strengths of MS has been to provide tools of collectivisation, engage with critical
thinking, and providing pathways to action that young girls can utilise to transform
their own lives. The methodology employed, which includes training programmes,
112
field trips, knowledge sharing, and community meetings, have the potential of
providing young girls opportunities of articulating their life experiences as well as
pathways to ensure their aspirations are realised. This would also include parallel
strategies of renaming the scheme in a way that it is no longer perceived as a ‘cash
handout’ scheme but as an empowerment scheme with a financial assistance
component. Hence, the strategies would also imply that different communication
methodologies are utilized to target different stakeholders to not only create awareness
but also gain buy-in for community level empowerment of adolescent girls. There needs
to be a paradigm shift from a cash-based scheme to an empowerment-based scheme
that needs to be initiated by the Department and also by the representatives in the
community.
5.1.9.1 Collectivisation
One of the primary ways that the particular risks and barriers to gender inequality can
be addressed is to understand more closely and more deeply girls’ experiences and
their perspectives. Engaging with adolescent girls about their problems in a cohesive
manner is often the first step to mobilise them (Bruce, 2011). This way, we are able to
tap into their potential, their desires, their inclinations, the barriers they face, and the
coping strategies that they employ. The best way to do this is to start the slow process of
collectivisation that has been currently put in place by the kishori sanghas by MS.
Through the kishori sanghas, the girls are provided a safe space to talk about their own
lives and their experiences. These conversations followed by trainings on various
subjects enable them to view their own lives with perspective, and take collective action
when necessary (Agarwal, 2000). This aspect of collectivisation is necessary also to chart
their future, as they are able to build connections and networks that can provide them
social support through their adulthood. Since women and young girls tend to have
fewer access to knowledge networks, collectivisation helps them to build on the
cooperation of other women and create social capital (Agarwal, 2000). This, along with
the tools provided by MS, will enable them to create better futures for themselves.
5.1.9.2 Critical thinking
One of the primary tools that the kishori sanghas usually employ is the emphasis and
training in critical thinking. While there are many ways to provide critical thinking
skills, MS has traditionally used games, activities, and trainings to engage and de-bunk
notions of what is ‘natural’ and what is ‘social’. For example, it will provide space and
the tools to help girls understand and connect the specifics of gender socialisation to the
violence that they witness and experience. This way, they will be able to understand the
113
different ways in which they are systematically been confined and restricted even
within their family and start to push back or negotiate with their families. They will also
be able to call into question the threat of rape that works very well in socialising women
into accepting their own subjugation. The sentiment that “the decent girl is submissive”
(Bruce, 2011, p. 6) that has strongly emerged from our FGDs can also be dismantled.
Thus, through inclusion of critical thinking skills within the BL scheme, we will be able
to create a new generation of young girls and women who are not just provided the
financial resources to be independent, but are able to use this independence to chart
their own lives.
5.1.9.3 Challenging social norms
Another method that has worked very well for MS is the manner in which they are able
to mobilise communities. Central to their philosophy of social change is the framework
of engaging with the family and community constantly and repeatedly to provide
support mechanisms for women and girls. It is very clear that changing social norms
will not be possible without extensive community participation and mobilisation
(Bruce, 2011). This implies that the community does not just play lip-service to the
notions of gender equality, but participates more centrally in ensuring that the barriers
to equality are tackled. By building an eco-system that can support the girl child, it
makes it easier for the collectivised young children to challenge power relationships,
even if they are not always successful (Kabeer, 2005). This engagement can be
supported through street plays, through mass media announcements and a directed
focused communication strategy that emphasis the message of gender equality
throughout the state.
One of the more poignant stories to emerge from our fieldwork was when a girl
recounted how her father did not come to see her face when she was born. It was for the
very simple and altogether too common reason that she was a girl and her father
wanted a boy. We argue that using the existing methodologies and resources present
within the WCD, it is possible to create the space necessary for a deeper process of
empowerment that can challenge and change these deep structural barriers to gender
inequality and ensure that no more girls feel unwanted and unloved.
5.1.10 Rebranding BL
If one foregrounds empowerment, it is also important to rebrand and change the name
of the programme. Names such as Bhagyalakshmi and Dhanlakshmi or ApniBeti Apna
Dhan commodifies women. We would suggest one of the following to be adopted:

114
• Kanya Shakthi
• Kanya Siri
• Balika Nidhi
• Balika Siri
• Avala Siri (Avala means ‘for her’)
• Avala Nidhi
• AvalaHejjegagi (for her footsteps)
5.1.11 Parental death, accidental and disability benefits
Considering that bond as a tool cannot be implemented without insurance as an
instrument, the scheme would need to continue to give coverage for parental death,
accident or disability benefits. This acts as a security for the girls.
5.2 MODEL 2 – Empowerment Strategies only (Discontinue BL)
5.2.1. (In)efficacy of cash transfers
BL scheme was conceptualised as a conditional cash transfer that would incentivise
positive social changes specifically targeting certain aspects of gender equality. By
ensuring that cash transfer occurs only under certain conditions; the BL scheme tried to
engage with the phenomena of child or early marriage, child labour, and completion of
primary education, for girls. The scheme, as compared to other CCTs, attempts to
provide social assistance to families and communities while also promoting positive
social behaviour. Originating and popular in Latin America; the rationale of using CCT
is that it is part of a larger landscape of co-responsibility where the citizen, along with
the State, shares the duty of creating developmental outcomes for themselves and the
society at large.
One of the primary reasons for the success and the appeal of the CCTs is that they resist
the common pathways to corruption and provides the recipients the authority and
agency to use these resources independently. They are also seen as cost-effective, and
are able to provide greater monitoring and accountability systems. However, after
CCTs evolved to move into other contexts and countries, it became clear that CCTs do
not often adapt easily to all situations. For example, the timings of the release of the
transfer appear to matter, especially in the case of child education. The impact on poor
and vulnerable families also tends to be minimal when the transfer amount is too low.
A strong assumption of conditional cash transfers, in general, is that income is the major
constraint for households to access goods and services. Hence, CCTs help in increasing
115
the economic capacity of families and households and resultantly their purchasing
power to buy these goods and services. What the framework of CCTs also assumes is
that the economy has a fully functional and strong supply of goods and services and
that the cash transfer would help in pushing the demand for specific kinds of services,
which in turn, drive specific kinds of behaviourial and attitudinal changes. An example
of this is that when conditions are set to fulfil certain behavioural requirements such as
accessing health and educational facilities, a major precondition is that these services
are efficient, abundant and accessible in the country and that CCTs will only be
instrumental in generating demand and influencing consumption patterns (Schady,
2009; Son, 2008). But in low-resource environments which have inadequate social
infrastructure, increasing demand is highly counterproductive. For instance, if one of
the conditionalities requires the child to enrol in a school and that the transfer would
positively affect enrolment rates, there is a risk of increasing teacher-pupil ratios (since
the state is not equipped to supply more teachers) affecting learning levels (Arnold,
2011).
A common remedy that has been suggested is that a conditional cash transfer scheme in
its design must focus on increasing and strengthening the supply base while also
pushing the demand side. There are two ways to do this. One, the state makes parallel
investments in strengthening social infrastructure while also pushing for demand
through the means of cash handouts. The success of this strategy has been witnessed in
a few global examples of CCTs in Brazil and Mexico (Prabhu, 2009). For example, in the
case of the CCT scheme Bolsa Familia that was part of a larger programme known as
the Fome Zero, the scheme covered aspects of family agriculture, income-generation
and social organisation and was instrumental in reducing poverty and, economic as
well as social inequalities (Vyasulu, 2010). The other proposed strategy suggests to
create a strong supply and array of services first, and then give out cash transfers to
generate demand for the same.
However, even with the focus on providing these supply-side investments, CCTs have
not been useful in transforming qualitative measures of equality, justice, and well-
being. Learning outcomes and quality of education, for example, is also resistant to
these conditional incentives. Moreover, there have been documented evidence (Bastagli,
2011, Vyasulu, 2010) that there are often adverse effects to cash transfers including
disincentives for productive work, maintaining a low income to become eligible for
these schemes, and increased vulnerability of women and the elderly. Perhaps, the most
important trend that is being seen with respect to CCTs is that it does not appear to

116
incentivise empowering behaviour. When we examine the influence of CCTs on
gendered behaviour or any form of empowerment outcomes, we find that the available
evidence points to mixed results. In Latin America, it does lead to greater control over
resources, but it also gave rise to other gendered behaviour that are further entrenched
within patriarchal practices (Soares & Silva, 2010; Jha et al, forthcoming). Studies in
India indicates that cash transfers are ineffectual in influencing deep-rooted cultural
and social bias (Mazumdar, 2012). Other studies have indicated that while basic
indicators such as health or education might have improved, perceptions and behaviour
with regards to the girl child remained largely unchanged (Krishnan et al, 2014; Jha et
al, forthcoming).
5.2.2 Social norms and empowerment
The conclusions drawn from the literature also resonate with our own findings in the
field that appear to indicate that the BL scheme is unlikely to change the behaviour and
attitudes of the communities, families, and the girl themselves. To address deeply-
rooted and stable institutions of caste, gender, religion and class, which are reinforced
by traditional beliefs, norms and narratives, the process of change cannot be
incentivised or even rushed by a conditional cash transfer.
As illustrated earlier, the BL scheme was not seen in the field as an incentive for
challenging the social norms around education and marriage of young adolescents. In
almost all of the FGDS conducted, the primary use of the CCT was seen as primarily
mitigating wedding expenses. It was also found in the survey that about 40% of the
responses were planning to use the bond amount for wedding expenses. (refer table 4.1)
Although further education was mentioned in all of the FGDs as well as the survey, it
was always with the caveat of the girl’s interest in higher education. It is perhaps not
surprising to note that those who professed that further education was unnecessary for
girls were primarily male members of the family including the father, elder brother or
the grandfather. Although girls had ambitions and aspirations beyond their marriage, it
was made very clear that they had little decision-making powers or even negotiation
powers with respect to their marriage, education, employment or mobility. (refer table
2.3, 2.4 & 2.5)
Based on these findings and the literature summarised above, we argue that conditional
cash transfers are not the sustainable vehicle for sustainable social change. One of the
ways in which these resources can be better utilised is by supporting process-based
programmes (such as Mahila Samakhya) that focus on changing social norms that can
117
further facilitate empowerment of women and girls. The reason for focusing on process-
based empowerment programmes is to ensure that the programmes are able to engage
and work with the resistance and push-backs that these efforts will provoke. Because
empowerment is of a jagged nature and does not follow a linear trajectory (Jha et al,
forthcoming), it is important for all efforts to focus on ensuring that women and girls
are provided the space to create their own identities, identify their own problems, and
provide them resources and tools to take action. This method will also allow for
diversity of experiences, class, caste, religion and age to be automatically included
within the purview of the programme. For example, older women have inherently
different kinds of marginalisation and vulnerabilities as compared with pre-pubescent
girls. Therefore, it is useful to engage with women and girls as a diverse social group
that are often disadvantaged on the basis of social characteristics other than gender.
Thus, our second model advocates for process-based empowerment strategies that can
be used to empower young girls and women, instead of offering them conditional cash
transfers. We argue that these programmes may not necessarily be based on the models
promulgated by MS. Nevertheless, one could always argue for the strategies of
collectivisation, critical thinking and challenging of social norms as strategies for
engaging with empowerment as explained above in Model 1. However, the very
definition, articulation, realisation and material manifestation of empowerment must
firmly rest within the purview of the young girls and women, as they continually
struggle against stable social structures. In order for these processes to work, we believe
that there are certain pre-conditions that are useful to ensure the success and
sustainability of these programmes.
5.2.3 Pre-conditions of success
The main objective of the Bhagyalakshmi scheme (as it is currently conceptualized) is to
reduce son preference and increase the status of women in the society with a centralized
focus on education. Hence, governance efforts that are directed towards these social
norms and beliefs have to made through processes and methodologies of
empowerment, rather than cash transfers. But to truly harness the reformatory nature of
these programmes, efforts must also be made to strengthen the supply-side of goods
and services.
Table 5. 9: Availability of secondary and higher secondary schools as per enrolment
Year P+UP+Sec+
HS
UP+Sec+
HS
P+UP+
Sec
UP+S
ec
Sec
only
Sec+
HS
HS
Only Total
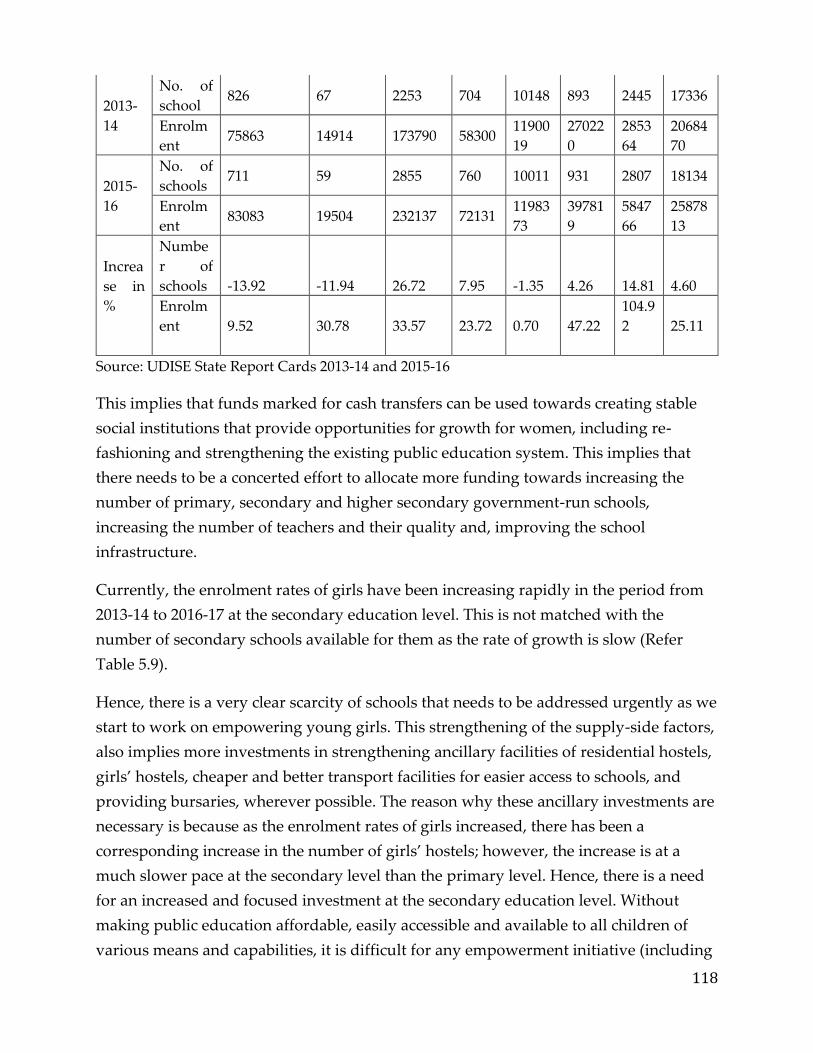
118
2013-
14
No. of
school 826 67 2253 704 10148 893 2445 17336
Enrolm
ent 75863 14914 173790 58300
11900
19
27022
0
2853
64
20684
70
2015-
16
No. of
schools 711 59 2855 760 10011 931 2807 18134
Enrolm
ent 83083 19504 232137 72131
11983
73
39781
9
5847
66
25878
13
Increa
se in
%
Numbe
r of
schools -13.92 -11.94 26.72 7.95 -1.35 4.26 14.81 4.60
Enrolm
ent 9.52 30.78 33.57 23.72 0.70 47.22
104.9
2 25.11
Source: UDISE State Report Cards 2013-14 and 2015-16
This implies that funds marked for cash transfers can be used towards creating stable
social institutions that provide opportunities for growth for women, including re-
fashioning and strengthening the existing public education system. This implies that
there needs to be a concerted effort to allocate more funding towards increasing the
number of primary, secondary and higher secondary government-run schools,
increasing the number of teachers and their quality and, improving the school
infrastructure.
Currently, the enrolment rates of girls have been increasing rapidly in the period from
2013-14 to 2016-17 at the secondary education level. This is not matched with the
number of secondary schools available for them as the rate of growth is slow (Refer
Table 5.9).
Hence, there is a very clear scarcity of schools that needs to be addressed urgently as we
start to work on empowering young girls. This strengthening of the supply-side factors,
also implies more investments in strengthening ancillary facilities of residential hostels,
girls’ hostels, cheaper and better transport facilities for easier access to schools, and
providing bursaries, wherever possible. The reason why these ancillary investments are
necessary is because as the enrolment rates of girls increased, there has been a
corresponding increase in the number of girls’ hostels; however, the increase is at a
much slower pace at the secondary level than the primary level. Hence, there is a need
for an increased and focused investment at the secondary education level. Without
making public education affordable, easily accessible and available to all children of
various means and capabilities, it is difficult for any empowerment initiative (including

119
CCTs) to provide lasting social transformation and change. Similarly, changes with
respect to village infrastructure, including the proper functioning of the roads,
transportation system, and electricity have to be prioritised in order for any of these
empowerment measures to take root.
5.2.4 Cost implications
Mahila Samakhya’s experience tells us that a programme like that costs only about 5-10
crores per annum in Karnataka. Even if that is expanded across the state with fairer wage
norms, the cost is not going to go beyond 20-25 crores. BL has been spending anything
between 200 to 500 crores per annum. If we let the BL go, the same amount can be spent
on strengthening the public education at all levels, especially secondary and tertiary
levels, and hostel facilities can be both expanded and enhanced to bring in the
empowerment based mentoring of girls. In addition, bursaries can be created that can
support really needy girls for education as well as training for employment.
5.3 MODEL 3 – Empowerment Strategies + Multi-tier cash transfer scheme
From several FGDs that were conducted with both men’s and women’s groups, it was
evident that a majority of them wanted to use the final maturity amount towards either
their daughter’s marriage expenses or on her higher education if she wished to pursue
it. Our primary household survey also indicates that 54% of parents want to use the
bond amount for supporting their child’s education while 45% want to use it for
meeting their child’s marriage expenses (Table 4.1). Also, it was the parents who raised
other issues with regard to the scheme - such as the quantum of the final maturity
amount, the duration of the lock-in period and accident / death insurance coverage
being provided. On the other hand, FGDs conducted with adolescent girls (who are in
fact the prime beneficiaries of the scheme) demonstrated a very low level of awareness
and a complete lack of ownership of their scheme. From the FGDs conducted with both
parents’ groups and adolescent girls, it seems highly unlikely that these girls upon
turning 18 will be able to exercise any agency with regard to how the final maturity
amount can be utilized. Yet, these girls expressed an eagerness to pursue higher
education and wanting to engage with their parents to avoid early marriage.
In schemes such as Bhagyalakshmi (BL) and Apni Beti Apni Dhan (ABAD) – one of the
earliest conditional cash transfer schemes for girls in Haryana, it is the parents who are
responsible for the enrolment of the girl child at the time of her birth whereas in more
recent schemes such as Kanyashree Prakalpa (KP) introduced in 2013 by the
Government of West Bengal, it is the adolescent girls who are required to register

120
themselves at the age of 13. This very fundamental difference in ‘who is responsible for
enrolment’ in a scheme such as KP has led to an increase in ownership and instilling
higher aspirations among adolescent girls. Also, generating awareness among parents is
far more challenging than generating awareness among school going children as is
done in KP. Another vital difference between BL and KP is that while BL offers the
entire financial incentive only when the girl turns 18 years, KP staggers the incentives
during the secondary schooling years. The provision of providing cash incentives to the
girl child at different years enables the girls to continue their education and help
overcome family and societal pressures such as early marriage, the need to take care of
younger siblings or helping in doing household work. An impact evaluation of KP [1]
highlighted that the dropout rates and early marriages among adolescent girls have
declined in West Bengal since the introduction of the scheme. It also hinted towards an
improvement in empowerment of adolescent girls, who can now at least dare to make
decisions about their marriage and its timing. As per this study, the main reason for
KP’s success is the introduction of two simultaneous criteria: continued education and
remaining unmarried till the 18th birthday, thus internalising the pathway of education
for reducing underage marriage.
According to the District Level Household Survey (DLHS) 2012-13, the percentage of
underage marriage among girls in Karnataka is 14.1% and along with states such as
West Bengal, Tripura and Andhra Pradesh, lies within the top quartile of all the Indian
states with a very high incidence of underage marriage. Currently in BL, the
beneficiaries receive financial benefits only when they turn 18 and prior to that there are
neither any financial incentives provided nor any other interventions conducted (esp.
during the transition from primary to secondary schooling and beyond) to ensure the
retention of the girl child in school.
From the FGDs, it is also clear that regardless of a behavioural shift, there is an
expressed attitude that parents have aspirations for their daughters to complete higher
education. There is an expressed aspiration among the surveyed households that girls
must complete more than just primary education - 7.72% of the households aspire for
completion of secondary education, 10.18% aspire for completion of higher secondary
education while 15.09% aspire for completion of undergraduate education for their girls
(Table 4.3). Our primary household survey also indicates that amongst the women who
had received any sort of formal schooling, only 27% of them had studied beyond
primary / class 8th (Table 4.2). Feedback from FGDs indicate that a continued
reinforcement and encouragement of girls’ education through scholarship funds might

121
help to motivate parents as well. As per our study, 18.93% of the respondents have
suggested that they be provided with more money for education (refer Table 5.1). FGDs
with adolescent girls also revealed instances of dropping out from school before
secondary education, with one of the reasons being the need to take up paid work to
ease the family’s financial burden.
Taking a cue from West Bengal’s KP scheme, this re-design model recommends
introducing in BL staggered cash incentives to be provided to the girl child at different
stages of secondary and higher secondary schooling. It could be a three-tier scheme
with the first component being a direct transfer of a grant (quantum to be decided) to
girls who are enrolled in grade 9th (transition from primary to secondary), the second
component being a direct transfer of grant to girls who are enrolled in grade 11th
(transition from secondary to higher secondary) and a final grant upon attainment of 18
years, conditional upon her remaining both unmarried and completion of either 8th
grade (Option 1) / 10th grade (Option 2). The final payment can even be staggered for
three years. However, if cash incentives to the girl child at different stages of secondary
schooling (as described above) is introduced for beneficiaries who are enrolling into the
BL scheme today, then it will come into effect only 14 years later when this first batch
reaches grade 9th. On the other hand, if this re-design feature needs to be implemented
immediately within the next couple of years when the first batch of BL beneficiaries
who were enrolled in 2006 reach grade 9th, then this will require the State Government
to allocate additional funds towards enabling the direct transfer of these one-time
grants. Other option could be to discontinue the BL and start this as a new scheme.
In either case, the roll-out of periodic direct transfer will imply major annual budget
allocations, which is going to be larger than the current annual budget allocations
because of the absence of the insurance or the bond as an instrument. If the bond is
discontinued and the direct transfers are adopted, then the requirement of increase in
the budget will be lower if the transferred amounts are small, as is the case for KP. The
annual requirement in this can be close to about one and a half or twice of what the
current allocation for BL is. If both the bond and direct transfers are adopted, the
burden on exchequer will be more than twice the current allocations. The financial
estimates can be carried out if the GoK shows an inclination to adopt this and there is
an agreement on the size of periodic transfers.
122
In conclusion, we argue that despite the inefficiencies inherent in the cash transfer
scheme, there are ways to bolster the scheme so that it is truly able to empower young
girls and ensure their participation in education and citizenship.
123
Chapter 6: Conclusion
The BL scheme is primarily a conditional cash transfer that allows the government to
address certain forms of social practices owing to gender inequalities in the state. One
of the foundational aspects of this inequality is the phenomena of ‘missing’ women or
girls, caused primarily by sex-selection and abortion of girls. Although illegal, it is still
practiced in many parts of the country, and as has been observed in this report, is still
quite prevalent in certain parts of Karnataka. The scheme also provides for enhancing
the value of the girl child within the home, by ensuring that they are not a financial
burden to the family. They do this by issuing a one-time money transfer to the girl,
when she reaches the age of 18. As mentioned already, there are, of course, a few
conditionalities associated with this transfer, including the proper upkeep of
immunisation, ensuring access to early childhood care, and studying at least till the 8th
class. There are also stipulations that try to prevent early marriage and child labour.
Therefore, the scheme hopes to address some of the foundational blocks of gender
inequality in our society.
From our analysis of the literature, the MIS data, and our own field work collecting
quantitative and qualitative data, we found that CCTs are not the appropriate vehicle to
do so, and if they are employed, they have to be accompanied by process-based
empowerment initiatives that will bolster the impact of the CCTs. While cash in the
hands of young girls is very useful and critical in many resource-poor contexts, unless
there is a mechanism whereby girls are able to use that money for their own welfare (as
opposed to the welfare of their families), the cash disbursement fails to reach its
intended objective. CCTs can definitely and are often used to incentive positive
behaviours among families and communities. From our understanding, the social
discourse as well as behaviour has been moving towards these positive outcomes. For
examples, families are naturally moving towards fewer children as well as sending their
girl children to school at least upto the primary school. What they are now facing are
structural and social barriers such as inaccessible schools and higher secondary colleges,
lack of teachers, lack of schools and transportation facilities, regressive attitudes
towards mobility of girls as well as their educational and career prospects. While CCTS
do help in increasing the economic capacity of the households to meet the expenses
associated with schooling, they are unable to tackle these very real barriers to gender
equality and access to quality education.

124
Additionally, a targeted approach with the underlying (and perhaps, regressive) notion
that these problems of gender inequality are prevalent only among the low-resourced
families and communities is bound to fail. If we have to address social norms, beliefs,
and attitudes, there has to be concerted universal efforts to shifts the paradigm of
gender inequality in case of outreach of empowerment programmes. Moreover, clear
demarcations have to be made with respect to the use of CCTs to delineate which social
shifts are possible through cash incentivisation and which aren’t. For example, from our
data, we already know that scholarships and free hostel provisions are critical for some
families to be able to access educational resources for their children. It is also important
to note that certain cash incentives at crucial times in a girl’s education, such as from
class 9th to 10th or from 10th to 11th can influence family decisions towards girls’
education especially if the family is resource-strapped. But without the accompanying
process-based empowerment initiatives whereby the family is sensitised to the plight of
the girl child, or if the child herself is not empowered enough to ask for her rights, the
path to gender equality is likely to be very long. It is clear from our assessment that
normative qualities such as equality, justice, and citizenship are not necessarily possible
with the deployment of CCTs.
So, a re-imagining of the BL scheme is necessary. Given the scope of the scheme as well
as the pervasive nature of the problems being tackled, it is important to bolster the
current framework with empowerment strategies that will allow for the scheme to
directly tackle deep-rooted social institutions such as gender, caste, religion and caste.
By employing empowerment strategies, girls might move beyond merely stating their
ambitions, but also work towards engaging with these ambitions, whether it is related
to their education, marriage, or livelihoods. As emphasised earlier, the other reason for
emphasising process-based empowerment strategies that can accompany the BL scheme
is that it allows for the holistic development of the children, sensitises the communities
on the basic ideas and notions of gender equality, and focuses on changing social norms
that provide relief to larger populations of girls and women than are covered within the
current scheme. Empowerment strategies also allow for diversity in the pool of BL
beneficiaries and allows for beneficiaries to fully utilise their funds to their own will (as
intended by the scheme).
In sum, we argue that in order to fundamentally change the lives of women and to
move towards gender equality, both the situation of empowerment and an empowering
situation has to be put in place (Rowlands, 1996). The situation of empowerment is seen
as spaces in which women and girls are able to become aware of the power dynamics,
125
develop capacities to gain control over their lives, exercise this control and also are able
to support empowerment initiatives, and an empowering situation is seen as a process
to do so. We argue that instead of focusing on providing girls financial incentives, we
have to work towards creating a space where girls build their own future.
126
References
Agarwal, B. (2000). "Conceptualising environmental collective action: why gender
matters." Cambridge journal of economics 24(3): 283-310.
Anand Krishnan, R. A., Peter Byass, Chandrakant Pandav and Nawi Ng. (2014). No
one says 'no' to money. International Journal for Equity in Health, 13(11).
Arijita Dutta and Anindita Sen (2018) “West Bengal's Successful KanyashreePrakalpa
Programme Needs More Push From State and Beneficiaries”, Economic and Political
Weekly, Vol. 53, Issue No. 17
Arnold, T. Catherine. (2011). Cash Transfers: Literature review. Policy Division. DFID.
Bastagli, F. (2011). Conditional Cash Transfers as a Tool of Social Policy. Economic and
Political Weekly (21), 61-66.
Bruce, J. (2011). "Violence against adolescent girls: a fundamental challenge to
meaningful equality." Population Council.
Budlender, D. (2010). What do time use studies tell us about unpaid care work?
Evidence from seven countries. Time use studies and unpaid care work, Routledge:
23-67.
CBPS. (2015). Millenium Development Goals and Karnataka . Bangalore: UNICEF.
Retrieved from http://cbps.in/wp-content/uploads/MDG-Karnataka-Final.pdf
CBPS. (2016). A Review of Expenditure and Services of ICDS in Karnataka. Bangalore:
UNICEF. Retrieved from http://cbps.in/wp-content/uploads/CBPS_UNICEF_ICDS-
Report.pdf
Census 2011 Figures at a Glance
http://www.censusindia.gov.in/2011census/PCA/PCA_Highlights/pca_highlights_file/
karnataka/Figures_Glance_Karnataka.pdf
Dongre, A. (2013). How is Janani Suraksha Yojana performing in backward districts of
India. Economic and Political Weekly(42).
Folbre, N. (2006). "Measuring care: Gender, empowerment, and the care economy."
Journal of human development 7(2): 183-199.
Government of Karnataka, Programme Monitoring and Statistics Department. (2013-
14). Economic Survey of Karnataka. Government of Karnataka.
127
Hochschild, A and Machung, A(1989). " The second shift: Working parents and the
revolution at home. New York: Penguin Press.
IIPS. (2012-13). State Fact Sheet Karnataka. Retrieved from District Level Household
Survey :
https://www.karnataka.gov.in/hfw/decell/Documents/District%20Level%20Household
%20and%20Facility%20Survey%204-%20Karnataka.pdf
Jha, Jyostna et al. (2016). Reducing Child Marriage in India : A model to scale up
results, Centre for Budget and Policy Studies and United Nations Children’s Fund,
New Delhi.
Jha, Jyotsna. (2018).Education and gender: A critical analysis of policies in India' in
Childhoods in India: Traditions, trends and transformations (edited by T S
Saraswathi), Routledge, London
Kabeer, N. (2005). "Is microfinance a'magic bullet' for women's empowerment?
Analysis of findings from South Asia." Economic and Political weekly: 4709-4718.
Kaul, V., et al (forthcoming). The India Early Childhood Education Impact Study,
Ambedkar University Delhi and ASER Centre, New delhi; UNICEF
K. M., and Prakash, N., (2013). Cycling to School: Increasing Secondary School
Enrollment for Girls in India. IGC Working Paper, 15 August.
Kumar, D. B. (2015, December). Financial Incentives for Girls - What works. Policy
Brief. India: UNFPA.
Ghatak, Maitreesh, C. K., Sandip Mitra (2016). Cash versus Kind. Understanding the
preferences of the Bicycle Programme Beneficiaries in Bihar, Economic and Political
Weekly: 51-60.
Mazumdar, C.T. (2012). Can incentives increase preference for daughters? Evidence
from a cash transfer scheme in Haryana, India. The Georgetown Public Policy Review,
18 (1), 64-80.
Memo no. WCD: CW:BS: Para /01/10-11, Government of karnataka (physical copy
obtained)
Midstream Marketing & Research Pvt. Ltd. (n.d.). Evaluation Study of Saraswati
Bicycle Supply Scheme in Chhatisgarh. State Council for Education Research and
Training, Raipur .

128
Nanda P., Dutta, N., & and Das, P. (2014). Impact of conditional cash transfers on girls’
education. Retrieved from:
www.icrw.org/files/publications/IMPACCT_Hires_FINAC_3_20.pdf. International
Center for Research on Women/USAID
Narayanan, S. (2011). A case for reframing the cash transfer debate in India. Economic
and Political Weekly (21), 41-48.
NitiAayog. (2013). Total Fertility Rate. (NitiAayog) Retrieved from Niti.gov:
http://niti.gov.in/content/total-fertility-rate-tfr-birth-woman
Planning, Programme Monitoring & Statistics Department. (2013-14). Economic
Survey of Karnataka .
Prabhu, K. S. (2009). Conditional Cash Transfers Schemes for Alleviating Human
Poverty: Relevance for India, UNDP India.
Rajan, S. I, S. Srinivasan and Arjun S Bedi (2017). Update on trends in sex ratio at birth
in India, Economic and Political Weekly, March 18, 2017, vol 52, Issue no. 11.
(Commentary)
Ram, T. V. S. a. F. (2015). Conditional Cash Transfers for Girls in India: Assessment of
a Girl Child Promotion Scheme from Beneficiary Perspective: International Institute
for Population Sciences, Mumbai
Rowlands, J. (1995). "Empowerment examined." Development in practice 5(2): 101-107
Roy, S., Hegde, H. V., Bhattacharya, D., Upadhya, V., &Kholkute, S. D. (2015). Tribes
in Karnataka: Status of health research. The Indian journal of medical research, 141(5),
673.
Schady, A. F. a. N. (2009). Conditional Cash Transfer: Reducing Present and Future
Poverty Washington DC, World Bank
Sen, A (2018). West Bengal's Successful KanyashreePrakalpaProgramme Needs More
Push From State and Beneficiaries. Economic and Political Weekly,Vol. 53, Issue No.
17.
Slater, J. F. (2006). Introduction: Cash Transfers: Panacea for Poverty Reduction or
Money Down the Drain? Development Policy Review, 499-511.
Sekher, T. V. (2010). Special Financial Incentives for the Girl Child in India: A Review
of select schemes. Mumbai United Nations Population Fund: 19-22.
129
Sinha, N., &Yoong; J. (2009). Long-term financial incentives and investment in
daughters evidence from conditional cash transfers in North India, Policy (Research
Working Paper 4860). Washington, D.C.: The World Bank
Soares, F.V., & Silva, E. (2010). Conditional cash transfer programmes and gender
vulnerabilities in Latin America: Case studies from Brazil, Chile and Colombia
(Discussion Paper Series). London, United Kingdom : Overseas Development Institute.
Son, H. H. (2008). Conditional Cash Transfer Programs: An effective tool for poverty
alleviation?, Asian Development Bank.
Tanuka Endow, T.V Sekher and Antara Lahiri (2015) “Cash Transfers for Children:
Experiences of States in India”, Discussion paper, IHD and UNICEF
United Nations Children’s Fund (n.d.), Improving Children’s Lives Transforming the
Future: 25 years of child rights in South Asia, undated
Vanishree Joseph. (2016). Conditional cash transfer in India: is it gendered?
International Journal of Gender Studies in Developing Societies, Vol 1, Issue 3, pp 252-
266
Vyasulu, V. (2010). Brazil's Fome Zero Strategy: Can India implement cash transfers?.
Economic and Political Weekly (26 and 27): 89 - 95.

130
Annexure 1
Table A1. 1: Percentage of households according to the number of daughters in the
household
Number of daughters within household Percentage
0 21.55
1 44.47
2 24.70
3 7.57
4 1.50
5 0.10
6 0.11
Source: CBPS Household Survey, 2018
Table A1. 2: Household distribution by type of card in sample population
Household distribution by type of card (%) Belgaum Tumkur Mysore Raichur Karnataka
Ur
ban
Ru
ral
To
tal
Ur
ban
Ru
ral
To
tal
Ur
ban
Ru
ral
To
tal
Ur
ban
Ru
ral
To
tal
Ur
ban
Ru
ral
To
tal
Antyo
daya 4.52
4.2
4
4.2
8 2.51
5.7
0
5.3
9 2.67
2.4
4
2.4
5
10.6
8
14.
04
13.
47 6.72
7.0
2
6.9
9
BPL
card
90.4
2
67.
70
70.
74
92.0
7
92.
46
92.
42
95.1
7
61.
44
63.
26
88.5
8
83.
66
84.
49
89.8
5
74.
09
75.
72
APL
card 5.06
28.
06
24.
99 5.42
1.8
4
2.1
8 2.16
36.
13
34.
29 0.74
2.3
0
2.0
4 3.43
18.
89
17.
29
Source: Economic Survey of Karnataka 2016-17
Table A1. 3: Child marriage among girls against wealth quintile in Karnataka
Percentage of child marriage
among girls Belgaum Tumkur Mysore Raichur Karnataka
Poorest 72.41 45.45 20.00 62.16 47.15
Second 44.90 24.00 14.63 49.06 34.70
Middle 44.44 15.38 13.51 26.32 21.65
Fourth 38.71 9.68 14.81 30.00 13.12
Richest 0.00 0.00 11.43 14.29 3.03
Total 41.52 17.53 14.67 37.21 22.61
(Calculated by taking the (number of married in a particular age group) * (100)/ (total
number married) (**Married Since January 1st 2004)
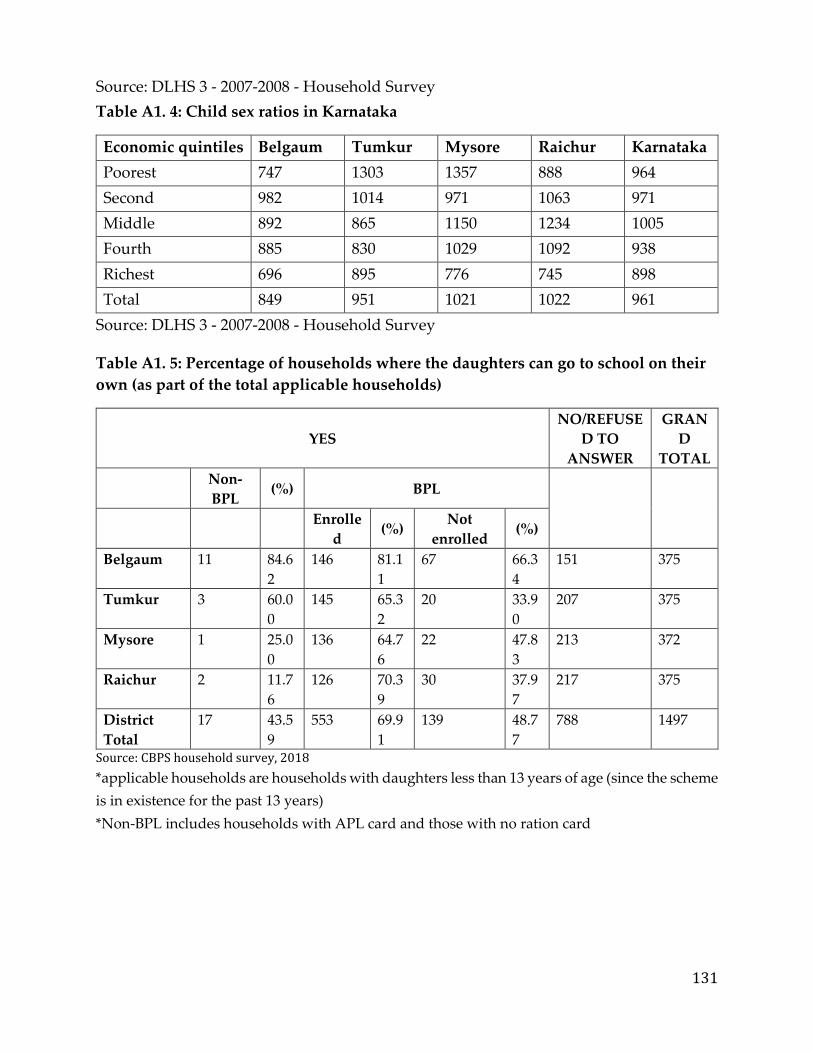
131
Source: DLHS 3 - 2007-2008 - Household Survey
Table A1. 4: Child sex ratios in Karnataka
Economic quintiles Belgaum Tumkur Mysore Raichur Karnataka
Poorest 747 1303 1357 888 964
Second 982 1014 971 1063 971
Middle 892 865 1150 1234 1005
Fourth 885 830 1029 1092 938
Richest 696 895 776 745 898
Total 849 951 1021 1022 961
Source: DLHS 3 - 2007-2008 - Household Survey
Table A1. 5: Percentage of households where the daughters can go to school on their
own (as part of the total applicable households)
YES
NO/REFUSE
D TO
ANSWER
GRAN
D
TOTAL
Non-
BPL (%) BPL
Enrolle
d (%)
Not
enrolled (%)
Belgaum 11 84.6
2
146 81.1
1
67 66.3
4
151 375
Tumkur 3 60.0
0
145 65.3
2
20 33.9
0
207 375
Mysore 1 25.0
0
136 64.7
6
22 47.8
3
213 372
Raichur 2 11.7
6
126 70.3
9
30 37.9
7
217 375
District
Total
17 43.5
9
553 69.9
1
139 48.7
7
788 1497
Source: CBPS household survey, 2018
*applicable households are households with daughters less than 13 years of age (since the scheme
is in existence for the past 13 years)
*Non-BPL includes households with APL card and those with no ration card

132
Table A1. 6: Percentage of households where the daughters can go to the market on
their own (as part of the total applicable households)
Yes
No/Refuse
d to
Answer
Gran
d
Total
Non-
BPL (%) BPL
Enrolle
d (%)
Not
enrolled (%)
Belgaum 0 0.00 10 14.08 4 28.57 361 375
Tumkur 1 100.0
0 32 45.07 4 28.57
338 375
Mysore 0 0.00 25 35.21 5 35.71 342 372
Raichur 0 0.00 4 5.63 1 7.14 370 375
District
Total 1
100.0
0 71
100.0
0 14
100.0
0
1411 1497
Source: CBPS household survey, 2018
*applicable households are households with daughters less than 13 years of age (since the
scheme is in existence for the past 13 years)
*Non-BPL includes households with APL card and those with no ration card
Table A1. 7: Percentage of households where the daughters can go to the district HQ
on their own (as part of the total applicable households)
Yes
No/Refuse
d to
Answer
Gran
d
Total
Non-
BPL (%) BPL
Enrolle
d (%)
Not
enrolled (%)
Belgaum 0 0.00 1 4.00 0 0.00 374 375
Tumkur 0 0.00 9 36.00 4 36.36 362 375
Mysore 0 0.00 14 56.00 6 54.55 352 372
Raichur 1 100.0
0 1 4.00 1 9.09
372 375
District
Total 1
100.0
0 25
100.0
0 11
100.0
0
1460 1497
Source: CBPS household survey, 2018
*applicable households are households with daughters less than 13 years of age (since the scheme
is in existence for the past 13 years)
*Non-BPL includes households with APL card and those with no ration card

133
Table A1. 8: Percentage of households depicting decision-making power within a
household
A1.8.1: Who decides/decided whether you should visit a doctor/clinic/health
centre/hospital when you fall sick/unwell? (overall state)
Non-
BPL
(%)
BPL
Enrolled (%) Not
enrolled (%)
Self 4 10.26 266 33.63 79 27.72
Husband 31 79.49 493 62.33 187 65.61
Father/Mother 3 7.69 12 1.52 8 2.81
Father-in-law 0 0.00 5 0.63 3 1.05
Mother-in-law 0 0.00 9 1.14 7 2.46
Siblings 0 0.00 1 0.13 0 0.00
Sister-in-law/brother-in-law 0 0.00 0 0.00 0 0.00
Other men in family 0 0.00 0 0.00 0 0.00
Other women in family 0 0.00 0 0.00 0 0.00
Other relatives/friends 0 0.00 0 0.00 0 0.00
Refused to answer 1 2.56 5 0.63 1 0.35
Total 39 100.00 791 100.00 285 100.00
A1.8.2: Who decides/decided in whether your son should pursue education or not? (overall
state)
Non-BPL (%)
BPL
Enrolled (%) Not enrolled (%)
Father 36 49.32 758 51.18 279 50.73
Mother 35 47.95 683 46.12 258 46.91
Child 0 0.00 13 0.88 1 0.18
Siblings 1 1.37 2 0.14 0 0.00
Grandfather 0 0.00 12 0.81 7 1.27
Grandmother 1 1.37 7 0.47 2 0.36
Relatives 0 0.00 0 0.00 1 0.18
Other men in family 0 0.00 3 0.20 2 0.36
Other women in family 0 0.00 1 0.07 0 0.00
Other non-family
individuals (friends,
business partners,
colleagues, Sangha women) 0 0.00 2 0.14 0 0.00
Total 73 100.00 1481 100.00 550 100.00
A1.8.3: Who decides/decided till which level should your son study (overall state)
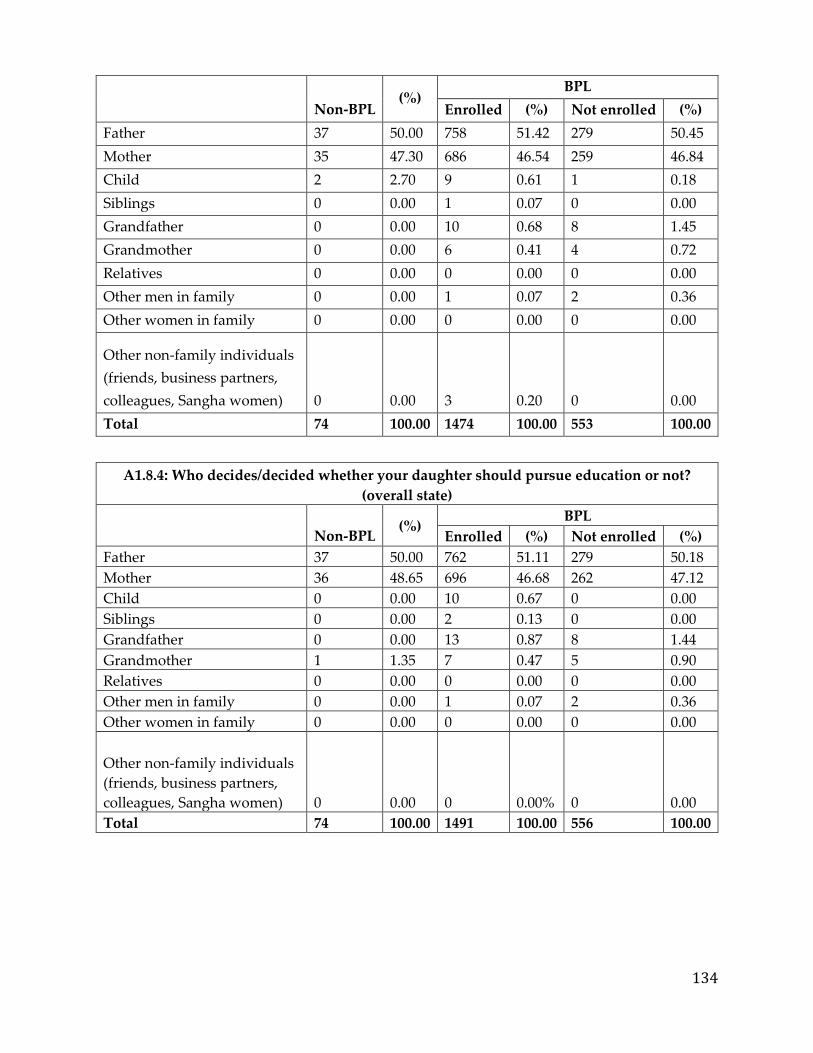
134
Non-BPL
(%)
BPL
Enrolled (%) Not enrolled (%)
Father 37 50.00 758 51.42 279 50.45
Mother 35 47.30 686 46.54 259 46.84
Child 2 2.70 9 0.61 1 0.18
Siblings 0 0.00 1 0.07 0 0.00
Grandfather 0 0.00 10 0.68 8 1.45
Grandmother 0 0.00 6 0.41 4 0.72
Relatives 0 0.00 0 0.00 0 0.00
Other men in family 0 0.00 1 0.07 2 0.36
Other women in family 0 0.00 0 0.00 0 0.00
Other non-family individuals
(friends, business partners,
colleagues, Sangha women) 0 0.00 3 0.20 0 0.00
Total 74 100.00 1474 100.00 553 100.00
A1.8.4: Who decides/decided whether your daughter should pursue education or not?
(overall state)
Non-BPL (%)
BPL
Enrolled (%) Not enrolled (%)
Father 37 50.00 762 51.11 279 50.18
Mother 36 48.65 696 46.68 262 47.12
Child 0 0.00 10 0.67 0 0.00
Siblings 0 0.00 2 0.13 0 0.00
Grandfather 0 0.00 13 0.87 8 1.44
Grandmother 1 1.35 7 0.47 5 0.90
Relatives 0 0.00 0 0.00 0 0.00
Other men in family 0 0.00 1 0.07 2 0.36
Other women in family 0 0.00 0 0.00 0 0.00
Other non-family individuals
(friends, business partners,
colleagues, Sangha women) 0 0.00 0 0.00% 0 0.00
Total 74 100.00 1491 100.00 556 100.00

135
A.1.8. 5: Who decides/decided till which level should your daughter study? (overall state)
APL (%)
BPL
Enrolled (%) Not enrolled (%)
Father 37 51.39 763 51.48 279 50.54
Mother 33 45.83 691 46.63 258 46.74
Child 1 1.39 6 0.40 0 0.00
Siblings 0 0.00 1 0.07 0 0.00
Grandfather 0 0.00 12 0.81 9 1.63
Grandmother 1 1.39 8 0.54 4 0.72
Relatives 0 0.00 0 0.00 0 0.00
Other men in family 0 0.00 1 0.07 2 0.36
Other women in family 0 0.00 0 0.00 0 0.00
Other non-family individuals
(friends, business partners,
colleagues, Sangha women) 0 0.00 0 0.00 0 0.00
Total 72 100.00 1482 100.00 552 100.00
A1.8.6: Who decides/decided whether your son should get married or not? (overall state)
Non-BPL (%)
BPL
Enrolled (%) Not enrolled (%)
Father 38 48.72 751 50.74 280 49.91
Mother 36 46.15 678 45.81 258 45.99
Child 1 1.28 11 0.74 1 0.18
Siblings 0 0.00 1 0.07 0 0.00
Grandfather 1 1.28 21 1.42 13 2.32
Grandmother 1 1.28 13 0.88 5 0.89
Relatives 0 0.00 2 0.14 2 0.36
Other men in family 1 1.28 2 0.14 2 0.36
Other women in family 0 0.00 1 0.07 0 0.00
Total 78 100.00 1480 100.00 561 100.00
A1.8.7: Who decides/decided whether your daughter should get married or not (overall state)
Non-BPL (%)
BPL
Enrolled (%) Not enrolled (%)
Father 38 51.35 755 50.71 279 49.82
Mother 36 48.65 683 45.87 261 46.61
Child 0 0.00 16 1.07 0 0.00
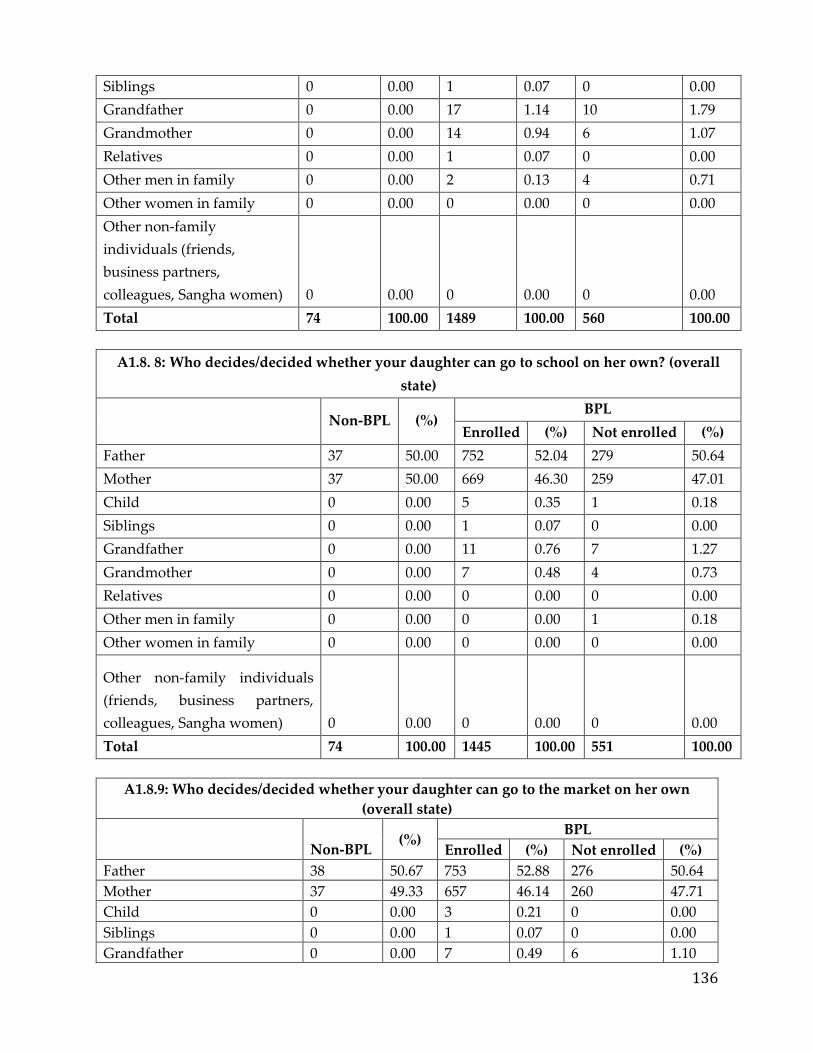
136
Siblings 0 0.00 1 0.07 0 0.00
Grandfather 0 0.00 17 1.14 10 1.79
Grandmother 0 0.00 14 0.94 6 1.07
Relatives 0 0.00 1 0.07 0 0.00
Other men in family 0 0.00 2 0.13 4 0.71
Other women in family 0 0.00 0 0.00 0 0.00
Other non-family
individuals (friends,
business partners,
colleagues, Sangha women) 0 0.00 0 0.00 0 0.00
Total 74 100.00 1489 100.00 560 100.00
A1.8. 8: Who decides/decided whether your daughter can go to school on her own? (overall
state)
Non-BPL (%) BPL
Enrolled (%) Not enrolled (%)
Father 37 50.00 752 52.04 279 50.64
Mother 37 50.00 669 46.30 259 47.01
Child 0 0.00 5 0.35 1 0.18
Siblings 0 0.00 1 0.07 0 0.00
Grandfather 0 0.00 11 0.76 7 1.27
Grandmother 0 0.00 7 0.48 4 0.73
Relatives 0 0.00 0 0.00 0 0.00
Other men in family 0 0.00 0 0.00 1 0.18
Other women in family 0 0.00 0 0.00 0 0.00
Other non-family individuals
(friends, business partners,
colleagues, Sangha women) 0 0.00 0 0.00 0 0.00
Total 74 100.00 1445 100.00 551 100.00
A1.8.9: Who decides/decided whether your daughter can go to the market on her own
(overall state)
Non-BPL (%)
BPL
Enrolled (%) Not enrolled (%)
Father 38 50.67 753 52.88 276 50.64
Mother 37 49.33 657 46.14 260 47.71
Child 0 0.00 3 0.21 0 0.00
Siblings 0 0.00 1 0.07 0 0.00
Grandfather 0 0.00 7 0.49 6 1.10

137
Grandmother 0 0.00 3 0.21 2 0.37
Relatives 0 0.00 0 0.00 0 0.00
Other men in family 0 0.00 0 0.00 0 0.00
Other women in family 0 0.00 0 0.00 1 0.18
Other non-family individuals
(friends, business partners,
colleagues, Sangha women) 0 0.00 0 0.00 0 0.00
Total 75 100.00 1424 100.00 545 100.00
A1.8.10: Who decides/decided whether your daughter can go to the district headquarter on
her own? (overall state)
Non-BPL (%)
BPL
Enrolled (%) Not enrolled (%)
Father 38 51.35 766 52.39 280 50.54
Mother 36 48.65 680 46.51 264 47.65
Child 0 0.00 2 0.14 0 0.00
Siblings 0 0.00 2 0.14 0 0.00
Grandfather 0 0.00 8 0.55 5 0.90
Grandmother 0 0.00 4 0.27 3 0.54
Relatives 0 0.00 0 0.00 0 0.00
Other men in family 0 0.00 0 0.00 1 0.18
Other women in family 0 0.00 0 0.00 1 0.18
Other non-family individuals
(friends, business partners,
colleagues, Sangha women) 0 0.00 0 0.00 0 0.00
Total 74 100.00 1462 100.00 554 100.00
Table A1.8.11: What is the education level a girl should pursue?
Non-BPL (%)
BPL
Enrolled (%) Not enrolled (%)
No education 1 2.63 7 0.88 0 0.00
At least primary 0 0.00 2 0.25 0 0.00
At least upper primary 1 2.63 0 0.00 1 0.35
At least secondary 4 10.53 33 4.17 22 7.72
At least higher secondary 1 2.63 68 8.60 29 10.18
At least under graduate 4 10.53 202 25.54 43 15.09
At least post graduate 2 5.26 35 4.42 12 4.21
At least doctorate 1 2.63 34 4.30 8 2.81
At least vocational course 3 7.89 31 3.92 14 4.91
At least diploma course 1 2.63 5 0.63 2 0.70
As much as the girl wants 20 52.63 374 47.28 154 54.04
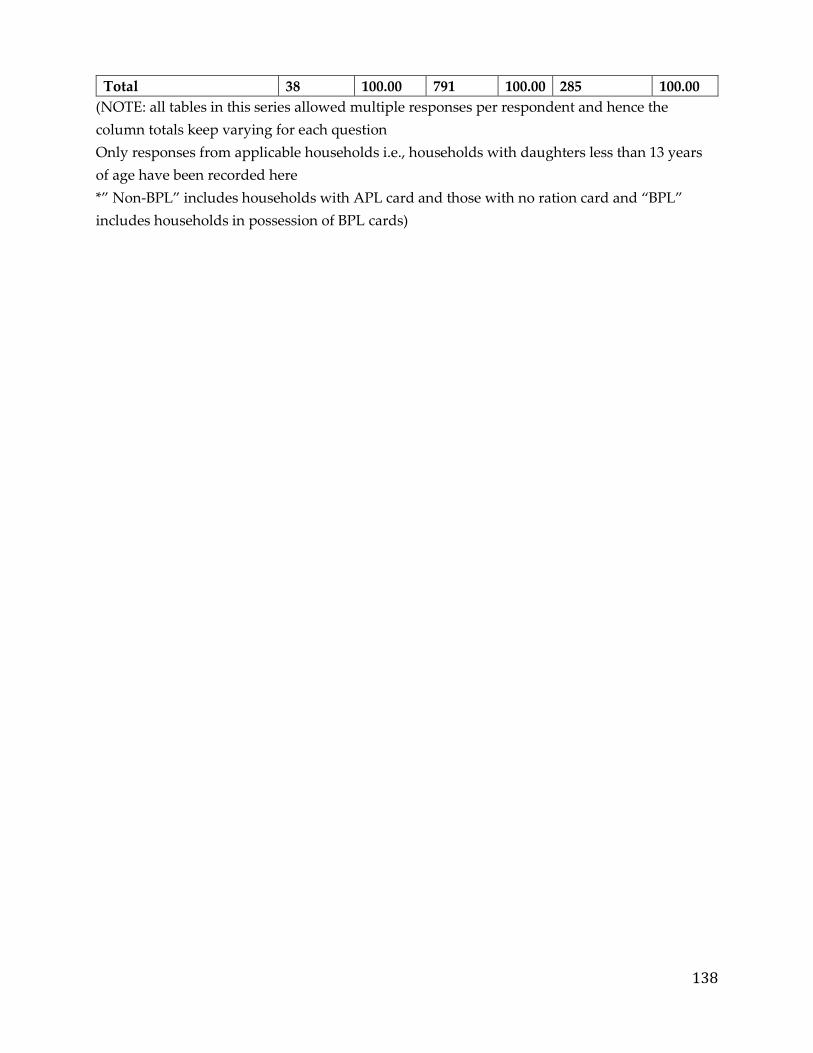
138
Total 38 100.00 791 100.00 285 100.00
(NOTE: all tables in this series allowed multiple responses per respondent and hence the
column totals keep varying for each question
Only responses from applicable households i.e., households with daughters less than 13 years
of age have been recorded here
*” Non-BPL” includes households with APL card and those with no ration card and “BPL”
includes households in possession of BPL cards)
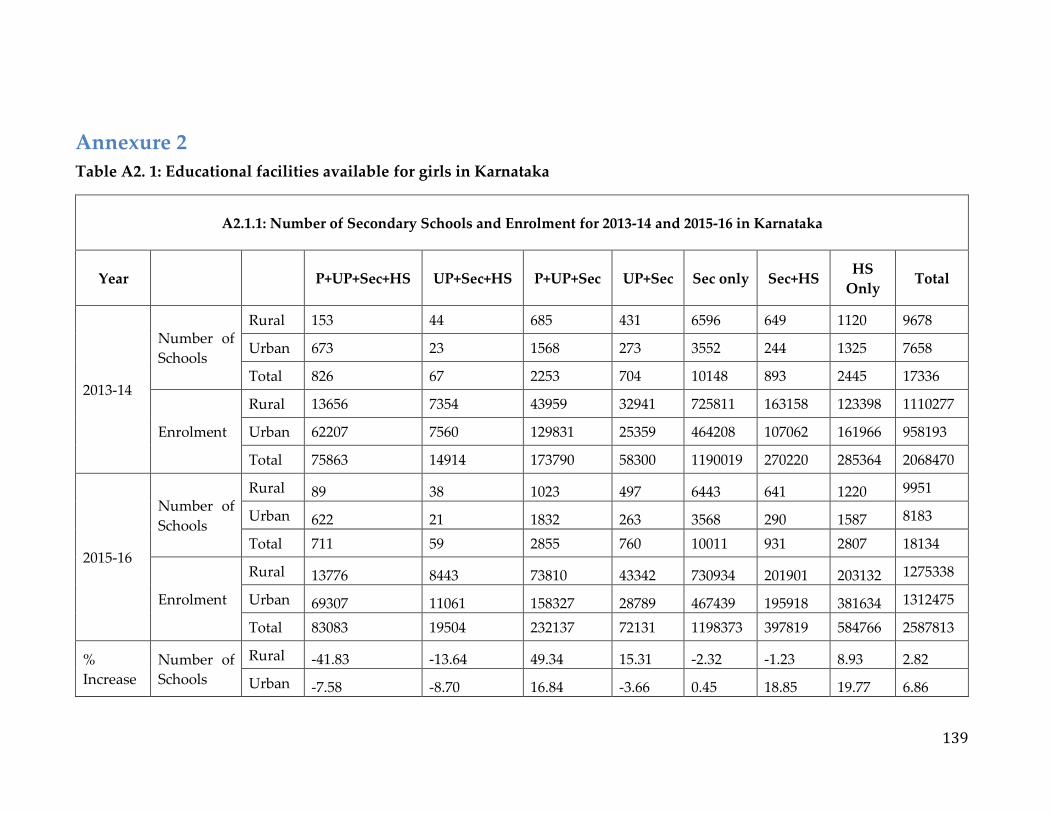
139
Annexure 2
Table A2. 1: Educational facilities available for girls in Karnataka
A2.1.1: Number of Secondary Schools and Enrolment for 2013-14 and 2015-16 in Karnataka
Year P+UP+Sec+HS UP+Sec+HS P+UP+Sec UP+Sec Sec only Sec+HS HS
Only Total
2013-14
Number of
Schools
Rural 153 44 685 431 6596 649 1120 9678
Urban 673 23 1568 273 3552 244 1325 7658
Total 826 67 2253 704 10148 893 2445 17336
Enrolment
Rural 13656 7354 43959 32941 725811 163158 123398 1110277
Urban 62207 7560 129831 25359 464208 107062 161966 958193
Total 75863 14914 173790 58300 1190019 270220 285364 2068470
2015-16
Number of
Schools
Rural 89 38 1023 497 6443 641 1220 9951
Urban 622 21 1832 263 3568 290 1587 8183
Total 711 59 2855 760 10011 931 2807 18134
Enrolment
Rural 13776 8443 73810 43342 730934 201901 203132 1275338
Urban 69307 11061 158327 28789 467439 195918 381634 1312475
Total 83083 19504 232137 72131 1198373 397819 584766 2587813
%
Increase
Number of
Schools
Rural -41.83 -13.64 49.34 15.31 -2.32 -1.23 8.93 2.82
Urban -7.58 -8.70 16.84 -3.66 0.45 18.85 19.77 6.86
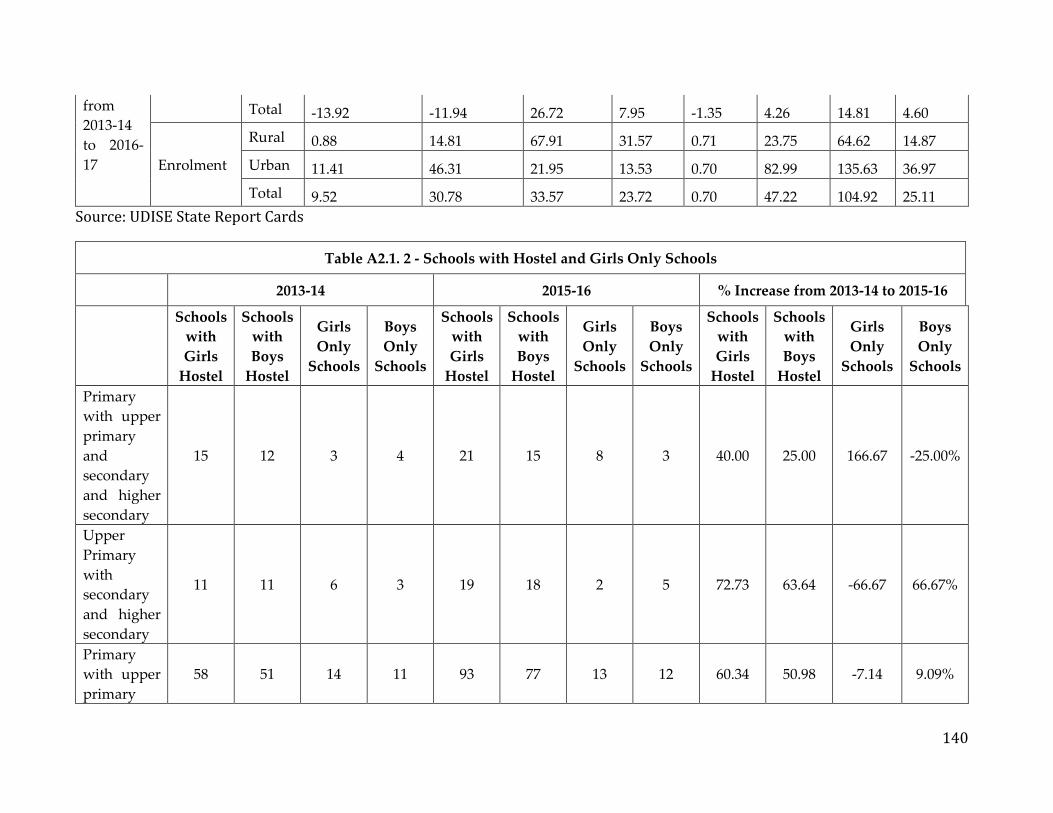
140
from
2013-14
to 2016-
17
Total -13.92 -11.94 26.72 7.95 -1.35 4.26 14.81 4.60
Enrolment
Rural 0.88 14.81 67.91 31.57 0.71 23.75 64.62 14.87
Urban 11.41 46.31 21.95 13.53 0.70 82.99 135.63 36.97
Total 9.52 30.78 33.57 23.72 0.70 47.22 104.92 25.11
Source: UDISE State Report Cards
Table A2.1. 2 - Schools with Hostel and Girls Only Schools
2013-14 2015-16 % Increase from 2013-14 to 2015-16
Schools
with
Girls
Hostel
Schools
with
Boys
Hostel
Girls
Only
Schools
Boys
Only
Schools
Schools
with
Girls
Hostel
Schools
with
Boys
Hostel
Girls
Only
Schools
Boys
Only
Schools
Schools
with
Girls
Hostel
Schools
with
Boys
Hostel
Girls
Only
Schools
Boys
Only
Schools
Primary
with upper
primary
and
secondary
and higher
secondary
15 12 3 4 21 15 8 3 40.00 25.00 166.67 -25.00%
Upper
Primary
with
secondary
and higher
secondary
11 11 6 3 19 18 2 5 72.73 63.64 -66.67 66.67%
Primary
with upper
primary
58 51 14 11 93 77 13 12 60.34 50.98 -7.14 9.09%

141
and
secondary
Upper
Primary
with
secondary
131 139 112 15 251 285 125 20 91.60 105.04 11.61 33.33%
Secondary
only 261 120 490 116 320 145 464 112 22.61 20.83 -5.31 -3.45%
Secondary
with Hr.
Secondary
47 44 65 25 32 15 68 23 -31.91 -65.91 4.62 -8.00%
Hr.
Secondary
only
328 286 161 31 302 251 211 30 -7.93 -12.24 31.06 -3.23%
All Schools 851 663 851 205 1038 806 891 205 21.97 21.57 4.70 0.00
Source: UDISE State Report Cards 2013-14 and 2015-16

142
Annexure 3
Table A3. 1: Statistics related to girl education
Table A3.1.1: Transition rates from secondary to higher secondary education
2013-14 2015-16
Secondary HS Secondary HS
Ratio of Girls to Boys' Enrolment 0.93 1.08 0.92 1.05
Transition Rate (Elementary to Secondary
and Secondary to HS) 91.38 25.09 92.09 52.01
Source: UDISE State Report Cards 2013-14 and 2015-16
Table A3.1.2: GER and NER for 2012-13 and 2015-16
2012-13 2015-16
GER NER GER NER
Secondary
Boys 75.49 60.92 82.35 61.57
Girls 73.64 59.6 84.19 62.78
Total 74.59 60.28 83.22 62.14
Higher Secondary
Boys 16.01 13.5 37.12 24.91
Girls 18.07 15.78 42.87 29.3
Total 16.99 14.59 39.86 27
Source: UDISE Flash Statistics for 2015-16
GER = Total enrolment in a particular stage of school education, regardless of age, expressed as a
percentage of
the official age-group of the Population which corresponds to the given stage of school
education in a given
school year. The GER shows the general level of participation per stage of school education.
NER = Total number of pupils enrolled in a particular stage of school education who are of the
corresponding official age group expressed as a percentage of the official age-group of the
population in a given school year.
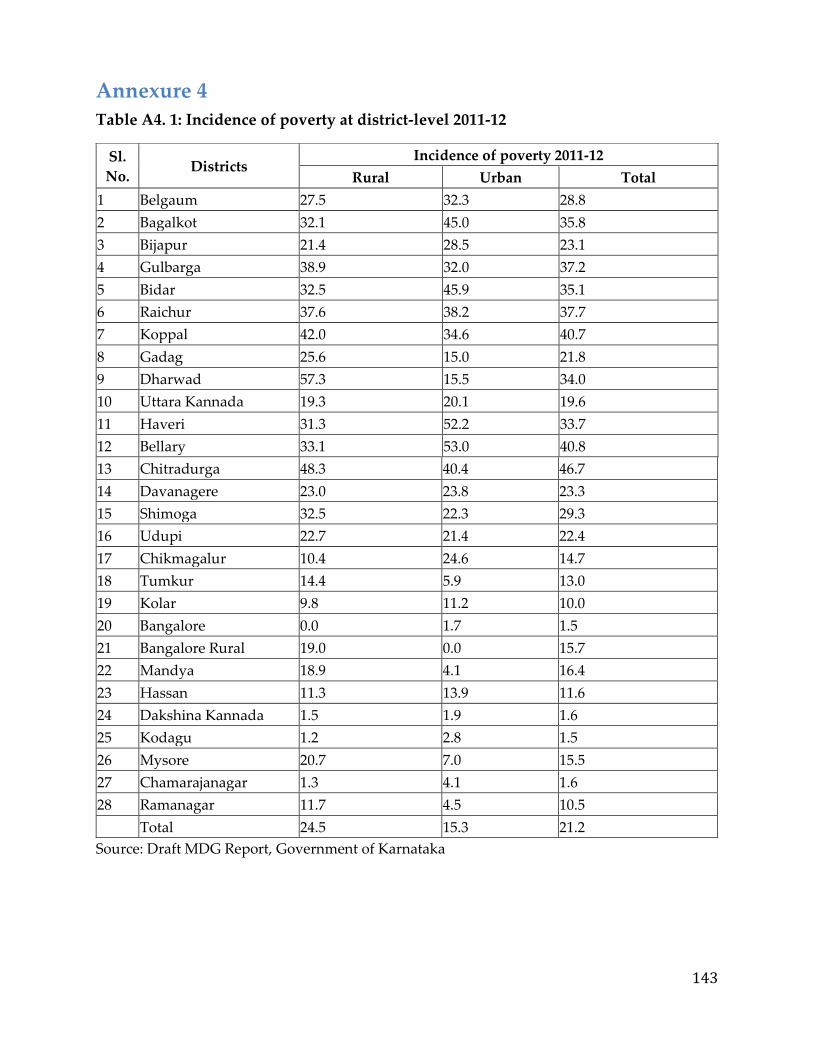
143
Annexure 4
Table A4. 1: Incidence of poverty at district-level 2011-12
Sl.
No. Districts
Incidence of poverty 2011-12
Rural Urban Total
1 Belgaum 27.5 32.3 28.8
2 Bagalkot 32.1 45.0 35.8
3 Bijapur 21.4 28.5 23.1
4 Gulbarga 38.9 32.0 37.2
5 Bidar 32.5 45.9 35.1
6 Raichur 37.6 38.2 37.7
7 Koppal 42.0 34.6 40.7
8 Gadag 25.6 15.0 21.8
9 Dharwad 57.3 15.5 34.0
10 Uttara Kannada 19.3 20.1 19.6
11 Haveri 31.3 52.2 33.7
12 Bellary 33.1 53.0 40.8
13 Chitradurga 48.3 40.4 46.7
14 Davanagere 23.0 23.8 23.3
15 Shimoga 32.5 22.3 29.3
16 Udupi 22.7 21.4 22.4
17 Chikmagalur 10.4 24.6 14.7
18 Tumkur 14.4 5.9 13.0
19 Kolar 9.8 11.2 10.0
20 Bangalore 0.0 1.7 1.5
21 Bangalore Rural 19.0 0.0 15.7
22 Mandya 18.9 4.1 16.4
23 Hassan 11.3 13.9 11.6
24 Dakshina Kannada 1.5 1.9 1.6
25 Kodagu 1.2 2.8 1.5
26 Mysore 20.7 7.0 15.5
27 Chamarajanagar 1.3 4.1 1.6
28 Ramanagar 11.7 4.5 10.5
Total 24.5 15.3 21.2
Source: Draft MDG Report, Government of Karnataka

144
Annexure 5
Table A5. 1: District-wise child sex ratio (0-6 years)
District 2001 2011
Belgaum 921 934
Bijapur 928 931
Gulbarga 931 943
Mandya 934 939
Bengaluru Rural 939 951
Bagalkot 940 935
Bidar 941 942
Bengaluru Urban 943 944
Dharwad 943 944
Ramanagara 945 962
Chitradurga 946 947
Davanagere 946 948
Uttara Kannada 946 955
Bellary 947 960
Tumkur 949 959
Chikkaballapura 952 953
Dakshin Kannada 952 948
Gadag 952 947
Koppal 953 958
Shimoga 956 960
Haveri 957 946
Hassan 958 973
Udupi 958 958
Chikmangalur 959 969
Mysore 962 961
Chamarajanagar 964 953
Raichur 964 950
Kolar 965 962
Kodagu 977 978
Yadagiri 951
Source: Census, 2001 and Census, 2011
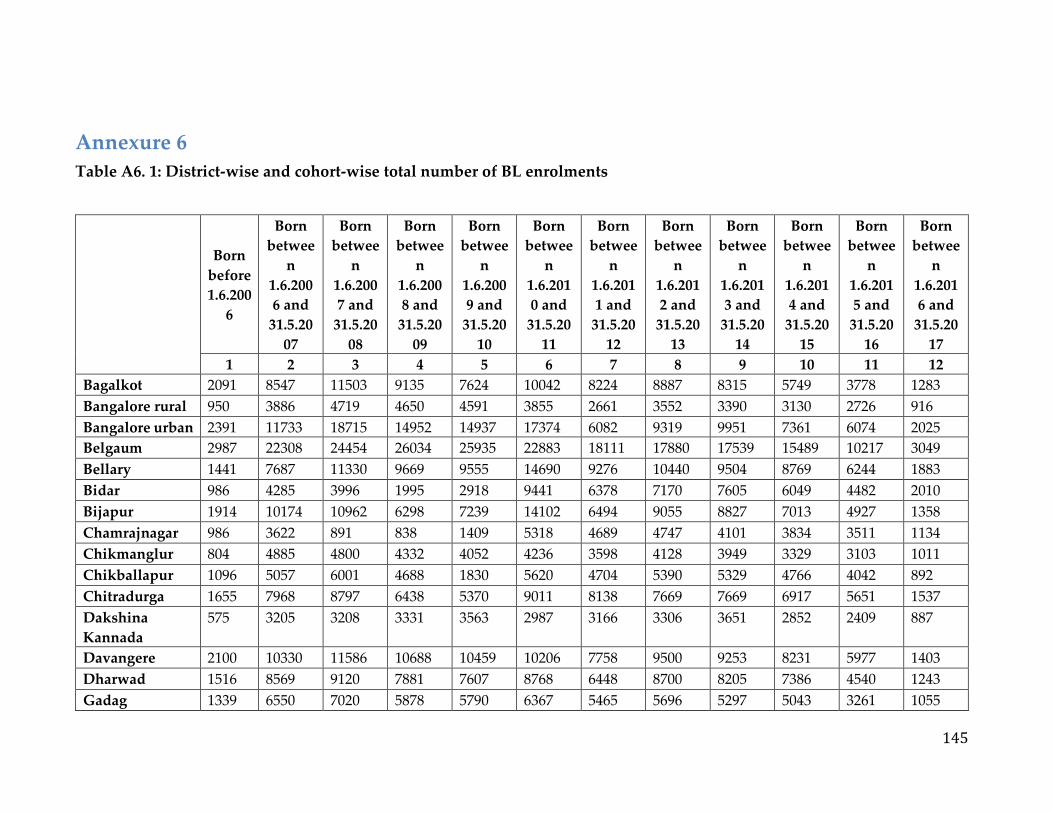
145
Annexure 6
Table A6. 1: District-wise and cohort-wise total number of BL enrolments
Born
before
1.6.200
6
Born
betwee
n
1.6.200
6 and
31.5.20
07
Born
betwee
n
1.6.200
7 and
31.5.20
08
Born
betwee
n
1.6.200
8 and
31.5.20
09
Born
betwee
n
1.6.200
9 and
31.5.20
10
Born
betwee
n
1.6.201
0 and
31.5.20
11
Born
betwee
n
1.6.201
1 and
31.5.20
12
Born
betwee
n
1.6.201
2 and
31.5.20
13
Born
betwee
n
1.6.201
3 and
31.5.20
14
Born
betwee
n
1.6.201
4 and
31.5.20
15
Born
betwee
n
1.6.201
5 and
31.5.20
16
Born
betwee
n
1.6.201
6 and
31.5.20
17
1 2 3 4 5 6 7 8 9 10 11 12
Bagalkot 2091 8547 11503 9135 7624 10042 8224 8887 8315 5749 3778 1283
Bangalore rural 950 3886 4719 4650 4591 3855 2661 3552 3390 3130 2726 916
Bangalore urban 2391 11733 18715 14952 14937 17374 6082 9319 9951 7361 6074 2025
Belgaum 2987 22308 24454 26034 25935 22883 18111 17880 17539 15489 10217 3049
Bellary 1441 7687 11330 9669 9555 14690 9276 10440 9504 8769 6244 1883
Bidar 986 4285 3996 1995 2918 9441 6378 7170 7605 6049 4482 2010
Bijapur 1914 10174 10962 6298 7239 14102 6494 9055 8827 7013 4927 1358
Chamrajnagar 986 3622 891 838 1409 5318 4689 4747 4101 3834 3511 1134
Chikmanglur 804 4885 4800 4332 4052 4236 3598 4128 3949 3329 3103 1011
Chikballapur 1096 5057 6001 4688 1830 5620 4704 5390 5329 4766 4042 892
Chitradurga 1655 7968 8797 6438 5370 9011 8138 7669 7669 6917 5651 1537
Dakshina
Kannada
575 3205 3208 3331 3563 2987 3166 3306 3651 2852 2409 887
Davangere 2100 10330 11586 10688 10459 10206 7758 9500 9253 8231 5977 1403
Dharwad 1516 8569 9120 7881 7607 8768 6448 8700 8205 7386 4540 1243
Gadag 1339 6550 7020 5878 5790 6367 5465 5696 5297 5043 3261 1055

146
Source: Computed from enrolment data provided by WCD
Table A6. 2: District-wise percentage of total children who had immunisation
Born
before
1.6.200
6
Born
betwee
n
1.6.200
6 and
31.5.20
07
Born
betwee
n
1.6.200
7 and
31.5.20
08
Born
betwee
n
1.6.200
8 and
31.5.20
09
Born
betwee
n
1.6.200
9 and
31.5.20
10
Born
betwee
n
1.6.201
0 and
31.5.20
11
Born
betwee
n
1.6.201
1 and
31.5.20
12
Born
betwee
n
1.6.201
2 and
31.5.20
13
Born
betwee
n
1.6.201
3 and
31.5.20
14
Born
betwee
n
1.6.201
4 and
31.5.20
15
Born
betwee
n
1.6.201
5 and
31.5.20
16
Born
betwee
n
1.6.201
6 and
31.5.20
17 1 2 3 4 5 6 7 8 9 10 11 12
Bagalkot 52.8% 40.1% 19.8% 5.0% 1.6% 1.6% 0.9% 0.0% 0.0% 0.00% 0.00% 0.00%
Bangalore rural 41.8% 33.7% 22.4% 12.6% 11.4% 9.5% 2.9% 0.7% 0.1% 0.00% 0.00% 0.00%
Bangalore urban 27.9% 20.0% 6.7% 2.5% 1.3% 1.6% 1.0% 0.5% 0.6% 0.64% 0.07% 0.00%
Gulbarga 2094 9959 12575 11939 12430 14955 8734 11955 10976 9785 5635 1283
Hassan 1216 6913 7706 4486 3956 7479 6387 7526 6999 5849 5598 2082
Haveri 1766 9394 10360 8849 8729 9227 7071 9095 8961 7638 4926 1315
Kodagu 214 1431 1787 2057 1813 1361 1023 1315 1246 874 766 196
Kolar 1003 5045 6577 5730 3980 6507 4954 5871 5841 4917 4249 1088
Koppal 1042 5123 7835 9485 8630 8573 5325 6859 6553 4925 3678 1075
Mandya 1528 8820 9824 9287 7713 8687 7092 8243 7856 6921 5783 1616
Mysore 2087 11481 12652 10012 7475 12410 10592 10895 9763 8745 7406 1460
Raichur 1924 7649 8232 6451 5481 10287 7041 8372 8716 7847 5627 1527
Ramnagara 1022 4672 5158 4551 4469 4160 3269 4083 4383 3799 2681 0
Shimoga 1408 7623 9138 9163 9544 7109 5781 6813 6958 5931 4826 1419
Tumkur 2477 13527 15430 15651 14689 12211 9419 11175 11062 10321 8561 3171
Udupi 637 3328 3599 4173 3771 2969 2542 2784 3272 2958 3064 1075
Uttara Kannada 1129 5715 5910 5528 5167 5606 5140 5795 5970 5493 4138 1471
Yadagiri 1098 5112 6714 6817 4976 7914 4922 6240 5057 3848 2817 1001
TOTAL 43476 224598 260599 230986 215702 264355 190484 222460 216198 185769 140697 41465

147
Born
before
1.6.200
6
Born
betwee
n
1.6.200
6 and
31.5.20
07
Born
betwee
n
1.6.200
7 and
31.5.20
08
Born
betwee
n
1.6.200
8 and
31.5.20
09
Born
betwee
n
1.6.200
9 and
31.5.20
10
Born
betwee
n
1.6.201
0 and
31.5.20
11
Born
betwee
n
1.6.201
1 and
31.5.20
12
Born
betwee
n
1.6.201
2 and
31.5.20
13
Born
betwee
n
1.6.201
3 and
31.5.20
14
Born
betwee
n
1.6.201
4 and
31.5.20
15
Born
betwee
n
1.6.201
5 and
31.5.20
16
Born
betwee
n
1.6.201
6 and
31.5.20
17 1 2 3 4 5 6 7 8 9 10 11 12
Belgaum 84.2% 80.3% 70.1% 56.3% 57.5% 41.8% 23.3% 6.6% 3.6% 1.49% 0.08% 0.00%
Bellary 12.1% 10.0% 5.8% 2.5% 2.6% 1.5% 0.9% 0.1% 0.1% 0.05% 0.00% 0.00%
Bidar 9.7% 8.9% 10.8% 19.5% 11.8% 4.0% 5.0% 7.3% 1.0% 0.00% 0.00% 0.00%
Bijapur 25.7% 20.9% 9.8% 5.7% 4.4% 2.0% 1.1% 0.3% 0.1% 0.09% 0.00% 0.00%
Chamrajnagar 75.4% 73.8% 32.1% 5.4% 0.2% 0.0% 0.0% 0.0% 0.0% 0.00% 0.00% 0.00%
Chikmanglur 40.0% 36.3% 10.1% 0.6% 0.0% 0.1% 0.0% 0.0% 0.0% 0.00% 0.00% 0.00%
Chikballapur 21.8% 15.4% 5.9% 1.3% 0.3% 0.0% 0.0% 0.0% 0.0% 0.00% 0.00% 0.00%
Chitradurga 51.6% 44.8% 22.9% 8.2% 17.9% 22.8% 16.5% 12.8% 13.7% 11.80% 9.13% 9.89%
Dakshina
Kannada
86.1% 82.5% 61.5% 37.3% 27.8% 25.3% 20.6% 4.7% 1.3% 0.25% 0.25% 1.35%
Davangere 63.9% 59.9% 51.8% 30.3% 26.9% 18.8% 13.7% 9.4% 8.0% 4.58% 0.45% 0.00%
Dharwad 61.0% 56.2% 41.7% 31.2% 30.4% 24.3% 19.4% 7.6% 4.4% 2.41% 0.37% 0.00%
Gadag 55.5% 45.1% 7.7% 0.6% 0.2% 0.0% 0.0% 0.0% 0.0% 0.00% 0.00% 0.00%
Gulbarga 39.8% 33.2% 19.0% 9.9% 13.3% 8.1% 4.9% 0.8% 0.2% 0.01% 0.00% 0.00%
Hassan 4.8% 4.2% 2.9% 1.7% 1.6% 0.7% 1.1% 1.3% 2.0% 3.86% 0.95% 0.05%
Haveri 72.0% 59.2% 18.2% 5.4% 5.1% 2.6% 1.4% 0.1% 0.0% 0.00% 0.00% 0.00%
Kodagu 44.4% 41.7% 37.3% 19.4% 20.8% 18.0% 12.8% 11.2% 9.9% 3.32% 0.00% 0.00%
Kolar 10.9% 11.6% 9.6% 3.6% 3.8% 4.2% 3.7% 2.6% 3.0% 0.49% 0.00% 0.00%
Koppal 40.1% 33.6% 24.0% 7.4% 4.9% 3.8% 3.0% 2.2% 3.2% 2.29% 0.82% 1.30%
Mandya 48.2% 45.5% 35.8% 22.7% 24.8% 15.8% 11.9% 6.8% 0.9% 0.00% 0.62% 0.00%
Mysore 29.8% 25.5% 13.1% 5.1% 4.7% 1.2% 0.9% 0.1% 0.0% 0.00% 0.15% 0.14%
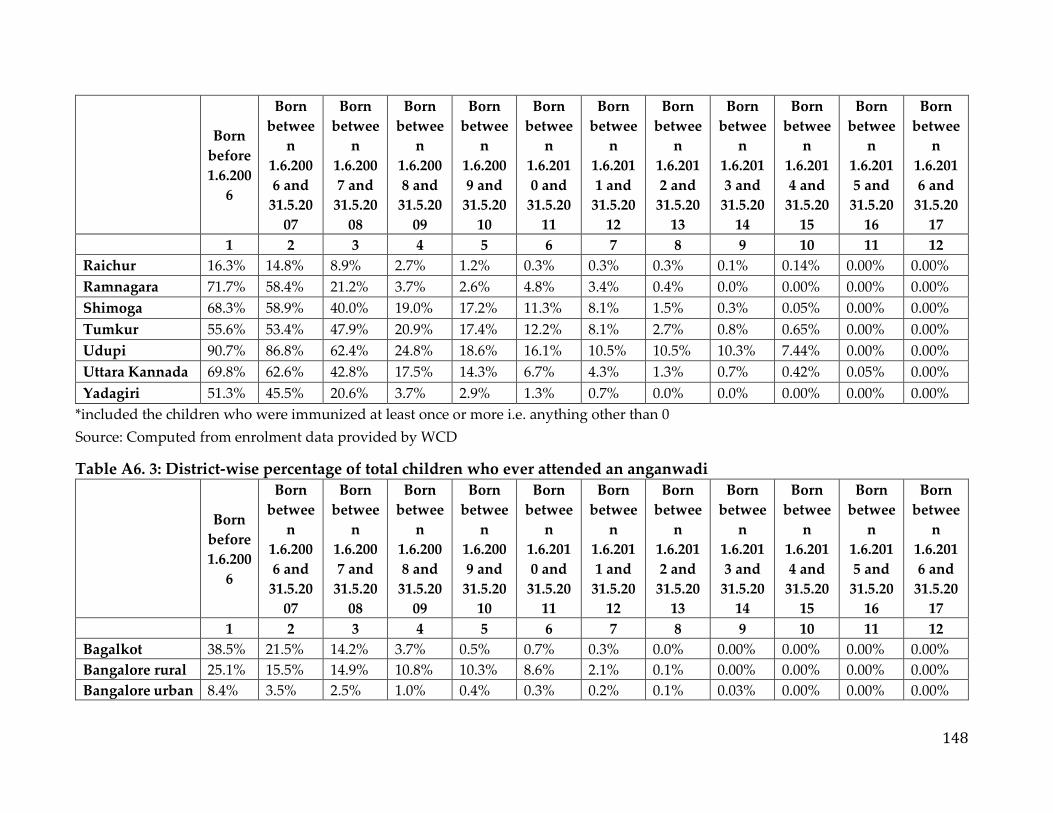
148
Born
before
1.6.200
6
Born
betwee
n
1.6.200
6 and
31.5.20
07
Born
betwee
n
1.6.200
7 and
31.5.20
08
Born
betwee
n
1.6.200
8 and
31.5.20
09
Born
betwee
n
1.6.200
9 and
31.5.20
10
Born
betwee
n
1.6.201
0 and
31.5.20
11
Born
betwee
n
1.6.201
1 and
31.5.20
12
Born
betwee
n
1.6.201
2 and
31.5.20
13
Born
betwee
n
1.6.201
3 and
31.5.20
14
Born
betwee
n
1.6.201
4 and
31.5.20
15
Born
betwee
n
1.6.201
5 and
31.5.20
16
Born
betwee
n
1.6.201
6 and
31.5.20
17 1 2 3 4 5 6 7 8 9 10 11 12
Raichur 16.3% 14.8% 8.9% 2.7% 1.2% 0.3% 0.3% 0.3% 0.1% 0.14% 0.00% 0.00%
Ramnagara 71.7% 58.4% 21.2% 3.7% 2.6% 4.8% 3.4% 0.4% 0.0% 0.00% 0.00% 0.00%
Shimoga 68.3% 58.9% 40.0% 19.0% 17.2% 11.3% 8.1% 1.5% 0.3% 0.05% 0.00% 0.00%
Tumkur 55.6% 53.4% 47.9% 20.9% 17.4% 12.2% 8.1% 2.7% 0.8% 0.65% 0.00% 0.00%
Udupi 90.7% 86.8% 62.4% 24.8% 18.6% 16.1% 10.5% 10.5% 10.3% 7.44% 0.00% 0.00%
Uttara Kannada 69.8% 62.6% 42.8% 17.5% 14.3% 6.7% 4.3% 1.3% 0.7% 0.42% 0.05% 0.00%
Yadagiri 51.3% 45.5% 20.6% 3.7% 2.9% 1.3% 0.7% 0.0% 0.0% 0.00% 0.00% 0.00%
*included the children who were immunized at least once or more i.e. anything other than 0
Source: Computed from enrolment data provided by WCD
Table A6. 3: District-wise percentage of total children who ever attended an anganwadi
Born
before
1.6.200
6
Born
betwee
n
1.6.200
6 and
31.5.20
07
Born
betwee
n
1.6.200
7 and
31.5.20
08
Born
betwee
n
1.6.200
8 and
31.5.20
09
Born
betwee
n
1.6.200
9 and
31.5.20
10
Born
betwee
n
1.6.201
0 and
31.5.20
11
Born
betwee
n
1.6.201
1 and
31.5.20
12
Born
betwee
n
1.6.201
2 and
31.5.20
13
Born
betwee
n
1.6.201
3 and
31.5.20
14
Born
betwee
n
1.6.201
4 and
31.5.20
15
Born
betwee
n
1.6.201
5 and
31.5.20
16
Born
betwee
n
1.6.201
6 and
31.5.20
17 1 2 3 4 5 6 7 8 9 10 11 12
Bagalkot 38.5% 21.5% 14.2% 3.7% 0.5% 0.7% 0.3% 0.0% 0.00% 0.00% 0.00% 0.00%
Bangalore rural 25.1% 15.5% 14.9% 10.8% 10.3% 8.6% 2.1% 0.1% 0.00% 0.00% 0.00% 0.00%
Bangalore urban 8.4% 3.5% 2.5% 1.0% 0.4% 0.3% 0.2% 0.1% 0.03% 0.00% 0.00% 0.00%
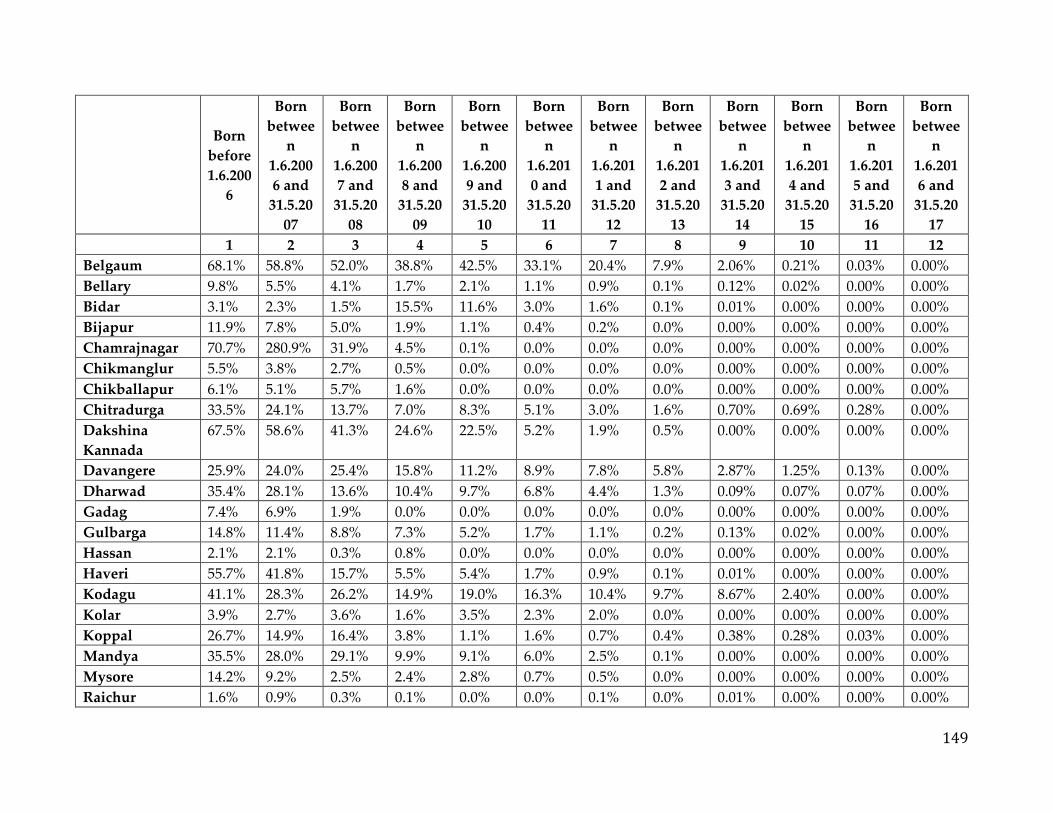
149
Born
before
1.6.200
6
Born
betwee
n
1.6.200
6 and
31.5.20
07
Born
betwee
n
1.6.200
7 and
31.5.20
08
Born
betwee
n
1.6.200
8 and
31.5.20
09
Born
betwee
n
1.6.200
9 and
31.5.20
10
Born
betwee
n
1.6.201
0 and
31.5.20
11
Born
betwee
n
1.6.201
1 and
31.5.20
12
Born
betwee
n
1.6.201
2 and
31.5.20
13
Born
betwee
n
1.6.201
3 and
31.5.20
14
Born
betwee
n
1.6.201
4 and
31.5.20
15
Born
betwee
n
1.6.201
5 and
31.5.20
16
Born
betwee
n
1.6.201
6 and
31.5.20
17 1 2 3 4 5 6 7 8 9 10 11 12
Belgaum 68.1% 58.8% 52.0% 38.8% 42.5% 33.1% 20.4% 7.9% 2.06% 0.21% 0.03% 0.00%
Bellary 9.8% 5.5% 4.1% 1.7% 2.1% 1.1% 0.9% 0.1% 0.12% 0.02% 0.00% 0.00%
Bidar 3.1% 2.3% 1.5% 15.5% 11.6% 3.0% 1.6% 0.1% 0.01% 0.00% 0.00% 0.00%
Bijapur 11.9% 7.8% 5.0% 1.9% 1.1% 0.4% 0.2% 0.0% 0.00% 0.00% 0.00% 0.00%
Chamrajnagar 70.7% 280.9% 31.9% 4.5% 0.1% 0.0% 0.0% 0.0% 0.00% 0.00% 0.00% 0.00%
Chikmanglur 5.5% 3.8% 2.7% 0.5% 0.0% 0.0% 0.0% 0.0% 0.00% 0.00% 0.00% 0.00%
Chikballapur 6.1% 5.1% 5.7% 1.6% 0.0% 0.0% 0.0% 0.0% 0.00% 0.00% 0.00% 0.00%
Chitradurga 33.5% 24.1% 13.7% 7.0% 8.3% 5.1% 3.0% 1.6% 0.70% 0.69% 0.28% 0.00%
Dakshina
Kannada
67.5% 58.6% 41.3% 24.6% 22.5% 5.2% 1.9% 0.5% 0.00% 0.00% 0.00% 0.00%
Davangere 25.9% 24.0% 25.4% 15.8% 11.2% 8.9% 7.8% 5.8% 2.87% 1.25% 0.13% 0.00%
Dharwad 35.4% 28.1% 13.6% 10.4% 9.7% 6.8% 4.4% 1.3% 0.09% 0.07% 0.07% 0.00%
Gadag 7.4% 6.9% 1.9% 0.0% 0.0% 0.0% 0.0% 0.0% 0.00% 0.00% 0.00% 0.00%
Gulbarga 14.8% 11.4% 8.8% 7.3% 5.2% 1.7% 1.1% 0.2% 0.13% 0.02% 0.00% 0.00%
Hassan 2.1% 2.1% 0.3% 0.8% 0.0% 0.0% 0.0% 0.0% 0.00% 0.00% 0.00% 0.00%
Haveri 55.7% 41.8% 15.7% 5.5% 5.4% 1.7% 0.9% 0.1% 0.01% 0.00% 0.00% 0.00%
Kodagu 41.1% 28.3% 26.2% 14.9% 19.0% 16.3% 10.4% 9.7% 8.67% 2.40% 0.00% 0.00%
Kolar 3.9% 2.7% 3.6% 1.6% 3.5% 2.3% 2.0% 0.0% 0.00% 0.00% 0.00% 0.00%
Koppal 26.7% 14.9% 16.4% 3.8% 1.1% 1.6% 0.7% 0.4% 0.38% 0.28% 0.03% 0.00%
Mandya 35.5% 28.0% 29.1% 9.9% 9.1% 6.0% 2.5% 0.1% 0.00% 0.00% 0.00% 0.00%
Mysore 14.2% 9.2% 2.5% 2.4% 2.8% 0.7% 0.5% 0.0% 0.00% 0.00% 0.00% 0.00%
Raichur 1.6% 0.9% 0.3% 0.1% 0.0% 0.0% 0.1% 0.0% 0.01% 0.00% 0.00% 0.00%
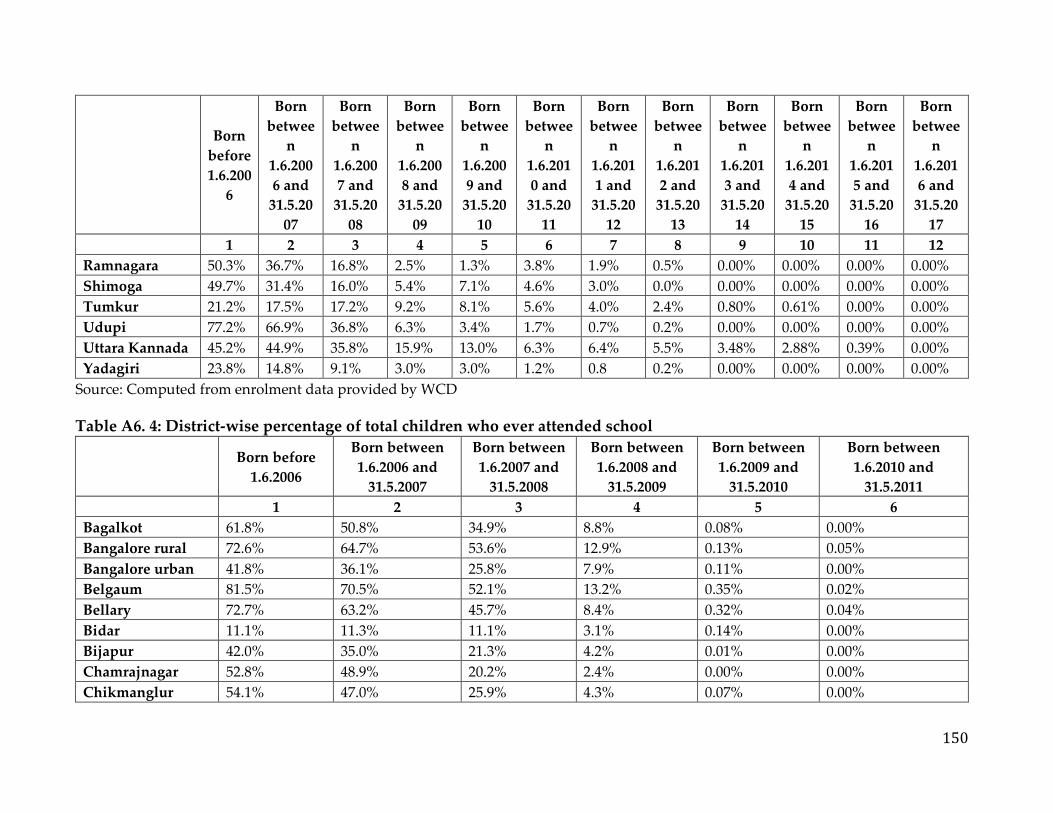
150
Born
before
1.6.200
6
Born
betwee
n
1.6.200
6 and
31.5.20
07
Born
betwee
n
1.6.200
7 and
31.5.20
08
Born
betwee
n
1.6.200
8 and
31.5.20
09
Born
betwee
n
1.6.200
9 and
31.5.20
10
Born
betwee
n
1.6.201
0 and
31.5.20
11
Born
betwee
n
1.6.201
1 and
31.5.20
12
Born
betwee
n
1.6.201
2 and
31.5.20
13
Born
betwee
n
1.6.201
3 and
31.5.20
14
Born
betwee
n
1.6.201
4 and
31.5.20
15
Born
betwee
n
1.6.201
5 and
31.5.20
16
Born
betwee
n
1.6.201
6 and
31.5.20
17 1 2 3 4 5 6 7 8 9 10 11 12
Ramnagara 50.3% 36.7% 16.8% 2.5% 1.3% 3.8% 1.9% 0.5% 0.00% 0.00% 0.00% 0.00%
Shimoga 49.7% 31.4% 16.0% 5.4% 7.1% 4.6% 3.0% 0.0% 0.00% 0.00% 0.00% 0.00%
Tumkur 21.2% 17.5% 17.2% 9.2% 8.1% 5.6% 4.0% 2.4% 0.80% 0.61% 0.00% 0.00%
Udupi 77.2% 66.9% 36.8% 6.3% 3.4% 1.7% 0.7% 0.2% 0.00% 0.00% 0.00% 0.00%
Uttara Kannada 45.2% 44.9% 35.8% 15.9% 13.0% 6.3% 6.4% 5.5% 3.48% 2.88% 0.39% 0.00%
Yadagiri 23.8% 14.8% 9.1% 3.0% 3.0% 1.2% 0.8 0.2% 0.00% 0.00% 0.00% 0.00%
Source: Computed from enrolment data provided by WCD
Table A6. 4: District-wise percentage of total children who ever attended school
Born before
1.6.2006
Born between
1.6.2006 and
31.5.2007
Born between
1.6.2007 and
31.5.2008
Born between
1.6.2008 and
31.5.2009
Born between
1.6.2009 and
31.5.2010
Born between
1.6.2010 and
31.5.2011 1 2 3 4 5 6
Bagalkot 61.8% 50.8% 34.9% 8.8% 0.08% 0.00%
Bangalore rural 72.6% 64.7% 53.6% 12.9% 0.13% 0.05%
Bangalore urban 41.8% 36.1% 25.8% 7.9% 0.11% 0.00%
Belgaum 81.5% 70.5% 52.1% 13.2% 0.35% 0.02%
Bellary 72.7% 63.2% 45.7% 8.4% 0.32% 0.04%
Bidar 11.1% 11.3% 11.1% 3.1% 0.14% 0.00%
Bijapur 42.0% 35.0% 21.3% 4.2% 0.01% 0.00%
Chamrajnagar 52.8% 48.9% 20.2% 2.4% 0.00% 0.00%
Chikmanglur 54.1% 47.0% 25.9% 4.3% 0.07% 0.00%

151
Born before
1.6.2006
Born between
1.6.2006 and
31.5.2007
Born between
1.6.2007 and
31.5.2008
Born between
1.6.2008 and
31.5.2009
Born between
1.6.2009 and
31.5.2010
Born between
1.6.2010 and
31.5.2011 1 2 3 4 5 6
Chikballapur 51.4% 44.8% 28.4% 6.5% 0.11% 0.00%
Chitradurga 67.4% 61.8% 38.8% 6.9% 0.02% 0.00%
Dakshina Kannada 95.0% 94.4% 86.3% 14.7% 0.06% 0.00%
Davangere 70.2% 63.5% 46.1% 7.4% 0.15% 0.00%
Dharwad 77.4% 71.4% 55.8% 9.1% 0.13% 0.01%
Gadag 75.4% 70.0% 55.8% 9.0% 0.03% 0.00%
Gulbarga 35.9% 32.3% 19.7% 3.6% 0.39% 0.04%
Hassan 61.8% 50.5% 25.3% 4.7% 0.08% 0.00%
Haveri 80.9% 74.3% 57.5% 8.6% 0.11% 0.00%
Kodagu 79.4% 72.7% 60.3% 8.4% 0.06% 0.00%
Kolar 33.2% 29.2% 17.4% 3.1% 0.05% 0.00%
Koppal 71.9% 66.1% 52.7% 7.7% 0.01% 0.00%
Mandya 60.1% 52.3% 37.9% 6.5% 0.18% 0.00%
Mysore 58.3% 48.8% 28.8% 5.3% 0.09% 0.00%
Raichur 32.1% 28.4% 21.0% 4.1% 0.11% 0.01%
Ramnagara 67.7% 52.9% 19.0% 2.9% 0.00% 0.02%
Shimoga 88.8% 78.0% 54.3% 7.5% 0.01% 0.00%
Tumkur 72.5% 64.4% 50.6% 8.2% 0.11% 0.00%
Udupi 96.1% 92.5% 82.6% 11.3% 0.03% 0.00%
Uttara Kannada 88.5% 83.5% 65.3% 10.5% 0.02% 0.00%
Yadagiri 39.9% 26.8% 9.7% 2.3% 0.12% 0.00%
Source: Computed from enrolment data provided by WCD
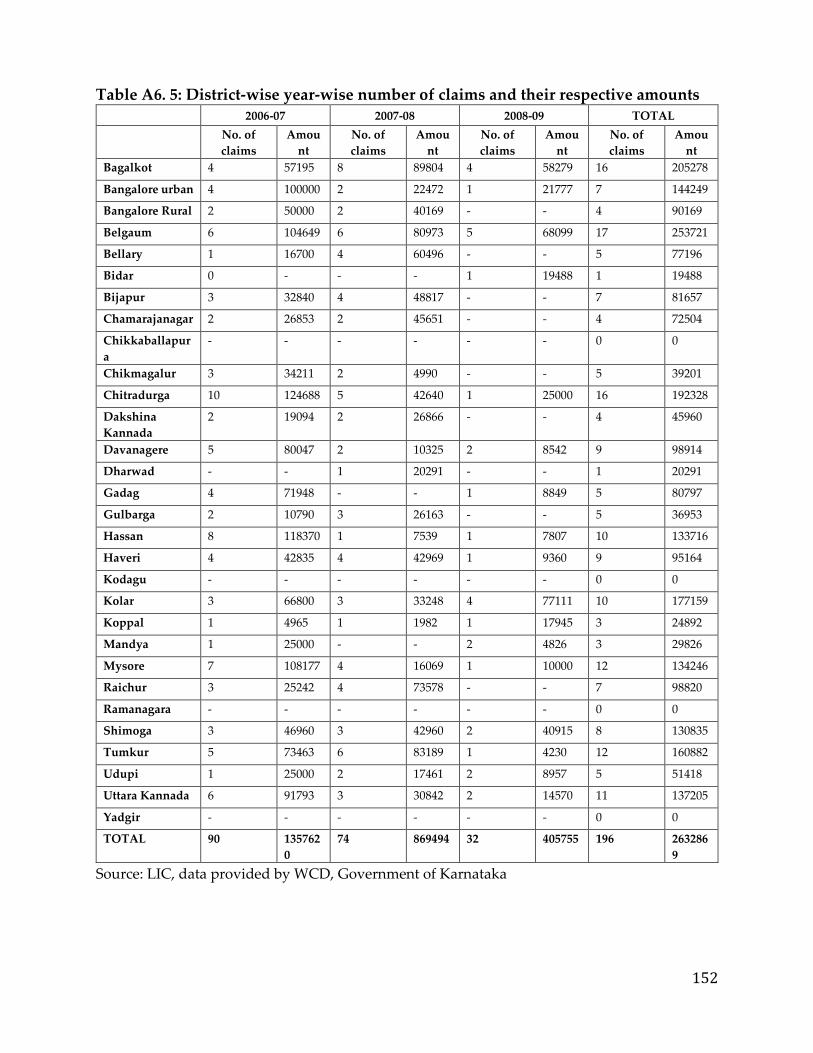
152
Table A6. 5: District-wise year-wise number of claims and their respective amounts 2006-07 2007-08 2008-09 TOTAL
No. of
claims
Amou
nt
No. of
claims
Amou
nt
No. of
claims
Amou
nt
No. of
claims
Amou
nt
Bagalkot 4 57195 8 89804 4 58279 16 205278
Bangalore urban 4 100000 2 22472 1 21777 7 144249
Bangalore Rural 2 50000 2 40169 - - 4 90169
Belgaum 6 104649 6 80973 5 68099 17 253721
Bellary 1 16700 4 60496 - - 5 77196
Bidar 0 - - - 1 19488 1 19488
Bijapur 3 32840 4 48817 - - 7 81657
Chamarajanagar 2 26853 2 45651 - - 4 72504
Chikkaballapur
a
- - - - - - 0 0
Chikmagalur 3 34211 2 4990 - - 5 39201
Chitradurga 10 124688 5 42640 1 25000 16 192328
Dakshina
Kannada
2 19094 2 26866 - - 4 45960
Davanagere 5 80047 2 10325 2 8542 9 98914
Dharwad - - 1 20291 - - 1 20291
Gadag 4 71948 - - 1 8849 5 80797
Gulbarga 2 10790 3 26163 - - 5 36953
Hassan 8 118370 1 7539 1 7807 10 133716
Haveri 4 42835 4 42969 1 9360 9 95164
Kodagu - - - - - - 0 0
Kolar 3 66800 3 33248 4 77111 10 177159
Koppal 1 4965 1 1982 1 17945 3 24892
Mandya 1 25000 - - 2 4826 3 29826
Mysore 7 108177 4 16069 1 10000 12 134246
Raichur 3 25242 4 73578 - - 7 98820
Ramanagara - - - - - - 0 0
Shimoga 3 46960 3 42960 2 40915 8 130835
Tumkur 5 73463 6 83189 1 4230 12 160882
Udupi 1 25000 2 17461 2 8957 5 51418
Uttara Kannada 6 91793 3 30842 2 14570 11 137205
Yadgir - - - - - - 0 0
TOTAL 90 135762
0
74 869494 32 405755 196 263286
9
Source: LIC, data provided by WCD, Government of Karnataka

153
Table A6. 6: Year-wise number of claims on parents’ deaths, accidents and disabilities
District
2006-07 2007-08 2008-09 2008-
09(II) 2009-10 2010-11 2011-12 2012-13 2013-14 Total
N
o
Amo
unt
N
o
Amo
unt
N
o
Amo
unt
N
o
Amo
unt
N
o
Amo
unt
N
o
Amo
unt
N
o
Amo
unt
N
o
Amo
unt
N
o
Amo
unt No
Amo
unt
Bagalkot 17
3
7655
000
17
1
75550
00 76
3435
000 51
1620
000 66
2115
000 48
1575
000
3
2
1050
000
1
1
3300
00 1
3000
0
62
9
25365
000
Bangalore
urban
12
0
5445
000
14
2
62800
00 52
2282
500 44
1365
000 58
1830
000 46
1380
000 6
1800
00
1
1
3300
00 4
1200
00
48
3
19212
500
Bangalore
Rural
17
4
7812
500
16
4
73750
00 80
3432
500 67
2145
000 24
7200
00 12
4050
00 4
1200
00 3
9000
0 2
6000
0
53
0
22160
000
Belgaum 31
6
1409
2500
31
2
14052
500
13
2
6000
000
15
7
4935
000
16
5
5085
000
14
1
4365
000
5
1
1575
000
2
6
7800
00 8
2400
00
13
08
51125
000
Bellary 13
0
5655
000
16
3
69275
00 76
3230
000 52
1560
000 76
2280
000 51
1575
000
1
7
5550
00
1
2
3600
00 1
3000
0
57
8
22172
500
Bidar 44 2042
500 33
14600
00 14
6525
00 6
1800
00 17
5100
00 7
2100
00 3
9000
0 0 0 0 0
12
4
51450
00
Bijapur 70 3032
500 85
38575
00 29
1290
000 42
1350
000 34
1065
000 26
7800
00 6
1800
00 4
1200
00 1
3000
0
29
7
11705
000
Chamaraja
nagar 71
3017
500 59
25650
00 29
1290
000 26
8250
00 28
8850
00 30
9000
00
2
4
7200
00
1
3
3900
00 6
1800
00
28
6
10772
500
Chikkaball
apura
10
0
4495
000 63
29075
00 26
1105
000 22
6600
00 38
1230
000 27
8550
00
1
5
4500
00 7
2100
00 4
1200
00
30
2
12032
500
Chikmagal
ur
13
8
6267
500
16
4
74450
00 56
2567
500 66
2160
000 78
2520
000 53
1635
000
3
4
1110
000
1
8
5400
00 3
9000
0
61
0
24335
000
Chitradurg
a 80
3472
500 54
23825
00 20
8225
00 19
5700
00 25
9300
00 17
5550
00
1
4
4200
00 5
1500
00 5
1500
00
23
9
94525
00
Dakshina
Kannada
15
7
7075
000
14
8
67800
00 50
2125
000 65
1950
000 70
2280
000 46
1425
000
2
0
6450
00
1
7
5550
00 5
1500
00
57
8
22985
000

154
District
2006-07 2007-08 2008-09 2008-
09(II) 2009-10 2010-11 2011-12 2012-13 2013-14 Total
N
o
Amo
unt
N
o
Amo
unt
N
o
Amo
unt
N
o
Amo
unt
N
o
Amo
unt
N
o
Amo
unt
N
o
Amo
unt
N
o
Amo
unt
N
o
Amo
unt No
Amo
unt
Davanager
e
15
2
6590
000
12
3
53425
00 40
1757
500 39
1170
000 68
2130
000 54
1755
000
1
9
6600
00
2
1
6750
00 4
1200
00
52
0
20200
000
Dharwad 16
5
7127
500
14
3
61925
00 46
2012
500 51
1530
000 64
1920
000 33
1080
000
1
8
5850
00 8
2850
00 1
3000
0
52
9
20762
500
Gadag 17
8
7695
000
19
1
82325
00 82
3542
500
11
6
3480
000
10
0
3090
000 42
1260
000
1
4
4200
00
1
2
3600
00 1
3000
0
73
6
28110
000
Gulbarga 10
5
4952
500 95
46700
00 33
1517
500 34
1110
000 51
1620
000 31
1155
000
1
5
5400
00 8
2400
00 2
6000
0
37
4
15865
000
Hassan 16
5
7387
500
14
9
67350
00 63
2792
500 64
2010
000 53
1725
000 49
1560
000
1
8
5400
00
1
6
4800
00 3
9000
0
58
0
23320
000
Haveri 32 1647
500 23
10350
00 18
8550
00 7
2550
00 10
3000
00 5
1500
00 4
1200
00 4
1200
00 0 0
10
3
44825
00
Kodagu 13
1
5870
000
11
8
53325
00 53
2325
000 46
1380
000 16
4800
00 18
5850
00 8
2400
00 6
1800
00 1
3000
0
39
7
16422
500
Kolar 76 3402
500
16
3
67900
00 61
2707
500 63
1890
000 82
2550
000 44
1320
000
1
7
5100
00
1
0
3000
00 0 0
51
6
19470
000
Koppal 19
8
8602
500
21
0
93275
00 90
3882
500 80
2490
000
10
8
3375
000 73
2235
000
4
3
1335
000
2
5
7950
00
1
2
3600
00
83
9
32402
500
Mandya 21
7
2937
500
20
4
90725
00 87
3755
000 90
2700
000
11
4
3510
000 72
2160
000
3
6
1125
000
1
4
4200
00 5
1500
00
83
9
25830
000
Mysore 98 5122
500
11
2
47600
00 38
1615
000 45
2790
00 63
1935
000 34
1020
000
1
0
3900
00 8
2400
00 0 0
40
8
15361
500
Raichur 16
9
7412
500
15
6
68600
00 61
2780
000 56
1770
000 76
2325
000 31
9300
00
2
2
7050
00
1
7
5100
00 6
2250
00
59
4
23517
500
Ramanagar
a
26
5
1219
7500
23
2
10607
500 88
3912
500 72
2385
000
11
1
3645
000 61
2010
000
2
5
7500
00
1
7
5100
00 7
2100
00
87
8
36227
500
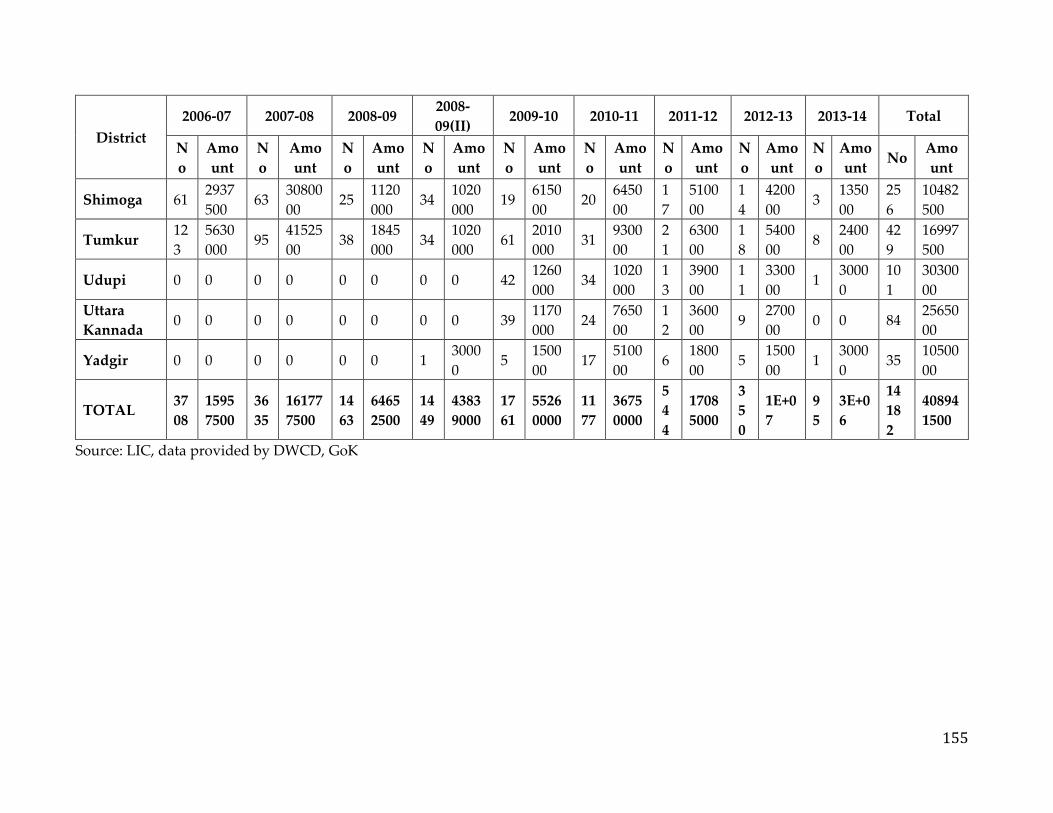
155
District
2006-07 2007-08 2008-09 2008-
09(II) 2009-10 2010-11 2011-12 2012-13 2013-14 Total
N
o
Amo
unt
N
o
Amo
unt
N
o
Amo
unt
N
o
Amo
unt
N
o
Amo
unt
N
o
Amo
unt
N
o
Amo
unt
N
o
Amo
unt
N
o
Amo
unt No
Amo
unt
Shimoga 61 2937
500 63
30800
00 25
1120
000 34
1020
000 19
6150
00 20
6450
00
1
7
5100
00
1
4
4200
00 3
1350
00
25
6
10482
500
Tumkur 12
3
5630
000 95
41525
00 38
1845
000 34
1020
000 61
2010
000 31
9300
00
2
1
6300
00
1
8
5400
00 8
2400
00
42
9
16997
500
Udupi 0 0 0 0 0 0 0 0 42 1260
000 34
1020
000
1
3
3900
00
1
1
3300
00 1
3000
0
10
1
30300
00
Uttara
Kannada 0 0 0 0 0 0 0 0 39
1170
000 24
7650
00
1
2
3600
00 9
2700
00 0 0 84
25650
00
Yadgir 0 0 0 0 0 0 1 3000
0 5
1500
00 17
5100
00 6
1800
00 5
1500
00 1
3000
0 35
10500
00
TOTAL 37
08
1595
7500
36
35
16177
7500
14
63
6465
2500
14
49
4383
9000
17
61
5526
0000
11
77
3675
0000
5
4
4
1708
5000
3
5
0
1E+0
7
9
5
3E+0
6
14
18
2
40894
1500
Source: LIC, data provided by DWCD, GoK
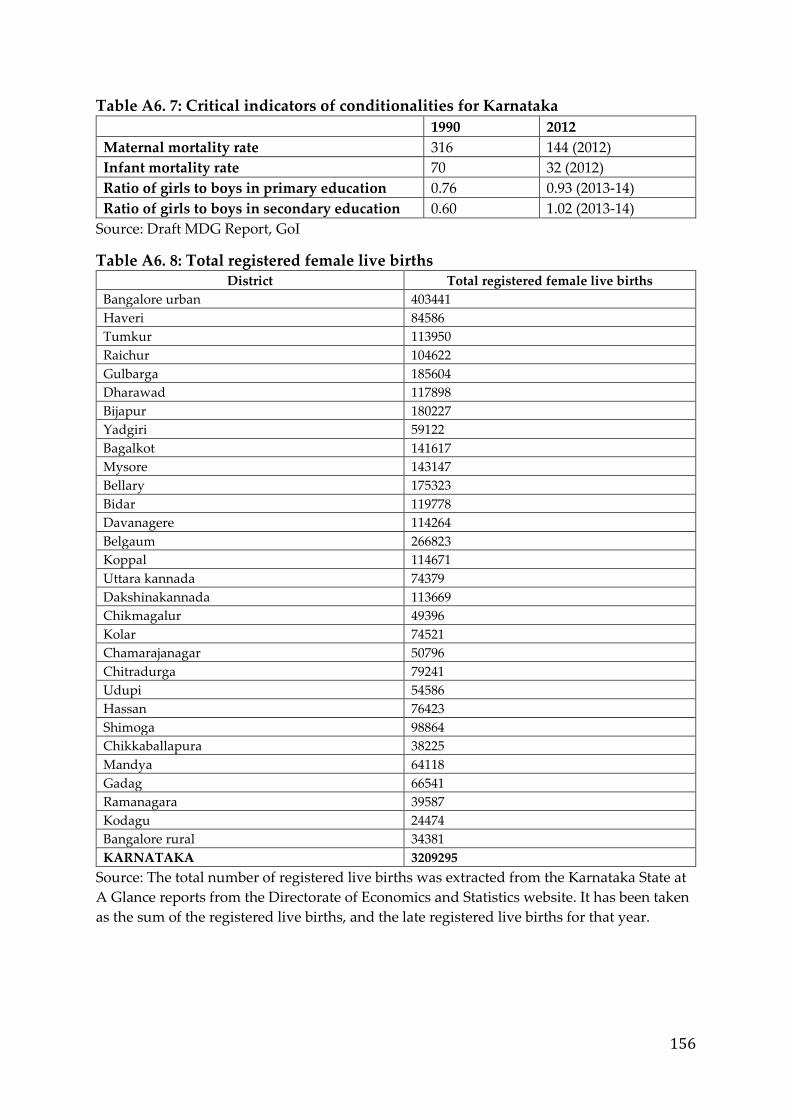
156
Table A6. 7: Critical indicators of conditionalities for Karnataka
1990 2012
Maternal mortality rate 316 144 (2012)
Infant mortality rate 70 32 (2012)
Ratio of girls to boys in primary education 0.76 0.93 (2013-14)
Ratio of girls to boys in secondary education 0.60 1.02 (2013-14)
Source: Draft MDG Report, GoI
Table A6. 8: Total registered female live births District Total registered female live births
Bangalore urban 403441
Haveri 84586
Tumkur 113950
Raichur 104622
Gulbarga 185604
Dharawad 117898
Bijapur 180227
Yadgiri 59122
Bagalkot 141617
Mysore 143147
Bellary 175323
Bidar 119778
Davanagere 114264
Belgaum 266823
Koppal 114671
Uttara kannada 74379
Dakshinakannada 113669
Chikmagalur 49396
Kolar 74521
Chamarajanagar 50796
Chitradurga 79241
Udupi 54586
Hassan 76423
Shimoga 98864
Chikkaballapura 38225
Mandya 64118
Gadag 66541
Ramanagara 39587
Kodagu 24474
Bangalore rural 34381
KARNATAKA 3209295
Source: The total number of registered live births was extracted from the Karnataka State at
A Glance reports from the Directorate of Economics and Statistics website. It has been taken
as the sum of the registered live births, and the late registered live births for that year.

157
Notes

158
Notes

159
Notes

160
Notes

161
Nr. Lodhi Road, Nr. 73, Lodhi Gardens,
Lodhi Estate, New Delhi, Delhi 110003
Tel : +91 011 2469 0401
Maitri Bhavan, Number 4, M.N. Krishna Rao Road,
Basavangudi, Bangalore – 560004
Tel: +91 2656 0735
Fax: +91 2656 0735
Email: [email protected]
Website: www.cbps.in