
Whole genome assembly, annotation and bioinformatics analysis … · Whole genome assembly,...
35
Swedish University of Agricultural Sciences Faculty of Veterinary Medicine and Animal Science Whole genome assembly, annotation and bioinformatics analysis of streptococcus agalactiae isolated from cow suffering of mastitis Saima Zubair Department of Animal Breeding and Genetics Examensarbete 322 Uppsala 2010 Master’s Thesis, 30 HEC One-Year Master’s Programme in Biology – Bioinformatics
-
Upload
phungkhuong -
Category
Documents
-
view
231 -
download
2
Transcript of Whole genome assembly, annotation and bioinformatics analysis … · Whole genome assembly,...
Swedish University of Agricultural Sciences Faculty of Veterinary Medicine and Animal Science
Whole genome assembly, annotation and bioinformatics analysis of streptococcus agalactiae isolated from cow suffering of mastitis Saima Zubair
Department of Animal Breeding and Genetics
Examensarbete 322
Uppsala 2010
Master’s Thesis, 30 HEC
One-Year Master’s Programme in Biology – Bioinformatics

Swedish University of Agricultural Sciences Faculty of Veterinary Medicine and Animal Science Department of Animal Breeding and Genetics
Whole genome assembly, annotation and bioinformatics analysis of streptococcus agalactiae isolated from cow suffering of mastitis Saima Zubair Supervisors: Erik Bongcam-Rudloff, SLU, Department of Animal Breeding and Genetics Hans-Henrik Fuxelius, SLU, Department of Animal Breeding and Genetics Examiner: Göran Andersson, SLU, Department of Animal Breeding and Genetics Credits: 30 HEC Course title: Degree project in Animal Science Course code: BI1021 Programme: One-Year Master’s Programme in Biology
- Bioinformatics Level: Advanced, A2E Place of publication: Uppsala Year of publication: 2010
Cover picture: Saima Zubair Name of series: Examensarbete 322 Department of Animal Breeding and Genetics, SLU On-line publication: http://epsilon.slu.se
Key words: Streptococcus agalactiae, Next Generation Sequencing Technologies, Reference-
guided Assembly, Mastitis, Horizontal Gene Transfer, Secretory Proteins

CONTENTS
Abstract ................................................................................................................................................. 1
Introduction (problem, background and purpose) ................................................................................. 1
Literature study ...................................................................................................................................... 2
Mastitis ......................................................................................................................................... 2
Forms of mastitis ...................................................................................................................... 2
Classification ............................................................................................................................ 2
Prevalence ................................................................................................................................ 2
Epidemiology (study of factors) .............................................................................................. 3
Streptococcus agalactiae Mechanism of action / Pathogenesis ................................................... 3
Next generation sequencing technologies .................................................................................... 3
Basic assembly steps ................................................................................................................ 4
Annotation of bacterial genomes .................................................................................................. 4
Assembly and annotation of other S. agalactiae strains ........................................................... 5
Materials and methods ........................................................................................................................... 5
Experimental procedures .............................................................................................................. 5
Sequencing methods ..................................................................................................................... 5
Assembly methods ....................................................................................................................... 6
Mapping assembly by Mosaik ................................................................................................. 6
Mapping assembly by MIRA ................................................................................................... 6
Sequence visualization methods .................................................................................................. 8
Gene finding/Annotation methods ............................................................................................... 9
Evolutionary comparison ............................................................................................................. 9
Prediction of signal peptides, cleavage sites and secretory proteins .......................................... 10
PredSi ..................................................................................................................................... 10
SignalP ................................................................................................................................... 10
Results ................................................................................................................................................. 10
Discussion ........................................................................................................................................... 22
Assembling the genome with Mosaik and Mira ......................................................................... 22
Annotation with GenComp ........................................................................................................ 23
Evolutionary comparison with ClustalX and Dendroscope ....................................................... 23
Secretory proteins prediction with PrediSi and SignalP ............................................................ 23
Conclusion ........................................................................................................................................... 26
Acknowledgements ............................................................................................................................. 26
References ........................................................................................................................................... 26

1
ABSTRACT
Streptococcus agalactiae is an obligate parasite and contagious pathogen living within the epithelial cells lining of acini of the bovine udder, causing milk disease mastitis particularly subclinical mastitis in dairy cattle. This bacterial pathogen also causes infection in pre-milking heifers, as well as neonates. We performed whole genome sequencing of strain 09mas018883 of Streptococcus agalactiae. We carried out a reference guided assembly of short paired end reads generated from Illumina Genome Analyzer II using A909 S. agalactiae strain as a reference; as a result a draft genome sequence was generarted. The length of this draft genome sequence is 2127931 bps, consisting of 2129 protein coding genes. We made a comparison of the nickel operons nikABCDE of this genome with those of few others strains of Streptococcus agalactiae to observe the genetic diversification of this region among different strains. Along with pathogenicity islands, these nickel operons might be involved in the conversion of non-pathogenic bacteria to pathogenic through horizontal gene transfer (HGT).
INTRODUCTION (PROBLEM, BACKGROUND AND PURPOSE)
Streptococcus agalactiae, also known as group B Streptococcus (GBS), is a gram positive infectious parasite of mammary glands of cow. Its cell wall-associated group B carbohydrate distinguishes it from other pathogenic Streptococci (Tettelin H et al., 2002). It brings infection to pre-calf heifers along with older cows among dairy herds without any effective control program. It is one of the leading causes of economic losses to dairy industry (Glaser P et al., 2002; Erskine RJ, 1992). The intra-herd prevalence of Streptococcus agalactiae was about 44.7 %, according to a study in Massachusetts in 1982 (Oliver SP & Mitchell BA, 1984). A 1992 study revealed its intra-herd occurrence to be reduced up to 10% (Keefe GP, 1997). Quantity and quality of milk and milk products e.g cheese, butter etc. is compromised due to infection of dairy cattle with Streptococcus agalactiae. The shelf life and nutritional value of milk is also decreased, affecting dairy industry as well as its users (Keefe GP, 1997; Politis I & Ng-Kwai-Hang KF, 1988). One of the major causes of bacterial sepsis, meningitis and pneumonia among human neonates of US and Europe, is Streptococcus agalactiae (Tettelin H et al., 2002). Other sequenced strains of Streptococcus agalactiae are NEM316, A909, 2603V/R, CJB111, H36b, 18RS21, COH1, 515. These sequencing efforts of various strains of S. agalactiae are for the exploration of genetic variation in all strains (Tettelin H et al., 2005). The species, strain, virulence and size of the bacterial inoculums have impact on the severity of the disease (Khan A and Khan MZ, 2006). Although the S. agalactiae strains are very similar to each other but they also show genetic heterogeneity not only among the strains of different serotype but also of the same serotype (Martinez G et al., 2000). Various new strains’ sequencing and analysis could contribute in more understanding of disease and then reaching a better solution for it. We have determined the draft genome sequence of a cow S. agalactiae strain, 09mas018883 isolated from a mastitis case, in order to observe the pathogenicity and genetic variability of bacterial pathogen streptococcus agalactaie. We compared the sequences of nickel operons of this genome with few already known pathogenic strains, to provide evidence about the evolution of Streptococcus agalactiae. Horizontal gene transfer of nikABCD operons from Fusobacteria to Streptococcus agalactiae clade, could be the mechanism behind its virulence acquisition and change from non-pathogenic to pathogenic bacteria (Glaser P et al., 2002; Blumberg HM et al., 1996). The phagocytic activity of macrophages can be enhanced if the opsonic antibody
2
(antibody linked to the cell membrane’s receptor of pathogen to activate the phagocytosis) against certain mastitis-causing pathogens would be present in the body of cow. The purpose of this study is to identify novel antimicrobial drug targets and develop a GBS vaccine (vaccine contains an agent that is similar to specific pathogen so that when that pathogen invades the host body, the immune response is activated. It is usually made by killed or weakened microbe forms or their toxins) that could be effective for the progress of dairy industry and in maintaining the quality and quantity of milk yield (Khan A and Khan MZ, 2006).
LITERATURE STUDY
Mastitis Mastitis (mastos: breast and itis: inflammation) (Schalm OW et al., 1971) is the irritation and swelling of milk-secreting tissue of dairy animals’ udder as a result of physical injury, chemical exposure to the glands and most often bacterial pathogens. Forms of mastitis Non-infectious mastitis (about 1%, due to physical injury) Infectious mastitis (due to bacterial pathogens): The bacterial pathogens causing
infectious mastitis in dairy cattle are Staphylococcus aureus (44.03%), Staphylococcus epidermidis (14.93%), Streptococcus agalactiae (3.73%), Micrococcus species (6.72%), Escherichia coli and Pseudomonas aeruginosa (0.75% each), Streptococcus dysagalactiae (4.48%), Streptococcus uberis and other species (2.99% each), Corynebacterium bovis and Actinomyces pyogenes (5.97% each), Corynebacterium ulcerans (2.24%), and Bacillus species (4.48%) (Sori H, 2005).
Classification Mastitis is classified on the basis of clinical signs of the affected dairy cows and other animals. Preacute/clinical mastitis: the milk yield is decreased due to red, hot and swollen bovine
udders. Signs of fever, shivering, quick weight loss, appetite loss and depression are observed, consequently leading to death in extreme cases (Khan A and Khan MZ, 2006).
Acute mastitis: occurs due to severe inflammation of lactating tissue resulting in mild depression with fever.
Subacute mastitis: causes the appearance of some signs on the milk bag of cows. Subclinical mastitis: causes the irritation and infection of mammary glands without any
apparent clinical sign, so could be referred as hidden mastitis. But if this infection continues up to two months, the mastitis becomes chronic and occurs throughout life of the animal. Mastitis is detected by somatic cell counts (SCC) that have positive correlation to the infection level or in other words have negative correlation with milk production. Cows having SCC ≥ 300,000 cells/mL, have high infection risks. According to substantial amount of evidence 100,000 to 150,000 SCC exhibit the normal level for dairy milk (Khan A and Khan MZ, 2006).
Prevalence Subclinical mastitis usually caused by obligate pathogen Streptococcus agalactiae, Staphylococcus aureus and other bacterial pathogens becomes more important due to its 15 to 40% higher prevalence as compared to clinical mastitis. It is difficult to detect due to which pathogens live on the host for long time, so it acquires infectious status. The longevity of subclinical type destroys the milk quantity as well as quality (Almaw G et al., 2009; Shearer and Harris, 2003). A study in Ethiopia reported the prevalence of clinical mastitis ranging from 1.2 to
3
21.5%, while that of subclinical from 19 to 46.6%. Among major livestock disorders in Pakistan, mastitis is the most common disease of dairy animals; as a result the lactation period was reduced by 57 days and the milk production by 438 kg per lactation (Khan A and Khan MZ, 2006; Cady et al., 1983). According to a study in Sebeta to examine the mastitis status by Californian Mastitis Test (CMT: It is a quick test to predict SCC of cow milk sample from each quarter, with the help of CMT solution) in 180 local and crossbred cows, the overall prevalence was estimated as 52.78%. The milk yield was reduced 30% per affected quarter and 15% per affected cow (Sori H et al., 2005). In another study in Pakistan 50 crossbred cows’ milk samples were examined for mastitis prevalence. The occurrence of subclinical mastitis was 36% and that of clinical mastitis was 5.5%. Staphylococcus aureus, Streptococcus agalactiae, E. coli and Bacillus spp. were isolated from 48, 30, 13 and 8% milk samples respectively (Khan AZ and Mohammad G, 2005). According to a study on mastitis performed in USA, in comparison to other types of mastitis, the subclinical mastitis contributes to 60-70% of the total economic losses (Bachaya HA et al., 2005). Epidemiology (study of factors) Mastitis is a multifactorial contagious disease and a normal cow may be affected due to the transfer of pathogen from an affected cow to an unaffected normal one. Flies bites are the major cause of its spread among cows. Calves can transfer bacteria from one quarter to other quarters and also from one cow to other cows by cross-suckling. Among other factors milk machines, wet teats, over-milking and milkers’ hands, also contribute in the spread of mastitis infection. Older cows are more vulnerable for the occurrence of infection, due to large udder size. The shape of teat ends also affects the level of infection among animals. Cows kept in confined places and unclean barn are also more susceptible to get mastitis (Khan A and Khan MZ, 2006; Sori H et al., 2005). A study revealed that 3.35% of the mastitis cases among heifers were due to Streptococcus agalactiae, indicating that heifers also get infected with Streptococci before calving (Varatanovic N et al., 2009). Reduction in fertility and delay in onset of heat cycle also occurs in affected cow herds (Kossaibati and Esselmont, 1997). Streptococcus agalactiae Mechanism of action / Pathogenesis Streptococcus agalactiae passes the udder quarter after entering opening the natural protective and soft sphincter teat muscles and penetrates the epithelial cells of acini. Here these bacteria proliferate and release toxins, enzymes and cell wall components. It leads to fluid accumulation in the epithelium cells, due to which extravasation of neutrophils occurs into lumen. The somatic cell number is increased due to aggregation of white blood cells in the milk that result in clots formation. The blockage of ducts and hindrance in milk flow occurs due to these clots and clotting factors. Initially it causes the subclinical and clinical mastitis, later on it becomes chronic due to accumulation of scar tissue into acini, which lessens the milk production and raises the somatic cell count (Khan A and Khan MZ, 2006; Murphy et al., 1988). Because of the blockage of mammary ducts and deformation of mammary glands it is difficult for antibiotics to penetrate the desired area (Jones GM, 2006). Therefore, vaccine development can be a better solution to protect against mastitis. Next generation sequencing technologies As the need to develop speedy, inexpensive and targeted methods for analyzing genomes increases, the next generation sequencing technologies (NGS) are replacing the traditional approaches. These technologies are able to produce bulk amount of data with low cost and high throughput. The biological applications of NGS technologies are de-novo assemblies, mapping
4
assemblies (aligning reads to already sequenced reference genome), genome resequencing to observe genetic variability and metagenomics etc. The main tasks associated with next generation technologies are; Preparing the template, that can be either fragment or mate pair templates. Paired end
library or template also called mate pair is the result of two sided sequencing of single DNA molecule producing forward and reverse ends (Fullwood MJ et al., 2009). A template is the DNA sequence that is the combination of known region, adapter or vector to that a primer binds, and an unknown region that we want to sequence. Its spatial arrangement on the solid surface or support allows billions of sequence reactions at a time.
Sequencing and imaging, with the use of dye labeled fluorescent nucleotides. Aligning the genome and assembling it. We can perform this step by doing either denovo
assembly of the sequence reads, or by mapping them against a highly similar reference genome. The choice to use de-novo or mapping assembly depends on the biological question, cost or time constraint, e.g. mapping assembly is good for finding the variations among the highly similar strains of same species like bacteria, Arabidopsis thaliana etc. (Metzker ML, 2010).
Commercially available NGS technologies are; Roche/454: It generates both the fragment library and paired end library. The average
length of resulting reads is about 330 base pairs. This method is more effective for repeat-rich regions as it produces longer reads. It produces reads of variable lengths.
Illumina/Solexa: It also produces both fragment and mate pair libraries, with the read length ranging from 75 to 100 base pairs. The read length is fixed.
SOLID/APG/Life: It also generates fragment library as well as mate pair one, and the reads produced are 50 base pairs long. It also gives the reads of invariable length.
Some other like Helicose Biosciences, Pacific Biosciences etc (Metzker ML, 2010). Basic assembly steps The sequence assembly is performed under three basic steps; Overlap: In first step all the sequencing reads are compared pairwise for potential
overlapping regions. In mapping or comparative assembly, this phase is replaced by Align phase, in which reads are aligned with respect to a reference genome.
Layout: In layout step the selected overlapping reads are arranged in overlap pattern. Consensus: In this step a final consensus sequence is estimated using the arranged reads
(Pop M et al., 2004) In the assembly process the input sequence reads are combined to make longer sequences called contigs. These contigs are then ordered and oriented in order to close the gaps called scaffolding, as a result of which we get a finished genome (Huang X, 1992; Peltola H et al., 1984). Annotation of bacterial genomes Currently more and more bacterial genomes are being sequenced and made publically available. This bulk amount of data is beneficial for us if we would convert this raw sequence to a particular meaning. In other words the annotation of these emerging genomes is required, that can be done using annotation pipelines made up of various computational tools and methods (Stothard P and Wishart DS, 2006).
5
Assembly and annotation of other S. agalactiae strains The detailed analysis of bacterial pathogens to explore pathogenesis because of genetic variability, and to identify anti-pathogenic drug targets is made possible by developing rapid, cheap and efficient methods for sequencing and annotation (Tettelin H et al., 2005). Glaser P et al., 2002 performed the sequencing and annotation of NEM316 strain of Streptococcus agalactiae causing septicemia in humans. This study suggested that S. agalactiae exhibit distinguishable features over other disease-causing Streptococci that its genetic diversification and virulence acquirement may be due to the presence of large number of pathogenicity islands within the genome of S. agalactiae. Majority of the known and predicted genes as well as pseudogenes are located within the islands. These islands also comprised of some other genes that are assumed to be responsible for horizontal gene transfer (HGT). It could be the mechanism behind the rapid evolution of pathogenicity islands, particularly in case of hypervirulent strains of S. agalactiae. A study was conducted to analyse the genome of many pathogenic strains of S. agalactiae because it is not possible to fully understand bacterial species on the basis of single strain. It is needed to sequence and annotate multiple S. agalactiae strains to identify its root cause of virulence acquisition and pathogenicity within the host. The complete genome of A909 strain causing neonatal infection and draft genomes of five other strains of group B Streptococci (GBS) were sequenced to completion. These strains along with already sequenced strains of Streptococcus agalactiae were analyzed and it was concluded that all S. agalactiae species’ whole genome is comprised of core genome and expendable genome. The core genome is common among all strains of S. agalactiae whereas the expendable one contains strain specific genes along with partly shared genes. The strain--specific genes would be discovered continuously as long as new strains would be sequenced (Tettelin H et al., 2005). Tettelin H et al., 2002 investigated the complete genome sequence of Streptococcus agalactiae strain 2603 V/R (causing neonatal sepsis, meningitis etc) and compared it with already known genomes of other strains and Streptococcus pneumonia, Streptococcus pyogenes etc. This study has given clues about the evolution of the virulence mechanism by determining the genetic heterogeneity of S. agalactiae strains. In this study many unique strain--specific genes, surface proteins, genes synthesizing protective capsule and regulatory sequences for transcription were identified that could be the cause of pathogenesis of Streptococcus agalactiae. Other sequenced strains of Streptococcus agalactiae are CJB111, H36b, 18RS21, COH1, 515. (Tettelin H et al., 2005).
MATERIALS AND METHODS
Experimental procedures Streptococcus agalactiae strain 09mas018883 was isolated from the cow milk and DNA was extracted by Karl Erik Johansson in SVA laboratory, Ultuna. Sequencing methods Genome sequencing was performed by Ulrika Liljedhal using Illumina Genome Analyzer. The mean library insert size was of 545 bps, and range from about 490-620 bps. The adapters added to the inserts were of 120 bps. The sequence reads were 34393016 (17196508 * 2) and were paired end. Paired end reads are the two sequences that we get by sequencing both ends of single DNA
6
molecule. Two separate files were generated each containing 17196508 sequence reads for paired ends, along with their quality values (2 FASTQ files each conating one of the paired reads). The length of each read was 75 bps. Assembly methods For assembling the short sequence reads to contigs and scaffolds, two approaches are being used; the denovo assembly and the reference guided assembly also called mapping assembly. In denove assembly short fragments are assembled together to get a new unknown sequence, which would be in the form of short scaffolds because of occurrence of repeated sequences. While in mapping assembly, reads are assembled against an existing backbone sequence that acts as a reference sequence for short reads; the resultant sequence would be similar to backbone sequence but not essentially identical. It successfully identifies variations among closely related bacterial strains as well as eukaryotes, but cannot identify species specific regions because of the absence of these in the reference sequence (Nishito Y et al., 2010). Mapping assembly by Mosaik 34393016 sequence reads were assembled using Mosaik 1.0.1384 by Michael Stromberg, Marth Lab 2010-01-24 (Hillier LW et al., 2008) (http://bioinformatics.bc.edu/marthlab/Mosaik). The mapping assembly of this cow S. agalactiae genome was performed using 3 available human reference sequences for Streptococcus agalactiae strains NEM316/NC_004368 (2211485 bps: 2.3 Mbps), A909/NC_007432.1 (2127839 bps: 2.2 Mbps) and V/R 2603/ NC_004116 (2160267 bps: 2.2 Mbps) [Downloaded from NCBI ftp site: http://www.ncbi.nlm.nih.gov/Ftp/]. Working Mosaik performs reference guided assembly of sequence reads against reference sequence. First of all it converts the input reference file format and the read file format to its own binary format. Then it performs pairwise alignment of reads against reference sequence. This alignment is then sorted with the help of reference sequence coordinates; after resolving paired end reads. At the last step this sorted alignment is used and multiple sequence alignment is generated, which is then stored in the final output format (ACE). Parameters Hash_size = 15 (-hs 15), maximum mismatch threshold = 4 (-mm 4), algorithm for alignment = all positions (-a all), mode of alignment = reads alignment to all possible locations (-m all: this mode is good in case of paired end reads), maximum number of hash positions used per seed (-mhp 100), alignment candidate threshold = 20bp (-act 20), processors = 10 (-p 10). Mapping assembly by MIRA MIRA (Mimicking Intelligent Read Assembly) v 3.0.0 by Bastien Chevreux (Chevreux B et al., 1999) was also used to do the mapping assembly of S.agalactiae sequence Illumina reads against one of the selected reference sequence on the basis of its highest alignment with reads i.e A909 strain’s genomic sequence. Features Gives assembly output in number of various formats (ACE, CAF, MAF, padded_FASTA,
unpadded_FASTA, TCS, WIG) due to which the usability of MIRA increases. Gives all the results by single command with collection of parameters, and there is no
need to run command separately for SNPs, Indels etc. Provides the options of large number of parameters to play with assembly. Gives results is separate text files so results can be tracked easily.
7
Drawback MIRA takes too much memory and time to complete the assembly so we had to use filtered version of the input data. Algorithm behind MIRA MIRA assembler assembles Sanger, 454 and Illumina sequence reads to best possible contiguous sequences by performing series of following tasks; Processing of input data reads to evaluate them for high confidence regions (HCRs) and
low confidence regions (LCRs) based on high and low quality values of bases, respectively. HCRs will be used as anchor points for next steps, while LCRs will be kept aside if could be used anywhere.
Then assembly is begun with scanning of the selected reads for potential overlapping regions using pairwise alignment.
Overlapping reads are aligned locally using Smith-Waterman algorithm based on the quality criteria to accept the overlapping reads. The overlaps exhibiting computational score in the range of expected threshold score and contributing a reasonable length for the contig are selected.(Systematic match inspection)
The selected overlap reads are used to build contigs. The next read is aligned pairwise with the existing contig at its anchor point; the node
where maximum weighted edges are connected to assure the high quality. Pathfinder selects the incoming reads as candidate and then chooses the unique longest path with good quality by adding new read to the consensus sequence.
Then the consensus sequence is approved by detailed analysis on the basis of coverage, and repeats and errors etc.
Read are extended in two ways; firstly to increase the coverage (intracontig extension) and secondly to join the contigs to get longer stretch (extracontig extension).
The extended contigs are linked and edited by correcting the errors, mis-assemblies and repeat regions with the help of autofinisher (Chevreux B et al., 1999).
Input data files used: 1. FASTQ file of paired end Illumina reads 2. FASTA file of reference sequence A909 3. TEXT file generated by MIRA itself to be used as ancillary information (contains name of
read & strain name for each read) Parameters applied on input data: Table1. Showing the parameters used to assemble the paired end S.agalactia reads against reference using MIRA assembler
Parsing parameters Description of the parameters
Job
mapping,genome,accurate,solexa
:
Do an accurate mapping of Illumina reads against a genome
nop=1 AS: ASSEMBLY options:
Number of passes or iterations for assembly process are 1
lsd=yes: SB:
bsn=A909: bft=fasta:
STRAIN/BACKBONE options: Load additional strain data Name of the backbone is A909 File type containing backbone is FASTA
8
bbq=30 Assumed base qualities for backbone are Q30
lsd:yes: LR:
ft=fastq: fqqo=64
LOADREADS options: Load sequence data of Illumina technology File type from which sequence data will be loaded for assembly, is FASTQ Quality offset value to convert characters of FASTQ file to the quality values, is 64.
mrs=70 AL:
ALIGN: Minimum relative score (least matching %age for assembly between two reads) is 70.
COMMON_SETTINGS:
bph=20 SK:
orh=yes OUT:
SKIM options: Base per hash; number of consecutive bases used as a word hash. OUTPUT options: Output result html
SOLEXA_SETTINGS:
msr=no CO:
uti=no: GE:
tismin=490: tismax=620
CONTIG options: Don’t merge short reads to contigs that are 100% identical to backbone GENERAL options: Switch off the checking of template size information (for appropriate mapping of paired end reads) Minimum expected distance (template insert minimum) between paired reads is 490 Maximum expected distance (template insert miaximum) between paired reads is 620
Sequence visualization methods The assembly output (ACE file) produced by MIRA assembler was viewed in Tablet v 1.10.03.04, a memory efficient assembly viewer tool for NGS technologies (both Illumina and 454) (Milne I et al., 2010). Features We used tablet as a viewer as it; Uses the hybrid of both memory-based (navigation fast, more features, delay in data
loading, limited memory available to load data) and cache-based approach (fast and large data loading but at the cost of navigation and features), for handling assembly visualization. It uses skeleton layout and accesses the data in memory by just indexes or IDs.
Supports ACE along with other assembly output formats AFG, MAQ and SOAP. Identifies nucleotides by also by colors and offers high quality visualization. Allows navigation to any region of interest by jumping to padded and unpadded position. Provides scroll option to move left and right throughout the assembly. Gives overall view of the coverage and gapped areas of entire assembly at a time, from
where we can jump to desired area by just clicking. Gives the feature to increase its memory to load large data files.
9
Displays the number of reads loaded by viewer with their memory allocation. Gives contig overview (length, number of reads, annotation features, mismatches
percentage) Allows visualization of sequence variations and errors by changing the contrast level. Shows the position and coverage of each individual base, on pointing the arrow base.
Gene finding/Annotation methods The draft sequence of S. agalactiae isolated from cow was used for predicting genes and their functions and also for further annotation. We used our in--house package called GenComp for predicting the genes and their functions, which is an annotation pipeline using many tools successively. This system is used to perform analysis and comparison of bacterial genomes. Its purpose is to visualize gene order structures and observe the relationship of pseudogenes with many species having close relation to each other (Fuxelius HH et al., 2008). In the initial step the Glimmer v 3.0 (Delcher Al et al., 1999) was used to predict open reading frames (ORFs) while using same settings for all related genomes. The ORFs with length greater than 100 base pairs were selected. These ORFs were checked one by one for their similarity to the genes of already sequenced genomes, using basic local alignment search tool Blast v 2.2.17 (Altschul SF et al., 1997). Then the results of Blast were used in Muscle v 3.6 (Edgar RC, 2004), using which the multiple sequence alignment (MSA) was performed to observe the similarity between our query sequences (ORFs) and Blast results (hits of closely related genomes). Then the function of most closely related gene is assigned to query ORF. At last step the protein distances were calculated by using a program to compute distance matrix i.e Phylip Protdist v 3.69 (Felsenstein J, 1989). The resultant genes were ordered according to the distances computed by Protdist. The output of GenComp system was viewed, analyzed and annotated with the help of a tool used for sequence visualization and annotation, Artemis v 10.2. It is very useful in annotating and analyzing compacted genomes like bacterial genomes (Berriman M and Rutherford K, 2003; Rutherford K et al., 2000). DNA plotter v 10.2, a tool for generating the circular as well as linear DNA plots, was used to get the circular genome for cow S. agalactiae (Carver T et al., 2009). Various genomic features can be exhibited on custom and user defined tracks on the plot, to make visualization better. These genomic features can be the coding sequences on forward and reverse DNA strands, Pseudogenes, Pathogenicity islands, repeat regions, tRNA genes, rRNA genes, %GC plot, GC skew [(GC)/(G+C)]. All the features can be displayed in different colors to get better distinguishable plot view. Evolutionary comparison In order to know the evolutionary status of S. agalactiae we searched nikABCD operons in cow S. agalactiae draft sequence, and then collected these operon sequences from some already sequenced S. agalactiae strains (human A909, 2603V/R, old camel strain, old bovine strain, Fusobacterium strain), by using BlastX v 2.2.17 on default parameters. Multiple sequence alignment of nikABCD operons from cow S. agalactiae with other S. agalactiae strains along with fusobacterium strain was carried out by using ClustalX 2.0.3, under default parameters (Larkin MA et al., 2007). The alignment results by ClustalX were used by Dendroscope v 2.4 in order to construct and view the phylogenic trees, to observe the evolutionary relationship among related strains of S. agalactiae (Huson DH et al., 2007).
10
Prediction of signal peptides, cleavage sites and secretory proteins Secretory proteins, surface proteins as well as lipoproteins have their significant role in the virulence activity of bacterial pathogens (Glaser P et al., 2002). We identified secretory proteins that are secreted by cell either endocrine or exocrine like harmones, enzymes, antimicrobial petides etc. The signal peptides have a role in determining the status of protein as intracellular or extracellular one. These signal peptides contain specific signal sequence on the N terminus of sequence that is recognized by Signal Peptidase I enzyme after exit of peptide from the cell, and usually cleaved off at cleavage site (Hiller K et al., 2004; Bendtsen JD et al., 2004). While the lipoproteins exhibit a lipobox motif sequence that is recognized by two enzymes, prolipoprotein dioacylglyceryl transferase and signal peptidase II (Glaser P et al., 2002). Surface proteins and lipoproteins will be identified in future work. The secretory proteins were detected using two web servers PrediSi and SignalP. PredSi We used the PredSi (Prediction of Signal peptides) web server to identify signal peptides and their cleavage positions along with determining the secretary proteins in bovine S. agalactiae genome. PrediSi uses position weight metrics (PWM) for the computation of secretory proteins (Hiller K et al., 2004). Input file FASTA file of Amino acids generated by using Artemis tool Parameters Gram positive bacteria Other default parameters SignalP We also used SignalP 3.0 server to confirm the results generated by PredSi server. SignalP uses neural network (NN) as well as hiddem markov model (HMM) for the prediction of signal peptides, cleavage position and secretary status of proteins (Bendtsen JD et al., 2004). The query was run by choosing gram positive bacteria, with other parameters as default.
RESULTS
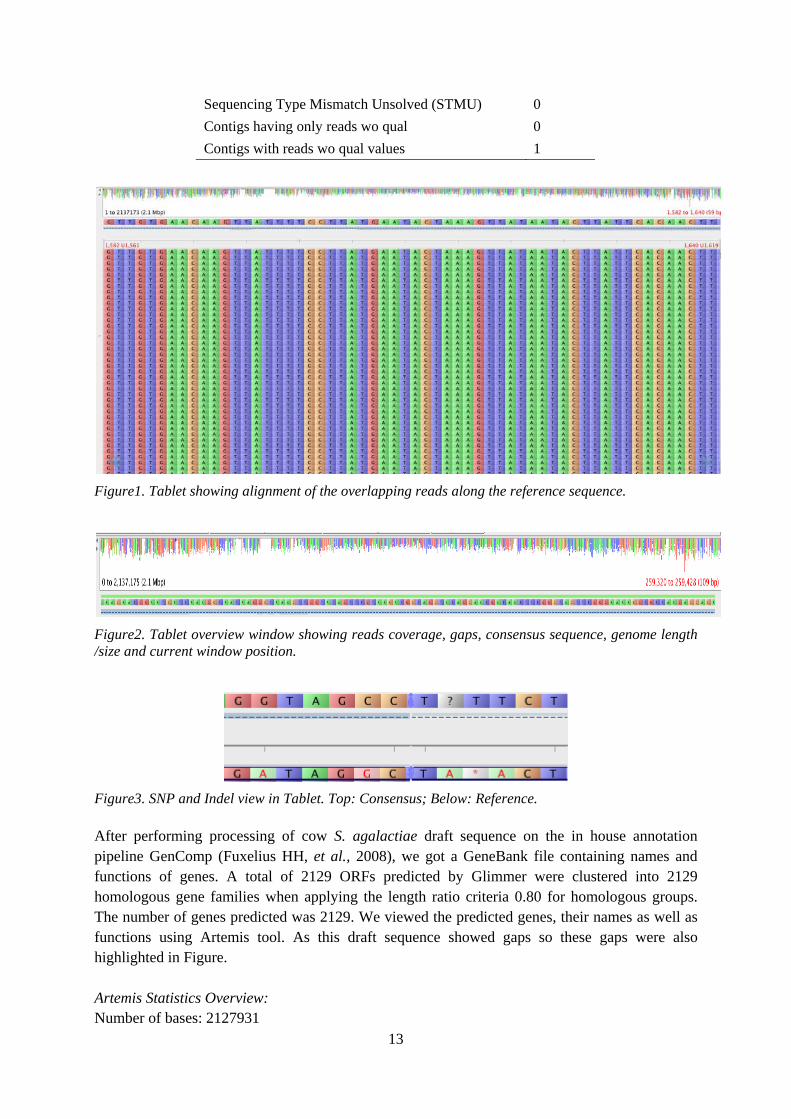
The resulting alignment statistics for assembly of cow S. agalactiae reads with 3 human S. agalactiae reference genomes NEM316, A909 and V/R 2603 were compared, to find the best possible reference sequence to be used for the cow S. agalactiae sequence reads. Maximum reads were aligned with A909, so the results of cow genome using A909 strain's genome sequence as a reference were used for further analysis. Cow S. agalactiae reads aligned to NEM316: 89.0 % Cow S. agalactiae reads aligned to A909: 92.2 % Cow S. agalactiae reads aligned to 2603 V/R: 88.5 % The assembly output was got in the form of a consensus draft sequence, with many gaps in between. The padded position (including sequence errors as *) of resultant draft sequence = 1 to 2,137,173 The unpadded position of resultant draft sequence = 1 to 2,127,931 (2.1 Mbp) The above lengths also include the reference sequence at the gaps places. These gap positions are shown in Table2.
11
Table2. Unpadded positions of Gaps in assembly output while using A909 as reference
Nr.
Gap position (Start to End)
Gap length (bps)
Nr.
Gap position (Start to End)
Gap length (bps)
1 36416..36615 199 53 688817..688831 14 2 36939..36945 6 54 689707..689741 34 3 39441..39451 10 55 690599..690670 71 4 42252..42290 38 56 690975..691013 38 5 58115..58145 30 57 691415..691454 39 6 63946..64970 1024 58 691551..691684 133 7 91142..91171 29 59 691769..691960 191 8 95056..95065 9 60 692333..692360 27 9 122657..124159 1502 61 692870..692913 43 10 144007..152115 8108 62 693002..693007 5 11 176728..176743 15 63 693112..693157 45 12 241605..241660 55 64 693463..693511 48 13 241807..241816 9 65 693964..694038 74 14 241938..242096 158 66 698766..698924 158 15 242615..243290 675 67 892677..894176 1499 16 243408..243656 248 68 986491..987408 917 17 243930..244077 147 69 1087626..1087640 14 18 245051..245109 58 70 1087869..1088055 186 19 245361..245607 246 71 1190892..1191273 381 20 245709..245792 83 72 1224771..1228176 3405 21 245875..246043 168 73 1256170..1256229 59 22 265811..267315 1504 74 1258248..1258270 22 23 450390..452794 2404 75 1418749..1427788 9039 24 459600..462219 2619 76 1485091..1485278 187 25 462776..462974 198 77 1539784..1541286 1502 26 463917..464400 483 78 1545595..1547005 1410 27 465251..484030 18779 79 1587122..1588632 1510 28 484948..485125 177 80 1758997..1759037 40 29 486830..487511 681 81 1862829..1863210 381 30 507307..508806 1499 82 1875710..1877213 1503 31 548990..586318 37328 83 1933052..1933058 6 32 604323..605830 1507 84 1936773..1936930 157 33 655233..660318 5085 85 1939213..1948680 9467 34 660369..660756 387 86 1952096..1952628 532 35 669184..670390 1206 87 1954742..1954779 37 36 670468..671407 939 88 1954916..1958041 3125 37 671591..672098 507 89 2042851..2044152 1301 38 672194..673390 1196 90 2071326..2072968 1642
12
39 673916..673941 25 91 2073087..2073173 86 40 674082..674205 123 92 2073420..2074080 660 41 674339..674757 418 93 2074281..2074461 180 42 674598..674671 73 94 2074672..2074771 99 43 674775..674927 152 95 2074847..2074861 14 44 675117..675159 42 96 2075003..2077189 2186 45 679858..680048 190 97 2077300..2077349 49 46 680706..680743 37 98 2077740..2077828 88 47 680882..680951 69 99 2078848..2078972 124 48 681218..683077 1859 100 2079098..2079122 24 49 683290..683531 241 101 2079634..2080023 389 50 686129..686250 121 102 2081931..2083536 1605 51 686842..686864 22 103 2083660..2085022 1362 52 687011..687053 42
MIRA assembly information: Minimum criteria for large contigs used by MIRA: Minimum length = 500 AND Minimum average coverage = 115 (at least 1/3rd of average coverage: 346/3 = 115) So the contigs of length < 500 bases and > = 115 average coverage are considered as smaller contigs by MIRA and used at later stage when required.
Table3. Contig statistics of MIRA assembly
Data type Statistics
Number of contigs 1 Total consensus length/contig length 2127931 N50,N90,N95/largest contig size 2127931 Average consensus quality 84 Number of reads used in assembly 9272260 Number of reads used in contig 9272240 Singlet (not part of the contig) 20 Maximum coverage 1782 Average coverage (size > = 5000) 346.18 GC percentage (%) 35.62 Number of N in consensus sequence (CnN) 0 Number of X in consensus sequence (CnX) 0 Number of gaps in consensus sequence (CnGap) 9242 Areas of the contigs with no coverage 126161 Consensus bases with IUPAC characters (IUPc) 733 Strong unresolved repeat positions (SRMc) 1308 Weak unresolved repeat positions (WRMc) 764
13
Sequencing Type Mismatch Unsolved (STMU) 0 Contigs having only reads wo qual 0 Contigs with reads wo qual values 1
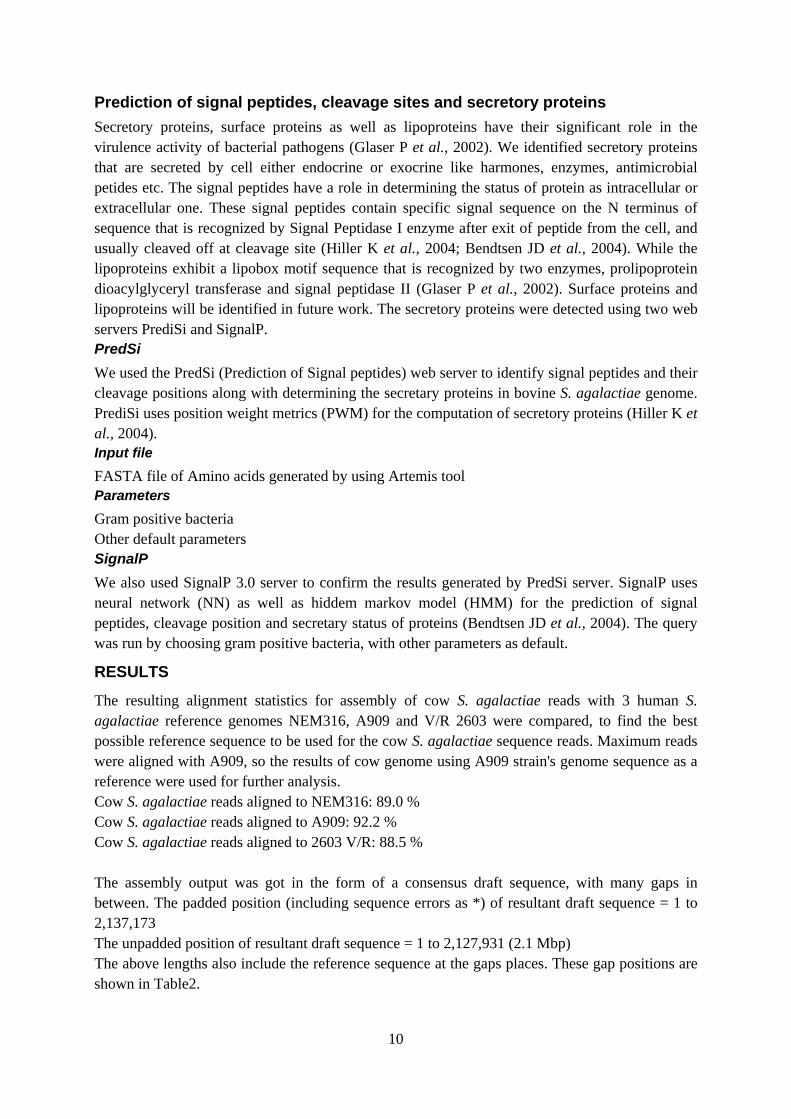
Figure1. Tablet showing alignment of the overlapping reads along the reference sequence.
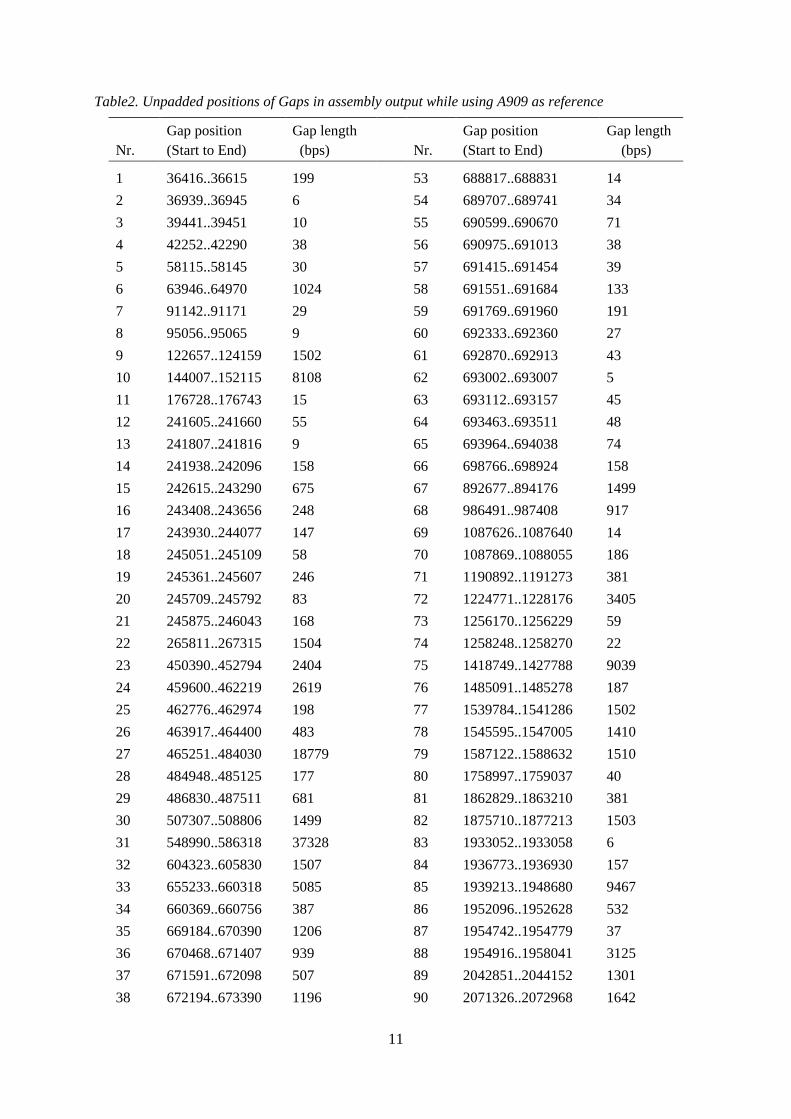
Figure2. Tablet overview window showing reads coverage, gaps, consensus sequence, genome length /size and current window position.
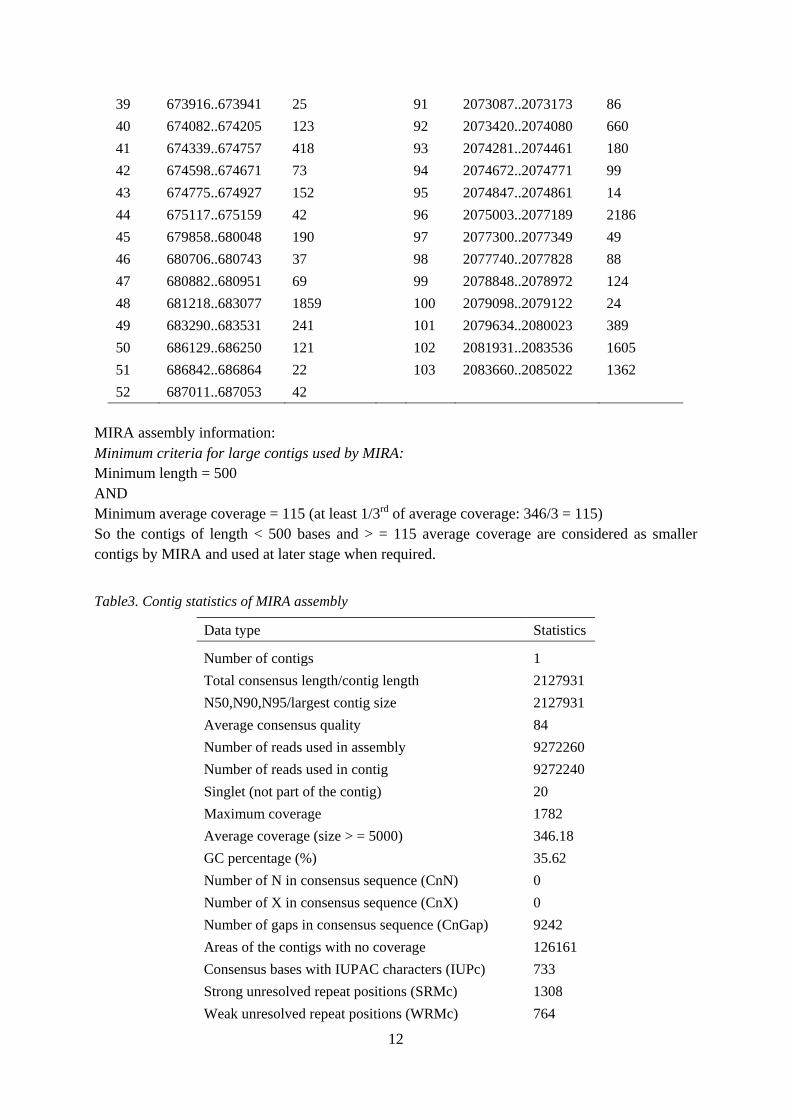
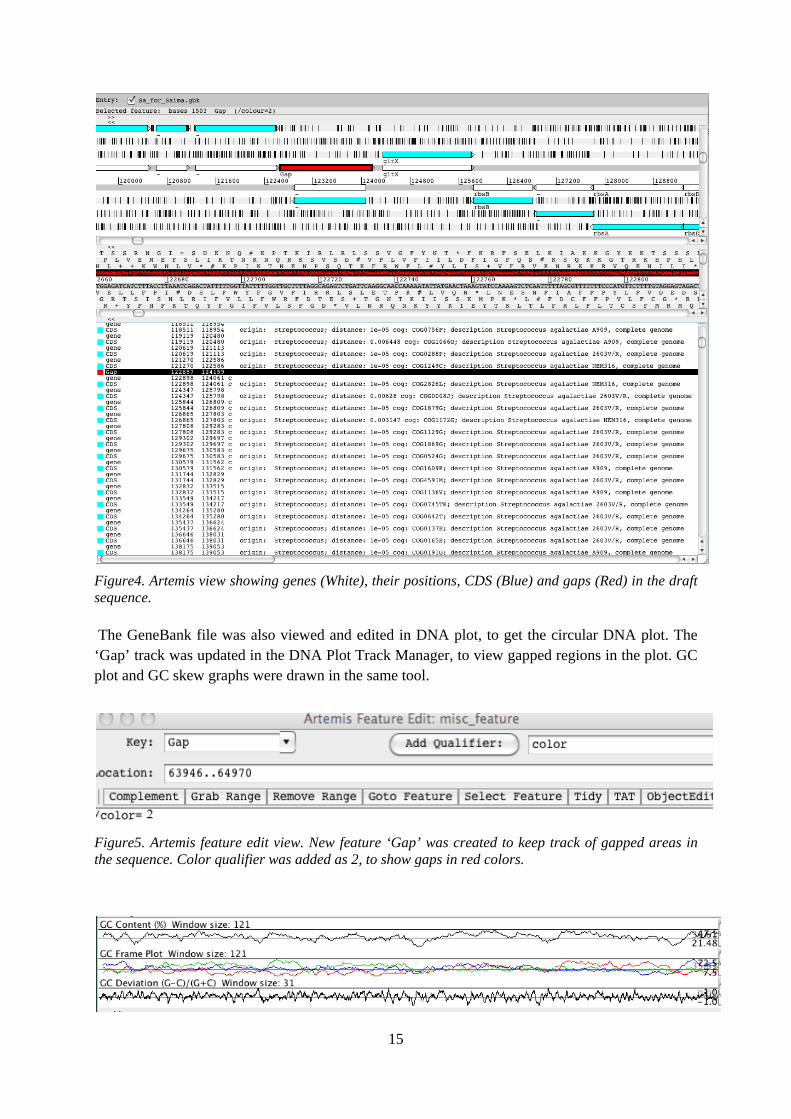
Figure3. SNP and Indel view in Tablet. Top: Consensus; Below: Reference. After performing processing of cow S. agalactiae draft sequence on the in house annotation pipeline GenComp (Fuxelius HH, et al., 2008), we got a GeneBank file containing names and functions of genes. A total of 2129 ORFs predicted by Glimmer were clustered into 2129 homologous gene families when applying the length ratio criteria 0.80 for homologous groups. The number of genes predicted was 2129. We viewed the predicted genes, their names as well as functions using Artemis tool. As this draft sequence showed gaps so these gaps were also highlighted in Figure. Artemis Statistics Overview: Number of bases: 2127931
14
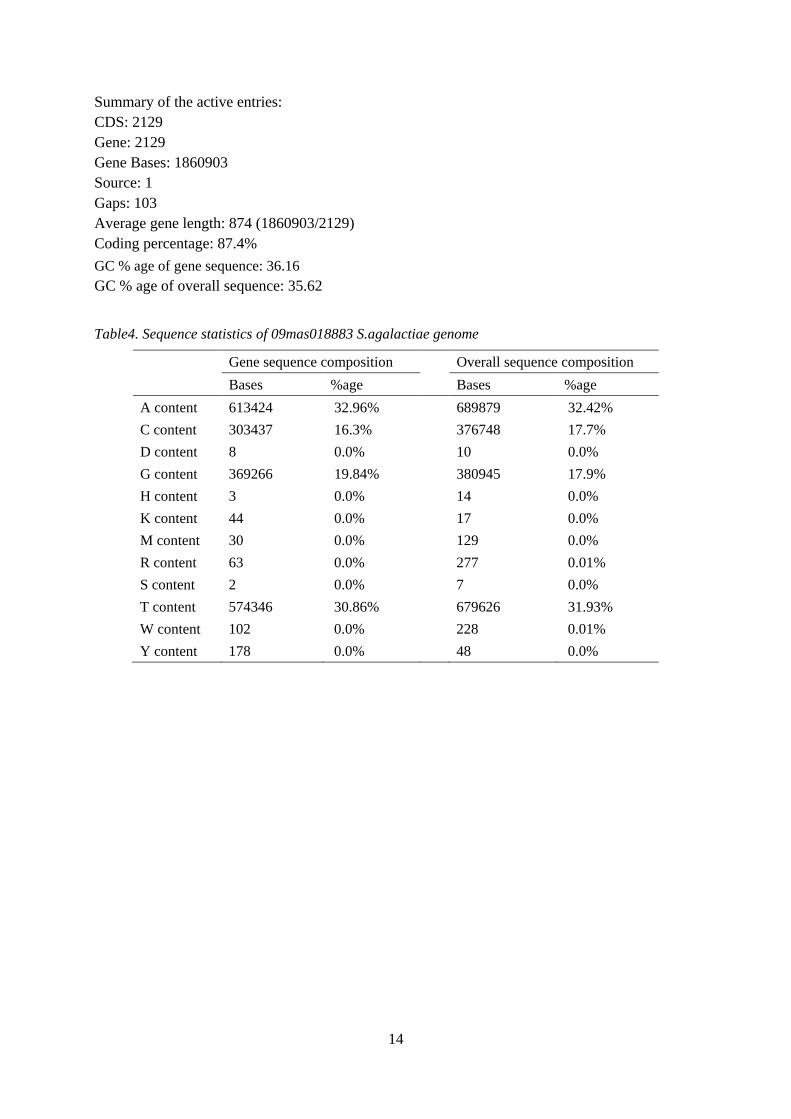
Summary of the active entries: CDS: 2129 Gene: 2129 Gene Bases: 1860903 Source: 1 Gaps: 103 Average gene length: 874 (1860903/2129) Coding percentage: 87.4% GC % age of gene sequence: 36.16 GC % age of overall sequence: 35.62
Table4. Sequence statistics of 09mas018883 S.agalactiae genome
Gene sequence composition Overall sequence composition Bases %age Bases %age
A content 613424 32.96% 689879 32.42% C content 303437 16.3% 376748 17.7% D content 8 0.0% 10 0.0% G content 369266 19.84% 380945 17.9% H content 3 0.0% 14 0.0% K content 44 0.0% 17 0.0% M content 30 0.0% 129 0.0% R content 63 0.0% 277 0.01% S content 2 0.0% 7 0.0% T content 574346 30.86% 679626 31.93% W content 102 0.0% 228 0.01% Y content 178 0.0% 48 0.0%
15
Figure4. Artemis view showing genes (White), their positions, CDS (Blue) and gaps (Red) in the draft sequence. The GeneBank file was also viewed and edited in DNA plot, to get the circular DNA plot. The ‘Gap’ track was updated in the DNA Plot Track Manager, to view gapped regions in the plot. GC plot and GC skew graphs were drawn in the same tool.
Figure5. Artemis feature edit view. New feature ‘Gap’ was created to keep track of gapped areas in the sequence. Color qualifier was added as 2, to show gaps in red colors.
16
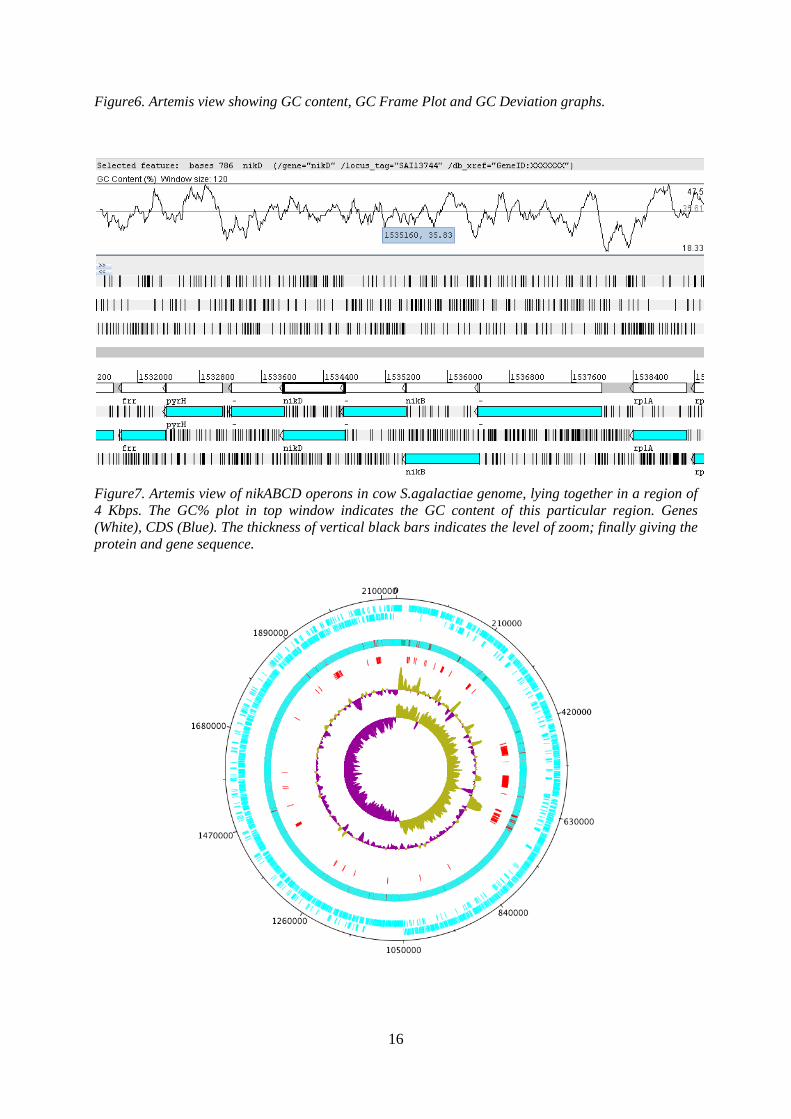
Figure6. Artemis view showing GC content, GC Frame Plot and GC Deviation graphs.
Figure7. Artemis view of nikABCD operons in cow S.agalactiae genome, lying together in a region of 4 Kbps. The GC% plot in top window indicates the GC content of this particular region. Genes (White), CDS (Blue). The thickness of vertical black bars indicates the level of zoom; finally giving the protein and gene sequence.
17
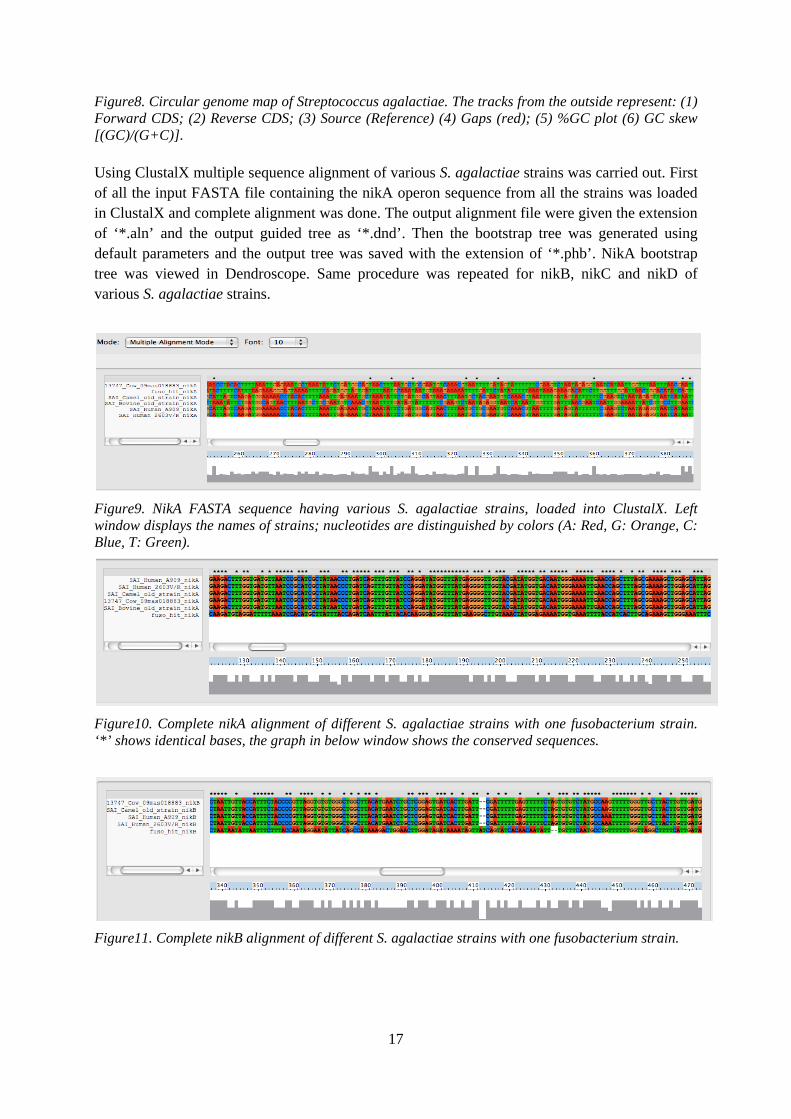
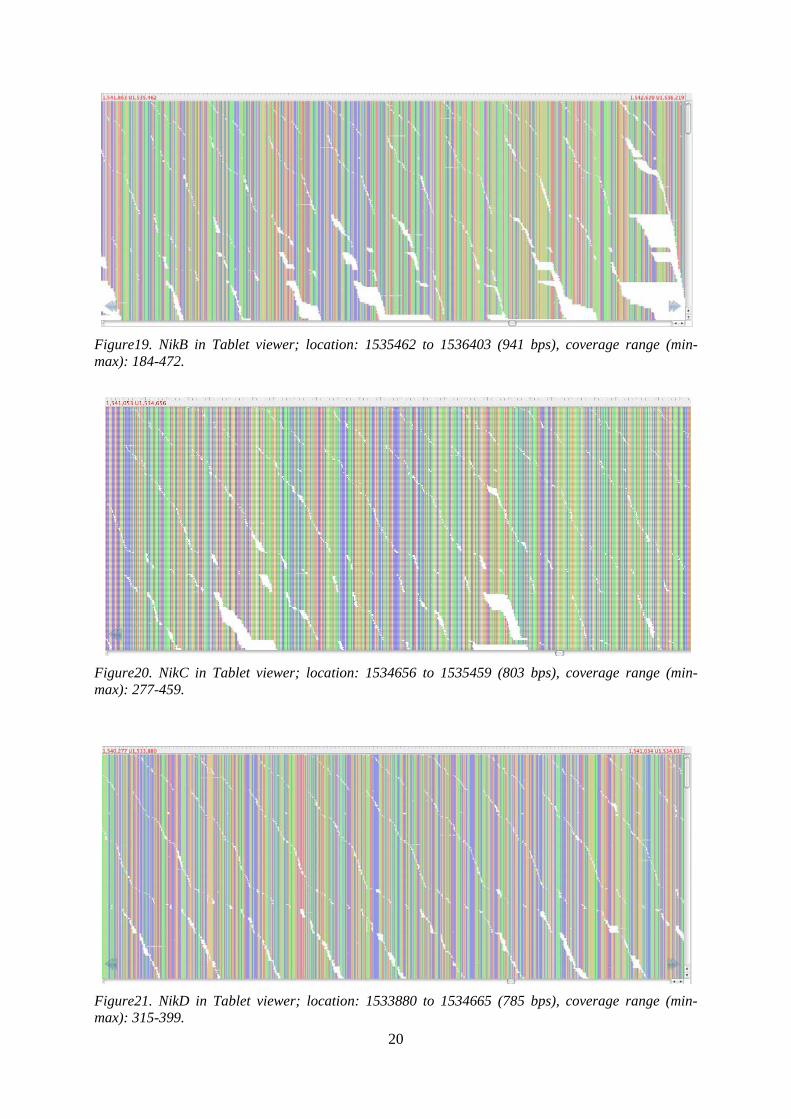
Figure8. Circular genome map of Streptococcus agalactiae. The tracks from the outside represent: (1) Forward CDS; (2) Reverse CDS; (3) Source (Reference) (4) Gaps (red); (5) %GC plot (6) GC skew [(GC)/(G+C)]. Using ClustalX multiple sequence alignment of various S. agalactiae strains was carried out. First of all the input FASTA file containing the nikA operon sequence from all the strains was loaded in ClustalX and complete alignment was done. The output alignment file were given the extension of ‘*.aln’ and the output guided tree as ‘*.dnd’. Then the bootstrap tree was generated using default parameters and the output tree was saved with the extension of ‘*.phb’. NikA bootstrap tree was viewed in Dendroscope. Same procedure was repeated for nikB, nikC and nikD of various S. agalactiae strains.
Figure9. NikA FASTA sequence having various S. agalactiae strains, loaded into ClustalX. Left window displays the names of strains; nucleotides are distinguished by colors (A: Red, G: Orange, C: Blue, T: Green).
Figure10. Complete nikA alignment of different S. agalactiae strains with one fusobacterium strain. ‘*’ shows identical bases, the graph in below window shows the conserved sequences.
Figure11. Complete nikB alignment of different S. agalactiae strains with one fusobacterium strain.
18
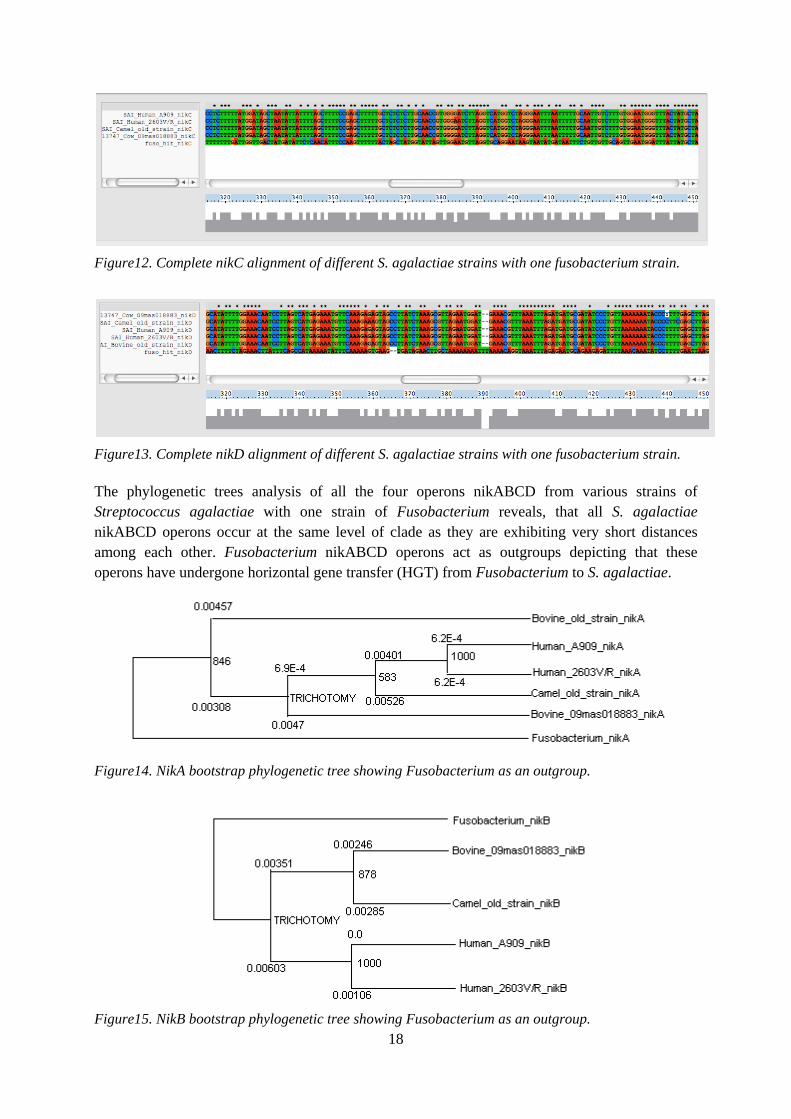
Figure12. Complete nikC alignment of different S. agalactiae strains with one fusobacterium strain.
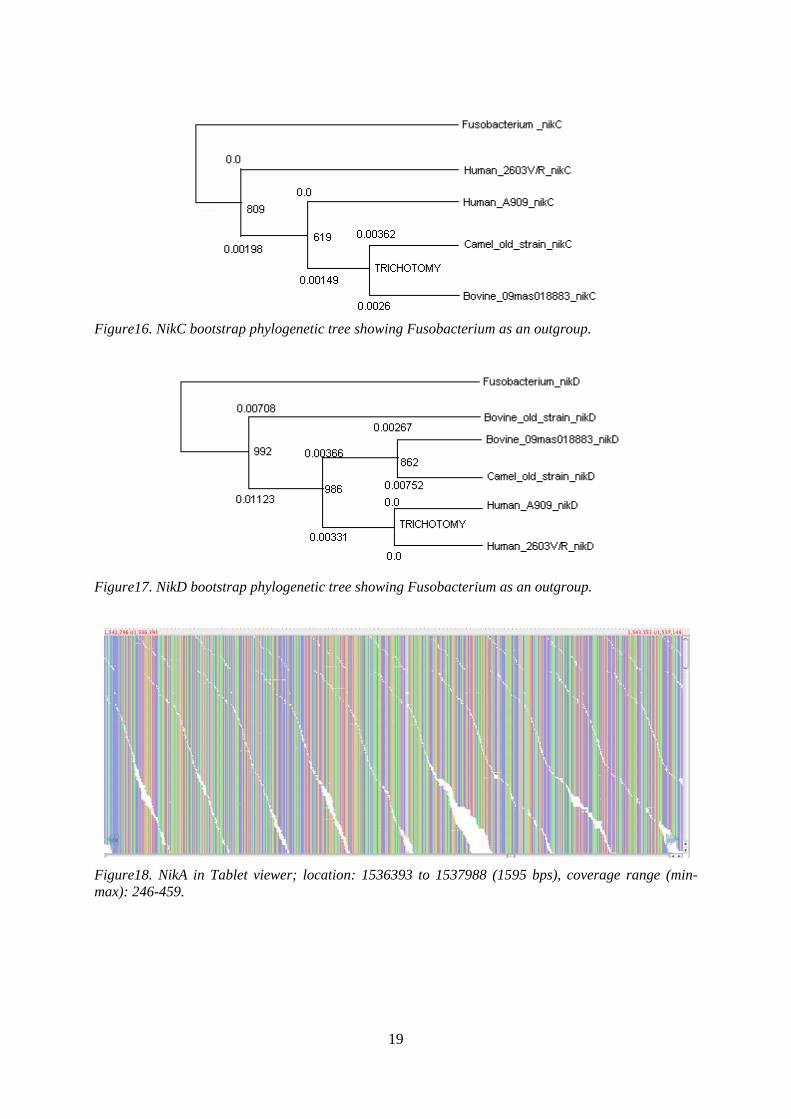
Figure13. Complete nikD alignment of different S. agalactiae strains with one fusobacterium strain. The phylogenetic trees analysis of all the four operons nikABCD from various strains of Streptococcus agalactiae with one strain of Fusobacterium reveals, that all S. agalactiae nikABCD operons occur at the same level of clade as they are exhibiting very short distances among each other. Fusobacterium nikABCD operons act as outgroups depicting that these operons have undergone horizontal gene transfer (HGT) from Fusobacterium to S. agalactiae.
Figure14. NikA bootstrap phylogenetic tree showing Fusobacterium as an outgroup.
Figure15. NikB bootstrap phylogenetic tree showing Fusobacterium as an outgroup.
19
Figure16. NikC bootstrap phylogenetic tree showing Fusobacterium as an outgroup.
Figure17. NikD bootstrap phylogenetic tree showing Fusobacterium as an outgroup.
Figure18. NikA in Tablet viewer; location: 1536393 to 1537988 (1595 bps), coverage range (min-max): 246-459.
20
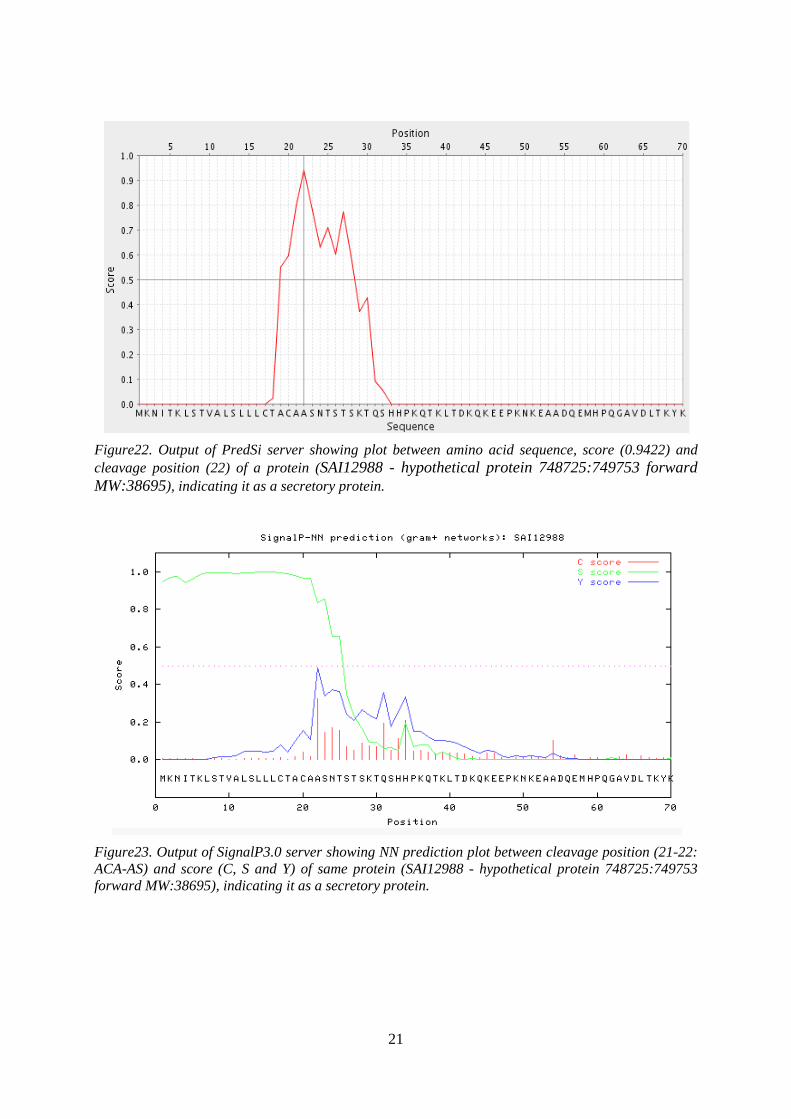
Figure19. NikB in Tablet viewer; location: 1535462 to 1536403 (941 bps), coverage range (min-max): 184-472.
Figure20. NikC in Tablet viewer; location: 1534656 to 1535459 (803 bps), coverage range (min-max): 277-459.
Figure21. NikD in Tablet viewer; location: 1533880 to 1534665 (785 bps), coverage range (min-max): 315-399.
21
Figure22. Output of PredSi server showing plot between amino acid sequence, score (0.9422) and cleavage position (22) of a protein (SAI12988 - hypothetical protein 748725:749753 forward MW:38695), indicating it as a secretory protein.
Figure23. Output of SignalP3.0 server showing NN prediction plot between cleavage position (21-22: ACA-AS) and score (C, S and Y) of same protein (SAI12988 - hypothetical protein 748725:749753 forward MW:38695), indicating it as a secretory protein.
22
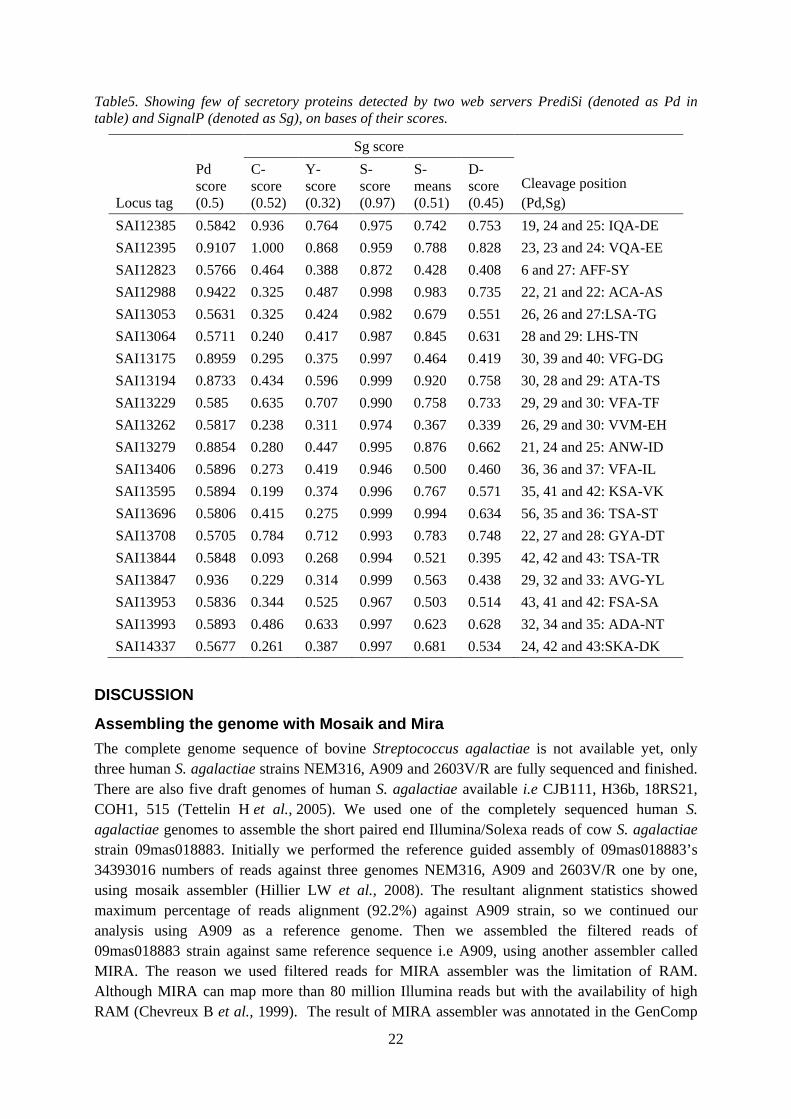
Table5. Showing few of secretory proteins detected by two web servers PrediSi (denoted as Pd in table) and SignalP (denoted as Sg), on bases of their scores.
Locus tag
Pd score (0.5)
Sg score
Cleavage position (Pd,Sg)
C-score (0.52)
Y-score (0.32)
S-score (0.97)
S-means (0.51)
D-score (0.45)
SAI12385 0.5842 0.936 0.764 0.975 0.742 0.753 19, 24 and 25: IQA-DE SAI12395 0.9107 1.000 0.868 0.959 0.788 0.828 23, 23 and 24: VQA-EE SAI12823 0.5766 0.464 0.388 0.872 0.428 0.408 6 and 27: AFF-SY SAI12988 0.9422 0.325 0.487 0.998 0.983 0.735 22, 21 and 22: ACA-AS SAI13053 0.5631 0.325 0.424 0.982 0.679 0.551 26, 26 and 27:LSA-TG SAI13064 0.5711 0.240 0.417 0.987 0.845 0.631 28 and 29: LHS-TN SAI13175 0.8959 0.295 0.375 0.997 0.464 0.419 30, 39 and 40: VFG-DG SAI13194 0.8733 0.434 0.596 0.999 0.920 0.758 30, 28 and 29: ATA-TS SAI13229 0.585 0.635 0.707 0.990 0.758 0.733 29, 29 and 30: VFA-TF SAI13262 0.5817 0.238 0.311 0.974 0.367 0.339 26, 29 and 30: VVM-EH SAI13279 0.8854 0.280 0.447 0.995 0.876 0.662 21, 24 and 25: ANW-ID SAI13406 0.5896 0.273 0.419 0.946 0.500 0.460 36, 36 and 37: VFA-IL SAI13595 0.5894 0.199 0.374 0.996 0.767 0.571 35, 41 and 42: KSA-VK SAI13696 0.5806 0.415 0.275 0.999 0.994 0.634 56, 35 and 36: TSA-ST SAI13708 0.5705 0.784 0.712 0.993 0.783 0.748 22, 27 and 28: GYA-DT SAI13844 0.5848 0.093 0.268 0.994 0.521 0.395 42, 42 and 43: TSA-TR SAI13847 0.936 0.229 0.314 0.999 0.563 0.438 29, 32 and 33: AVG-YL SAI13953 0.5836 0.344 0.525 0.967 0.503 0.514 43, 41 and 42: FSA-SA SAI13993 0.5893 0.486 0.633 0.997 0.623 0.628 32, 34 and 35: ADA-NT SAI14337 0.5677 0.261 0.387 0.997 0.681 0.534 24, 42 and 43:SKA-DK
DISCUSSION
Assembling the genome with Mosaik and Mira The complete genome sequence of bovine Streptococcus agalactiae is not available yet, only three human S. agalactiae strains NEM316, A909 and 2603V/R are fully sequenced and finished. There are also five draft genomes of human S. agalactiae available i.e CJB111, H36b, 18RS21, COH1, 515 (Tettelin H et al., 2005). We used one of the completely sequenced human S. agalactiae genomes to assemble the short paired end Illumina/Solexa reads of cow S. agalactiae strain 09mas018883. Initially we performed the reference guided assembly of 09mas018883’s 34393016 numbers of reads against three genomes NEM316, A909 and 2603V/R one by one, using mosaik assembler (Hillier LW et al., 2008). The resultant alignment statistics showed maximum percentage of reads alignment (92.2%) against A909 strain, so we continued our analysis using A909 as a reference genome. Then we assembled the filtered reads of 09mas018883 strain against same reference sequence i.e A909, using another assembler called MIRA. The reason we used filtered reads for MIRA assembler was the limitation of RAM. Although MIRA can map more than 80 million Illumina reads but with the availability of high RAM (Chevreux B et al., 1999). The result of MIRA assembler was annotated in the GenComp
23
in--house annotation pipeline that predicted the genes and their functions by using Glimmer, Blast, Muscle and Phylip Protdist tools (Fuxelius HH et al., 2008). We got a draft sequence of bovine S. agalactiae strain 09mas018883 with good average coverage of 346.18 but having 103 gaps in between, which must be containing divergent sequences as compared to the reference sequence. The largest six gaps were 5085, 8108, 9039, 9467, 18779, 37328 bps, repectively. 22 gaps were from 1 to 3 Kbps long, while remaining 75 gaps were of short length. Some of the gaps will be covered in the future by doing the de-novo assembly of short reads and then combining the results of both mapping and de-novo assembly. By reference guided assembly we cannot get large different areas as these are not aligned to the reference; however we can get variations like SNPs and Indels through mapping assembly. The remaining gaps will be closed by the combinatorial PCR. 9272260 short reads used by MIRA assembler generated the consensus sequence of 2127931 bp with average quality of 84 and 733 IUPAC characters (IUPc). Strong unresolved repeat positions (SRMc) were 1308 and Weak unresolved repeat positions (WRMc) were 764; which could be the indication of SNPs and Indels. The GC% was computed as 35.62% that is same as that of other S. agalactiae human strains like NEM316 (Glaser P et al., 2002). While analyzing the potential horizontal gene transfer between bacteria, the deviation from GC content of genome, along with codon usage is considered into account. S. agalactiae lies in the category of low GC gram positive bacteria (Mira A et al., 2004). Annotation with GenComp All the 2129 ORFs generated by Glimmer were used for gene prediction. The same number of genes i.e 2129 has been predicted on the basis of their homology to already sequenced and annotated closely related genomes. Our operons of interest nikABCD exhibiting good level of coverage were all present in the draft genome. All four nikD, nikC, nikB and nikA operons were present at the end of third quarter of circular genome map, occupying 4Kbps region together from 1533880 to 1537988 bps. The coverage range of nikABCD operon was observed as 246-459 (Average coverage: 352.5), 184-472 (Average coverage: 328), 277-459 (Average coverage: 368), 315-399 (Average coverage: 357) respectively. Evolutionary comparison with ClustalX and Dendroscope The phylogenetic trees of nikABCD operons were constructed by using Dendroscope, on the basis of multiple sequence alignment of these operons from S. agalactiae 09mas018883, human A909, 2603V/R, old camel strain, old bovine strain and Fusobacterium strain using ClustalX. The analysis of these trees showed that all operons of different strains showed very short distance from each other, except the nickle operons of Fusobacterium. Only Fusobacterium was too far representing it as outgroup from the clade of S. agalactiae, so we could say that nickle operons nikABCD are horizontally transferred from Fusobacterium to S. agalactiae. This phenomenon could be the cause of pathogenecity of S. agalactiae. Secretory proteins prediction with PrediSi and SignalP The proteins which play a significant part in virulence of Streptococcus agalactiae are surface proteins, secretary proteins and lipoproteins (Glaser P et al., 2002). We identified 194 secretary proteins in the sequence of cow S. agalactiae that are important for the virulence activity of S. agalactiae. Lipoproteins and surface proteins will be identified in future work. We used PrediSi for signal peptides as it handles large amount of data and provides quick results. The PrediSi used
24
threshold or cutoff value to declare a protein as secretary is 0.5000 so total 326 proteins having score > = 0.5 were declared as secretary. Then we matched the secretary proteins identified by PrediSi with the help of SignalP that takes limited amount of data at a time. The proteins classified as secretary proteins by both servers were selected as secretary proteins. Initially we got 326 secretary proteins using PrediSi which were narrowed down to 194 using SignalP. PrediSi pointed the cleavage position as a single residual position from where the mature protein will begin e.g 22nd residue. While the SignalP indicated cleavage position as the point where the cleavage will occur that is between two residues like between 21 and 22; and it also indicated the sequence composition around that site like ACA-AC (Hiller K et al., 2004; Bendtsen JD et al., 2004). The SignalP uses various scores in neural network (NN) plot; C, S, Y score and also S mean and D score. S score is a single residue score that indicates that it’s the part of peptide sequence if it is high or the part of the mature protein if it is low. The C score is the score for cleavage site that is computed for every position and giving significance to one with highest score. Y score is the combined score of S and C score that identifies the accurate cleavage site particularly in case of multiple high peaks of C score. So the C score is selected as cleavage site where the steep slope of S score is observed. The average of S score (as it is for each single residue) gives S-mean that ranges from the residue of N terminal to one with the highest Y score. D score is the average of Y score and S-mean, and if all the scores are low the protein will be non-secretary (Bendtsen JD et al., 2004).
25
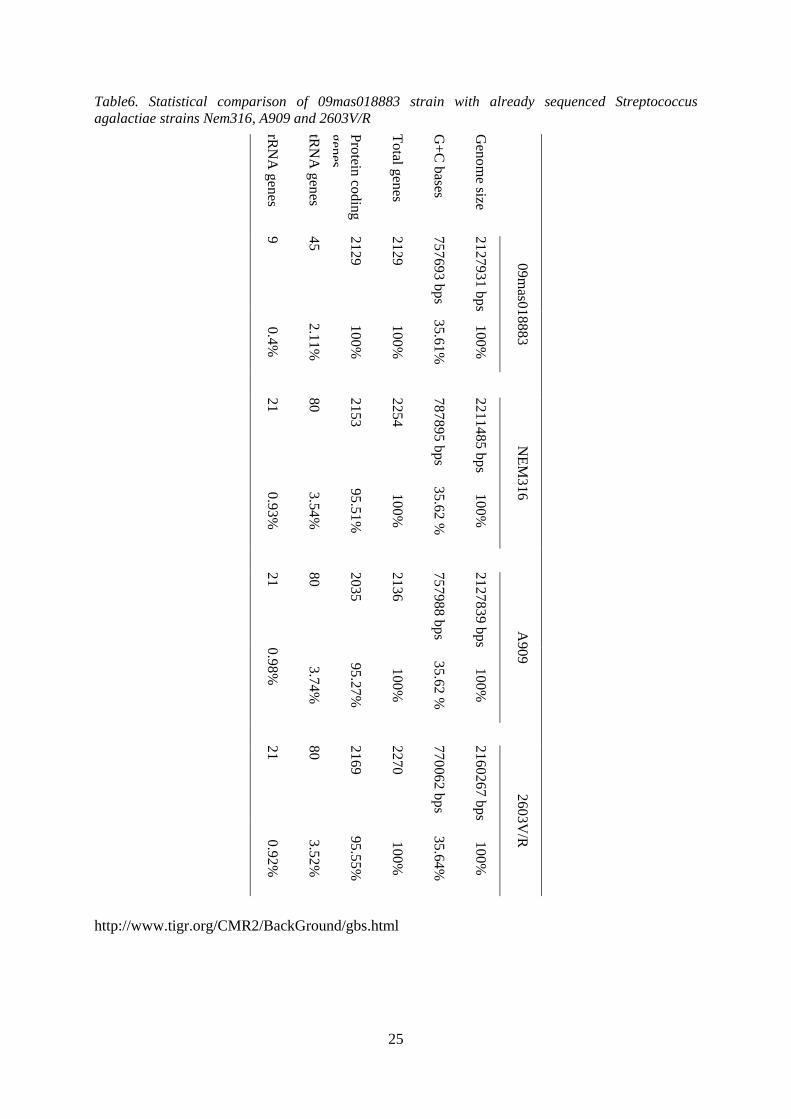
Table6. Statistical comparison of 09mas018883 strain with already sequenced Streptococcus agalactiae strains Nem316, A909 and 2603V/R
rRN
A genes
tRN
A genes
Protein coding genes
Total genes
G+C
bases
Genom
e size
9 45
2129
2129
757693 bps
2127931 bps
09mas018883
0.4%
2.11%
100%
100%
35.61%
100%
21
80
2153
2254
787895 bps
2211485 bps
NEM
316 0.93%
3.54%
95.51%
100%
35.62 %
100%
21
80
2035
2136
757988 bps
2127839 bps
A909
0.98%
3.74%
95.27%
100%
35.62 %
100%
21
80
2169
2270
770062 bps
2160267 bps
2603V/R
0.92%
3.52%
95.55%
100%
35.64%
100%
http://www.tigr.org/CMR2/BackGround/gbs.html
26
CONCLUSION
Streptococcus agalactiae genome contains nikABCD operons which are closely related to nikABCD operons of other S. agalactiae strains; while these operons of Fusobacterium showed large distance to all S. agalactiae strains. This depicts that all S. agalactiae strains are part of the same clade and Fusobacterium is out of this clade; giving some value to our hypothesis that these operons could be horizontally transferred from Fusobacterium. We will finish the genome by doing the de-novo assembly and then comparing it to already done reference-guided assembly; as well as combinatorial PCR of physical gaps appeared in the assembly of cow S. agalactiae genome. The finishing tool will also resolve the mis-assemblies in the sequence. Vaccine development could be successful if it would be effective against all the strains of S. agalactiae along with other Streptococci. There is still a need to sequence newly identified strains of S. agalactiae; the findings from different strains could help us in the development of universal vaccine. Furthermore we will express nickel operons in the E.coli and inject the resultant protein in a model animal like rabbit. The immune response invoked by the animal will be observed by taking the serum and performing serological tests. We identified secretory proteins in bovine S. agalactiae genome, while lipoproteins and surface proteins will be identified in the future; as these all proteins have their role in virulence activity.
ACKNOWLEDGEMENTS
I express my profound thanks to HEC Pakistan for providing me scholarship to complete my studies in research oriented environment. I acknowledge EMBRACE for financing the sequencing, which was funded by the European Commission within its FP6 Program, under the thematic area "Life sciences, genomics and biotechnology for health". I am very grateful to Karl Erik Johansson at SVA, for extracting DNA from Streptococcus agalactiae and also to Ulrika Liljedhal for sequencing the genome and providing us useful information about genome.
REFERENCES Almaw, G., Molla, W. and Melaku, A. (2009) Prevalence of bovine subclinical mastitis in Gondar
town and surrounding areas, Ethiopia. Livestock Research for Rural Development 21, Article #106
Altschul, S.F., Madden, T.L., Schaffer, A.A., Zhang, J., Zhang, Z., Miller, W. and Lipman, D.J. (1997) Gapped BLAST and PSI-BLAST: a new generation of protein database search programs. Nucleic Acids Res 25(17), 3389-3402
Bachaya, H.A., Iqbal, Z., Jabbar, A., Abbas, R.Z. & Ali, R. (2005) Sub-Clinical Bovine Mastitis in Attock District of Punjab (Pakistan). Int J Agri Biol 7(6), 1034-1035
Bendtsen, J.D., Nielsen, H., vonHeijne G. and Brunak, S. (2004) Improved Prediction of Signal Peptides: SignalP 3.0. J Mol Biol 340, 783–795
Berriman, M. and Rutherford, K. (2003) Viewing and annotating sequence data with Artemis. Brief. Bioinformatics 4, 124–132
Blumberg, H.M., Stephens, D.S., Modansky, M., Erwin, M., Elliot, J., Facklam, R.R., et al., (1996) Invasive group B streptococcal disease: the emergence of serotype V. J Infect Dis 173, 365–373
Cady, R. A., Shah, S. K., Schermerhorn, E.C. and McDowell, R. E. (1983) Factors affecting performance of Nili Ravi buffaloes in Pakistan. J Dairy Sci 66, 578-586.
Carver, T., Thomson, N., Bleasby, A., Berriman, M. and Parkhill, J. (2009) DNAPlotter: circular and linear interactive genome visualization. Bioinformatics 25(1), 119–120
27
Chevreux, B., Wetter, T. and Suhai, S. (1999) Genome Sequence Assembly Using Trace Signals and Additional Sequence Information. Computer science and biology: Proceedings of the German Conference on Bioinformatics (GCB) 99, 45-56
Delcher, A.L., Harmon, D., Kasif, S., White, O. and Salzberg, S.L. (1999) Improved microbial gene identification with GLIMMER. Nucleic Acids Res 27, 4636-4641
Edgar, R.C. (2004) MUSCLE: a multiple sequence alignment method with reduced time and space complexity. BMC Bioinformatics 5(1), 113-131
Erskine, R.J. (1992) Mastitis control in dairy herds with high prevalence of subclinical mastitis. Compend Contin Educ Pract Vet 14, 969-979
Felsenstein, J. (1989) PHYLIP -- Phylogeny Inference Package (Version 3.2). Cladistics 5, 164-166
Fullwood, M.J., Wei, C.L., Liu, E.T. & Ruan, Y. (2009) Next-generation DNA sequencing of paired-end tags (PET) for transcriptome and genome analyses. Genome Research 19, 521–532
Fuxelius, H.H., Darby, A.C., Cho, N.H. and Andersson, S.G.E. (2008) Visualization of pseudogenes in intracellular bacteria reveals the different tracks to gene destruction. Genome Biology 9(2), R42
Glaser, P., Rusniok, C., Buchrieser, C., Chevalier, F., Frangeul, L., Msadek, T., Zouine, M., Couvé, E., Lalioui, L., Poyart, C., Trieu-Cuot, P. and Kunst, F. (2002) Genome sequence of Streptococcus agalactiae, a pathogen causing invasive neonatal disease. Molecular Microbiology 45(6), 1499–1513
Hiller, K., Grote, A., Scheer, M., Munch, R. and Jahn, D. (2004) PrediSi: prediction of signal peptides and their cleavage positions. Nucleic Acids Research 32, W375–W379
Hillier, L.W., Marth, G.T., Quinlan, A.R., Dooling, D., Fewell1, G., Barnett, D., Fox, P., Glasscock, J.I., Hickenbotham, M., Huang, W., Magrini, V.J., Richt, R.J., Sander, S.N., Stewart, D.A., Stromberg, M., Tsung, E.F., Wylie, T., Schedl, T., Wilson, R.K. and Mardis, E.R. (2008) Whole-genome sequencing and variant discovery in C. elegans. Nature Methods 5(2), 183-188
Huang, W. and Marth, G. (2008) EagleView: A genome assembly viewer for next-generation sequencing technologies. Genome Res 18(9), 1538–1543
Huang, X. (1992) A contig assembly program based on sensitive detection of fragment overlaps. Genomics 14, 18–25
Huson, D.H., Richter, D.C., Rausch, C., Dezulian, T., Franz, M. and Rupp, R. (2007) Dendroscope: An interactive viewer for large phylogenetic trees. BMC Bioinformatic 8, 460-465
Jones, G. M. (2006) Understanding the basics of mastitis. Virginia State University, USA 404(233), 1-7
Keefe, G.P. (1997) Streptococcus agalactiae mastitis: A review. Can Vet J 38, 429-437 Khan, A.Z. and Muhammad, G. (2005) Quarter-wise comparative prevalence of mastitis in buffaloes
and crossbred cows. Pakistan Vet J 25(1), 9-12 Khan, M.Z. and Khan, A. (2006) Basic facts of mastitis in dairy animals: a review. Pakistan Vet J
26(4), 204-208 Kossaibati, M.A. and Esslemont, R.J. (1997) The costs of production diseases in dairy herds in
England. The Veterinary Journal 154, 41-51 Larkin, M.A., Blackshields, G., Brown, N.P., Chenna, R., McGettigan,P.A., McWilliam, H., Valentin,
F., Wallace, I.M., Wilm, A., Lopez, R., Thompson, J.D., Gibson, T.J. and Higgins, D.G. (2007) Clustal W and Clustal X version 2.0. Bioinformatics 23(21), 2947–2948
Li, H., Ruan, J. and Durbin, R. (2008) Mapping short DNA sequencing reads and calling variants using mapping quality scores. Genome Res 18, 1851-1858
Martinez, G., Harel, J., Higgins, R., Lacouture, S., Daignault, D. & Gottschalk, M. (2000) Characterization of Streptococcus agalactiae Isolates of Bovine and Human Origin
28
by Randomly Amplified Polymorphic DNA Analysis. J Clinic Microbiol 38(1), 71-78
McDonald, J.S. (1977) Streptococcal and Staphylococcal mastitis. J Am Vet Med Assoc 170, 1157-1159
Metzker, M.L. (2010) Sequencing technologies — the next generation. Nat Rev Genet 11(1), 31-46 Milne, I., Bayer, M., Cardle, L., Shaw, P., Stephen, D., Wright, F. and Marshall D. (2010) Tablet—
next generation sequence assembly visualization. Bioinformatics 26(3), 401–402 Mira, A., Pushker, R., Legault, B.A, Moreira D. and Rodriguez-Valera, F. (2004)
Evolutionary relationships of Fusobacterium nucleatum based on phylogenetic analysis and comparative genomics. BMC Evolutionary Biology 4 (50), 1-17
Nishito, Y., Osana, Y., Hachiya, T., Popendorf, K., Toyoda, A., Fujiyama, A., Itaya, M. and Sakakibara, Y. (2010) Whole genome assembly of a natto production strain Bacillus subtilis natto from very short read data. BMC Genomics 11, 243-254
Oliver, S.P. & Mitchell, B.A. (1984) Prevalence of mastitis pathogens in herds participating in a mastitis control program. J Dairy Sci 67, 2436-2440
Peltola, H., Soderlund, H. & Ukkonen, E. (1984) SEQUAID: a DNA sequence assembly program based on a mathematical model. Nucleic Acids Research 12, 307–321
Politis, I., Ng-Kwai-Hang, K.F., (1988) Effects of somatic cell count and milk composition on cheese composition and cheese making efficiency. J Dairy Sci 71, 1720-1727.
Pop, M., Phillippy, A., Delcher, A.L. and Salzberg, S.L. (2004) Comparative genome assembly. Briefingsinbioinformatics 5(3), 237–248
Rutherford, K., Parkhil, J., Crook, J., Horsnell, T., Rice, P., Rajandream, M. and Barrell, B. (2000) Artemis: sequence visualisation and annotation. Bioinformatics 16, 944–945
Schalm, O.W., Carrlole, E.J. and Jain, N.C. (1971) Bovine Mastitis. Philadelphia: Lea and Teliger 1-21
Shearer, J. K. and Harris, B.J. (2003) Mastitis in dairy goats. Anim. Sci. Dept. Florida Coop. Ext. Serv. Inst. Food Agri. Sci; Univ. Fl. Gainesville, USA. pp:1-6.
Sori, H., Zerihun, A. and Abdicho, S. (2005) Dairy Cattle Mastitis In and Around Sebeta, Ethiopia. Intern J Appl Res Vet Med 3(4), 332-338
Stothard, P. and Wishart, D.S. (2006) Automated bacterial genome analysis and annotation. Current Opinion in Microbiology 9, 505-510
Tettelin, H., Masignani, V., Cieslewicz, M.J., Donati, C., Medini, D., Warda, N.L., Angiuoli, S.V., Crabtree, J., Jones, A.L., Durkin, A.S., DeBoy, R.T., Davidsen, T.M., Mora, M., Scarselli, M., Ros I.M., Peterson, J.D., Hauser, C.R., Sundaram, J.P., Nelson, W.C., Madupu, R., Brinkac, L.M., Dodson, R.J., Rosovitz, M.J., Sullivan, S.A., Daugherty, S.C., Haft, D.H., Selengut, J., Gwinn, M.L., Zhoua, L., Zafar, N., Khouri, H., Radune, D., Dimitrov, G., Watkins, K., O’Connor, K.J.B., Smith, S., Utterback, T.R., White, O., Rubens, C.E., Grandi, G., Madoff, L.C., Kaspere, D.L., Telford, J.L., Wessels, M.R., Rappuoli, R. and Fraser, C.M. (2005) Genome analysis of multiple pathogenic isolates of Streptococcus agalactiae: implications for the microbial ‘‘pan-genome’’. PNAS 102(39), 13950–13955
Tettelin, H., Masignani, V., Cieslewicz, M.J., Eisen, J.A., Peterson, S., Wessels, M.R., Paulsen, I.T., Nelson, K.E., Margarit, I., Read, T.D., Madoff, L.C., Wolf, A.M., Beanan, M.J., Brinkac, L.M., Daugherty, S.C., DeBoy, R.T., Durkin, A.S., Kolonay, J.F., Madupu, R., Lewis, M.R., Radune, D., Fedorova, N.B., Scanlan, D., Khouri. K., Mulligan, S., Carty, H.A., Cline, R.T., Van Aken, S.E., Gill, J., Scarselli, M., Mora, M., Iacobini, E.T., Brettoni, C., Galli, G., Mariani, M., Vegni, F., Maione, D., Rinaudo, D., Rappuoli, R., Telford, J.L., Kasper, D.L., Grandi, G. and Frase, C.M. (2002) Complete genome sequence and comparative genomic analysis of an emerging human pathogen, serotype V Streptococcus agalactiae. PNAS 99(19), 12391–12396
29
Varatanović, N., Katica, A., Mutevelić, T., Čengić, B., Mlaćo, N. and Hamzić, E. (2009) Research of mastitis prevalence at heifers in farm breeding. Biotechnology in Animal Husbandry 25(1-2), 73-80