Who? - World Agroforestry Centre · Meine van Noordwijk, Betha Lusiana, Beria Leimona, Sonya Dewi,...
68
Negotiation-support toolkit for learning landscapes WORLD AGROFORESTRY CENTRE Southeast Asia Regional Program Who? So what? How, what? Why? Where, when? Who cares?
Transcript of Who? - World Agroforestry Centre · Meine van Noordwijk, Betha Lusiana, Beria Leimona, Sonya Dewi,...

Negotiation-support toolkit for learning landscapes
WORLD AGROFORESTRY CENTRESoutheast Asia Regional Program
Who?
So what?
How, what?W
hy?
Whe
re, w
hen?
Who
care
s?


Negotiation-support toolkit for learning landscapes
WORLD AGROFORESTRY CENTRESoutheast Asia Regional Program
Editors
Meine van Noordwijk, Betha Lusiana, Beria Leimona, Sonya Dewi, Diah Wulandari
Authors
Ai Farida, Andree Ekadinata, Arif Rahmanulloh, Atiek Widayati, Aulia Perdana, Beria Leimona, Betha Lusiana, Bruno Verbist, Carsten Marohn, Dam Viet Bach, Degi Harja, Delia Catacutan, Desi A. Suyamto, Elisabeth Simelton, Elok Mulyoutami, Endri Martini, Fahmuddin Agus, Fergus Sinclair, Feri Johana, Gamma Galudra, Georg Cadisch, Grace B. Villamor, Gregoire Vincent, Hesti Lestari Tata, Hoang Minh Ha, Iwan Kurniawan, James M. Roshetko, Janudianto, Jenny C. Ordonez, Jihad, Jules Bayala, Kurniatun Hairiah, Laxman Joshi, Lisa Tanika, Martua Sirait, Maswar Bahri, Meine van Noordwijk, Muhammad Sofiyuddin, Ni’matul Khasanah, Noviana Khususiyah, Nurhariyanto, Pandam N. Prasetyo, Peter A. Minang, Pham Thu Thuy, Rachmat Mulia, Reny Juita, Retno Maryani, Robert Finlayson, Rodel Lasco, Rudy H. Widodo, Sandra Velarde, Sara Namirembe, Sébastien de Royer, Sonya Dewi, Subekti Rahayu, Suseno Budidarsono, Suyanto, Ujjwal Pradhan
LAnguAgE Editors
Robert Finlayson and Ruth Raymond

ii Negotiation-Support Toolkit for Learning Landscapes
Citation Van Noordwijk M, Lusiana B, Leimona B, Dewi S, Wulandari D, eds. 2013. Negotiation-support toolkit for learning landscapes. Bogor, Indonesia: World Agroforestry Centre (ICRAF) Southeast Asia Regional Program.
This is volume 2 of a series. Volume 1 is:
Van Noordwijk M, Hoang MH, Neufeldt H, Öborn I, Yatich T, eds. 2011. How trees and people can co-adapt to climate change: reducing vulnerability through multifunctional agroforestry landscapes. Nairobi, Bogor: World Agroforestry Centre (ICRAF).
Disclaimer and copyright The World Agroforestry Centre (ICRAF) holds the copyright to its publications and web pages but encourages duplication, without alteration, of these materials for non-commercial purposes. Proper citation is required in all instances. Information owned by others that requires permission is marked as such. The information provided by the Centre is, to the best of our knowledge, accurate although we do not guarantee the information nor are we liable for any damages arising from use of the information.
Website links provided by our site will have their own policies that must be honoured. The Centre maintains a database of users although this information is not distributed and is used only to measure the usefulness of our information. Without restriction, please add a link to our website www.worldagroforestry.org on your website or publication.
ISBN 978-979-3198-74-3
World Agroforestry Centre
Southeast Asia Regional ProgramJl. CIFOR, Situ Gede, Sindang Barang, Bogor 16115[PO Box 161 Bogor 16001] IndonesiaTel: +(62) 251 8625 415Fax: +(62) 251 8625416Email: [email protected]/regions/southeast_asia
Cover images The front and back page photographs were taken in Sumberjaya, Lampung province, Indonesia, where the negotiation-support terminology originated: in a landscape with settlers’ coffee farms (front cover), a major conflict with forest authorities emerged that lead to evictions, in the context of a hydropower scheme. Reconsideration of how watershed functions could be maintained led to negotiated agreements (back cover) with local communities, providing them with tenure security. Photos: Meine van Noordwijk. Design and layout Riky Mulya Hilmansyah and Tikah Atikah
2013
iiiNegotiation-Support Toolkit for Learning Landscapes
Preface
At the time of writing, the world’s attention is turning to the Sustainable Development Goals as a follow on from the uneven success achieved through the Millennium Development Goals. We need to go beyond the jargon and find out what the many manifestations of unsustainable development are and how the landscapes where these occur can be managed on a path towards recovery, if possible without the loss of local livelihoods.
Integrated natural resource management requires site-specific understanding of the various trade-offs between the goods and services that agro ecosystems can provide. In the past 15 years, we have learned that a landscape approach is needed owing to the many interactions that occur at this scale, both in ecological and in social policy terms.
Resource managers in national and sub-national institutions that interact with the private sector, local communities and migrants need access to cost-effective, replicable tools, methods and approaches to appraise the likely impacts of new technologies and changes in market access and to support evidence-based negotiations over contentious issues. Such issues are likely to arise along with land conversion and intensification and need to be understood in management terms because although the problems would probably not exist if there were no people, excluding people is only an option under very specific conditions. Most of the issues have to be resolved in negotiation with local communities and other stakeholders. We have therefore left the ‘decision support’ language for use in a restricted set of single-decision-maker situations and focus instead on negotiation support.
The World Agroforestry Centre in Southeast Asia has pioneered negotiation-support approaches in high-conflict landscapes in Indonesia. For wider application, however, a need was identified for tools (used in the widest sense to include methods, approaches and computer models) that allow rapid appraisals of landscapes, conflict over land tenure, markets, hydrology, agrobiodiversity and carbon stocks. Simulation models at various scales (for example, tree and crop interaction at the plot level, water flows in landscapes, land-use-change dynamics) can be used to combine generic insights with the specific properties of any new location. The toolkit that emerged from this effort has been tested in settings throughout Southeast Asia with staff of various national institutions. New situations brought new demands for additional tools or combinations of tools and thus the toolkit became bigger. While we have more detailed manuals and descriptions for many of the tools and examples of their application, the overview that you’ll find in this volume is meant to show the interconnectedness of the tools and their underlying conceptualization of the constantly evolving set of issues.
iv Negotiation-Support Toolkit for Learning Landscapes
We acknowledge the feedback from many participants in training courses, colleagues who started to use (or at least try out) the methods, discussants in workshops who helped sharpen the tools’ articulation and descriptions. We appreciate the funding sources that include, but are not restricted to, Bundesministerium für Wirtschaftliche Zusammenarbeit und Entwicklung (BMZ/Federal Ministry for Economic Cooperation and Development) for the Trees in Multi-Use Landscapes in Southeast Asia project), International Fund for Agricultural Development (for the Rewarding Upland Poor for Environmental Services project), Norwegian Agency for Development Cooperation (for the Reducing Emissions from All Land Uses project) and the CGIAR Research Program on Forests, trees and Agroforestry.
We appreciate the language editing by Robert Finlayson and Ruth Raymond and the design by Tikah Atikah and Riky Mulya Hilmansyah. We look forward to further comments and suggestions for improvement and refinement and apologize for any shortcomings.
On behalf of the editors
Meine van Noordwijk
Chief Science Advisor
World Agroforestry Centre

vNegotiation-Support Toolkit for Learning Landscapes
Contents
PrefaCe III
INtroDuCtIoN 1
SeCtIoN 1. uNDerStaNDINg CoNtext: multIfuNCtIoNal laNDSCaPe moSaICS 15
1. Participatory landscape appraisal (PaLA) 16
2. Participatory analysis of poverty, livelihoods and environment dynamics (PAPoLD) 22
3. Rapid appraisal of drivers of land-use change (DriLUC) 27
SeCtIoN 2. lIveS, laND uSe aND lIvelIhooDS: treeS, agroforeStry teChNology aND marketS 35
4. Rapid appraisal of agroforestry practices, systems and technology (RAFT) 36
5. Local ecological knowledge: agroecological knowledge toolkit (AKT5) 43
6. Land-use profitability analysis (LUPA) 47
7. Rapid market appraisal (RMA) 52
8. Gender roles in land use and value chains (GRoLUV) 55
9a. Tree diversity and tree–site matching (WhichTreeWhere?) 61
9b. Gender perspectives in selecting tree species (G-TreeFarm) 69
10. Access to trees of choice (NotJustAnyTree) 75
11. Climate-change opportunities offered by local trees (CooLTree) 80
12. Tree and farming system resilience to climate change and market fluctuations (Treesilience) 83
2.B. SImulatIoN moDelS at tree-to-farm SCale 90
13. Functional branch analysis (FBA): tree architecture and allometric scaling 90
14. Simple light interception model (SLIM) 94
15. Water, nutrient and light capture in agroforestry systems (WaNuLCAS): at the plot level 98
16. Spatially explicit individual-based forest simulator (SExI-FS): for management of agroforests 103
17. Adopt and learn: modelling decision making and information flow 107
SeCtIoN 3. laNDSCaPe: eCoSyStem ServICeS, traDe-offS 109
18. Analysis of land-use and -cover trajectory (ALUCT) 110
19. Trade-off matrix between private and public benefits of land-use systems (ASB Matrix) 118
20. Rapid hydrological appraisal (RHA): watershed functions and management options 120
21. Rapid landslide mitigation appraisal (RaLMA): managing trees for improved slope stability 126
22. Participatory water monitoring (PaWaMo) 131

vi Negotiation-Support Toolkit for Learning Landscapes
23. Rapid agro-biodiversity appraisal (RABA) 134
24. Quick biodiversity survey (QBSur) 139
25. Rapid carbon stock appraisal (RaCSA) 143
26. Reducing emissions from peatlands (REPEAT) 148
27. Re-assessing oxygen supply and air quality (ROSAQ) 153
28. Biofuel emission reduction estimator scheme (BERES): land-use history, production systems and technical emission factors 157
3.B. ComPutaBle moDelS at laNDSCaPe SCale 163
29. Generic river flow at landscape level (GenRiver) 163
30. Flow persistence (FlowPer) 171
31. Rainfall Simulator (RainyDay) and Spatial Rainfall (SpatRain) 174
32. Land-use-change impact assessment (LUCIA ) 180
33. Polyscape 186
34. Forest, agroforest, low-value landscape or wasteland (FALLOW) 189
35. Ecological corridors (ECor): a distributed population model with gender specificity 194
36. REDD Abacus SP 197
SeCtIoN 4. traNSformatIoNS: goverNaNCe, rIghtS 201
37. Rapid land tenure assessment (RaTA): understanding land tenure conflicts 202
38. Why No Tree? (WNoTree) analysis of agroforestry constraints 206
39. Fair and efficient REDD value chains allocation (FERVA) 210
40. Rapid assessment of institutional strengths, networks and actors (RISNA) 215
41. REDD/REALU site-level feasibility appraisal (RESFA) 218
42. Trade-off analysis for land-use scenarios (TALaS) 222
43. Scenario tools: land-use planning for low-emissions development strategies (LUWES) 226
44. Capacity-strengthening approach to vulnerability assessment (CaSAVA) 234
SeCtIoN 5. NegotIatIoN SuPPort aS ProCeSS 239
45. Assessing and adopting social safeguards in all planned programs (AASSAPP) 240
46. RUPES role-play game (RPG) 245
47. Conservation auction and environmental services’ enhancement (Con$erv) 249
48. Multi-scale payments-for-environmental services’ paradigms (MuScaPES) 253
49. Integration 258
refereNCeS 262
lISt of CoNtrIButorS aND theIr INStItutIoNal affIlIatIoN 280
gloSSary of termS aND aCroNymS 284

1Negotiation-Support Toolkit for Learning Landscapes
In Volume 1 of this series (van Noordwijk et al 2011), we looked at the opportunities for people and trees to co-adapt to changing climates and all the other changes that occur in landscapes, whether they are at the tropical forest margins, in the urban fringe or anywhere in between. Specifically, we formulated the hypothesis that
Investment in institutionalising rewards for the environmental services that are provided in multifunctional landscapes with trees is a cost-effective and fair way to reduce vulnerability of rural livelihoods to climate change and to avoid larger costs of specific ‘adaptation’ while enhancing carbon stocks in the landscape.
The book unpacked this rather rich and concept-laden sentence and looked at available evidence. The overall conclusion was that context matters so much that generic statements about forests, trees and agroforestry have little more than indicative value: assessment tools are needed to drill down to the specifics of any landscape where action is deemed desirable. Yet, we don’t need long-term and expensive studies to rediscover the wheel in any new place: as we present here in this volume, we now have a fairly elaborate toolkit of methods that can be used to support negotiations between local stakeholders on issues that address livelihoods, landscapes and the ecosystem services they provide. The methods were designed with reasonable cost (~USD 10 000) and time-span (< 6 months) in mind.
■ Multifunctional landscapesWe are using the term ‘landscape’ here as an important scale in the nested socio-ecological systems that encompass global issues such as the number of people on the planet, the lifestyles to which they aspire and the limitations of current patterns of resource use (Figure 0.1). The landscape scale is a meeting point for bottom–up approaches that start from local aspirations and top–down restrictions on local resource use, in view of (negative) external effects of local land-use change, such as loss of watershed functions, biodiversity and contributions to climate change.
Figure 0.1. A landscape as the interaction between human actions, ecosystems and the abiotic factors that shape the physical environment
Introduction
The ediTors
Institutions People
landscape
Geology Land- forms Climate
Vegetation Flora & Fauna
Hydrology
Planning, Incentives
Value Chains Landscape
Mul
tifun
ctio
nalit
yTe
nure
land-use systems
functions, services
Space

2 Negotiation-Support Toolkit for Learning Landscapes
Three key elements of a multifunctional landscape are farming, natural vegetation and tree-based value chains. They can be spatially segregated (‘agro‘ versus ‘forest’ versus ‘trees’) or more finely integrated in landscape mosaics that are described as ‘agroforestry’ (Figure 0.2).
Figure 0.2. Different options for spatial arrangements and patterns of three key elements of multifunctional landscapes that can be seen as a gradient from ‘integrated’ to ‘segregated’ solutions
Perceptions of the desirability of more segregated or more integrated solutions for a landscape differ between stakeholders. These preferences involve knowledge, attitude, skills and aspirations. We cannot expect that knowledge as such, even if it was supported by strong evidence, can shift attitudes, skills and aspirations. To be effective, the advance of scientific knowledge cannot be separated from what stakeholders in a landscape know, feel, can do and aspire to. We need to understand landscapes as dynamic socio-ecological systems driven by feedback loops. One such feedback loop (Figure 0.3) is of specific interest here, as it relates to the options for landscapes to retain multifunctionality and buffer capacity, which are needed to deal with future uncertainties and change.

3Negotiation-Support Toolkit for Learning Landscapes
Figure 0.3. Six groups of landscape questions
Note: The question groups are logically related and jointly lead to a deeper understanding of the landscape as a feedback system in which the consequences of decisions and actions are themselves influencing future actions and decisions, even if the consequences were borne by other than the primary decision makers
Figure 0.4. Stages in the interaction between the landscape and human land use
Note: Land use interacts with land form and land cover, which are themselves related to geology , soil formation, flora, fauna and climate. Early stage (A) dependence of land use on the landscape at its niches is transformed to a a stage (B) where land use dominates
■ Negotiation supportWe explicitly use the term ‘negotiation support’ rather than ‘decision support’ (Figure 0.5) because in all landscapes we know there are multiple stakeholders with multiple interests and multiple claims to knowledge and understanding, with multiple types of empirical experience on which such knowledge is based. Discussions about ‘who has the right to do what where’ tend to be difficult because of all these layers of complexity.
Who makes a living here, what is ethnic identity, historical origin, migrational history, claims to land-use rights, role in main value chains, what are key power relations?
What are the drivers of current human activity and what are levers (regulatory framework, economic incentives, motivation) for modifying future change?
Which land-use patterns with or without trees are prominent in the landscape and provide the basis for local lives and livelihoods? What value chains are based on these land uses?
Who is affected by or benefits from the changes in tree cover and associated ecosystem services? How are stakeholders organized and empowered to influence the drivers?
How does tree cover vary in the landscape (patterns along a typical cross-section, main gradients), and how has it decreased and increased over time?
How do ecosystem services (provisioning, regulating, cultural/religious, supporting) depend on tree cover and the spatial organization of the landscape?
Geological history, patterns & current activity
Flora and fauna and its biogeography
Landforms, vegetation, ecosystems, hydrology
A. Initial human land useLand use is predictable from ‘reading the landscape’
Land use dominates over original terrain features
B. Late-stage human land use
Global climate systems based on oceans, land & atmosphere
C. The transition is predictable
4 Negotiation-Support Toolkit for Learning Landscapes
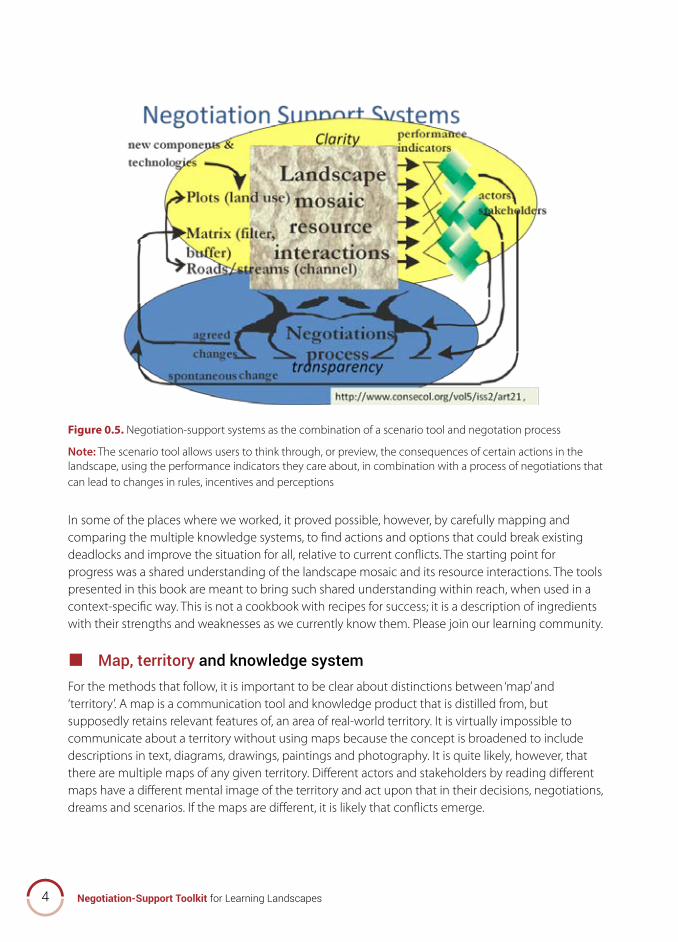
Figure 0.5. Negotiation-support systems as the combination of a scenario tool and negotation process
Note: The scenario tool allows users to think through, or preview, the consequences of certain actions in the landscape, using the performan ce indicators they care about, in combination with a process of negotiations that can lead to changes in rules, incentives and perceptions
In some of the places where we worked, it proved possible, however, by carefully mapping and comparing the multiple knowledge systems, to find actions and options that could break existing deadlocks and improve the situation for all, relative to current conflicts. The starting point for progress was a shared understanding of the landscape mosaic and its resource interactions. The tools presented in this book are meant to bring such shared understanding within reach, when used in a context-specific way. This is not a cookbook with recipes for success; it is a description of ingredients with their strengths and weaknesses as we currently know them. Please join our learning community.
■ Map, territory and knowledge systemFor the methods that follow, it is important to be clear about distinctions between ‘map’ and ‘territory’. A map is a communication tool and knowledge product that is distilled from, but supposedly retains relevant features of, an area of real-world territory. It is virtually impossible to communicate about a territory without using maps because the concept is broadened to include descriptions in text, diagrams, drawings, paintings and photography. It is quite likely, however, that there are multiple maps of any given territory. Different actors and stakeholders by reading different maps have a different mental image of the territory and act upon that in their decisions, negotiations, dreams and scenarios. If the maps are different, it is likely that conflicts emerge.

5Negotiation-Support Toolkit for Learning Landscapes
Figure 0.6. Maps and a territory in their relation with decision making
Note: Multiple stakeholders tend to use different maps and perceive them to be the reality of the territory
In the above, we can replace the word ‘map’ by ‘knowledge system’. Three broad categories of knowledge systems are 1) the local ecological knowledge derived by people with a long-term track record of survival in the territory; 2) public opinion and the policies it supports; and 3) science and its multiple disciplines (including physics, chemistry, biology, ecology, geography, economics, and social and political science) and multiple maps and models. If all stakeholders used the same map, it would be difficult enough to reconcile their various interests and negotiate a course of action that optimized damage and gains for all, within the political reality of the broader system context. By maintaining different maps, and by assuming that one’s own map conforms to the territory in the real world, the conflicts can become intractable. Negotiation-support systems, therefore, invest considerable effort in creating a ‘map of maps’. An inventory of the various maps being used can lead to a clarification of contrasts and similarity, identify the position and size of ‘white spots’ and straighten contradictions.
Each of the three knowledge systems tends to see its own map as superior to others, even if it may acknowledge that its map is not the territory. That’s true for science, for public knowledge and for local knowledge systems. Each may have very good reasons to think that their map is better than others, as it was modified over time to serve its prime functions, which differ between the stakeholders. Although it is hard for any but the most dogmatic to maintain that learning isn’t possible, contrasts between theory and practise tend to persist in each of the knowledge systems. As science is one of the three knowledge systems identified here, it is attractive for science to put its knowledge system on a pedestal and claim that scientists know more and have better ways of adjusting maps than any of the others. This may be true, it might not be. It doesn’t help, however, to maintain such a claim of superiority if we want to help to resolve conflicts between local stakeholders and the public and private sector maps of the territory and associated claims on access rights and restrictions on what can be done. A more humble starting position, which first of all aims for a ‘we-agree-to-disagree’ stage in the negotiations, can lead to learning by all and the emergence of new solutions.
Territory in real world dynamics
Territory imagined and acted upon in decisions, negotiations and dreams
Map 1 constructed Map 1 receivedMap 2 constructed Map 2 received
Map 3 constructed Map 3 received
actions that influence or modify the territory and access to it

6 Negotiation-Support Toolkit for Learning Landscapes
Figure 0.7. Triangular relations between three broad groups of knowledge systems
Note: Shows the internal distinctions and divisions as they relate to the reality of a learning landscape
Figure 0.8. Modified form of Figure 0.5 with a unified single knowledge map
Note: Retains the multiple interpretations that are linked to stakeholders’ goals and interests
■ Learning landscapesLearning landscapes are characterized by a commitment to learning by doing, by experimenting and by shared reflection on what has and what hasn’t been achieved. Our toolkit for negotiation support in learning landscapes emphasizes the exploration of three main knowledge systems in the way they relate to various aspects of the landscapes that shape the lives and livelihoods of the people who live in them. Beyond the current state of the knowledge system, our interest is in how each of the knowledge systems can change in response to ‘new facts’.
After mapping the knowledge systems together with the stakeholders as much as possible,
Territory in real world dynamics
Territory imagined and acted upon in decisions, negotiations and dreams
Map received 1Map received 2
Map received 3
actions that influence or modify the territory and access to it
One Map negotiated
7Negotiation-Support Toolkit for Learning Landscapes
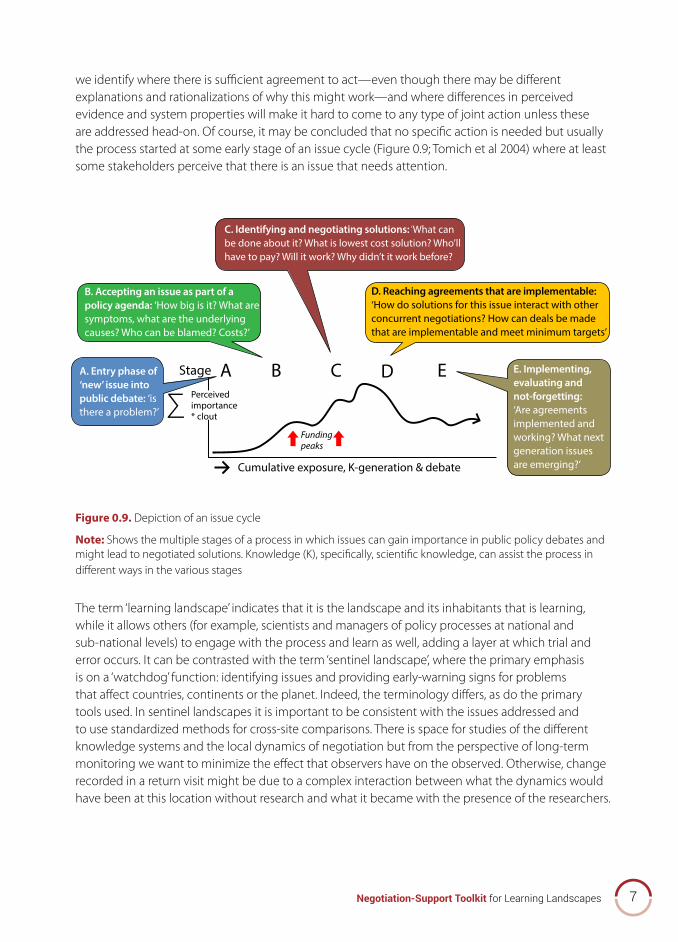
C. Identifying and negotiating solutions: ‘What can be done about it? What is lowest cost solution? Who’ll have to pay? Will it work? Why didn’t it work before?
Cumulative exposure, K-generation & debate
a. entry phase of ‘new’ issue into public debate: ‘is there a problem?’
B. accepting an issue as part of a policy agenda: ‘How big is it? What are symptoms, what are the underlying causes? Who can be blamed? Costs?’
e. Implementing, evaluating and not-forgetting: ‘Are agreements implemented and working? What next generation issues are emerging?’
D. reaching agreements that are implementable: ‘How do solutions for this issue interact with other concurrent negotiations? How can deals be made that are implementable and meet minimum targets’
∑AStage B C D E
Perceived importance * clout
Funding peaks
we identify where there is sufficient agreement to act—even though there may be different explanations and rationalizations of why this might work—and where differences in perceived evidence and system properties will make it hard to come to any type of joint action unless these are addressed head-on. Of course, it may be concluded that no specific action is needed but usually the process started at some early stage of an issue cycle (Figure 0.9; Tomich et al 2004) where at least some stakeholders perceive that there is an issue that needs attention.
Figure 0.9. Depiction of an issue cycle
Note: Shows the multiple stages of a process in which issues can gain importance in public policy debates and might lead to negotiated solutions. Knowledge (K), specifically, scientific knowledge, can assist the process in different ways in the various stages
The term ‘learning landscape’ indicates that it is the landscape and its inhabitants that is learning, while it allows others (for example, scientists and managers of policy processes at national and sub-national levels) to engage with the process and learn as well, adding a layer at which trial and error occurs. It can be contrasted with the term ‘sentinel landscape’, where the primary emphasis is on a ‘watchdog’ function: identifying issues and providing early-warning signs for problems that affect countries, continents or the planet. Indeed, the terminology differs, as do the primary tools used. In sentinel landscapes it is important to be consistent with the issues addressed and to use standardized methods for cross-site comparisons. There is space for studies of the different knowledge systems and the local dynamics of negotiation but from the perspective of long-term monitoring we want to minimize the effect that observers have on the observed. Otherwise, change recorded in a return visit might be due to a complex interaction between what the dynamics would have been at this location without research and what it became with the presence of the researchers.
8 Negotiation-Support Toolkit for Learning Landscapes
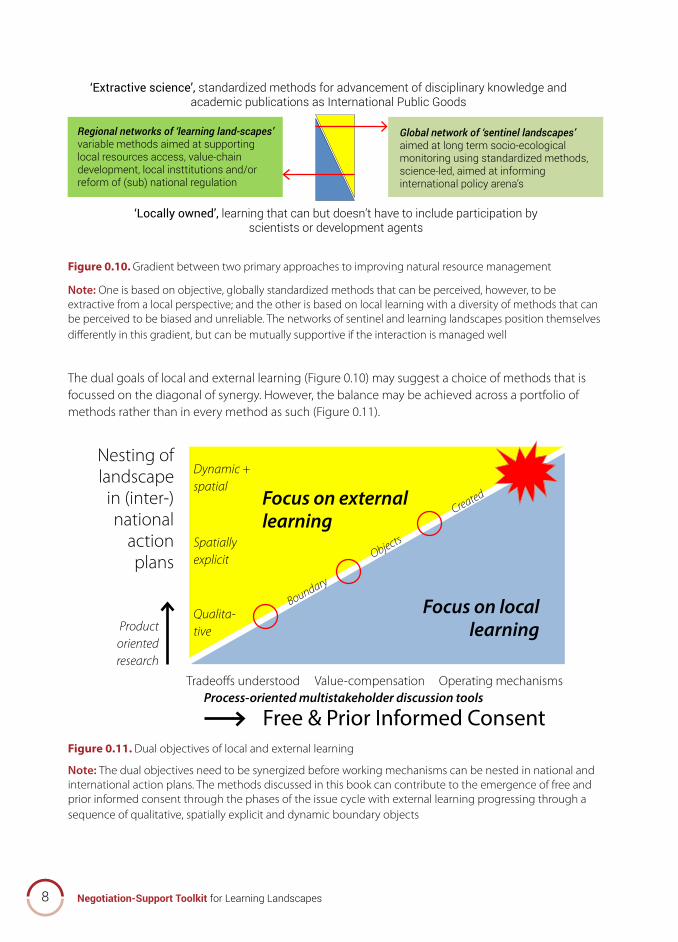
Figure 0.10. Gradient between two primary approaches to improving natural resource management
Note: One is based on objective, globally standardized methods that can be perceived, however, to be extractive from a local perspective; and the other is based on local learning with a diversity of methods that can be perceived to be biased and unreliable. The networks of sentinel and learning landscapes position themselves differently in this gradient, but can be mutually supportive if the interaction is managed well
The dual goals of local and external learning (Figure 0.10) may suggest a choice of methods that is focussed on the diagonal of synergy. However, the balance may be achieved across a portfolio of methods rather than in every method as such (Figure 0.11).
Figure 0.11. Dual objectives of local and external learning
Note: The dual objectives need to be synergized before working mechanisms can be nested in national and international action plans. The methods discussed in this book can contribute to the emergence of free and prior informed consent through the phases of the issue cycle with external learning progressing through a sequence of qualitative, spatially explicit and dynamic boundary objects
Nesting of landscape
in (inter-) national
action plans
Product oriented research
Boundary
Objects
Created
Qualita-tive
Spatially explicit
Dynamic + spatial
Tradeoffs understoodProcess-oriented multistakeholder discussion tools
Free & Prior Informed Consent
Focus on local learning
Focus on external learning
Value-compensation Operating mechanisms
‘Extractive science’, standardized methods for advancement of disciplinary knowledge and academic publications as International Public Goods
‘Locally owned’, learning that can but doesn’t have to include participation by scientists or development agents
Regional networks of ‘learning land-scapes’ variable methods aimed at supporting local resources access, value-chain development, local insttitutions and/or reform of (sub) national regulation
Global network of ‘sentinel landscapes’ aimed at long term socio-ecological monitoring using standardized methods, science-led, aimed at informing international policy arena’s

9Negotiation-Support Toolkit for Learning Landscapes
■ Leading towards co-investment in environmental servicesIn line with the central hypothesis of Volume I, which was quoted at the start of this introduction, negotiation support may lead to investment in institutionalising rewards for environmental services. From the experience in developing countries, as summarized by van Noordwijk et al (2012) and Namirembe et al (2014), we learned that such co-investment must meet three important criteria.1. realistic: Interventions need to be based on knowledge of the area’s ecosystem functions and
natural capital (including vegetation, flora and fauna, watershed functions), of processes of degradation and regeneration and the way such processes depend on the landscape, land use and a changing climate. They also need to take into account the trade-offs between economic benefits from land-use change and the consequences for measurable environmental services.
2. voluntary: The mechanisms need to respect existing property and land-use rights and follow principles of free and prior informed consent. Any agreements with local communities require a shared understanding of the issues and options for fulfilling them.
3. Conditional: Any economic incentives must be performance-based and thus require systems for monitoring changes in biodiversity, agrobiodiversity, watershed functions and/or carbon stocks in the landscape that can be implemented locally and that relate to the real interests of local stakeholders.
In many cases, the co-investment will also have to address existing poverty and at a minimum do no harm but explicit targets of being pro-poor, beyond moral considerations, will generally increase the acceptability of any program and the chances that it will become a success. Similarly, explicit attention to the gender dimension is relevant and may give opportunity to jointly achieve sustainable development goals that relate to gender and those that relate to environmental quality.
■ Leverage points in complex social-ecological systemsNegotiation support is meant to facilitate change that contributes towards solutions of, often complex, problems at the poverty and environment nexus. Although the emphasis here is on ‘knowledge’ in its multiple forms, it is clear that knowledge is only one of several aspects that contribute to action: power and aspirations of stakeholders are at least as important. However, power and knowledge interact, as do aspirations and knowledge (Figure 0.12).
Figure 0.12. Action and changes on the ground will depend on knowledge, aspirations and power
Action
Knowledge
Aspirations
Power
10 Negotiation-Support Toolkit for Learning Landscapes
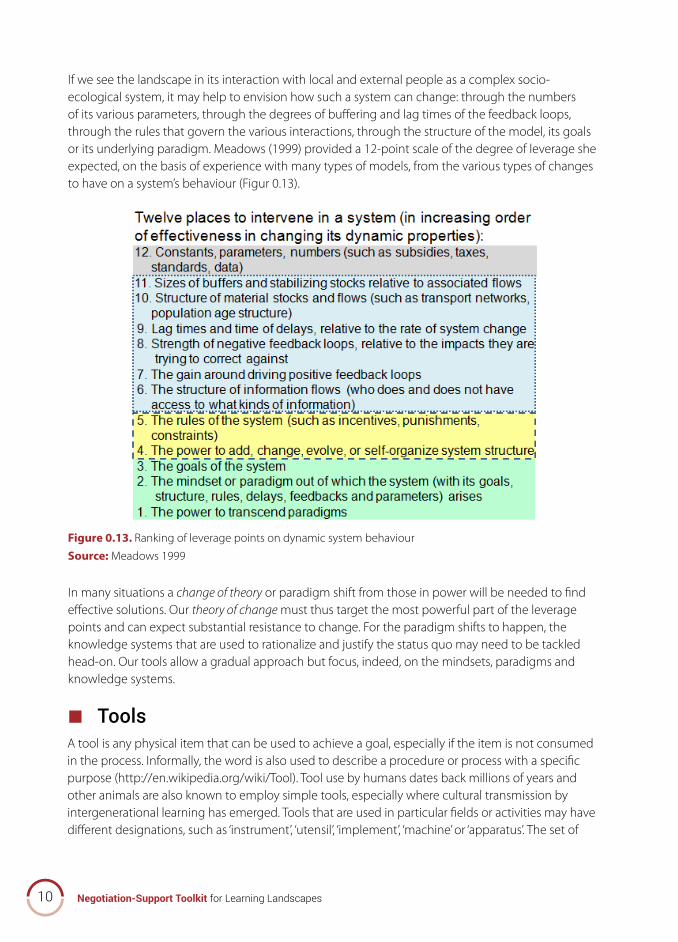
If we see the landscape in its interaction with local and external people as a complex socio-ecological system, it may help to envision how such a system can change: through the numbers of its various parameters, through the degrees of buffering and lag times of the feedback loops, through the rules that govern the various interactions, through the structure of the model, its goals or its underlying paradigm. Meadows (1999) provided a 12-point scale of the degree of leverage she expected, on the basis of experience with many types of models, from the various types of changes to have on a system’s behaviour (Figur 0.13).
Figure 0.13. Ranking of leverage points on dynamic system behaviour
Source: Meadows 1999
In many situations a change of theory or paradigm shift from those in power will be needed to find effective solutions. Our theory of change must thus target the most powerful part of the leverage points and can expect substantial resistance to change. For the paradigm shifts to happen, the knowledge systems that are used to rationalize and justify the status quo may need to be tackled head-on. Our tools allow a gradual approach but focus, indeed, on the mindsets, paradigms and knowledge systems.
■ ToolsA tool is any physical item that can be used to achieve a goal, especially if the item is not consumed in the process. Informally, the word is also used to describe a procedure or process with a specific purpose (http://en.wikipedia.org/wiki/Tool). Tool use by humans dates back millions of years and other animals are also known to employ simple tools, especially where cultural transmission by intergenerational learning has emerged. Tools that are used in particular fields or activities may have different designations, such as ‘instrument’, ‘utensil’, ‘implement’, ‘machine’ or ‘apparatus’. The set of

11Negotiation-Support Toolkit for Learning Landscapes
tools needed to achieve a goal is called ‘equipment’ or a ‘toolkit’. Like a physical toolkit with hammers, screwdrivers, spanners and saws, the toolkit we discuss here is full of instruments that can be used well but also misused to cause more harm than good.
In this book, we describe the tools according to the following format.
• Title (ACRONYM)• Names of the authors of the description of the tool (see list of current addresses of authors at
the end of the book)• A short explanation of what the tool does (in a box)• Introduction of the issues that the tool is meant to address• The objectives of the tool• The steps involved in using the tool• An example of the tool in action• Key references that provide more details (for example, a manual or report). Other references are
compiled at the end of the book
Box: ethics of interacting with indigenous or traditional knowledge
The World Agroforestry Centre’s policy acknowledges the complexity of the evolving legal frameworks that protect indigenous and traditional knowledge and requires researchers to comply with national standards as well as act in the spirit of international treaties. See
http://www.worldagroforestrycentre.org/sites/default/files/ICRAF_policy_indig%26tradknowl.pdf
The basic reference in this field is
Hansen SA, van Fleet JW. 2003. Traditional knowledge and intellectual property: a handbook on issues and options for traditional knowledge holders in protecting their intellectual property and maintaining biological diversity. Washington, DC: American Association for the Advancement of Science.
Recent analysis has focussed on the need to strike a balance between legal protection of intellectual property rights and the need to ensure cultural preservation and access to knowledge (Andanda 2012). Engaging with traditional knowledge systems in ways that enhance understanding, respect and recognition, while protecting them from ‘grabs’ by private sector entities, is to be encouraged.
Andanda P. 2012. Striking a balance between intellectual property protection of traditional knowledge, cultural preservation and access to knowledge. Journal of Intellectual Property Rights 17:547–558. http://nopr.niscair.res.in/bitstream/123456789/15023/1/JIPR%2017(6)%20547-558.pdf.
For guidance on broader issues of research ethics, see http://www.worldagroforestry.org/downloads/policies%20and%20guidelines/ICRAF_policy_research_ethics.pdf.
The basic ethical principles
1. respect for persons: incorporates at least two ethical convictions: 1) that individuals should be treated as autonomous agents; and 2) that persons with diminished autonomy are entitled to protection.
2. Beneficence: Researchers have an obligation to strive to ensure benefits to both individuals and society while minimising the risk of harm.
3. Justice: Researchers have an obligation to do all within their power to ensure a fair distribution of the benefits and burdens of research.

12 Negotiation-Support Toolkit for Learning Landscapes
Many of the tools make use of common methods of qualitative research.
• Focus-group discussions (see box)
• Transect walk (See http://siteresources.worldbank.org/EXTTOPPSISOU/Resources/1424002-1185304794278/4026035-1185375653056/4028835-1185375678936/1_Transect_walk.pdf )
• Community resource map
• Social mapping(See http://www.forestpeoples.org/topics/environmental-governance/participatory-resource-mapping)
• Timeline, seasonal calendar and other participatory rural appraisal tools (See http://www.agraria.unipd.it/agraria/master/02-03/PARTICIPATORY%20RURAL%20APPRAISAL.pdf )
• Visioning and scenarios (Evans et al 2006. See http://www.asb.cgiar.org/ma/scenarios)
• Ecosystem services’ analysis (Ash et al 2010)
We will not repeat the basic guidance that already exists in well-illustrated form in the literature but rather focus on the use of the tools for specific lines of enquiry.
A forthcoming compilation of research methods that include an explicit gender focus, see Catacutan et al. (2014).
■ Structure of the bookThe methods described here build on the rich experience of participatory rural appraisals as these emerged and became popular in the 1980s and 1990s. In repackaging the methods, we retained their flexibility and respect for bottom–up processes but added greater specificity to unpack the rather complex concepts of ecosystem (also referred to as environmental) services.
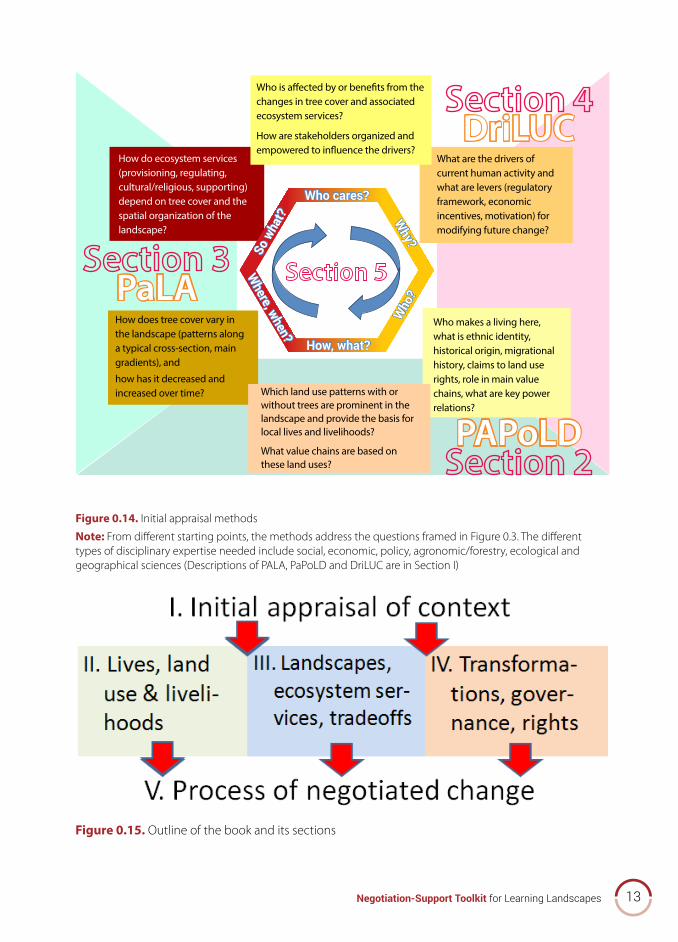
We first describe methods that allow an initial approximation of answering the six questions in Figure 0.3, assessing the local context (Figure 0.14).
Three methods in the initial appraisal (Section I) jointly provide a first approximation of the answers to the six questions of Figure 0.3: 1) a participatory landscape appraisal (PALA); 2) an analysis of poverty and its local determinants (PaPoLD); 3) and an analysis of local drivers of land-use change (DriLUC) (Figure 0.14).
An initial diagnostic derived from these leads to a choice of methods for the next steps (Fig. 0.15) , zooming in on further details of lives, land use and livelihoods (methods described in Section II), on landscape functions and ecosystem services (Section III) and/or on the process of change, rights and transformations (Section IV).
In the final Section V, we share experience and provide some guidance on the process of negotiation support. Volume 3 of this series (in preparation) will provide a synthesis of the many lessons learnt in developing and applying these methods in Southeast Asia. Experience so far has suggested that several of the methods can be translated to African contexts with local adjustments. We hope that that experience will be described in a future sequel.
13Negotiation-Support Toolkit for Learning Landscapes
Pala
DriluC
PaPolD
Who makes a living here, what is ethnic identity, historical origin, migrational history, claims to land use rights, role in main value chains, what are key power relations?
What are the drivers of current human activity and what are levers (regulatory framework, economic incentives, motivation) for modifying future change?
How does tree cover vary in the landscape (patterns along a typical cross-section, main gradients), and
how has it decreased and increased over time?
How do ecosystem services (provisioning, regulating, cultural/religious, supporting) depend on tree cover and the spatial organization of the landscape?
Who is affected by or benefits from the changes in tree cover and associated ecosystem services?
How are stakeholders organized and empowered to influence the drivers?
Which land use patterns with or without trees are prominent in the landscape and provide the basis for local lives and livelihoods?
What value chains are based on these land uses?
Who cares?
Where, when?
Who
?
So w
hat? W
hy?
How, what?
Figure 0.14. Initial appraisal methods
Note: From different starting points, the methods address the questions framed in Figure 0.3. The different types of disciplinary expertise needed include social, economic, policy, agronomic/forestry, ecological and geographical sciences (Descriptions of PALA, PaPoLD and DriLUC are in Section I)
Figure 0.15. Outline of the book and its sections


Who cares?
Where, when?
Who
?
So w
hat? W
hy?
How, what?
SECTION 01Understanding context:
multifunctional landscape mosaics
Pala
DriluC
PaPolD
Who makes a living here, what is ethnic identity, historical origin, migrational history, claims to land use rights, role in main value chains, what are key power relations?
What are the drivers of current human activity and what are levers (regulatory framework, economic incentives, motivation) for modifying future change?
How does tree cover vary in the landscape (patterns along a typical cross-section, main gradients), and how has it decreased and increased over time?
How do ecosystem services (provisioning, regulating, cultural/religious, supporting) depend on tree cover and the spatial organization of the landscape?
Who is affected by or benefits from the changes in tree cover and associated ecosystem services?
How are stakeholders organized and empowered to influence the drivers?
Which land use patterns with or without trees are prominent in the landscape and provide the basis for local lives and livelihoods?
What value chains are based on these land uses?
16 Negotiation-Support Toolkit for Learning Landscapes
Participatory landscape appraisal (PaLA)
Hoang Minh Ha, Laxman Joshi and Meine van Noordwijk
Participatory Landscape Appraisal (PaLA) can be used as an early diagnostic tool of the issues in a landscape. It can help document a process of participatory appraisals of issues of local concern, such as changes in water flows, soil erosion, slope stability or agrobiodiversity. It combines Rapid Rural Appraisal and Participatory Rural Appraisal (RRA/PRA) tools and methods with agroecological analysis to capture local knowledge at relevant temporal and spatial scales. PaLA can be used in scoping studies that can inform more detailed, subsequent analysis of specific functions and issues.
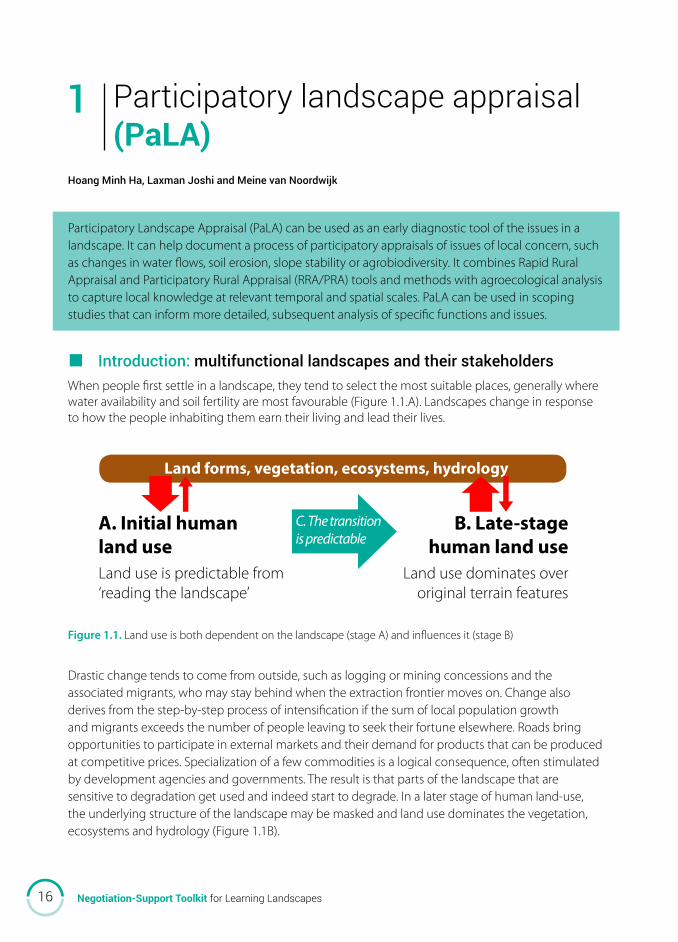
■ Introduction: multifunctional landscapes and their stakeholdersWhen people first settle in a landscape, they tend to select the most suitable places, generally where water availability and soil fertility are most favourable (Figure 1.1.A). Landscapes change in response to how the people inhabiting them earn their living and lead their lives.
figure 1.1. Land use is both dependent on the landscape (stage A) and influences it (stage B)
Drastic change tends to come from outside, such as logging or mining concessions and the associated migrants, who may stay behind when the extraction frontier moves on. Change also derives from the step-by-step process of intensification if the sum of local population growth and migrants exceeds the number of people leaving to seek their fortune elsewhere. Roads bring opportunities to participate in external markets and their demand for products that can be produced at competitive prices. Specialization of a few commodities is a logical consequence, often stimulated by development agencies and governments. The result is that parts of the landscape that are sensitive to degradation get used and indeed start to degrade. In a later stage of human land-use, the underlying structure of the landscape may be masked and land use dominates the vegetation, ecosystems and hydrology (Figure 1.1B).
Land forms, vegetation, ecosystems, hydrology
A. Initial human land useLand use is predictable from ‘reading the landscape’
Land use dominates over original terrain features
B. Late-stage human land use
C. The transition is predictable
1
17Negotiation-Support Toolkit for Learning Landscapes
Farmers’ knowledge of landscape relationships and their perceptions of an underlying logic to these relationships play an important role in their management decisions. The way farmers understand the landscape and interact with it may differ from the way government land allocation and land-use policies classify land and understand interactions with water flows and other landscape functions. Government land-use planning may only partially match local regulations, determining who is allowed to do what and where. It is safe to assume that development of sustainable land-use practices at farm and landscape levels depends on bridging the gaps between the perceptions and concerns of the multiple stakeholders of landscape functions. This is an important step towards involving them in the analysis of trade-offs between the short- and long-term benefits of sustainable land use, drawing on their knowledge and perspectives.
Two concepts that are important in the way landscapes are more than the sum of plots are buffering and filtering (see van Noordwijk et al 2011). What happens in one plot has an impact elsewhere, influencing flows of water, moisture in the air, sediment, organisms (beneficial, detrimental and neutral), fires and ensuing smoke or haze. The pattern of land use and its relation to the underlying structure of the landscape determine the overall availability of goods and services.
■ ObjectivesThe objectives of PaLa are to:
• articulate and study farmers’ perceptions of the relationship between land use and landscape functioning;
• understand farmers’ management options and the choices they make, interacting with the buffering of externally imposed variability;
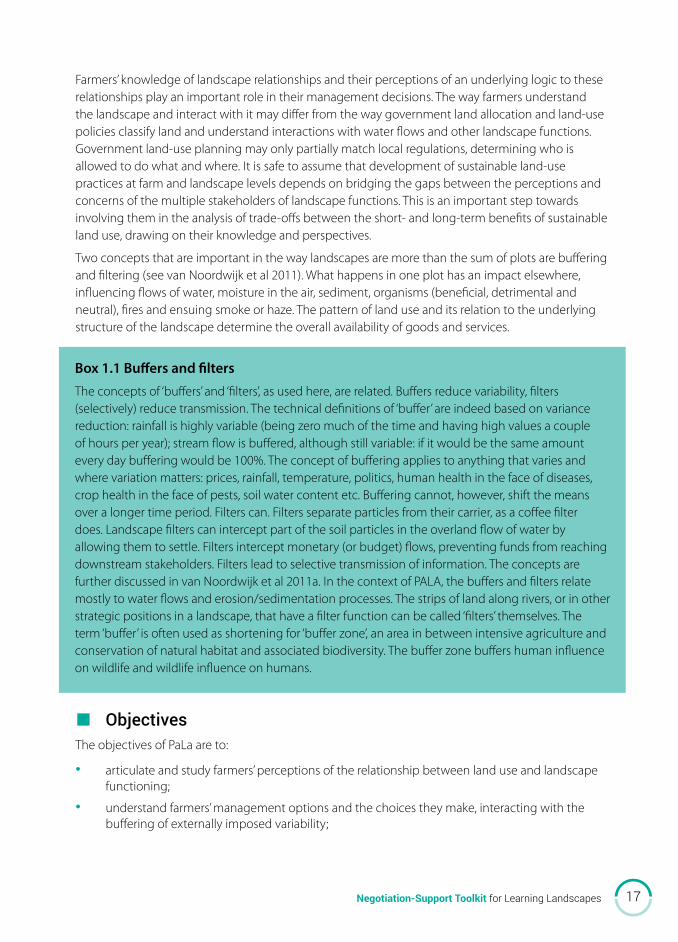
Box 1.1 Buffers and filters
The concepts of ‘buffers’ and ‘filters’, as used here, are related. Buffers reduce variability, filters (selectively) reduce transmission. The technical definitions of ‘buffer’ are indeed based on variance reduction: rainfall is highly variable (being zero much of the time and having high values a couple of hours per year); stream flow is buffered, although still variable: if it would be the same amount every day buffering would be 100%. The concept of buffering applies to anything that varies and where variation matters: prices, rainfall, temperature, politics, human health in the face of diseases, crop health in the face of pests, soil water content etc. Buffering cannot, however, shift the means over a longer time period. Filters can. Filters separate particles from their carrier, as a coffee filter does. Landscape filters can intercept part of the soil particles in the overland flow of water by allowing them to settle. Filters intercept monetary (or budget) flows, preventing funds from reaching downstream stakeholders. Filters lead to selective transmission of information. The concepts are further discussed in van Noordwijk et al 2011a. In the context of PALA, the buffers and filters relate mostly to water flows and erosion/sedimentation processes. The strips of land along rivers, or in other strategic positions in a landscape, that have a filter function can be called ‘filters’ themselves. The term ‘buffer’ is often used as shortening for ‘buffer zone’, an area in between intensive agriculture and conservation of natural habitat and associated biodiversity. The buffer zone buffers human influence on wildlife and wildlife influence on humans.
18 Negotiation-Support Toolkit for Learning Landscapes
• understand the flows of water, sediment, nutrients and organisms and the internal filter functions that determine landscape functioning, on the basis of land-use practices and the interactions between landscape units; and
• raise awareness among community members and government officials of issues connected to ecological and administrative boundaries.
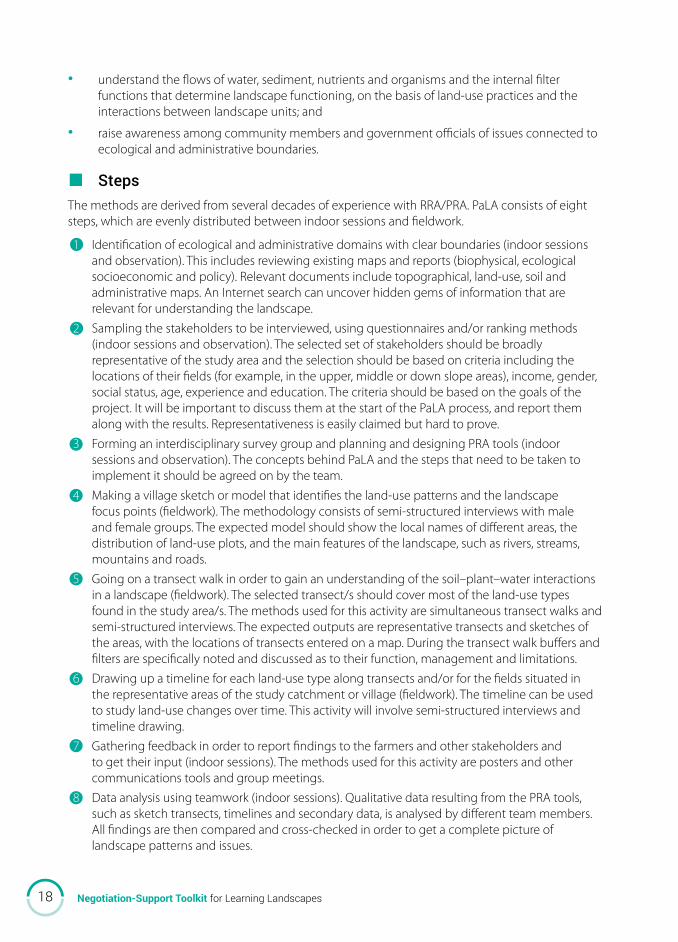
■ StepsThe methods are derived from several decades of experience with RRA/PRA. PaLA consists of eight steps, which are evenly distributed between indoor sessions and fieldwork.
1 Identification of ecological and administrative domains with clear boundaries (indoor sessions and observation). This includes reviewing existing maps and reports (biophysical, ecological socioeconomic and policy). Relevant documents include topographical, land-use, soil and administrative maps. An Internet search can uncover hidden gems of information that are relevant for understanding the landscape.
2 Sampling the stakeholders to be interviewed, using questionnaires and/or ranking methods (indoor sessions and observation). The selected set of stakeholders should be broadly representative of the study area and the selection should be based on criteria including the locations of their fields (for example, in the upper, middle or down slope areas), income, gender, social status, age, experience and education. The criteria should be based on the goals of the project. It will be important to discuss them at the start of the PaLA process, and report them along with the results. Representativeness is easily claimed but hard to prove.
3 Forming an interdisciplinary survey group and planning and designing PRA tools (indoor sessions and observation). The concepts behind PaLA and the steps that need to be taken to implement it should be agreed on by the team.
4 Making a village sketch or model that identifies the land-use patterns and the landscape focus points (fieldwork). The methodology consists of semi-structured interviews with male and female groups. The expected model should show the local names of different areas, the distribution of land-use plots, and the main features of the landscape, such as rivers, streams, mountains and roads.
5 Going on a transect walk in order to gain an understanding of the soil–plant–water interactions in a landscape (fieldwork). The selected transect/s should cover most of the land-use types found in the study area/s. The methods used for this activity are simultaneous transect walks and semi-structured interviews. The expected outputs are representative transects and sketches of the areas, with the locations of transects entered on a map. During the transect walk buffers and filters are specifically noted and discussed as to their function, management and limitations.
6 Drawing up a timeline for each land-use type along transects and/or for the fields situated in the representative areas of the study catchment or village (fieldwork). The timeline can be used to study land-use changes over time. This activity will involve semi-structured interviews and timeline drawing.
7 Gathering feedback in order to report findings to the farmers and other stakeholders and to get their input (indoor sessions). The methods used for this activity are posters and other communications tools and group meetings.
8 Data analysis using teamwork (indoor sessions). Qualitative data resulting from the PRA tools, such as sketch transects, timelines and secondary data, is analysed by different team members. All findings are then compared and cross-checked in order to get a complete picture of landscape patterns and issues.

19Negotiation-Support Toolkit for Learning Landscapes
■ PaLA case study: Dong Cao catchment, Hoa Binh province, Viet Nam
figure 1.2. Location of Dong Cao catchment, Hoa Binh province, Viet Nam; numbers mark places of specific interest. Photo: Tran Duct Toan
Dong Cao catchment (20° 58’ N, 105° 29’ E) is located in the Tien Xuan commune, Luong Son district, Hoa Binh province, 60 km south of Hanoi. The area receives a mean annual rainfall of 1500 mm, which falls mainly between April and September. Ferralsols and Acrisols soils consisting of clay loam and clay dominate the area. Most of the area has been converted to agricultural uses. Patches of secondary forest exist, mainly at higher altitudes. Cassava, corn, arrowroot and soybean are the major annual crops grown in the uplands and rice cultivation dominates the lowlands. The slope gradient in the area is between 15 and 60%. Situated at an elevation of 200–600 m, the low mountain zone of Viet Nam’s northern mountain region is home to 39% of ethnic minorities. Two ethnic groups—the Muong and the Kinh—live in the study area.
PaLA was used as a scoping study for the Dong Cao catchment. During the PaLA survey, farmers’ perceptions about current land use and their visions of how land use would change in the future were investigated using a 3D village model, a village sketch, transects and timelines. The results were used to develop hypotheses for the local ecological knowledge (LEK) survey and simulation work.
We started at the plot level with current land use (village sketch/model) and continued at the landscape level (transect). For each plot, we looked at the history of the land and at its future, to uncover farmers’ ideas of how land use would change. We started with simple questions covering what, why, when and how, and followed these with open-ended, in-depth interviews.
The research team consisted of three Vietnamese and three Swedish researchers and students working in parallel for nine days. Five of those days were spent in the field together with 14 selected local farmers, while the remaining four days were used for indoor work (see figures 1.2 and 1.3). Brainstorming was the main tool used for team interactions. All concepts, definitions and methods were discussed and agreed to by the team members. Rapid reports—in which all of the information obtained during the day is written in a structured form—were completed at the end of each day of fieldwork to ensure that the information was properly documented. The method and the checklist to be used the next day were also agreed upon. The open-ended interviews aimed to establish an equal partnership between the farmers involved in the study and the team members. Farmers were asked for their feedback throughout the research process.

20 Negotiation-Support Toolkit for Learning Landscapes
figure 1.3. Team dynamics during the indoor session (Photo: Dan Olsson); the outdoor transect walk (Photo: La Nguyen) and village model (Photo: Johan Iwald)
The focus points in the landscape, including the points where buffering is weak and sensitivity to erosion high and the filters that intercept overland flows of water and sediment were identified both in the field and on maps. The characteristics of the filters and the points with weak buffering were described in a simple Geographic Information System (GIS) map (Figure 1.3) and on a timeline.
Farmers’ knowledge expressed during the PaLA process indicated that the presence and abundance of trees in the upper sub-catchment was associated with higher stream flow, especially in the dry season. A more in-depth study as part of the LEK survey helped to formulate hypotheses and explanations for the outputs of the modelling work. The modelling, along with discussions with farmers, helped in identifying tree-based, land-use options for low-cost soil and water conservation.
For the weakly buffered points in the catchment the tentative conclusions were that:
• bamboo hedgerows prevent erosion better than Acacia mangium and Tephrosia candida hedgerows; and
• improved fallow of T. candida (two years) in rotation with cassava (two years) prevents erosion better than bamboo hedgerows intercropped with cassava.
For enhancing buffering and filtering functions in the catchment, it was clear that
• trees conserve water for the whole catchment; and
• Acacia and bamboo species are better for water conservation than are weeds/short natural fallow and monocropping.
figure 1.4. Simple GIS map of the Dong Cao catchment with local names of the fields and list of owners

21Negotiation-Support Toolkit for Learning Landscapes
■ Further readingHoang Fagerström MH, van Noordwijk M, Nyberg Y, eds. 2005. Development of sustainable land-use
practices in the uplands for food security: an array of field methods developed in Viet Nam. Hanoi: Science and Techniques Publishing House.
Box 1.2: Land Use Fertility Effect Predictor
Researchers who want to know the impact of land use practices on soil conditions, often sample the land use systems as they are found in the landscape (what else could they do?) and infer from differences between soil measurements what impacts the land use systems have on the soil. That’s where it can go wrong badly.
The LUFEP (Land Use Fertility Effect Predictor) worksheet explores the bias in such a procedure that is caused by a combination of:
1) farmer knowledge of fertility conditions of soils in the landscape,2) farmer preferences to allocate specific sites for specific uses,3) farmers’ ability to implement such preferences,
4) the proportions of different land uses in the landscape.
As a result we may find that land uses with the strongest negative effect on soil fertility are still found on the most fertile sites, and soils under land use systems without negative effects occur on infertile soils. Such reversals mean that estimated effects of land use on soil fertility have a strong bias, unless there is a way to estimate the effects of farmer site selection.
figure lufeP.1. a. Soil fertility index of soils used for five different land use systems with and without the effects of land use on soil fertility being expressed; B. Measurements in various land use systems in relation to the direct land use effect, showing the effect of soil selection on effect estimates
Figure LUFEP.1 shows an example for the default version of the model. In the “active model” sheet you can change the names of the land use systems and provide a number of numerical estimates of properties of the LU systems, the landscape’s soil, farmer knowledge, implementation of LU preferences, and LU fractions in the landscape, to explore the discrepancy between what the innocent researcher observes and the real effect of LU systems on the soil.
The spreadsheet can be found at http://www.worldagroforestry.org/downloads/wanulcas/lufep.xlsx

22 Negotiation-Support Toolkit for Learning Landscapes
Participatory analysis of poverty, livelihoods and environment dynamics (PAPoLD)
Hoang Minh Ha and Pham Thu Thuy
The Participatory Analysis of Poverty, Livelihoods and Environment Dynamics method (PAPoLD) provides insights in the local ranking and classification of wealth versus poverty, the indicators that can be used as proxies and the challenges at the bottom of the local pyramid to move out of poverty.
■ Introduction Poverty, livelihoods’ strategies and the environment are linked in numerous ways. Some of these links are distinctly spatial: they can be measured using household surveys and remote-sensing technologies and be mapped using geographic information systems. Other links are more context-specific and, therefore, more difficult to observe. PAPoLD was developed to capture specific issues of local importance. The method is dynamic and comparable (Hoang et al 2007a) and a refinement of the Stages of Progress method developed by Dr Krishna of Duke University in the USA1. The method was modified to become PAPoLD by the World Agroforestry Centre in Viet Nam in 2007, in collaboration with the Ministry of Labour, Invalids and Social Affairs and the Viet Nam Institute of Economics, to better address the links between poverty and the environment. By integrating PAPoLD with a sustainable livelihoods approach, the links between poverty and the environment can be understood in a more comprehensive way.
■ Objectives and steps table 2.1. PAPoLD objectives and associated questions and tasks
Step objective Specific questions/tasks
1 To understand stakeholders, including local people’s, viewpoints on poverty and the environment
1. What is poverty, what are the causes of poverty and who are the poor?2. How do people perceive their environment and what are their
environmental concerns?
1 Dr Krishna and colleagues have produced a training manual for the method, as well as a number of journal articles summarizing the results (see http://www.pubpol.duke.edu/krishna/). The website includes a training manual and results from case studies in India, Kenya, Uganda and Peru.
2

23Negotiation-Support Toolkit for Learning Landscapes
■ PAPoLD case study: land-use strategies and the impacts of market and resource access on poor tea growers in Hoang Nong, Viet Nam The commune of Hoang Nong in the Dai Tu district of Thai Nguyen province in Viet Nam belongs to the buffer zone of the Tam Dao National Park (Figure 2.1). The population of the study village consisted of six ethnic groups. Most of the households relied mainly on agricultural activities for their incomes, including paddy farming, rearing cattle and tea cultivation. Among these activities, cattle rearing gave farmers the highest economic return. Local farmers, especially the poorer households, also earned a living from forestry-related activities, such as hunting and wildlife trading.
PAPOLD was used together with other participatory rural appraisal tools to study the land-use strategies used by upland rural households for dealing with changes in commercialization processes (Hoang et al 2007b). Two villages were selected for the study as representative of two of the most dominant ethnic groups in the area: the Kinh in Doan Thang; and the Dao group in Dinh Cuong. Selected groups from the two villages (representing about 30% of the total households in each village) were asked to define local notions of poverty, identify ‘stages of progress’ that households in the villages might go through as they obtained more and more investment funds and characterize each household in the village according to its current and past stage in the stages of progress. Focus groups were also asked to describe their livelihoods’ strategies. Two focus groups of tea growers were selected per village using representative criteria relating to wealth, age, and gender.
Step objective Specific questions/tasks
2 To understand the Stages of Progress and livelihoods’ activities in the area
1. What are the local livelihoods’ assets and what is the capital that people use to pursue their livelihoods?
2. What are the natural and environment-related livelihoods’ assets and the dynamics/changes associated with those assets?
3. What are the communal livelihoods’ activities? 4. Life changes (escape from poverty, falling back into poverty etc) in
relation to key livelihoods’ activities. 5. Rank the importance of the community’s livelihood activities.
3 To identify the impact of natural resources and of the environment on livelihoods’ activities and strategies and vice versa
1. How do people use natural resources to support their livelihoods? 2. How do livelihoods’ activities affect the environment? (use Rapid
Market Appraisal to analyse the value chain).
4 To identify shocks, risks and vulnerabilities relating to the environment and natural resources
What are the sources of natural and environment-related shocks and what risks do they pose to livelihoods?
5 To understand institutional and policy-related issues
To what extent are livelihoods’ activities influenced by policies and institutional arrangements related to the management of natural resources?

24 Negotiation-Support Toolkit for Learning Landscapes
figure 2.1. Map of Thai Nguyen, Viet Nam
Summary of findings 1 Links between poverty and policy: the Hoang Nong study showed that land-use changes over
time were related to land and cooperative reforms. This was particularly the case in the early 1990s, when the establishment of the Tam Dao National Park, together with land privatization, left little land for young families to build on and to cultivate. This was the main cause of poverty among younger households.
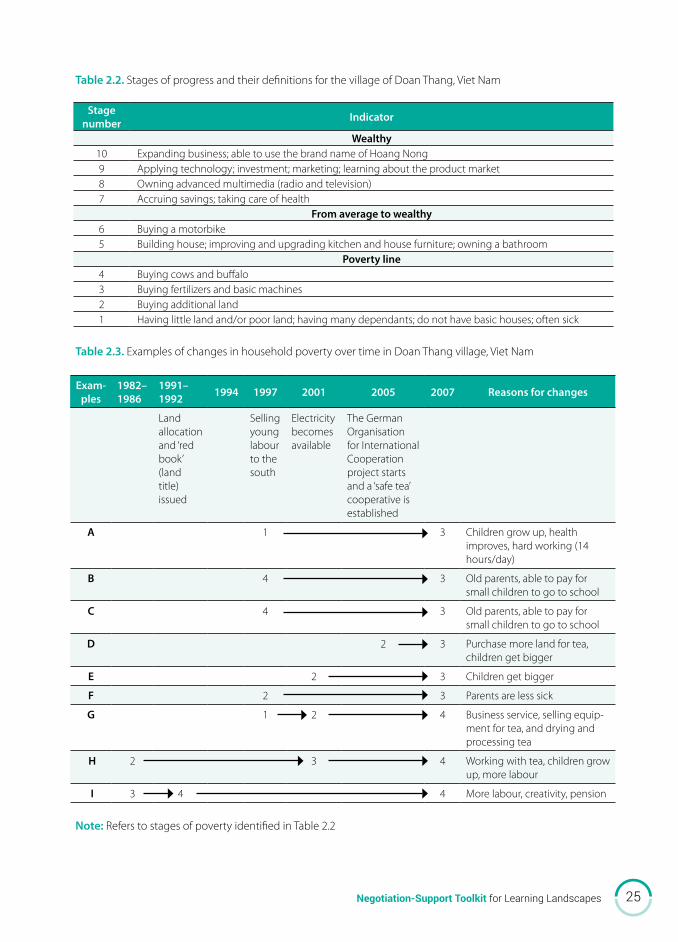
2 Poverty indicators: the most common indicators of poverty were housing, land areas, labour, income, selling price of tea, the need to repay loans and buy furniture (Table 2.2).
3 Self-rated poverty level: most of the villagers rated themselves as being in stage 1 of progress (Table 2.2). This was defined as lacking land, suffering from bad health and unemployed. The farmers who described themselves as being in the medium stages of progress (stages 3 to 7) seemed to have more diverse crop and animal patterns, which gave them higher security and sometimes enough money to expand their farms or to invest. The better-off households (described as being in stage 5 and above) either had a large amount of land to begin with or had managed their investments well and were able to buy additional land.
4 Poverty changes over time for each household: changes in wealth over time showed that better access to land, credit and labour were the main factors that helped local farmers make their way out of poverty (Table 2.3).
5 Strategies for getting out of poverty: owning tea plantations, being able to afford fertilisers, waged employment, smaller families, reduced expenditure and collecting and consuming wild foods were the main strategies that were listed for getting out of poverty.
25Negotiation-Support Toolkit for Learning Landscapes
table 2.2. Stages of progress and their definitions for the village of Doan Thang, Viet Nam
exam-ples
1982– 1986
1991–1992 1994 1997 2001 2005 2007 reasons for changes
Land allocation and ‘red book’ (land title) issued
Selling young labour to the south
Electricity becomes available
The German Organisation for International Cooperation project starts and a ‘safe tea’ cooperative is established
a 1 3 Children grow up, health improves, hard working (14 hours/day)
B 4 3 Old parents, able to pay for small children to go to school
C 4 3 Old parents, able to pay for small children to go to school
D 2 3 Purchase more land for tea, children get bigger
e 2 3 Children get bigger
f 2 3 Parents are less sick
g 1 2 4 Business service, selling equip-ment for tea, and drying and processing tea
h 2 3 4 Working with tea, children grow up, more labour
I 3 4 4 More labour, creativity, pension
Stage number Indicator
Wealthy10 Expanding business; able to use the brand name of Hoang Nong9 Applying technology; investment; marketing; learning about the product market8 Owning advanced multimedia (radio and television)7 Accruing savings; taking care of health
from average to wealthy6 Buying a motorbike5 Building house; improving and upgrading kitchen and house furniture; owning a bathroom
Poverty line4 Buying cows and buffalo3 Buying fertilizers and basic machines2 Buying additional land1 Having little land and/or poor land; having many dependants; do not have basic houses; often sick
table 2.3. Examples of changes in household poverty over time in Doan Thang village, Viet Nam
Note: Refers to stages of poverty identified in Table 2.2
26 Negotiation-Support Toolkit for Learning Landscapes
The PAPoLD method helped researchers to understand the livelihoods’ strategies that people use to get out of poverty and the positive or negative impacts that these strategies have on the environment. The poverty lines, the wealth line and the poverty indicators show that there are ways to improve livelihoods in the area, primarily by promoting livestock production and by cultivating ‘environmentally safe’ tea.
■ Further readingHoang MH, Pham TT, Swallow B, Nguyen TLH, Thai PT, Nguyen VH, Dao NN. 2007a. Understanding the
voice of the poor: participatory poverty analysis with environment focus. Hanoi: United Nations Development Programme; Ministry of Natural Resources and Environment of Viet Nam.
Hoang MH, Nguyen LH, Pham TT, Mai HY, Be QN. 2007b. Comparative analysis of market and resource access of the poor in upland zones of the Greater Mekong Region (MMSEA project). Viet Nam case study. Hanoi: World Agroforestry Centre Viet Nam.

27Negotiation-Support Toolkit for Learning Landscapes
Rapid appraisal of drivers of land-use change (DriLUC)
Meine van Noordwijk
Rapid Appraisal of Drivers of Land-use Change (DriLUC) provides an initial overview of the dynamics of land-use change in the local context and the way this is related to processes acting at larger scales. The method combines desk study of available documents and maps with interviews with key informants and focus-group discussions. A specific topic is the trade-off between economic development and environmental quality, as locally perceived.
■ Introduction: drivers and responses of land-use changeLand use is dynamic. It is the result of the decisions and choices made by many different people. The consequences of any changes that take place as a result have an impact on many other people. Consequently, the key features of a landscape need to be mapped and understood at an early stage of developing an integrated natural resource approach to managing a particular landscape. Treating a dynamic landscape as a system includes the notions of ‘internal’ (endogenous) and ‘external’ (exogenous) drivers of change, even though the system boundary may be fluid. A system is subject to pressure, has response options, time lags and feedback mechanisms that allow for learning and internal adjustment. Yet, we shouldn’t lose sight of the problems that may arise from a lack of communication, differing interests and, sometimes, open conflicts between the various people involved. Viewing the multiple interests in a landscape from a political-ecology perspective can help to create a platform for negotiations among stakeholders.
■ Objectives The primary objective of DriLUC is to provide a system-level understanding of the way local drivers of land-use change relate to external conditions and the types of local, regional and national feedback that influence livelihoods and the provision of goods and services.
■ Steps
1. Document changes in land cover, demographics, economic indicators, road or river access, and analyze conditions and trends
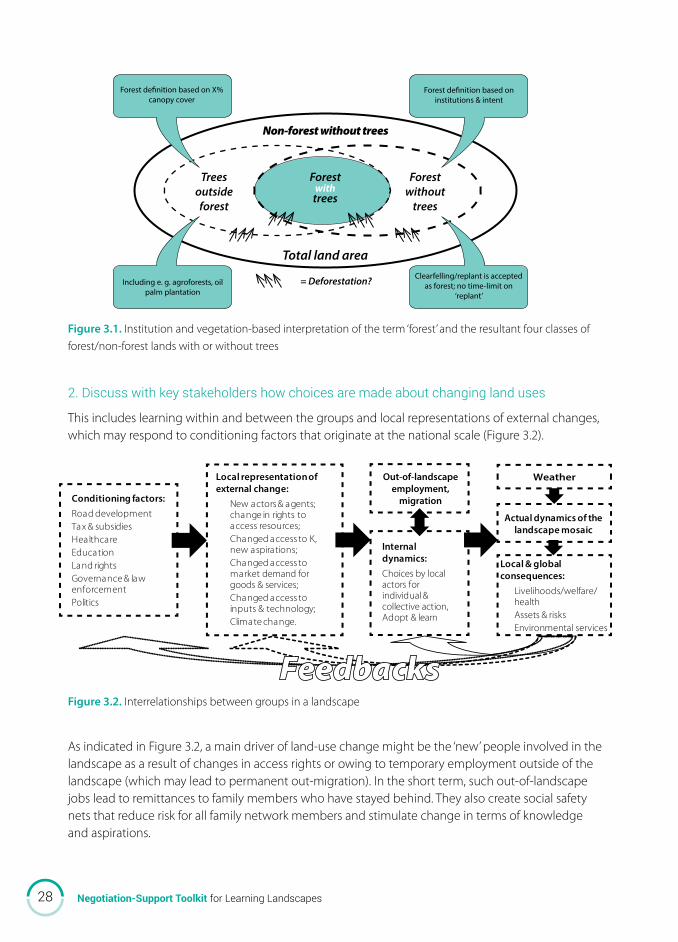
There are many definitions of ‘forest’ and, subsequently, statistics of deforestation rates can refer to changes in woody biomass, changes in institutional control or a combination of the two (Figure 3.1).
Similarly, there are several ways to define poverty. Data gathered in different studies may not be comparable. Demographics data tend to be weak on issues of migration and the temporary movement of people. GIS can combine data based on administrative boundaries with data from remote sensing, Google Earth, and other similar sources.
3
28 Negotiation-Support Toolkit for Learning Landscapes
figure 3.1. Institution and vegetation-based interpretation of the term ‘forest’ and the resultant four classes of forest/non-forest lands with or without trees
2. Discuss with key stakeholders how choices are made about changing land uses
This includes learning within and between the groups and local representations of external changes, which may respond to conditioning factors that originate at the national scale (Figure 3.2).
figure 3.2. Interrelationships between groups in a landscape
As indicated in Figure 3.2, a main driver of land-use change might be the ‘new’ people involved in the landscape as a result of changes in access rights or owing to temporary employment outside of the landscape (which may lead to permanent out-migration). In the short term, such out-of-landscape jobs lead to remittances to family members who have stayed behind. They also create social safety nets that reduce risk for all family network members and stimulate change in terms of knowledge and aspirations.
Non-forest without trees
Forestwith
trees
Total land area
= Deforestation?
Treesoutsideforest
Forestwithout
trees
Forest definition based on X% canopy cover
Forest definition based on institutions & intent
Clearfelling/replant is accepted as forest; no time-limit on
‘replant’
Including e. g. agroforests, oil palm plantation
29Negotiation-Support Toolkit for Learning Landscapes
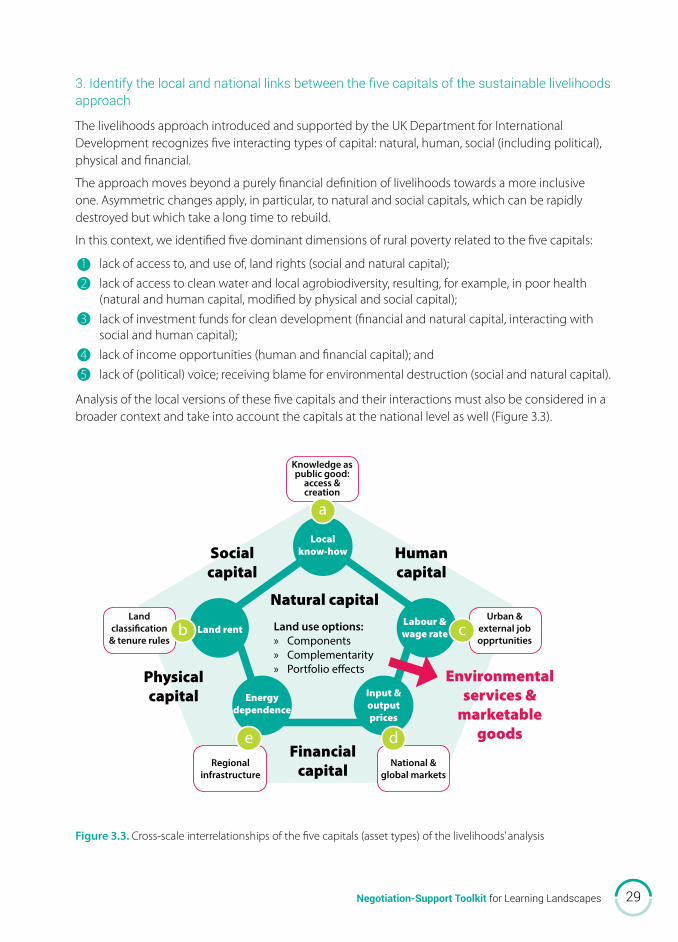
3. Identify the local and national links between the five capitals of the sustainable livelihoods approach
The livelihoods approach introduced and supported by the UK Department for International Development recognizes five interacting types of capital: natural, human, social (including political), physical and financial.
The approach moves beyond a purely financial definition of livelihoods towards a more inclusive one. Asymmetric changes apply, in particular, to natural and social capitals, which can be rapidly destroyed but which take a long time to rebuild.
In this context, we identified five dominant dimensions of rural poverty related to the five capitals:
1 lack of access to, and use of, land rights (social and natural capital);
2 lack of access to clean water and local agrobiodiversity, resulting, for example, in poor health (natural and human capital, modified by physical and social capital);
3 lack of investment funds for clean development (financial and natural capital, interacting with social and human capital);
4 lack of income opportunities (human and financial capital); and
5 lack of (political) voice; receiving blame for environmental destruction (social and natural capital).
Analysis of the local versions of these five capitals and their interactions must also be considered in a broader context and take into account the capitals at the national level as well (Figure 3.3).
figure 3.3. Cross-scale interrelationships of the five capitals (asset types) of the livelihoods’ analysis
Socialcapital
Land rentLabour &wage rate
Human capital
Natural capital
Physicalcapital
Localknow-how
Input &output prices
Financial capital
Energydependence
land use options: » Components » Complementarity » Portfolio effects Environmental
services & marketable
goods
a
b c
de
land classification
& tenure rules
urban & external job opprtunities
knowledge as public good:
access & creation
regional infrastructure
National & global markets

30 Negotiation-Support Toolkit for Learning Landscapes
Five major policy domains link local constraints to land use to their equivalent at the national level:
1 creation of, and access to, knowledge through responsive research and extension systems;
2 policies on forestland classification and land-access rules;
3 overall economic development and creation of (urban or rural) jobs in the primary agricultural production sectors;
4 price policies, subsidies and regulation of market access; and
5 development of regional infrastructure for transport, water flows, energy supply and the provision of health and education services.
These five policy domains are part of the overall context in which governance and poverty reduction strategies are developed. 4. Determine the position on the tree-cover transition curve
Many landscapes experience phases of degradation where initial opportunities for resource extraction lead to non-sustainable use. The transition to a resource-recovery phase usually requires tenurial control. This will provide investment returns along with increased physical, economic and political access to markets. The resulting agroforest transition curves can have multiple forms. The X-axis can refer to time, population density or overall economic indicators. The Y-axis can refer to forest cover or to the provision of environmental services (see Figure 3.4 for an initial hypothesis).
figure 3.4. Tree-cover (forest) transition curve (above) and hypothetical relationship to poverty (centre) and environmental services (below) to be tested in focus-group discussions 5. Understand the dynamics along the segregate–integrate axis
Land-cover change is usually described in terms of tree cover (the vertical axis on the graph). However, an equally important characteristic, especially when it comes to intermediate forest cover, is the spatial pattern of the various types of land cover (Figure 3.5). We should distinguish between fully segregated or zoned systems and those that are more integrated and multifunctional. The driving forces for increasing or decreasing functional integration are as important as changes in tree cover (deforestation/reforestation).
Gradual loss of ‘forest functions’
Rehabilitation of degraded lands
Different forms of ‘poverty’ time
Lack of voice
Low income
Food insecurity
Low access to public services
Different effects on ‘environmental services’
C stocks
Biodiv .(global)
Agrobiodiversity
Wshed functions
The ‘poverty * env . services’
nexus
on a time-line
+

31Negotiation-Support Toolkit for Learning Landscapes
figure 3.5. Segregated–integrated landscape dynamics
Source: Thomas et al 2008
6. Recognize stages of conflict and collective action
There are two types of social capital: ‘bonding’ capital or trust within a local community and ‘bridging’ capital or trust with outside agencies. Some level of bonding capital is usually needed before bridging capital can be established. Strengthening local institutions can also help by bringing tensions with the outside world into the open. By reconstructing local experiences of engagement with the outside world and combining this with an analysis of the degree of internal structures within a community, an assessment can be made of relative strengths and opportunities (Figure 3.6).
figure 3.6. Stages of conflict and collective action Note: for a detailed explanation, see van Noordwijk et al (2011), Figure G.3, page 84.Source: van Noordwijk et al 2001

32 Negotiation-Support Toolkit for Learning Landscapes
7. Understand agents of land-use change and stakeholders’ views on the trade-offs between goods and services
Elements of land-use change and their associated drivers involve shifts in the trade-offs between goods (profitability) and services (conservation). The potential relevance of rewards for providing environmental services needs to be understood in relation to the position of the landscape to the protected areas (for example, rotating the field so that more of the ‘services’ project on the utility vector, compatible with the commoditized goods) (Figure 3.7).
figure 3.7. Changing the perspective of environmental goods and services
■ Next stepsDetails of the methodology will have to be adjusted to suit local circumstances and the capacity of DriLUC partners. The analysis can go hand in hand with PaLA and PAPoLD. DriLUC can identify the main issues surrounding agroforestry technology and/or environmental services that merit further study, for example, through the use of the Rapid Agroforestry Systems and Technology (RAFT) tool, Rapid Hydrological Appraisal (RHA), Rapid Agrobiodiversity Appraisal (RABA) and Rapid Carbon Stock Appraisal (RaCSA). DriLUC will also help to define the framework for any land-use scenario analysis and the use of simulation models, such as Forest, Agroforest, Low-value Landscape or Wasteland (FALLOW).
■ Example of trade-off analysis in Jambi province, IndonesiaSteps 1–6 of DriLUC were part of the initial characterization of the ASB Partnership for the Tropical Forest Margins in Jambi (Tomich et al 1998). Step 7 was tested in a focus-group discussion with local stakeholders in Jambi, involving NGO staff, local government officials and farmers. It proved to be intuitive to define the two axes and to have group members identify the various land-use activities, reaching agreement on where to place them on the axes (sometimes after considerable discussion and clarification between participants). In a second pass of the graph the main people involved in the land-use activities were identified (Figure 3.8).
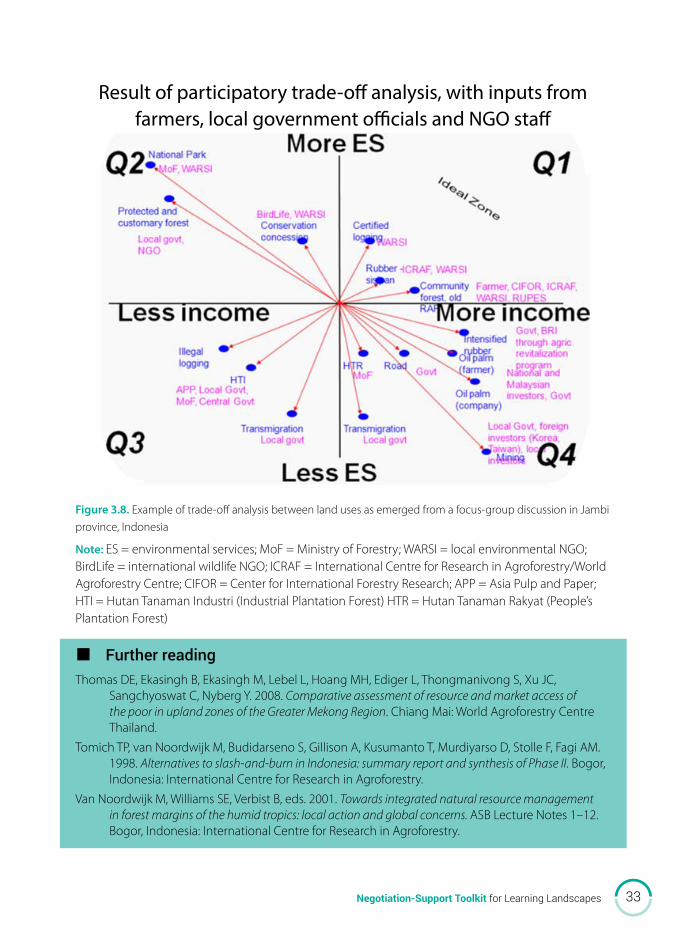
33Negotiation-Support Toolkit for Learning Landscapes
figure 3.8. Example of trade-off analysis between land uses as emerged from a focus-group discussion in Jambi province, Indonesia
Note: ES = environmental services; MoF = Ministry of Forestry; WARSI = local environmental NGO; BirdLife = international wildlife NGO; ICRAF = International Centre for Research in Agroforestry/World Agroforestry Centre; CIFOR = Center for International Forestry Research; APP = Asia Pulp and Paper; HTI = Hutan Tanaman Industri (Industrial Plantation Forest) HTR = Hutan Tanaman Rakyat (People’s Plantation Forest)
■ Further readingThomas DE, Ekasingh B, Ekasingh M, Lebel L, Hoang MH, Ediger L, Thongmanivong S, Xu JC,
Sangchyoswat C, Nyberg Y. 2008. Comparative assessment of resource and market access of the poor in upland zones of the Greater Mekong Region. Chiang Mai: World Agroforestry Centre Thailand.
Tomich TP, van Noordwijk M, Budidarseno S, Gillison A, Kusumanto T, Murdiyarso D, Stolle F, Fagi AM. 1998. Alternatives to slash-and-burn in Indonesia: summary report and synthesis of Phase II. Bogor, Indonesia: International Centre for Research in Agroforestry.
Van Noordwijk M, Williams SE, Verbist B, eds. 2001. Towards integrated natural resource management in forest margins of the humid tropics: local action and global concerns. ASB Lecture Notes 1–12. Bogor, Indonesia: International Centre for Research in Agroforestry.
Result of participatory trade-off analysis, with inputs from farmers, local government officials and NGO staff


SECTION 02Lives, land use and livelihoods: trees, agroforestry technology
and markets
Who cares?
Where, when?
Who
?
So w
hat? W
hy?
How, what?
Pala
DriluC
Who makes a living here, what is ethnic identity, historical origin, migrational history, claims to land use rights, role in main value chains, what are key power relations?
What are the drivers of current human activity and what are levers (regulatory framework, economic incentives, motivation) for modifying future change?
How does tree cover vary in the landscape (patterns along a typical cross-section, main gradients), and how has it decreased and increased over time?
How do ecosystem services (provisioning, regulating, cultural/religious, supporting) depend on tree cover and the spatial organization of the landscape?
Who is affected by or benefits from the changes in tree cover and associated ecosystem services?
How are stakeholders organized and empowered to influence the drivers?
Which land use patterns with or without trees are prominent in the landscape and provide the basis for local lives and livelihoods?
What value chains are based on these land uses?
PaPolD

36 Negotiation-Support Toolkit for Learning Landscapes
Rapid appraisal of agroforestry practices, systems and technology (RAFT)
Laxman Joshi, Meine van Noordwijk, Endri Martini and Janudianto
Agroforestry practices, systems and technology exist in many forms but are often ‘invisible’ in official documents and statistics that see agriculture, commodities and forestry as separate sectors. The Rapid Appraisal of Agroforestry Practices, Systems and Technology (RAFT) tool helps assess what exists in the landscape as seen through the eyes of farmers and land managers and to relate that to emerging classifications of land use to become more inclusive.
■ Introduction‘Agroforestry’ is an umbrella term covering a wide range of practices in which trees are grown on farms and in agricultural landscapes. The RAFT framework provides guidelines for the description and analysis of the different ways trees are used to improve rural livelihoods, on farms and in landscapes. A distinction between agroforestry technologies (for example, focussed on the way tree–soil–crop–animal interactions are managed) and agroforestry systems (the farming systems that include the deliberate use of trees, using multiple discrete technologies in different parts of the farm) follows the
analysis by Sinclair (1999).
■ Objectives1 Clarify terminology of agroforestry practices, systems and technologies appropriate for local use
and global adaptation.
2 Understand the relationship between ‘domestication’ from the perspectives of trees as biological resources, control over access to resources and knowledge and belief systems.
3 Appraise strengths, weaknesses, opportunities and threats with the main agroforestry stakeholders to plan applied research and development support.
4 Initiate more detailed data collection on input and output streams at various phases of the lifecycle of an agroforestry system.
■ Steps 1 Clarify local terminology for the various uses of trees in space and time, in relation to existing
generic schemes, building on the initial exploration in the PaLA tool.
2 Participatory appraisal of current tree management and domestication.
3 Explore the depth of local ecological knowledge and awareness of intellectual property rights.
4 Appraise component interactions at technology and system levels.
4

37Negotiation-Support Toolkit for Learning Landscapes
5 Quantify input/output relations and initiate a profitability assessment (for follow up with LUPA).
6 Assess tree and land-tenure arrangements and associated policy issues.
7 Jointly with farmers, analyze strengths, weaknesses, opportunities and threats of the agroforestry technologies and systems.
Step 1a. Terminology
LoCAL meAnInGS AnD SenSItIvItIeS ARoUnD teRmInoLoGy
In different languages, similar agroforestry terms may be used to refer to a dominant commodity, the way it is managed or to a form of semi-managed, woody vegetation. Understanding the true meaning of similar terms used in different languages is not easy, as the values embedded in the word may be lost or changed. ‘Community-based forest management’ or even ‘forest’ and ‘agroforest’ can refer to the same vegetation but imply different political control. Sensitivities around specific terms need to be carefully explored with local stakeholders, including men and women, farmers, landless peasants and government officials.
nAtIonAL-LeveL InStItUtIonAL teRmInoLoGy foR foReStS AnD tReeS oUtSIDe of foReStS
An ‘objective’ descriptor, such as the degree of crown cover of woody perennials, may allow monitoring by remote sensing but might not match national policies or categories used to track deforestation and forest degradation. There is growing recognition that trees outside of forests provide goods and services but such trees may still fall through the cracks of a ‘forestry versus agriculture’ dichotomy.
InteRnAtIonAL ComPARISon In metA-LAnD-USe SyStemS
To ease global comparisons, the ASB Partnership for the Tropical Forest Margins introduced the term ‘meta-land uses’ (van Noordwijk et al 2001).
table 4.1. Main products and ‘meta-land-use’ system
Primary focus land-use system
forest products
Natural forest (Fn), without extraction beyond the occasional harvest of non-timber forest products and/or hunting of wildlife
Managed forests (Fm), with various degrees of harvest of timber and non-timber forest products and grazing but no commercial logging
Logged forests (Fl), with various intensities and degrees of management to enhance the regrowth of valuable trees; can include ‘enrichment planting’ up to one-third of total tree basal area
tree crops and timber plantations
Extensive agroforests (Te) are complex, multistrata agroforestry systems with at least one-third of tree basal area derived from spontaneously established trees and more than five recognized harvestable commodities
Intensive agroforests (Tm) with at least two recognized harvestable commodities and less than one-third of tree basal area derived from spontaneously established trees
Simple, intensive tree-crop systems (Ts) or timber plantations, with one or two harvested commodities
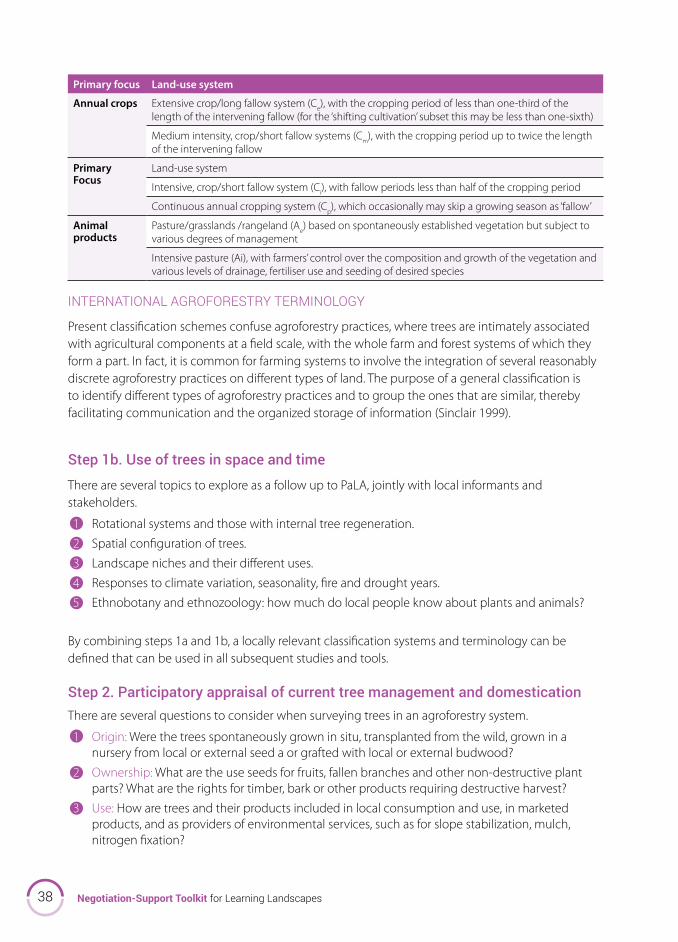
38 Negotiation-Support Toolkit for Learning Landscapes
InteRnAtIonAL AGRofoReStRy teRmInoLoGy
Present classification schemes confuse agroforestry practices, where trees are intimately associated with agricultural components at a field scale, with the whole farm and forest systems of which they form a part. In fact, it is common for farming systems to involve the integration of several reasonably discrete agroforestry practices on different types of land. The purpose of a general classification is to identify different types of agroforestry practices and to group the ones that are similar, thereby facilitating communication and the organized storage of information (Sinclair 1999).
Step 1b. Use of trees in space and time
There are several topics to explore as a follow up to PaLA, jointly with local informants and stakeholders.
1 Rotational systems and those with internal tree regeneration.
2 Spatial configuration of trees.
3 Landscape niches and their different uses.
4 Responses to climate variation, seasonality, fire and drought years.
5 Ethnobotany and ethnozoology: how much do local people know about plants and animals?
By combining steps 1a and 1b, a locally relevant classification systems and terminology can be defined that can be used in all subsequent studies and tools. Step 2. Participatory appraisal of current tree management and domesticationThere are several questions to consider when surveying trees in an agroforestry system.
1 Origin: Were the trees spontaneously grown in situ, transplanted from the wild, grown in a nursery from local or external seed a or grafted with local or external budwood?
2 Ownership: What are the use seeds for fruits, fallen branches and other non-destructive plant parts? What are the rights for timber, bark or other products requiring destructive harvest?
3 Use: How are trees and their products included in local consumption and use, in marketed products, and as providers of environmental services, such as for slope stabilization, mulch, nitrogen fixation?
Primary focus land-use system
annual crops Extensive crop/long fallow system (Ce), with the cropping period of less than one-third of the length of the intervening fallow (for the ‘shifting cultivation’ subset this may be less than one-sixth)
Medium intensity, crop/short fallow systems (Cm), with the cropping period up to twice the length of the intervening fallow
Primary focus
Land-use system
Intensive, crop/short fallow system (Ci), with fallow periods less than half of the cropping period
Continuous annual cropping system (Cp), which occasionally may skip a growing season as ‘fallow’
animal products
Pasture/grasslands /rangeland (Ae) based on spontaneously established vegetation but subject to various degrees of management
Intensive pasture (Ai), with farmers’ control over the composition and growth of the vegetation and various levels of drainage, fertiliser use and seeding of desired species

39Negotiation-Support Toolkit for Learning Landscapes
The results of the survey should be compared with thresholds in tree domestication (open access use, regulated use, managed regeneration, planted, selective propagation, breeding), changes in technology, resource control and knowledge and beliefs.
Wiersum (1997) identified three thresholds in the process of domestication: 1) ‘controlled utilization’ (the separation of open access from a controlled harvesting regime); 2) ‘purposeful regeneration’ (the separation of dependence on natural regeneration from interventions that generally require control over subsequent utilization); and 3) ‘domestication’ (a movement toward a horticultural or plantation style of production system).
figure 4.1. Stages in the domestication of forest resources
Note: Based on the various types of control (tenure) exerted over the land and on the type of control exerted over the reproduction and growth of the plants involved. Modified from Wiersum 1997.
Step 4. Appraising the depth of local ecological knowledge and awareness of intellectual property rights
There are several topics to explore to assess local ecological knowledge and awareness of intellectual property rights.
1 Ethnobotany: the components of the local agroforestry system, their properties and potential uses
2 Ecological knowledge of relationships
i Management practices
ii Skills and technology
3 Socio-cultural value of trees and tree products
4 Restrictions on access to knowledge within the community (for example, medicinal plants)
5 Issues regarding intellectual property rights with outsiders, neighbouring communities and/or the wider community of similar ethnic origin
Gro
wth
Open
‘free access’
forest resource
Controlled utilization
Purposeful regeneration
Knowledge, beliefs, taboos
Full domestication
Management intensityRe
prod
uctio
n
Public
Har
vest
Private control

40 Negotiation-Support Toolkit for Learning Landscapes
Step 5. Component interactions
The main topic to explore in Step 5 is the interactions between target trees and other system components, such as other trees, weeds, crops, domestic animals, pests, diseases, pollinators and seed dispersal agents.
Step 6. Input/output relations and profitability assessment
In setting up a framework for quantifying input/output relationships and profitability (see LUPA), distinctions need to be made between system phases (for example, year T0 – T1 ‘establishment’, T1 – T2, ‘early production) and for each phase a list is needed of the inputs (type, volume, current price, labour use and possible land rents) and outputs (harvested products, volume, current price). This will inform the subsequent, more detailed LUPA data collection that explores variation in all quantities involved before characterizing a ‘typical’ system input/output table as the basis for profitability analysis.
figure 4.2. Classification system for land, animals, plants and markets
land Open access (de facto) L1
Community-controlled land and resources L2
Community-controlled land, private resources L3
Private control L4
Plant resources
Propagule source: ‘natural’ P1
Propagule source: locally selected P2
Propagule source: externally obtained P3
Propagule source: externally ‘improved’ P4
Growth: reducing competitors G1
Growth: securing symbionts G2
Growth: fertiliser G3
Growth: irrigation G4
Growth: drainage G5
Flowering induced R1
Pollination & fruit set stimulated R2
Protection from frugivores R3
Advanced harvest techniques H1
Post-harvest processing H2
animal resources
Harvest from wild, managed wild populations, domesticated stock with uncontrolled/controlled mating, specific selection of parentage ; roaming free, controlled range, stall -fed A
market Local use within villageUse (buyers) within district/provinceUse (buyers) at national scaleRegional marketsInternational markets
M1M2M3M4M5
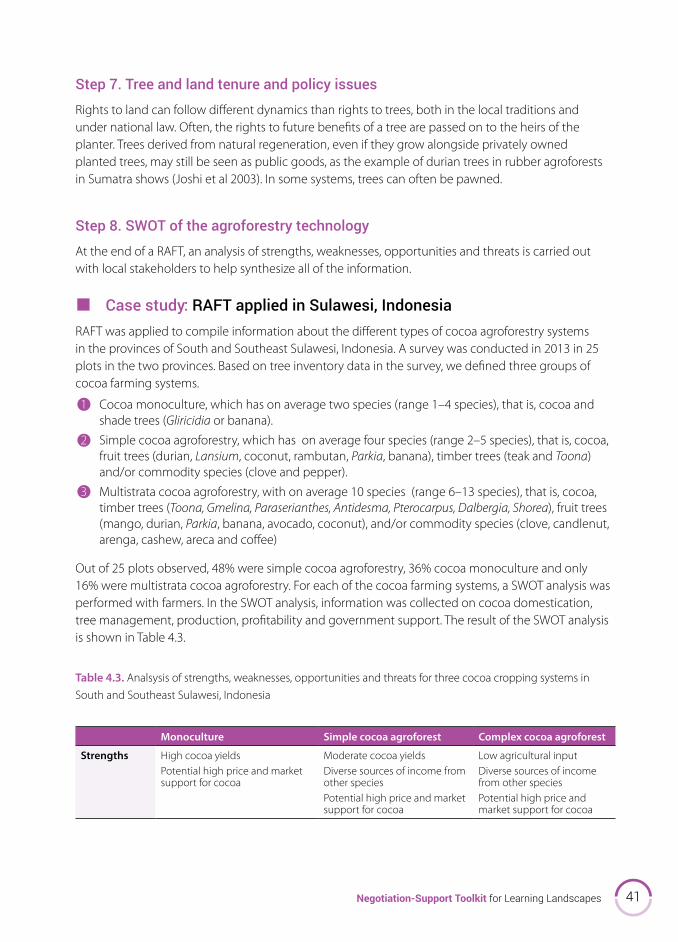
41Negotiation-Support Toolkit for Learning Landscapes
Step 7. Tree and land tenure and policy issues
Rights to land can follow different dynamics than rights to trees, both in the local traditions and under national law. Often, the rights to future benefits of a tree are passed on to the heirs of the planter. Trees derived from natural regeneration, even if they grow alongside privately owned planted trees, may still be seen as public goods, as the example of durian trees in rubber agroforests in Sumatra shows (Joshi et al 2003). In some systems, trees can often be pawned.
Step 8. SWOT of the agroforestry technology
At the end of a RAFT, an analysis of strengths, weaknesses, opportunities and threats is carried out with local stakeholders to help synthesize all of the information.
■ Case study: RAFT applied in Sulawesi, IndonesiaRAFT was applied to compile information about the different types of cocoa agroforestry systems in the provinces of South and Southeast Sulawesi, Indonesia. A survey was conducted in 2013 in 25 plots in the two provinces. Based on tree inventory data in the survey, we defined three groups of cocoa farming systems.
1 Cocoa monoculture, which has on average two species (range 1–4 species), that is, cocoa and shade trees (Gliricidia or banana).
2 Simple cocoa agroforestry, which has on average four species (range 2–5 species), that is, cocoa, fruit trees (durian, Lansium, coconut, rambutan, Parkia, banana), timber trees (teak and Toona) and/or commodity species (clove and pepper).
3 Multistrata cocoa agroforestry, with on average 10 species (range 6–13 species), that is, cocoa, timber trees (Toona, Gmelina, Paraserianthes, Antidesma, Pterocarpus, Dalbergia, Shorea), fruit trees (mango, durian, Parkia, banana, avocado, coconut), and/or commodity species (clove, candlenut, arenga, cashew, areca and coffee)
Out of 25 plots observed, 48% were simple cocoa agroforestry, 36% cocoa monoculture and only 16% were multistrata cocoa agroforestry. For each of the cocoa farming systems, a SWOT analysis was performed with farmers. In the SWOT analysis, information was collected on cocoa domestication, tree management, production, profitability and government support. The result of the SWOT analysis is shown in Table 4.3.
table 4.3. Analsysis of strengths, weaknesses, opportunities and threats for three cocoa cropping systems in South and Southeast Sulawesi, Indonesia
monoculture Simple cocoa agroforest Complex cocoa agroforest
Strengths High cocoa yieldsPotential high price and market support for cocoa
Moderate cocoa yieldsDiverse sources of income from other speciesPotential high price and market support for cocoa
Low agricultural inputDiverse sources of income from other speciesPotential high price and market support for cocoa

42 Negotiation-Support Toolkit for Learning Landscapes
monoculture Simple cocoa agroforest Complex cocoa agroforest
Weaknesses High inputHigh cocoa pest and disease problemsOnly one source of income
Moderate agricultural inputModerate cocoa pest and disease problems
Low cocoa yieldsHigh cocoa pest and disease problemsOther
opportunities Species’ enrichment in the gardens will create diverse sources of income for farmers to buffer potential low prices for cocoaPruning and fertilizing key to lowering cocoa pest and disease problems
Spacing between species needs to be arranged to ensure enough light intensity for cocoa (that is, not less than 50%)Pruning and fertilizing key to lowering cocoa pest and disease problems
Spacing between species needs to be arranged to ensure enough light intensity for cocoa (that is, not less than 50%)Pruning and fertilizing key to lowering cocoa pest and disease problems
threats High cocoa pest and disease problems may result in farmers converting their cocoa gardensLow tree maintenance will cause high cocoa pest and disease problems
Low tree maintenance will cause high cocoa pest and disease problems
High cocoa pest and disease problems may result iin farmers ignoring cocoa production or abandoning the cocoa gardenLow tree maintenance will cause high cocoa pest and disease problems
■ Key referencesJoshi L, Wibawa G, Beukema HJ, Williams SE, van Noordwijk M. 2003. Technological change and
biodiversity in the rubber agroecosystem. In: JH Vandermeer, ed. Tropical agroecosystems: new directions for research. Boca Raton, FL: CRC Press. p. 133–157.
Sinclair FL. 1999. A general classification of agroforestry practice. Journal of Agroforestry Systems 46:161–180.

43Negotiation-Support Toolkit for Learning Landscapes
Local ecological knowledge: agroecological knowledge toolkit (AKT5)
Laxman Joshi, Fergus Sinclair and Elok Mulyoutami
The Agroecological Knowledge Toolkit (AKT5) provides a systematic framework for documenting and subsequently analyzing local agroecological knowledge. Within the frame of a relational database, local knowledge is teased apart into unitary statements that can subsequently be viewed with all their interconnections.
■ IntroductionLocal ecological knowledge (LEK) refers to what people know about their natural environment, based primarily on their own experience and observation. LEK is widely seen as important and of potential use in research and development programs related to natural resource management. However, there is a need for effective methods for exploring, accessing and evaluating LEK if it is to be integrated into the planning process in an explicit manner. One method that has been developed to enable representation of local knowledge is a knowledge-based systems approach. In this method, qualitative LEK are articulated by local people and represented using computer software. This is based on earlier studies (reviewed in Walker and Sinclair 1998) that show the majority of articulated knowledge can be broken down into unitary statements of knowledge that can then be represented through computer software using a formal grammar and a local taxonomy of terms. Such represented knowledge can then be subjected to synthesis and evaluation in an objective and unbiased manner.
The AKT5 software was developed at the University of Wales, Bangor, UK, with contributions from many national and international research and development institutions (Walker and Sinclair 1998, Joshi et al 2004a, b). It was designed to create knowledge bases from a range of sources. It allows representation of knowledge elicited from farmers and scientists or knowledge abstracted from written material. The methodology involves the creation of knowledge bases that comprise formal records of local knowledge that then can be flexibly accessed and used by research and extension staff.
Research using the AKT5 system has shown that local people often have sophisticated knowledge about ecological processes underpinning natural resource management.
■ Objectives1 Document local agroecological knowledge in a form that allows the representation of an
interconnected knowledge system, built up from unitary statements.
2 Select statements that can be used to analyze how widespread are specific forms of knowledge.
3 Compare knowledge systems beyond locations and/or stakeholders.
5

44 Negotiation-Support Toolkit for Learning Landscapes
■ Steps
1. Download most recent version of the AKT5 software
The latest version of the AKT5 software can be downloaded free for non-commercial purposes from the AKT website: http://akt.bangor.ac.uk.
2. Read the manual
The process of acquiring and representing knowledge using this system is described in the AKT5 manual (Dixon et al 2001). Essentially, during knowledge-base creation, knowledge is elicited through a process of semi-structured interviews with a stratified sample of carefully selected informants. This knowledge is then broken down into short statements, comprising single items of knowledge that we refer to as unitary statements. These are then represented with a computer using a formal grammar. In practice, the process of representation requires evaluation of the knowledge as it is entered and provides the basis for further questioning. This iterative process of elicitation and representation continues until no new knowledge is revealed by further questioning. Robust knowledge bases on specified topics from well-defined sources are created. The knowledge is stored in a form that is comprehensive, accessible and easily updated. Automated reasoning tools assist comparative analysis of knowledge held by different groups of people and can be customised to explore the implications of combining local and scientific knowledge.
3. Knowledge elicitation
The framework is divided into four stages (Figure 5.1).
1 Scoping
2 Definition of the domain
3 Compilation
4 Generalisation
The important feature of this four-stage strategy for knowledge acquisition, in terms of sampling, is the separation of knowledge-base development (the first three stages), where a small purposive sample of people are intensively involved, and the generalisation stage, where a large randomised sample of people is drawn from the target community to explore how representative the knowledge base is.

45Negotiation-Support Toolkit for Learning Landscapes
figure 5.1. Four stages in elicitation of local ecological knowledge
Source: Dixon et al 2001
Sets of unitary statements as captured in the knowledge base should be evaluated in terms of
• repetition,
• contradiction,
• completeness and
• consistency in use of terms,
as elaborated in Dixon et al (2001).
4. Analytical steps
For use in negotiation support we are particularly interested in a comparison of the LEK, PEK and MEK mental maps of the world. If all three are similarly mapped in AKT5 we can now start to overlay them and explore consequences (Table 5.1).
SCOPING DEFINITION COMPILATION GENERALISATION
objective To refine knowledge acquisition objectives
To generate a broad understanding of domain and define boundaries and terms
To create coherent and comprehensive knowledge base
To test how representive the knowledge base is of farmers generally
Informants and activities
A broad range of activities a cross the community
One or two intensive interactions with a small number of purposively selected informants
Iterative cycle: repeated interaction with statified sample of key informants, knowledge representation and evaluation of emerging knowledge base
A variety of questionnaire-based survey approaches on a sufficiently large and randomly selected sample of informants from the community

46 Negotiation-Support Toolkit for Learning Landscapes
Table 5.1. Analysis of differences and overlaps between knowledge systems, with consequences for negotiations
■ Examples of applicationThe AKT methodology has been used successfully in a number of projects in Asia, Africa and Latin America and has been adopted globally by the World Agroforestry Centre. This has included use with the development of multistrata cocoa and non-timber forest products in Ghana and Cameroon; jungle rubber, soil erosion and conservation and Javanese home garden systems in Indonesia; participatory plant breeding for cassava in Colombia and hill maize in Nepal; forest gardens and smallholding rubber in Sri Lanka; range management in South Africa and Lesotho; and trees in crop fields and rangelands in Kenya and Tanzania. A Spanish language version is used in Latin America by the Tropical Agricultural Research and Higher Education Centre and a Thai version has been developed in conjunction with the Department of National Parks, Wildlife and Plant Conservation in Thailand. New applications include peri-urban vegetable production and waste recycling in Viet Nam and China, alternative animal health care in Wales and a group of users have created an email network to support a range of activities in the Philippines.
■ Key referencesDixon HJ, Doores JW, Joshi L, Sinclair FL. 2001. Agroecological knowledge toolkit for Windows: methodological guidelines,
computer software and manual for AKT5. Bangor, UK: School of Agricultural and Forest Sciences, University of Wales. http://akt.bangor.ac.uk/documents/AKT5manual.pdf.
Joshi L, Suyanto S, Catacutan DC, van Noordwijk M. 2001. Recognising local knowledge and giving farmers a voice in the policy development debate. In: M van Noordwijk, S Williams, B Verbist, eds. Towards integrated natural resource management in forest margins of the humid tropics: local action and global concerns. Bogor, Indonesia: World Agroforestry Centre (ICRAF) Southeast Asia Regional Program.
Joshi L, Shrestha P, Moss C, Sinclair FL. 2004a. Locally derived knowledge of soil fertility and its emerging role in integrated natural resource management. In: M van Noordwijk, G Cadisch, CK Ong, eds. Belowground interactions in tropical agroecosystems: concepts and models with multiple plant components. Wallingford, UK: CABI.
examples Consequences for negotiation Suggested next steps
Areas of agreement
Although details may differ, all knowledge systems recognize effects of trees on microclimate
Actions that directly align with this shared knowledge have good chance of being accepted by all
This common ground can form the basis of agreements, needs to be in the preamble
Areas of contradiction
While foresters (PEK) claim their tree planting increased water availability, farmers (LEK) perceived the opposite effect; MEK mostly agrees with LEK
Negotiations will move in circles around such hot issues until a common cognitive base is found
This contrast needs to be analyzed and where feasible to be resolved by joint fact-finding on agreed criteria and case definitions
Differences in detail of articulation
Science (MEK) will usually have more detail but also more recognized uncertainty than either LEK or PEK
Differences in detail (or in degree) of explanations are okay as long as they don’t affect expected response to actions
Optimal fuzziness may require multiple iterations of further clarification and compromise
Topics absent from one or more
Local knowledge (LEK) may invoke spiritual links absent from (if not contradicted by) science (MEK); MEK relates to fundamental laws not understood locally; PEK tends to deny or ignore negative consequences of current economy
Discussions between ‘believers’ and ‘non-believers’ have little chance of progress as neither side will leave their trenches
Seek optimal fuzziness as before, while creating safe space outside negotiations to explore complementarity of ‘wisdom’ behind the ‘knowledge’

47Negotiation-Support Toolkit for Learning Landscapes
Land-use profitability analysis (LUPA)
Arif Rahmanulloh, Muhammad Sofiyuddin, Suyanto and Suseno Budidarsono
Land-Use Profitability Assessment (LUPA) is an analysis framework for economic assessment of land-use systems, conducted at landscape level. LUPA estimates monetary surplus (profitability) for each land area as result of investment allocated by the operator, both smallholders or large-scale.
■ IntroductionThe most important source of livelihoods for most people living surrounding forests comes from land use. Understanding the characteristics of existing land-use systems is important to develop interventions to improve people’s livelihoods. LUPA can be used to identify which one of the land-use systems generates the most economic benefit. This tool also analyzes labour engagement in land-use systems.
Within the context of low-carbon development strategies it is important to identify the economic performance of each land-use system and to analyze the trade-off between reducing greenhouse gas emissions and increasing economic benefits. LUPA generates a figure of economic performance of land-use systems, allowing the creation of a set of low-carbon development intervention options with estimated economic benefits.
■ ObjectivesLUPA is designed to provide key characteristics of economic performance for each land-use system in a landscape.
■ Steps
1. Identification
This step is done by analyzing land-cover information from spatial imagery combined with secondary data on land uses as well as commodity production figures. This step generates early information on major land-use systems and indicative locations where the system exists. It can build on the RAFT appraisals and be aligned with ALUCT.
2. Field verification
The verification confirms land-use systems ‘on the ground’ and the typology or variation of each system. Using the land-use system list from Step 1, the researchers directly observe in the field before collecting data.
6

48 Negotiation-Support Toolkit for Learning Landscapes
3. Data collection
This step involves interviews with key informant (include focus-group discussions) and gathering secondary literature. Data is categorized as follows: 1) macro-economic data; 2) input and output quantities; 3) prices. The macro-economic data set consists of real interest and exchange rates. Input data means all items used in the production process that consist of tradable purchased inputs (planting materials, chemicals, tools etc) and labour use. All input items are quantified using a common unit. Labour use is estimated both for family and hired labour. The output data consist of all products generated by the systems during the period of estimation. Agroforestry systems usually produce several products, from the beginning to the end of the period. Prices attributed to all items of input and output should be ‘farmgate’.
4. Analysis
In this step, the researchers develop two important tables: input-output table and farm budget. The first table shows quantity allocations of purchased inputs, non-tradable inputs, capital and also labour into a range of time (usually 30 years for timber-based systems). The input-output table also provides the annual quantity of production. Each item of input and output has a unit compatible with the market price.
Farm budgets are developed by valuing the input-output table using gathered price data. All item units, both for input and output, use the same currency. All input items for a farm budget are attributed as ‘cost’ while the output items are ‘revenue’. The profitability is found by summing all revenue then subtracting all costs.
Depending on the aim of the study, the analysis can be done at different levels of depth. Two common profitability indicators used are ‘return to land’ and ‘return to labour’.
■ Profitability indicatorsNet present value (NPV) is the most common indicator used for comparing the profit of different types of investment. The NPV of an investment is defined as the sum of the present values of the annual cash flows minus the initial investment. The annual cash flows are the net benefits generated from the investment during its lifetime. These cash flows are discounted or adjusted by incorporating the uncertainty and time value of money (Gittinger 1982). NPV is one of the most robust financial evaluation tools to estimate the value of an investment. The investment for one specific land use is labelled profitable if the NPV is higher than 0. The formula to calculate the NPV is:
where Bt is benefit at year t, Ct is cost at year t, t is time denoting year and i is discount rate.
The measure of return to labour is reached by adjusting the wage rate until the NPV reaches zero. This proxy can be used since the calculation converts the surplus to a wage rate. The value of return to labour indicates the attractiveness of the system: if the return to labour is higher than the average wage rate then it is attractive for people to work in the system (Tomich et al 1998, Vosti et al 2000).
NPV =Bt - Ct
(1 + i)tΣt = n
t = 0

49Negotiation-Support Toolkit for Learning Landscapes
■ Policy analysis matrix (PAM)The Policy Analysis Matrix (PAM) is a matrix of information about agricultural and natural resources policies and factors of market imperfections that is created by comparing multiple years of a land-use system’s budget calculated at financial prices (reflecting actual markets) and economic prices (reflecting efficiency). The matrix is designed to analyze the pattern of incentives at the microeconomic level and to provide quantitative estimates of the impact of polices on those incentives.
PAM’s structure is composed of two set of identities. One set defines profitability and the other defines the difference between private price and social values, measuring the effect of divergence; as the difference between observed parameters and parameters that would exist if the divergence were removed (Monke and Pearson 1995).
Profitability as the first identity of the accounting matrix is measured horizontally, across the columns of the matrix. Profits, shown in the right-hand column, are found by subtraction of cost, given in two middle columns, from revenue, indicated in the left-hand column. This column constitutes profitability identities. There are two profitability calculations: private profitability and social profitability.
Private profitability calculation is provided in the first row. The term ‘private’ refers to observed revenues and costs reflecting market prices received, or paid, by farmers, merchants or processors in the agricultural system. Private profitability calculations show the competitiveness of agricultural systems at given current technologies, output values, import cost and policy transfer. Social profitability calculation is the accounting matrix utilizing social prices. These valuations measure comparative advantages or efficiencies in the agricultural commodity system.
table 6.1. Policy Analysis Matrix (PAM)
RevenuesCost
ProfitsTradable inputs Domestic Factor
Private prices A B C D1
Social prices E F G H2
Effect of divergences I3 J4 K5 L6
Note: 1) Private profit, D, equals A minus B minus C; 2) Social profit, H, equals E minus F minus G; 3) Output transfer, I, equals A minus E; 4) Input transfer, J, equals B minus F; 5) Factor transfer, K, equals C minus G; 6) Net transfer, L, equals D minus H (they also equal I minus J minus K). Source: Monke and Pearson (1995, p.19)
■ Case study: Tanjung Jabung BaratExisting land-use systems in Tanjung Jabung Barat district, Jambi province, Indonesia, were analyzed from available land-cover maps. Based on the spatial classification, eight types of land uses in the district were identified: natural forests, timber plantations, oil palm, coconut, rubber, coffee, betelnut and annual food crops. The verification step found that there were two types of land: mineral and peat. The land-use systems were further classified into large- and small-scale operations.

50 Negotiation-Support Toolkit for Learning Landscapes
table 6.2. Land cover of Tanjung Jabung Barat district and the main land-use systems
land-cover type Selected land-use system Scale of
operation on mineral soil on peat soil
Forest Forest extraction. Logging (low density) n/a Large-scale enterprises
Acacia mangium Industrial timber plantation (Acacia mangium) (and similar species)
n/a
Oil palm Oil palm (3000 ha) n/a
Oil palm (1–2 ha) Nucleus estate and smallholdings (NES) Independent smallholding Smallholdings
Oil palm
Coconut (1–2 ha) Coconut monoculture Coconut-based mixed garden (with coffee and betel nut)
Rubber (1–2 ha) Rubber monoculture Rubber monoculture rubber agroforest
Coffee (1–2 ha) n/a Coffee-based mixed garden (with betel nut)
figure 6.1. shows profitability estimates for each land use.
figure 6.1. Net present value and return to labour for major land-use systems in Tanjung Jabung Barat
Note: i= 8%, exchange rate= IDR 9084/USD 1
Return to Labour($/psday)
NPV($/ha)
Large Scale Smallholder
Return to land/NPV Return to Labour
Crops
Oil-
pal
m la
rge
scal
e
Log
gin
g
Aca
cia
pla
nta
tio
n
8,000
6,000
4,000
2,000
0
20
15
10
5
0
Smal
lho
lder
oil-
pal
m
Smal
lho
lder
oil-
pal
m o
n p
eat
Rub
ber
mo
no
cult
ure
Rub
ber
ag
rofo
rest
Rub
ber
ag
rofo
rest
on
pea
t
Co
con
ut
mo
no
cult
ure
Co
ffe
agro
fore
st w
ith
bet
eln
ut
Co
ffe
agro
fore
st a
nd
bet
eln
ut
Co
con
ut-
bet
eln
ut
agro
fore
st
Dry
lan
d p
add
y
Mai
ze

51Negotiation-Support Toolkit for Learning Landscapes
■ InterpretationOil palm is the most profitable land-use system in Tanjung Jabung Barat district for both large- and small-scale operations. Oil palm on peat has lower profitability compared to that on mineral soil because of the additional costs of development and maintenance of drainage.
With high return to labour, oil palm is the most attractive for people compared to working in another land-use system.
The competitiveness of agroforestry systems is high, with the profitability rate almost as high as oil palm. The threat of conversion of these systems to oil palm is higher on mineral than on peat soil.
References to other recent case studies include Ekadinata et al. (2010), Rahmanulloh et al. (2012) and Sofiyuddin et al. (2012).
■ Key referencesMonke E, Pearson SR.1989. The Policy Analysis Matrix for agricultural development. Ithaca, NY: Cornell
University Press.
Tomich T, Noordwijk M, Budidarsono S, Gillison A, Trikurniati K, Murdyaso D, Fagi A. 1998. Alternatives to slash-and-burn in Indonesia: summary report and synthesis of phase II. Bogor, Indonesia: ASB Partnership for the Tropical Forest Margins; Central Research Institute for Food Crops.
52 Negotiation-Support Toolkit for Learning Landscapes
Rapid market appraisal (RMA) Aulia Perdana, Suseno Budidarsono, Iwan Kurniawan and James M. Roshetko
The Rapid Market Appraisal (RMA) has been designed to analyze value chains from farmgate to consumers, the role of various people involved in adding value, and their bargaining power used to capture part of the end-user value. This information can subsequently be used to 1) raise awareness with farmers about the importance of market information; and 2) guide interventions aimed at improving the efficiency of marketing systems and generating benefits for participants.
■ Introduction: market opportunities for enhancing local livelihoodsThe development of market economies and rural infrastructure has expanded commercial opportunities to many farm communities. However, traditional tree management often leaves communities unprepared to produce reliable quantities of high-quality products that meet market specifications. For example, Predo (2002) found in the Philippines that tree farming was more profitable than crop production but uncertain marketing conditions were a deterrent to planting trees. Smallholders generally have weak market links and poor access to market information. They typically sell products through traders and are unaware of the final customer and the quality requirements in the value chain. Farmers tend to produce and sell agricultural products according to local norms, competing with neighbours for a small part of the market. Market agents spend considerable time and other resources searching for, collecting and sorting smallholders’ products of small quantity and various qualities. The status quo of this farmer–market agent interaction tends to be entrenched and it is not easy to shift towards more informed producers with greater bargaining power along the value chain but examples abound that it can be done. The starting point has to be awareness of the current system, collective action forchange and a policy environment that is conducive.
The Rapid Market Appraisal (RMA) strengthens awareness regarding the importance of market information (Young 1994). It is a tool to understand how products (commodities) flow to end users and to understand how commodity systems are organized, operate and perform. Through an RMA, farmers will begin to see the importance of customers’ views and market information and specifications. It can inspire farmers to develop new understanding regarding the commodities they produce; and to evaluate commodity marketability by seeking input directly from customers and market agents. Farmers will become aware of the advantages they have, the barriers they face, and in what state of competition they are in (Perdana et al 2012). The information can also inform higher-level policy in supporting fair and efficient value chains.
RMA is a quick, flexible and effective way of collecting, processing and analyzing information and data about markets. RMA is also an efficient method for acquiring knowledge about marketing systems to inform production and marketing strategies, policy (He 2010) and the design and implementation of relevant interventions. It is a process for discovering market opportunities and how to capture them through focus on an entire value chain (Nang’ole et al 2011).
7

53Negotiation-Support Toolkit for Learning Landscapes
■ Objectives of RMA1 To analyze the existing value chain from farmgate to consumers and the current roles in adding
value and the bargaining power to capture part of the end-user value.
2 Raise awareness with farmers about the importance of market information.
3 Help producers to understand how commodities flow to end users and how markets are organized, operate and perform.
4 Guide interventions aimed at improving the efficiency of marketing systems and generating benefits for participants.
■ StepsRMA comprises a range of simple methods and tools for collecting quantitative as well as qualitative information. Such methods avoid the costs and delays of formal questionnaire surveys, which have often failed to provide timely and sufficiently detailed information.
Flexibility is one of the main attributes of an RMA. There are no fixed rules regarding the size and composition of the team involved, which will depend on the resources available, the characteristics of the location, and the objectives of the survey. Likewise, the number and type of markets visited, and the number and type of ‘key informants’ selected, will vary according to the purpose of the RMA and the resources available. Similar comments can be made regarding the time required to collect and analyze information.
The method follows the steps below.
1 Define objectives
a. Determine what products will be assessed, identify and clarify information needs, specify objectives jointly with farmers and community representatives
2 Appraisal planning
a. Design the survey, sampling method and questionnaire
3 Collection of available information
a. Select enumerators
b. Conduct in-depth interview, market observations, focus-group discussions, secondary data collection, data cross-checking
4 Data analysis (product-based)
a. Identify market structures and characteristics in relation to the production system, harvesting, post-harvest processing and marketing practices
b. Characterize the product flow along the value chain, identifying added values, chain actors and their roles, price structures and margins for each of the chain’s actors
c. Analyze constraints and opportunities for change
5 Share initial results and prioritize ‘action research’ by farmers’ groups who want to try and change the status quo
6 Share results at higher policy levels to discuss options to remove bottlenecks and facilitate the value chain to further develop

54 Negotiation-Support Toolkit for Learning Landscapes
■ An example of RMA in agroforestryThe example is taken from an RMA activity (Tukan et al 2006) focusing on improving the market chain of bananas grown in farm gardens by linking farmers to markets in West Java. The RMA started with informal visits to make observations in the study area and hold discussions with key farmers and other stakeholders. The information derived from these visits and knowledge gained from secondary information was used to design the market survey. After selecting enumerators and producing a reliable questionnaire, the survey was then conducted applying snowball sampling, which can take the enumerators from farmers all the way to the trading companies, and even consumers. The information sought was key market actors and their roles, values added at each node, prices of sales and profit margins at each node, and obstacles and opportunities faced by each market actor. The information was then cross-checked by direct observation and focus-group discussions with relevant stakeholders in the project area. The cross-checking process continued until the findings were clear, consistent and complete. The output was a thorough value chain of banana. A draft summary of the output was then shared with stakeholders in a formal workshop. This provided an opportunity for additional cross-checking with larger groups. Any inconsistencies or gaps in the information were identified and addressed through further field investigation. A summary of farmers’ marketing practices was finalized. It included detailed priority species, marketing channels and agents, farmers’ market roles, marketing problems and opportunities. Subsequent to the RMA, work plans were developed consisting of intervention recommendations of what farmers, market agents and other stakeholders could do to improve the production and marketing of smallholders’ bananas.
■ Key references[ILO] International Labour Organization. 2000. Rapid market appraisal: a manual for entrepreneurs. FIT
Manual Series. Geneva: International Labour Organization.
Nang’ole EM, Mithöfer D, Franzel S. 2011. Review of guidelines and manuals for value chain analysis for agricultural and forest products. ICRAF Occasional Paper No. 17. Nairobi: World Agroforestry Centre

55Negotiation-Support Toolkit for Learning Landscapes
Gender roles in land use and value chains (GRoLUV)
Elok Mulyoutami, Delia Catacutan, Endri Martini, Noviana Khususiyah, Janudianto, Grace B. Villamor and Meine van Noordwijk
Gender specificity of land use (decisions, labour, remuneration) and participation in value chains needs to be understood. While preceding methods are supposed to represent the diversity among the farming community, intra-household relations and the position of female-headed households deserve specific attention. Analysis and reliable data can be used by local ‘agents of change’ to step over the shadow of cultural norms of the status quo and create conditions for greater gender equity. Gender Roles in Land Use and Value Chains (GRoLUV) guides analysis of gender differentiation.
■ IntroductionIn most cultures, livelihoods’ options differ between men and women. Gender-specific norms usually restrict the freedom of new generations of individuals to realize their potential for self-realization. Educational and social systems influence aspirations and reproduce the norms as desirable and appropriate, so the system conserves itself. Yet, at the level of the Millennium Development Goals, equal access to education for girls has been accepted as an important element of development strategies. Quisumbing and Pandolfelli (2010) estimated that production in agricultural and agroforestry sectors can be expected to increase by 10–20% if women’s roles in use of farm inputs and labour were appreciated through proper access to education and other resources. Women and men have different strategies in managing natural resources that lead to different problems and also different types of solutions; they also generate knowledge about environmental changes in different ways. Therefore, taking into account the differences between women and men is necessary in the course of designing and implementing a development program with attention to environmental issues.
Tools such as PALA, PAPoLD, RAFT and RMA will have already provided indications of the gender-specific dimensions of land-use and poverty patterns, livelihoods’ strategies, use and knowledge of the landscape and engagement with post-harvest processing and marketing. The GroLUV tool can be used to further elicit gender-specific information and understand the conditions underpinning differences.
In many cultures it is the norm that men are taking the lead in activities in the landscape far from the homestead, except for collection of drinking water from rivers or firewood, which is usually a woman’s task, while women focus on activities closer to the homestead. In many situations, harvesting and management of forest products (timber and non-timber) is dominated by men, while processing and marketing may be more of women’s task. For example, Martini et al (2012) described for sugar palm the role of women in marketing differed between palm sugar and palm wine as marketed products (Figure 8.1).
8

56 Negotiation-Support Toolkit for Learning Landscapes
figure 8.1. Gender differentiation of tasks and responsibilities along the stages of a sugar-palm production cycle in Batang Toru, North Sumatra
Note: As analyzed by Martini et al 2012
figure 8.2. Conceptualization of management decision cycles that involve satisfaction with status quo and/or
active search for new options; potentially all steps are gender-differentiated
Source: Villamor et al 2014
Labour for planting and
nursery operations
Dominantly male
Dominantly female
Tree maintenance
Tapping nira and Tuak production
Sugar and kolang-kaling production
Tuak, Ijuk and Kolang-kaling sale
gender neutral
Nursery management
Garden management
Firewood collection
Sugar sale
Labour for tree and
garden management
Labour for harvesting and post-harvesting
Labour for marketing

57Negotiation-Support Toolkit for Learning Landscapes
Not only the portfolio of practices and preferences but also the style of learning can be gender specific (Figure 8.2). As stated before, learning landscapes need two types of learning: 1) local actors and stakeholders will learn by experience if there is political space for innovation; while 2) external stakeholders want to understand the types of change that occur in comparison with a properly documented baseline. These dual aspects of learning can be mutually supportive through appropriate combination of approaches but their differences (reminiscent of sentinel versus learning landscapes in Fig. 0.10) need to be respected.
■ Objectives1 Appreciate gender specificity, in the local cultural context, of production factors: labour; access
to, and control of, land; access to credit; knowledge and access to innovation; and product value chains.
2 Understand gender specificity within the local cultural context and of the different stages along a management cycle and participation in market-based value chains of major agroforestry components.
3 Understand gender specificity of preferences for trees (or absence thereof ) in the farmed landscape.
4 Assess the degree to which gender specificity of preferences gets expressed on farms and in the landscape.
■ Steps 1 A baseline survey prior to project implementation aimed at portrayal of the real condition, using
the Harvard Analytical Framework and the Moser Gender Planning Framework. The Harvard framework makes women’s roles and work visible (Overholt et al 1985, Rao et al 1991). The Moser framework (Moser 1993) provides clear guidance for identifying strategic gender needs. Descriptive statistical analysis quantifies the captured information regarding gender access and control.
2 Focus-group discussions on access to land, daily and seasonal time schedules, input requirements and output prospects of the main agroforestry products and services.
3 Focus-group discussions on gender specificity related to
a. the stages of a tree’s lifecycle and associated value chain;
b. access to (and perceived security in) areas of increasing distance to the village or homestead;
c. access to, and control of, agroforestry benefits.
4 Descriptive statistical analysis to quantify captured information regarding gender access and control over resources and benefits.
5 Landscape walks, with informants from both genders, to identify the major trees, discussing their utility for domestic use and/or marketing, triangulating possible differences between men and women with information obtained in steps 1 and 2.
6 Focus-group discussions similar to the WNoTree method that clarify any gaps between desirable tree cover, tree diversity and species portfolio, and what is present.
7 More detailed analysis of gender differences in decision making and access to new information from trusted sources that can lead to identification of communication priorities.

58 Negotiation-Support Toolkit for Learning Landscapes
8 Ensure that gender specificity of current and potential future agroforestry practices is appreciated and that appropriate steps are taken to reduce or remove inequities in access to external resources and opportunities as part of broader action plans and based on local initiative.
■ Case study: GRoLUV in IndonesiaAs suggested by Step 1, at the start of the Agroforestry and Forestry in Sulawesi (AgFor) project in Indonesia, considerable effort by the researchers and partners was put into detailed description of the baseline, both to assist in prioritization of subsequent project activities, and to have a proper reference for future impact studies, aimed at structured learning of what worked well and what not or less so.
Data collection employed both qualitative and quantitative approaches closely related to the research question. The range of data collected was implemented based on consideration of the methods best able to address detailed questioning. The detailed research questions and methods are described in Mulyoutami et al (2012). The primary data collection methods employed were full-day mini-workshops or group discussions with village representatives (Box 8.1). Separate discussions were held with female and male groups, using the same set of questions to compare the different points of view. Household surveys were conducted using descriptive statistics to capture current situations. Some individual interviews were undertaken to gain general views of village and community conditions. Data from the bureau of statistics and reports on the Human Development Index, Gender Development Index and Gender Empowerment Index were used to illustrate how gender issues at district and provincial levels were situated in the national context.
Box 8.1. focus-group discussions in practice A full day mini-workshop or focus-group discussion was held in each village with participants comprised of invited villagers and key people indicated by leaders of the village prior to the discussions. The aim was to gain basic information about land use and sources of livelihoods, demography and migration patterns, land-management practices, poverty, information related to training, extension and village organization, marketing practices, sources of, and access to, planting materials, communication and gender roles within natural resource management. They were implemented utilizing participatory principles and applied triangulation processes from multiple sources of information. This information was consolidated within the discussions. Mini-workshops or group-based interviews usually started at 9 am and ended at 4 pm. In each village, the participants were divided into three different groups consisting of 4–8 farmers. The first group consisted of mostly male participants and discussed issues of land use, history of livelihoods’ sources, land-management practices, demography and migration. The second group consisted of only male participants and discussed gender roles in land management, communication, village institutions, gender perceptions of land use, values and poverty and basic information about their needs for extension. The third group used the same set of questions as the second group but consisted of only female participants. Discussions were held in village offices or in houses belonging to local leaders.

59Negotiation-Support Toolkit for Learning Landscapes
The results clearly demonstrated that women and men had different roles in managing households, faming activities and natural resources. In the areas of household, farm production, land-use management and marketing, women were mostly responsible for domestic tasks and maintaining the land located close to the settlement. Men were mostly responsible for earning income from working in the public domain and were fully responsible for maintaining the land that was located far from the settlement and for physically heavy work. The close proximity of the area of work to the house was favourable for women so that they could still undertake other productive work while doing household chores.
figure 8.3. Gender roles in selected farming activities in the AgFor Sulawesi case study
Source: Mulyoutami et al 2012
The relationship between gender and land, particularly in terms of land rights and ownership, as well as how gender influences perceptions of land use and function was clearly observed. Women were not acknowledged as legal landholders since most of the land certificates were under the name of men. Clearly, providing a more conducive condition for women to become land owners, legalized in land certificates, would increase equity in terms of land rights and ownership. This is specifically an issue for female-headed households. Gender was also found to influence men and women’s perceptions of land-use values, their importance and function.
Furthermore, the data showed that women were more knowledgeable about land-use values with regards to environmental issues related to the use value of biodiversity, especially medicinal plants, while men were more aware of conservation or protecting the environment. The market chain in

60 Negotiation-Support Toolkit for Learning Landscapes
Sulawesi, in particular in South and Southeast Sulawesi, had already taken women into account. Women had equal positions in marketing, with responsibility for cocoa, clove and coffee. However, the producer or villager is at the end of the market chain and without access to knowledge of markets and related product (quality, price) information so they have little room to expand their income.
The study led to a number of recommended criteria and indicators for gender empowerment in the local context that informed further project-level discussions.
■ Key references Quisumbing AR, Pandolfelli L. 2010. Promising approaches to address the needs of poor female
farmers: resources, constraints and intervention. World Development 38(4):581–592.
Mulyoutami E, Martini E, Khususiyah N, Isnurdiansyah, Suyanto. 2012. Agroforestry and Forestry in Sulawesi series: Gender, livelihoods and land in South and Southeast Sulawesi. Working paper 158. Bogor, Indonesia: World Agroforestry Centre (ICRAF) Southeast Asia Regional Program. DOI: 10.5716/WP12057.PDF.