Who is leaving? Potential emigration from Bulgaria in the ... · Who is leaving? Potential...
39
Who is leaving? Potential emigration from Bulgaria in the beginning of the XXI century Vesselin Mintchev, Institute of Economics at the Bulgarian Academy of Sciences, Center for Comparative Studies, Sofia Venelin Boshnakov, University of National and World Economy, Sofia Iordan Kaltchev, National Institute of Statistics Valentin Goev, University of National and World Economy, Sofia 1. Introduction Following the systemic changes in the beginning of the 1990’s, Central and Eastern Europe (CEE) generated emigration. Bulgaria was no exception. For the years between the two most recent censuses of 1992 and 2001, Bulgaria’s population declined by about 6%. More than 1/3 of this decline is due to the international mobility of Bulgarian citizens. The gross emigration for the period is estimated at 196 thousand persons, i.e. on average 22 thousand people emigrate each year. (Census 2001, p. 51.) Despite the actual ban on free movement during the Cold War years, emigration is not a new phenomenon in Bulgaria. According to different estimations, more than 900 thousand individuals migrated from Bulgaria before 1945 and economic emigration between World War I and II was about 125,000 individuals. At the same time Bulgaria accepted more than 800 thousand persons (Mintchev, V. 1999). After 1945, based on bilateral agreements between Bulgaria and Turkey about 680 thousand ethnic Turks migrated from Bulgaria (Gashter, August. 2002, p.5). Pursuant to different bilateral agreements 1 , Bulgarian workers were employed in Central Europe, the Komi Republic in the former USSR, in North Africa, etc. Conflicting assessments of the new emigration wave’s consequences are to be found in the literature. They range from dramatic, in the sense of unrecoverable loss of human capital, measured in years of education and professional experience of the emigrants (Minkov, M. 1994, p.166.) – to neutral, comparing the emigration potential of Bulgaria to that of Austria in the context of the processes of globalization (Gashter, August. 2002). This of course, is the country of origin point of view. 1 A source of information on these issues is the annual reports of SOPEMI.
Transcript of Who is leaving? Potential emigration from Bulgaria in the ... · Who is leaving? Potential...

Who is leaving? Potential emigration from Bulgaria in the beginning
of the XXI century
Vesselin Mintchev, Institute of Economics at the Bulgarian Academy of Sciences,
Center for Comparative Studies, Sofia
Venelin Boshnakov, University of National and World Economy, Sofia
Iordan Kaltchev, National Institute of Statistics
Valentin Goev, University of National and World Economy, Sofia
1. Introduction
Following the systemic changes in the beginning of the 1990’s, Central and
Eastern Europe (CEE) generated emigration. Bulgaria was no exception. For the years
between the two most recent censuses of 1992 and 2001, Bulgaria’s population
declined by about 6%. More than 1/3 of this decline is due to the international
mobility of Bulgarian citizens. The gross emigration for the period is estimated at 196
thousand persons, i.e. on average 22 thousand people emigrate each year. (Census
2001, p. 51.) Despite the actual ban on free movement during the Cold War years,
emigration is not a new phenomenon in Bulgaria. According to different estimations,
more than 900 thousand individuals migrated from Bulgaria before 1945 and
economic emigration between World War I and II was about 125,000 individuals. At
the same time Bulgaria accepted more than 800 thousand persons (Mintchev, V.
1999). After 1945, based on bilateral agreements between Bulgaria and Turkey about
680 thousand ethnic Turks migrated from Bulgaria (Gashter, August. 2002, p.5).
Pursuant to different bilateral agreements1, Bulgarian workers were employed in
Central Europe, the Komi Republic in the former USSR, in North Africa, etc.
Conflicting assessments of the new emigration wave’s consequences are to be
found in the literature. They range from dramatic, in the sense of unrecoverable loss
of human capital, measured in years of education and professional experience of the
emigrants (Minkov, M. 1994, p.166.) – to neutral, comparing the emigration potential
of Bulgaria to that of Austria in the context of the processes of globalization (Gashter,
August. 2002). This of course, is the country of origin point of view.
1 A source of information on these issues is the annual reports of SOPEMI.
2
The fears of mass emigration from Central and Eastern Europe mainly towards
the countries of the European Union (EU-15) are prompting serious discussions and
evaluations of the east-west migration flow. Regardless of whether aggregate data
would be used and respectively, cross sectional or time series models, benchmarking
on prior emigrations from Southern to Northern Europe or among individual states in
the USA (See for instance Tito Boeri, Herbert Bruecker, 2001, pp. 10-14; Thomas K.
Bauer, Klaus F. Zimmermann, 1999, pp. 44-46; ); or micro-data (Thomas K. Bauer,
Klaus F. Zimmermann, 1999, pp. ; Stephen Drinkwater, 2002; Harry Papapanagos
and Peter Sanfey, 1998; Dhori Kule, Ahmet Mancellari, Harry Papapanagos, Stephen
Qirici and Peter Sanfey, 2000; Hazans, Mihalis 2003; International Organization for
Migration (IOM), 1999 and 2001), enabling characterization of potential emigrants
from the point of view mainly of the human capital and network theories (Douglas S.
Massey, Joaquin Arango, Graeme Hugo, Ali Kouaouci, Adela Pellegrino, J. Edward
Taylor, 1993, pp. 431-465.), the so-called 3%-4% Rule of Thumb from the first
analyses in the 1990s is accepted (Leyard, R, Blanchard, O, Dornbusch, R, and
Krugman, P, 1992; Thomas Straubhaar, 2001, p. 169). Namely – Central and Eastern
Europe would lose not more than 3-4% of its working-age population for a period of
about 15 years after the lifting of the transitory restrictions on labor mobility for
Eastern European citizens2. Of them, however, only one about a half would stay in the
West definitively, 2/3 of this flow is expected to be recruited from two countries –
Poland and Romania.
Obviously, emigration from Central and Eastern Europe (of course, not
counting Russia and the CIS states) does not pose a serious problem for recipient
industrialized societies (See also Borjas, G. 1999), except for certain border regions
in Austria, Germany and Greece3. In this sense, despite the extension of temporary
labor mobility restrictions from EU expansion south towards actual enlargement, the
better immigration policy would still be „no borders – no immigrants” (Martin, Philip
2003, p.18.) The modest emigration potential of Bulgaria from the perspective of
2 Potential emigration assessments in the countries of South-Eastern Europe – Romania, Bulgaria and particularly Albania and to some extent in Poland exceed the respective assessments for Central Europe. See for example Bauer T.K. and K.F. Zimmermann, “Assessment of Possible Migration Pressure and its Labor Market Impact Following EU Enlargement to Central and Eastern Europe”, IZA Research Report No. 3, July 1999, p.45. 3 As regards undocumented labor emigration from Bulgaria to Greece in particular, see Markova, Evgenia and Alexander H. Sarris. 1997, “The Performance of Bulgarian Illegal Immigrants in the Greek Labor Market”, South European Society & Politics, Vol. 2, No 2 (Autumn), pp. 55-77.
3
receiving countries, incl. – in comparison with other states from the European south-
east – Albania, Romania and Moldova; does not take this issue off the agenda. This
article is not intended to test hypotheses of a particular theory of international
migration. We have to answer the question – “Who is leaving?”. Here is why in the
following sections we evaluate the emigration potential of this country and outline
potential emigrants’ profiles. For this purpose we are using micro-data from two
opinion polls, conducted in 2001 and 2003 based on a questionnaire, incorporating
standard human capital variables (gender, age, education, etc.) and network theory
assumptions (in regard to prior stays abroad, methods of departure). Before that,
however, we will briefly dwell on the use of emigration’s micro-data empirical
studies.
2. Potential emigration’s micro-data empirical studies
Except for the studies of the International Organization on Migration in
Central and Eastern Europe (IOM, 1999, 2001) potential emigration’s micro-data
empirical studies are an exception, rather than a rule. Meanwhile, rich information
and analyses exist on the internal mobility of the population.
Studies of individual emigration intentions capture subjective opinions,
attitudes, etc. in regard to the likelihood of cross-border mobility. The opportunity to
evaluate emigration attitudes and potential emigrants’ profiles is an advantage.
Despite the high correlation of existing attitudes and actual emigration, the subjective
character of the opinions expressed limits this approach. It’s very easy to claim that
one would emigrate (even more so that in some communities this is a matter of
prestige); it is much more difficult to emigrate indeed (Fassmann & Munz, 2002;
Drinkwater, 2002). Attention is paid to the differences between the emigration
propensity and its implementation, incl. the undertaking of specific preparatory steps.
Usually this is due to the manner, in which the questions are formulated, registering
the emigration intentions. If very generally formulated, such as – whether the
respondents have contemplated travel / stay in Western Europe or overseas, a high,
but rather hypothetic emigration potential may be expected. Conversely, the questions
on undertaking specific actions in this regard, such as – fulfillment of the intentions in
the current year; learning a foreign language; search for employment/employer in the
“target” country; application for a work visa (IOM, 1999, 2001) etc., register
considerably lower emigration attitudes: depending on the individual questions –

4
usually under 1% of the working age population (IOM, 1999, 2001). This
circumstance is taken into account in the current study. That’s why the evaluation of
the emigration potential from Bulgaria “is controlled” by a question regarding the
intentions for emigration in the current year in the opinion polls, which we are using.
Obviously, a small number of the potential emigrants would be ready to pay the direct
and indirect economic and other costs of emigration4, as defined by the human capital
theory5.
In the opinion polls a similar question is used, setting apart potential emigrants
from non-emigrants (by their likelihood of emigration) through an ordinal scale of
replies. The scale contains 4 or 5 categories of responses – from „definitely not” to
„definitely yes”. The 5th option is normally reserved for „don’t know / did not
respond” 6. In both opinion polls, on which our further analysis is based, a question
with a 4-degree ordinal scale is used.
On the other hand, based on the planned duration of the stay abroad usually
three main potential emigrants groups are outlined – short-term emigrants (intending
to spend abroad less than 1 year), medium-term emigrants (for a term of over 1 year)
and settlers (see for instance Fassmann & Munz, 2002 who summarize micro-data
empirical studies). Bastyr use a similar typology – permanent (definitive), temporary-
resident and temporary (commuter) emigration (Bastyr, 2001). Clearly, the expected
stay abroad differentiates permanent and temporary (long-, short-term and
commuting) emigration attitudes. This imply specific policies: activation of a
temporary, mainly short-term labor emigration based on bilateral agreements in both
sending and receiving countries; regulation of emigration services’ ventures – mainly
in the countries of origin; a strict selective immigration policy in some of the main
destinations, etc.
In conclusion, the types of potential emigrants are most frequently identified
(1) by the self-assessed probability of leaving the country of origin – emigrants/non-
4 A possible explanation of this we may find in the option concept of Burda, M. 1995, “Migration and option value of waiting”, Economic and Social Review, 27, pp. 1-19, according to which the effect of the neoclassical income differential is limited by the uncertainty in the success of emigration 5 Originally developed by Sjaastad, L. 1962, “The costs and returns of human migration”, Journal of Political Economy, 70, pp. 80-93. 6 Similarly, in the data of Papapanagos and Sanfey a four-degree ordinal scale is used with the categories “definitely not”, “probably not”, “probably yes” and “definitively yes” (Papapanagos and Sanfey, 1998). At the same time Drinkwater evaluated the inclination towards emigration by a 5-degree scale with response categories ranging between “very willing” and “very unwilling” (Drinkwater, 2002).
5
emigrants, and (2) by taking into consideration the preferred duration of the stay
abroad – permanent, long-term and short-term emigrants. In micro-data empirical
study further we follow this approach. The stress of the analysis is laid on the
differences between permanent and temporary emigration potential and different
emigrants’ profiles from Bulgaria.
The standard human capital variables – gender, age, education, usually are
present in micro-data analyses. The „selection” of emigrants depends also on their
family and employment status, as well as on prior stays abroad (Thomas K. Bauer,
Klaus F. Zimmermann, 1999, pp. ; Drinkwater, 2002). Papapanagos and Sanfey add
to their analysis for Albania the type of settlement, income level, professional group
and expressed approval/disapproval of the reforms conducted (Papapanagos and
Sanfey, 1998; Dhori Kule, Ahmet Mancellari, Harry Papapanagos, Stephen Qirici and
Peter Sanfey, 2000). In our analysis we use three groups of variables:
1) Gender, age, family status and ethnicity;
2) Type of settlement, employment, education, income level (we have income
data from 2003 opinion poll only) and previous stay abroad;
3) Destination, goals, expected employment, modes of departure.
Each of the variables (determinants) mentioned above provides an opportunity
to test hypotheses, inspired by particular theories and research traditions of
international migration, particularly where macro-data analysis is available. At the
same time the determinants’ tests in regard to potential emigrants in general, tends to
underestimate differences between permanent and temporary long- and short-term
emigrants’ attitudes. In this sense, except an answer to the question – „Who is leaving
Bulgaria?” we are also trying to learn why in some cases permanent, and in other
cases – temporary emigration is preferred?
Usually, the micro-data analyses’ objective is to evaluate the determinants’
partial/net effect. Drinkwater, and Papapanagos et al. for example, assess a series of
probit models, in regard to the net effect of human capital and network variables
(Drinkwater, 2002; Papapanagos and Sanfey, 1998; Dhori Kule, Ahmet Mancellari,
Harry Papapanagos, Stephen Qirici and Peter Sanfey, 2000). Bauer and Zimmermann
note the differences of the regression coefficients of education, employment and
family status variables between the domestic and international mobility of the
6
population (Bauer, Thomas K. and Klaus F. Zimmermann, 1999, pp.) In the micro-
study, based on the 2001 and 2003 opinion polls in Bulgaria (using an identical
questionnaire, with one exception – in 2003 a question was added regarding the
incomes of respondents) by means of one-dimension distributions (cross-tabulations)
for all variables and a binary logistical regression – for the first two groups of them,
where we have responses from potential emigrants, but also from non-emigrants, we
attempt to uncover the reasons why in one set of circumstances permanent, and in
another one – temporary (long-term or short-term) emigration is preferred? In this
connection further on we review the overall emigration potential of the working-age
Bulgarian population; the methods of analysis and the potential emigrants’ socio-
demographic profiles and attitudes.
3. General evaluation of the emigration intentions of Bulgarian citizens
Data’s sources
The empirical analysis uses micro-data from two surveys, conducted in 2001
and 2003. The 2001 survey included 25`000 respondents from 15 to 60 years of age
(after reduction of the non valid questionnaires). It was conducted by the National
Institute of Statistics during the regular population census and coincided with the
lifting of Schengen restrictions on the movement of Bulgarian citizens7. The repeat
survey was conducted in June-July 2003 by the Center for Comparative Studies –
Sofia, the ALPHA Research sociological agency with the financial support of GDN –
CERGE-EI, Prague. The 2003 survey used a similar questionnaire. The sample
included approximately 1100 individuals and was later reduced to 1006 respondents
aged from 17 to 65.
Types of potential emigrants
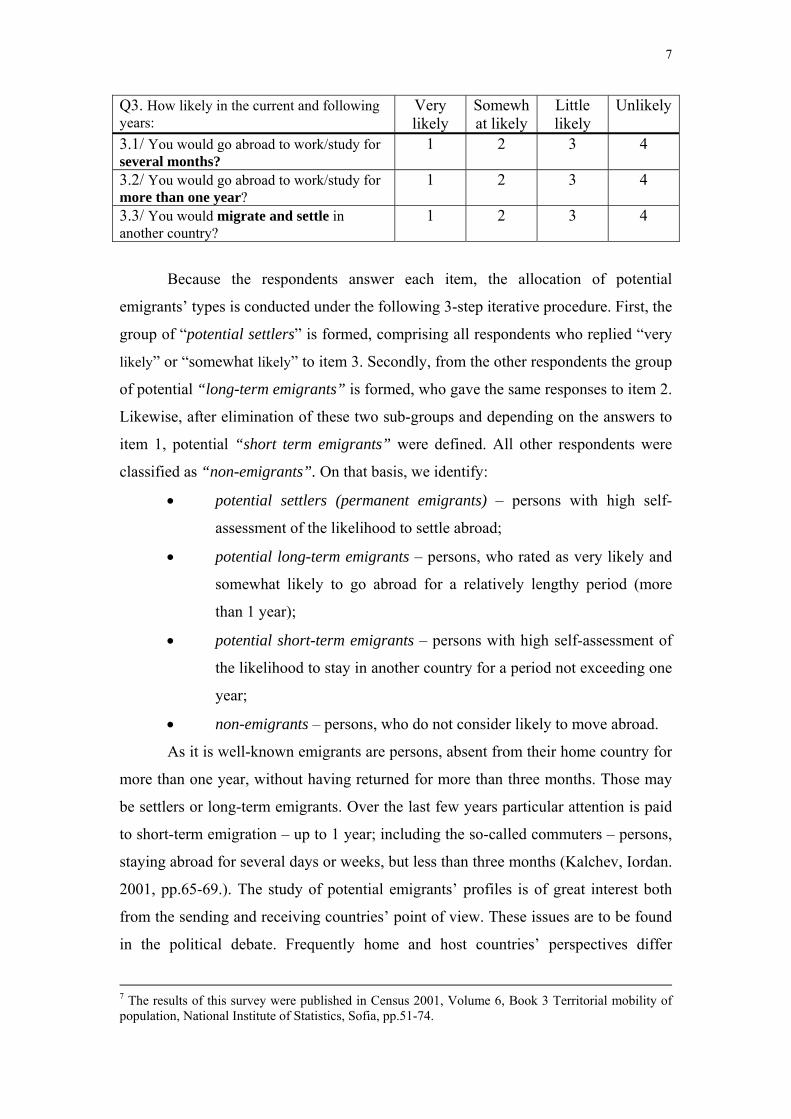
The survey applies the above approach towards categorization of potential
emigrants, based on the answers to the question regarding emigration intentions of
respondents. Its three items incorporate the criteria for determining the types of
potential emigrants: (1) likelihood to emigrate; (2) duration of the perceived stay
abroad.
7
Q3. How likely in the current and following years:
Very likely
Somewhat likely
Little likely
Unlikely
3.1/ You would go abroad to work/study for several months?
1 2 3 4
3.2/ You would go abroad to work/study for more than one year?
1 2 3 4
3.3/ You would migrate and settle in another country?
1 2 3 4
Because the respondents answer each item, the allocation of potential
emigrants’ types is conducted under the following 3-step iterative procedure. First, the
group of “potential settlers” is formed, comprising all respondents who replied “very
likely” or “somewhat likely” to item 3. Secondly, from the other respondents the group
of potential “long-term emigrants” is formed, who gave the same responses to item 2.
Likewise, after elimination of these two sub-groups and depending on the answers to
item 1, potential “short term emigrants” were defined. All other respondents were
classified as “non-emigrants”. On that basis, we identify:
• potential settlers (permanent emigrants) – persons with high self-
assessment of the likelihood to settle abroad;
• potential long-term emigrants – persons, who rated as very likely and
somewhat likely to go abroad for a relatively lengthy period (more
than 1 year);
• potential short-term emigrants – persons with high self-assessment of
the likelihood to stay in another country for a period not exceeding one
year;
• non-emigrants – persons, who do not consider likely to move abroad.
As it is well-known emigrants are persons, absent from their home country for
more than one year, without having returned for more than three months. Those may
be settlers or long-term emigrants. Over the last few years particular attention is paid
to short-term emigration – up to 1 year; including the so-called commuters – persons,
staying abroad for several days or weeks, but less than three months (Kalchev, Iordan.
2001, pp.65-69.). The study of potential emigrants’ profiles is of great interest both
from the sending and receiving countries’ point of view. These issues are to be found
in the political debate. Frequently home and host countries’ perspectives differ
7 The results of this survey were published in Census 2001, Volume 6, Book 3 Territorial mobility of population, National Institute of Statistics, Sofia, pp.51-74.

8
substantially. One could not deny, however that in these two cases both positive, as
well as unfavorable consequences, are to be observed (see for instance Piracha,
Matloob and Roger Vickerman).
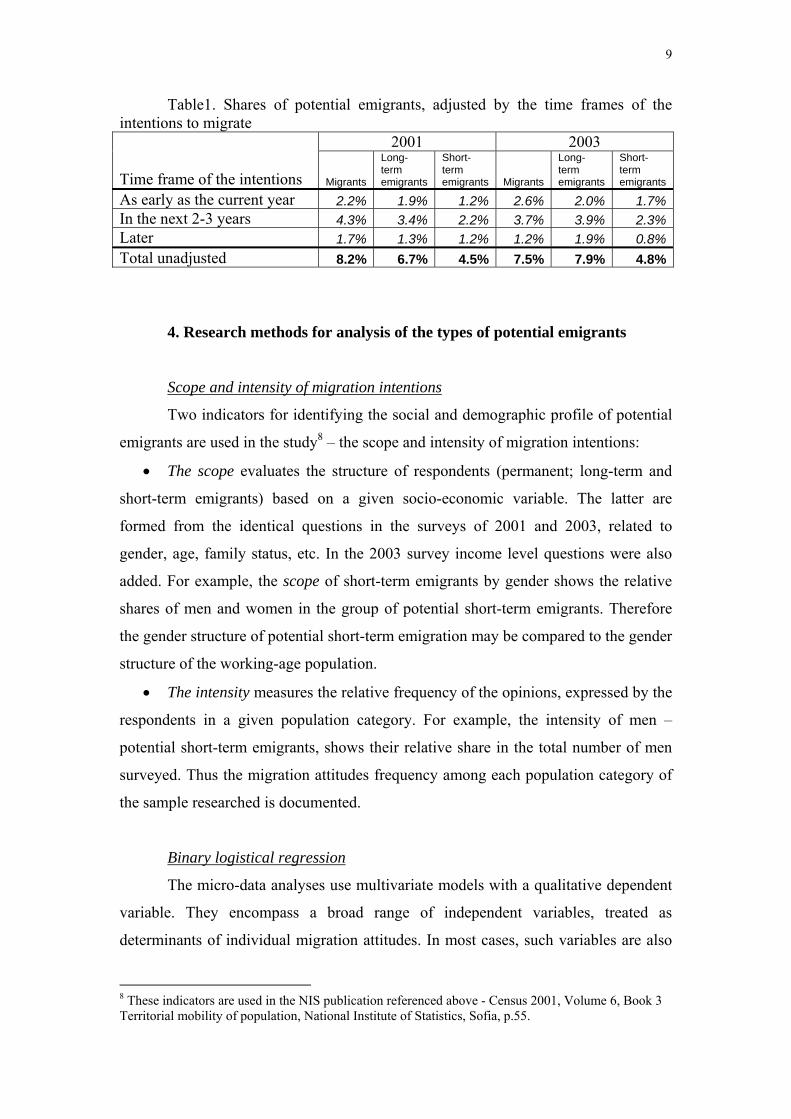
Emigration potential from Bulgaria
Data show, that for 8,2% of working age population in 2001 and for 7,5%
there of in 2003 it was “very likely” or “somewhat likely” to settle in another country.
Similarly, potential long-term emigrants (i.e. persons, who would work/study abroad
for a term of over 1 year, but without intention for final migration) were 6.7% in 2001
and 7.9% in 2003. As regards potential short-term emigrants, they amounted to 4,5%
in 2001 and 4,9% in 2003. (Table 1). The emigration potential of Bulgaria, defined in
this manner, amounted to 19,4% in 2001 and just a little more (within the limits of the
statistical error) – 20,2% in 2003. This estimate is about 5% lower in comparison to
the most recent study of potential emigration from Bulgaria, conducted by the
International Organization of Migration. (IOM, 2001, p.8.). About 1 million working-
age Bulgarian citizens are disposed to look for social fulfillment abroad. Working-age
population is about 5 million. That’s why the matter has a considerable impact on the
political debate in Bulgaria (Mintchev, V. 2003). It is noteworthy however that only
1/3 of potential emigrants is disposed to leave for good. During the two year period a
trend is observed, although insufficiently clear-cut, towards a decline of settlers in
favor of those, who prefer a temporary stay abroad. In this sense the ideas for
liberalization of immigration policies of receiving countries and particularly of those
from the European Union (EU-15) are not unfounded (Straubhaar, Thomas. 2001;
Piracha, Matloob and Roger Vickerman). As evident from the table, persons disposed
to fulfill their intentions during the current year are ¼ of all potential emigrants. They
represent on average 2% regardless of whether they are inclined to migrate for good
or to stay abroad for 1 year or longer: 2,2% of respondents in 2001 and 2,6% of those
in 2003 expressed a desire for final migration; similarly - 1,9% in 2001 and 2,0% in
2003 were the potential long-term emigrants; and 1,2% and respectively 1,7% were
the potential short-term emigrants. This assessment of the emigration potential from
Bulgaria looks more realistic. These were about ¼ million people during the two
surveys. In 2003, however, the emigration propensity within the current year
increased. This is more noticeable in regard to short-term emigration and could be
related to the lifting of visa restrictions for Bulgarian citizens in the Schengen area.
9
Table1. Shares of potential emigrants, adjusted by the time frames of the intentions to migrate 2001 2003
Time frame of the intentions Migrants
Long-term emigrants
Short-term emigrants Migrants
Long-term emigrants
Short-term emigrants
As early as the current year 2.2% 1.9% 1.2% 2.6% 2.0% 1.7%In the next 2-3 years 4.3% 3.4% 2.2% 3.7% 3.9% 2.3%Later 1.7% 1.3% 1.2% 1.2% 1.9% 0.8%Total unadjusted 8.2% 6.7% 4.5% 7.5% 7.9% 4.8%
4. Research methods for analysis of the types of potential emigrants
Scope and intensity of migration intentions
Two indicators for identifying the social and demographic profile of potential
emigrants are used in the study8 – the scope and intensity of migration intentions:
• The scope evaluates the structure of respondents (permanent; long-term and
short-term emigrants) based on a given socio-economic variable. The latter are
formed from the identical questions in the surveys of 2001 and 2003, related to
gender, age, family status, etc. In the 2003 survey income level questions were also
added. For example, the scope of short-term emigrants by gender shows the relative
shares of men and women in the group of potential short-term emigrants. Therefore
the gender structure of potential short-term emigration may be compared to the gender
structure of the working-age population.
• The intensity measures the relative frequency of the opinions, expressed by the
respondents in a given population category. For example, the intensity of men –
potential short-term emigrants, shows their relative share in the total number of men
surveyed. Thus the migration attitudes frequency among each population category of
the sample researched is documented.
Binary logistical regression
The micro-data analyses use multivariate models with a qualitative dependent
variable. They encompass a broad range of independent variables, treated as
determinants of individual migration attitudes. In most cases, such variables are also
8 These indicators are used in the NIS publication referenced above - Census 2001, Volume 6, Book 3 Territorial mobility of population, National Institute of Statistics, Sofia, p.55.
10
non-metered. This pre-determines the choice of probit or logit models (Bauer,
Thomas K. and Klaus F. Zimmermann, 1999, p. ).
In order to evaluate human capital and network variables’ net effects on the
migration attitudes’ pattern a series of binary logistical regression models are used
(See Appendix 1). Therefore the cross-tabulations assessments are enriched.
Dependent variable
The categorization of respondents as potential settlers, potential long-term and
short-term emigrants and non-emigrants is used for the design of three dichotomous
dependent variables (respective potential emigrants’ type/non emigrants). Each
variables is assigned code «1» for a given group potential emigrants and code «0» for
respondents – non-emigrants. Like so, using logit model for each emigrant type, the
socio-demographic variables’ net effect is identified.
Independent variables
The identical questions in the 2001 and 2003 surveys assign the independents
variables’ data. These questions provide relevant information on potential emigrants’
intentions and socio-demographic profile (Table 2).
The response’s option of a lesser chance for classifying the respondent as a
potential emigrant should be chosen for the reference category. I.e. the reference
group is the potential non-emigrant – the respondents with lowest chances for
emigration.
5. Socio-demographic profile of potential permanent emigrants (settlers)
from Bulgaria
The potential of permanent emigration commands increased interest in the
native and in the receiving countries. In the first case it is related to unfavorable
demographic and social consequences, negative remittances, etc.; in the second – to
pressure on the host countries’ labor market (Piracha, Matloob and Roger
Vickerman).

11
Table 2. Variables of the socio-demographic profile
Independent variable Categories 1.Gender (1) Female (reference category)
(2) Male 2. Age (1) Up to 30 yrs.
(2) 30 – 40 yrs. (3) 40 – 50yrs. (4) Over 50 yrs. (reference category)
3. Family status (1) Married (reference category) (2) Single /never married, divorced, widowed/
4. Education (1) Primary and lower (reference category) (2) Secondary (3) Higher
5. Ethnic group (1) Bulgarian (reference category) (2) Turkish (3) Roma
6. Type of settlement (1) Rural (reference category) (2) Urban (3) Capital
7. Employment (1) Employed (reference category) (2) Unemployed
8. Previous stay abroad (1) No (reference category) (2) Yes
Reference group of respondents 1.Gender Female 2. Age Over 50 yrs. 3. Family status Married 4. Education Primary or lower 5. Ethnic group Bulgarian 6. Type of settlement Rural 7. Employment Employed 8. Previous stay abroad No
Gender, age, family status and ethnic origin of potential settlers –
scope/structure and intensity
The gender structure of potential settlers in 2003 appears more balanced, in
comparison to 2001. This could be due to the structure of 2003 sample (in 2003 53%
of those polled were female; while in 2001 they were 48,8%); but it could also reflect
formation of attitudes for activating the so-called family emigration (reunification of
families) after the lifting of the Schengen requirements and the decline of emigration
to Turkey. Yet the intensity of the intentions to leave the country for good still
remains higher with men (Appendix 2 – Table 3.А).
The age structure of potential settlers comes as no surprise. More than ½ of the
potential permanent emigration is recruited among the population under 30 year’s
olds. Worth noting is the fact that the scope of settlers grew in the next age group of
12
31-40 years of age in 2003 as compared to 2001. Similarly, the intensity of intentions
to emigrate for good was considerably higher among these two age groups, as
compared to people over 40 years of age. During the period in question the intensity
increased among 30 and 40 years olds and declined among the older population.
(Appendix 2 – Table 3.А). This is in conformity with theories, treating emigration as
an investment decision (Sjaastad, L. 1962). The permanent emigrants’ time horizon
falls with the advancement of age. Therefore their emigration’s propensity also
decline.
Data from both surveys are also similar in regard to the family status of
potential settlers. They are recruited almost equally among married and singles.
Consequently, the intensity among the latter is about twice as high in comparison with
the attitudes for final migration among married individuals.
The ethnic characteristics of potential permanent emigration are changing
visibly. The ethnic structure of potential settlers reproduces the ethnic makeup of
working age population in Bulgaria. Over 80% of potential settlers are recruited from
the Bulgarian ethnic group. In 2003 however, the scope of ethnic Turks declined
nearly threefold and this of the Roma population increased by the same margin
exactly. While the intensity among Bulgarians was approximately the same during the
two surveys – about 8%; among Turks it fell from 9,2% in 2001 to 3,8% in 2003. The
exact opposite – among Roma it grew respectively from 3,5% to 10,4%.(Appendix 2–
Table 3.А). This is an issue, to which no simple response could be given. Most likely
permanent migration towards Turkey exhausted its potential. On the other hand the
social problems of Roma, exacerbated by the liberal reforms, conducted for more than
a decade now, as well as their mobility, which is higher in principle, generated high
attitudes in favor of emigration for good.
Settlement, education, employment, incomes and prior stays abroad of
potential settlers – scope/structure and intensity
The type of settlement structure of potential settlers – capital, urban or rural –
is approximately the same in 2001 and 2003. The majority of potential settlers are
taken on from towns – about 65% of the people intending to leave for good. Similarly
the intensity does not change during the period. It is highest in Sofia – more than 10%
in 2003 and lowest in villages, where it fell from 5,4% in 2001 to 3,9% in 2003.
(Appendix 2 – Table 3.А). These results are similar to other studies of potential
13
emigration from Bulgaria (IOM, 2001). The capital city’s population has higher
inclination for permanent cross-border mobility.
A large part of potential settlers are individuals with secondary education –
61,6% in the survey of 2001 and less by about 5% in 2003. The share of higher
education graduates grew – from 20,9% in 2001 to 25,3% during the repeat survey in
2003. The intensity of intentions remains stable – with a barely detectable increase of
individuals with higher education and some decline among individuals with secondary
or lower education (in both cases the changes are within the margin of statistical
error) (Appendix 2 – Table 3.А).
Like in other studies, here it was also established that employment
(respectively the level of unemployment) are not among the leading determinants of
permanent emigration (Bauer, Thomas K. and Klaus F. Zimmermann, 1999, p. ).
Potential settlers are taken on almost equally among employed and unemployed, and
in 2003 the share of employed was even greater than that of unemployed respondents.
Information on the income level structure is available only in the survey, conducted in
2003. Over ¾ of potential settlers are recruited among persons, earning less than two
minimum salaries a month9. At the same time the intensity of attitudes for migration
was considerably higher among individuals, receiving in excess of three minimum
salaries. The very low income level provides an explanation why unemployment is
not among the significant motives for permanent cross-border mobility. (Appendix 2
– Table 3.А).
Two surveys’ data illustrate an increase of the share of people, having stayed
abroad (in this case for a period in excess of 3 months). If in 2001 they were 13,3%,
in 2003 their scope reached 28%. As regards the intensity of the attitudes for
migration – it was about three times higher among people, having stayed abroad both
in 2001, as well as in 200310 (Appendix 2 – Table 3.А).
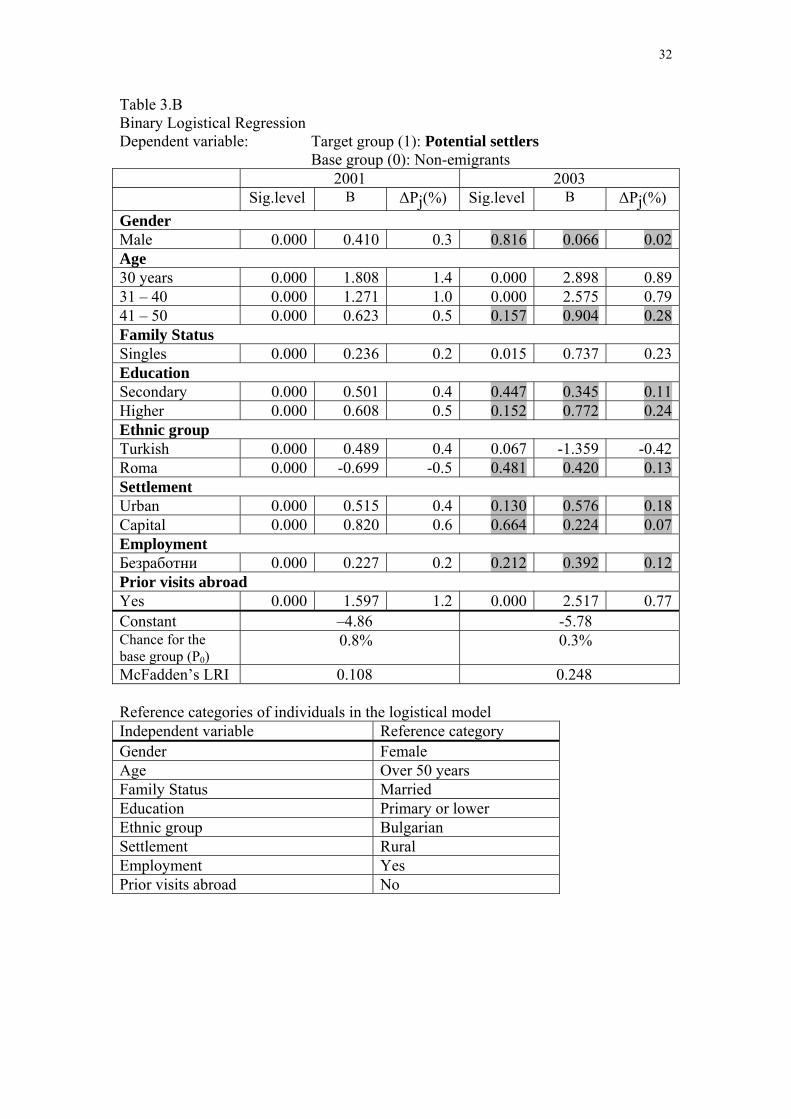
Logit model’s results
The logit model with a dependent variable, differentiating potential settlers
from non-emigrants, estimates sizeable net effects of the independent variables
included (Appendix 2 – Table 3.B). The McFadden’s likelihood ratio index (LRI),
9 In 2003 the minimum salary in Bulgaria was BGN 110/month or (EUR 55/month). 10 From that point of view network theory approach seems to be of great importance for international migration studies (see for instance Gurak, Douglas T., and Fe Caces. 1992.)
14
however, shows a relatively low explanation capability of the model. The 2001 large
sample pre-determined a significant weight of each indicator variable in spite of the
respective net effect’s low value. It has to be noted that the results confirm partially
the conclusions of the one-dimensional analysis.
Other terms being equal, in 2003 considerable net effects are observed in
regard to four variables, tested – age, marital status, ethnic origin (in regard to
Bulgarian Turks) and prior stays abroad. The most significant results were obtained
in regard to age-variable – expectations of the high likelihood among younger people
to leave Bulgaria for good are confirmed. The net effects of the indicator variable for
the youngest respondents (up to 30 years old) are highest in both 2001 and 2003
surveys. Considerable effects are also observed in regard to marital status, which
confirms the hypothesis for stronger attitudes of singles towards permanent
emigration. Clearly, family is a stable deterrent factor when forming the individual
intentions for migration.
In 2001 and 2003 high net effects are obtained for the indicator variable of
prior experience abroad. The very fact of the visit has a serious impact on attitudes for
future emigration – respondents, who already had been abroad, are more likely to
emigrate definitively.
The widespread concept of the high mobility of traditional Bulgarian
minorities is not supported entirely by the results received. It would be interesting to
note that in 2001 in regard to Roma a negative value of the regression coefficient is
received, showing a lower inclination to migrate, than for the Bulgarian ethnic group.
The results regarding ethnic Turks confirm the apparent change in their migration
attitudes in the two-year period. While in 2001 the respondents of Turkish origin
express stronger intentions to migrate, in 2003 the opposite effect is observed (with
negative regression coefficient at 7% significance level).
In general, the other independent variables – gender, education, type of
settlements and employment, which has a significant effect in 2001, no longer retain
the same impact. The results received in regard to the gender of respondents do not
evidence significant differences between males’ and females’ attitudes towards
permanent emigration in 2003. Neither can the education be considered a significant
factor of emigration intentions, because no significant difference is observed among
higher education individuals in comparison to the reference category (persons with
primary or lower education),
15
In 2003 insignificant results are obtained both in regard to the type of
settlements – capital, urban and rural; as well as in connection to the employment
status. No stronger inclination for migration is confirmed for the urban population. As
it was to be expected, paradoxically availability of employment has not impact on
permanent emigration’s wishes. Moreover, the regression coefficient, obtained in
2001, has the lowest value, which evidence rather weak net effect of employment’s
variable on migration attitudes.
Destination, goals, expected employment and methods for implementation of
settlers’ intentions
This section summarizes information on destinations, goals, expected
employment in the receiving country, as well as of the migration practice, potential
settlers from Bulgaria are familiar with. Responses are provided only by potential
emigrants, which do not allow a binary regression assessment.
Destination
Leading destinations for the potential settlers are the European Union Member
States (including the 10 newly admitted members) and Switzerland; as well as the
USA and Canada (Appendix 2 – Table 6). About ¾ of potential permanent emigrants
from Bulgaria are oriented towards these two destinations. The share of those willing
to settle in Western and Central Europe is growing – respectively, from 53,9% to
70,1%, while those willing to do the same in the USA and Canada decline by about
10% in 2003. A more careful look into the information shows that in addition to
attractive immigrant destinations, such as Germany (28% of potential settlers) and the
USA (22%), a certain preference towards the Mediterranean countries – Spain (12%)
and Greece (9%), is to be observed. At the same time Turkey is not among the main
destinations in 2003.
Goals
In 2001 more than half of potential settlers are motivated by a general desire to
achieve a higher living standard. Two years later, however, this is pointed out by only
30% of those polled. For 20,7% of the respondents in 2001 and for 26,9% - in 2003,
possible settlement is motivated more specifically – „resolving of material problems”.
Also noteworthy is the relatively high percentage of persons, „unwilling to live in
16
Bulgaria any longer”. Moreover - their share grows from 9,3% in 2001 to 11,9% in
2003. Incidentally one might point to the existence, according to the UN High
Commissioner on Refugees of a constant, although limited, number of asylum
applications from Bulgarian citizens (Gashter, August. 2002, p.24). This ought to
alarm decision makers in Bulgaria. On the other hand, a positive assessment may be
given to the apparent growth of emigration in order to attain education (2,9% in 2001
and 8,8% in 2003) or of life experience (1,2% during the first survey and 8,1% in
2003), as well as in view of professional accomplishments (respectively 2,1% and
6,9%). (Appendix 2 - Table 7).
Expected employment in the receiving country
A cause of concern is the lack of future employment orientation of potential
settlers from Bulgaria. More than 42% in 2001 and 37% in 2003 simply don’t know
what they would be doing in the host country. This of course is a sign of very general
intentions without preparatory steps undertaken. On the other hand, clearly potential
settlers did not have sufficient information, which could create conditions for illegal
trafficking (IOM, 2001).
The majority of this potential emigrants category are oriented towards crafts
(more than 12% in 2001 and 2003); trade and hotel-keeping (7,3% in 2001 and 9,1%
in 2003) and farming (respectively– 6% and 9,1%). I.e. more than 2/3 of potential
settlers either have no idea what would be their occupation in the receiving country,
or are oriented towards low-skill and respectively low-income employment. The only
grounds of optimism here is provided by the growth of those willing to migrate in
order to continue their education - from 3,5% in 2001 to 8% in 2003 (Appendix 2 -
Table 8).
Methods for implementation of settlers’ intentions
About ¼ of potential settlers would implement their intentions by means of
individual trips. In 2003 almost as large is the share of those, relying on their friends
and relatives, living abroad. For the two years between the opinion surveys their share
increases nearly twofold – from 13,9% in 2001 to 23,5% in 2003. A considerable
decline is evident, however, in the desire for emigration by way of the companies,
providing contracts with foreign-based enterprises (from 18,8% in 2001 to 14,8% in
2003 г.) or through individual contracts arrangement (respectively from 11,4% to
17
7,4%) etc. (Appendix 2 - Table 9). This correlates with the poor image of employment
agencies among potential emigrants from Bulgaria marked in the study of the
International Organization of Migration (IOM, 2001, p.17).
6. Socio-demographic profile of potential long-term emigrants
Potential long-term emigrants comprise those respondents, who would wish to
move abroad for over 1 year period without intentions to settle. In this section we are
reviewing the scope/structure and intensity of above socio-demographic variables, the
same as the sequence of earlier presentation.
Gender, age, family status and ethnic origin of potential long-term emigrants
– scope/structure and intensity
Firstly, differences are observed mainly in the scope, but also in the intensity
between potential settlers and long-term emigrants in regard to their gender structure.
About 2/3 of potential long-term emigration is recruited among the working age male
population – 65,4% in 2001 and 67,1% in 2003. Similarly the intensity of intentions
among men is twice as high as that of women. In 2003 this difference grows. Intensity
among men arrives at 11,2%, while with women it’s only 4,9% or over 11% of men
and less than 5% of women are disposed for long-term cross-border mobility
(Appendix 2 - Table 4.А).
The potential long-term emigrants’ age structure is similar to that of potential
settlers. A more serious difference exists only in regard to respondents between 41-50
years old. Their relative share both in 2001 and in 2003 is about 20%. In 2003 it’s
twice over the share of the same age interval potential settlers. Similarly the intensity
is highest among the working age population under 30 years, growing from 10,6% in
2001 to 17,4% in 2003. The next age interval’s (31-40 years old) intensity also grows.
Unlike the attitudes among potential settlers aged 41-50, which intensity is declining,
in the case of same-age long-term emigrants an increase is observed, reaching 7,2% in
2003 (Appendix 2 - Table 4.А).
Results regarding the marital status of long-term emigrants coincide with
settlers’ ones. Long-term emigrants are recruited almost equally among singles and
married individuals. The intensity for singles is twice over. It grows from 9% in 2001
to 12,6% in 2003.
18
Although the ethnic makeup of potential long-term emigration is similar to
that of potential permanent emigration, in 2003 some differences are observed. The
share of ethnic Turks among long-term emigrants is preserved – 13,1% in 2001 and
15,2% in 2003. The share of Roma, however, fells from 8,1% to 2,5%. This
corresponds to a doubling of long-term emigration intensity among ethnic Turks in
Bulgaria (respectively from 7,2% to 15%). At the same time, an opposite trend is to
be observed with the Roma – long-term mobility attitudes among them fell from 9,2%
in 2001 to only 3% for 2003 (Appendix 2 - Table 4.А).
Settlement, education, employment, incomes and prior stays abroad of
potential long-term emigrants – scope/structure and intensity
The type of settlements’ structure of potential long-term emigrants differs
from that of potential settlers by the higher relative share of rural population. In 2001
it amounts to 28,3%, and in 2003 – to 34,2%. The respective share of rural population
settlers is – 18,2% in 2001 and even 16% during the survey, held in 2003. An increase
of long-term emigration intensity among the capital-city population is marked – from
7,2% to 11,2%.(Appendix 2 - Table 4.А).
Potential long-term emigrants are recruited mainly among individuals with
secondary education, whose share grows from 60,5% in 2001 to 65,8% in 2003. The
scope of individuals with primary or lower education declines deeply. On the other
hand, a very slight increase of the university degrees holders’ share among long-term
emigrants is observed. The intensity of emigration attitudes is highest for individuals
with secondary education reaching 10% in 2003. As it was the case of potential
settlers, the long-term emigration intensity grows in regard to university degrees
holders and fells among people with primary education. (Appendix 2 - Table 4.А).
Once more respondents’ labor market status has not impact on the structure
and on the intensity of potential long-term emigrants. The results are similar to those
of potential settlers. While in 2001 the share of unemployed among potential long-
term emigrants is 53,6%, in 2003 it fells to about 40% - i.e. most of the long-term
emigration is already recruited among employed individuals. Similarly, the intensity
among the latter is higher. (Appendix 2 - Table 4.А). Just like potential settlers
incomes structure, the long-term temporary emigration is recruited mainly among
individuals, earning up to the equivalent of two minimum salaries a month. However
19
the intensity is highest among respondents, receiving more than three minimum
salaries.
Prior stays abroad variable’s analysis once again confirms its decisive impact
on emigration attitudes. A “restructuring” of the scope is to be observed – the share of
potential long-term emigrants, having been abroad, grows from 13% in 2001 to 34,2%
in 2003. Their intensity increases from 16,9% in 2001 to as much as 23,3% during the
survey in 2003. This represents a four times greater intensity in comparison to
respondents not having been abroad (Appendix 2 - Table 4.А). I.e. one of every four
Bulgarian citizens, having traveled abroad, is a potential long-term emigrant.
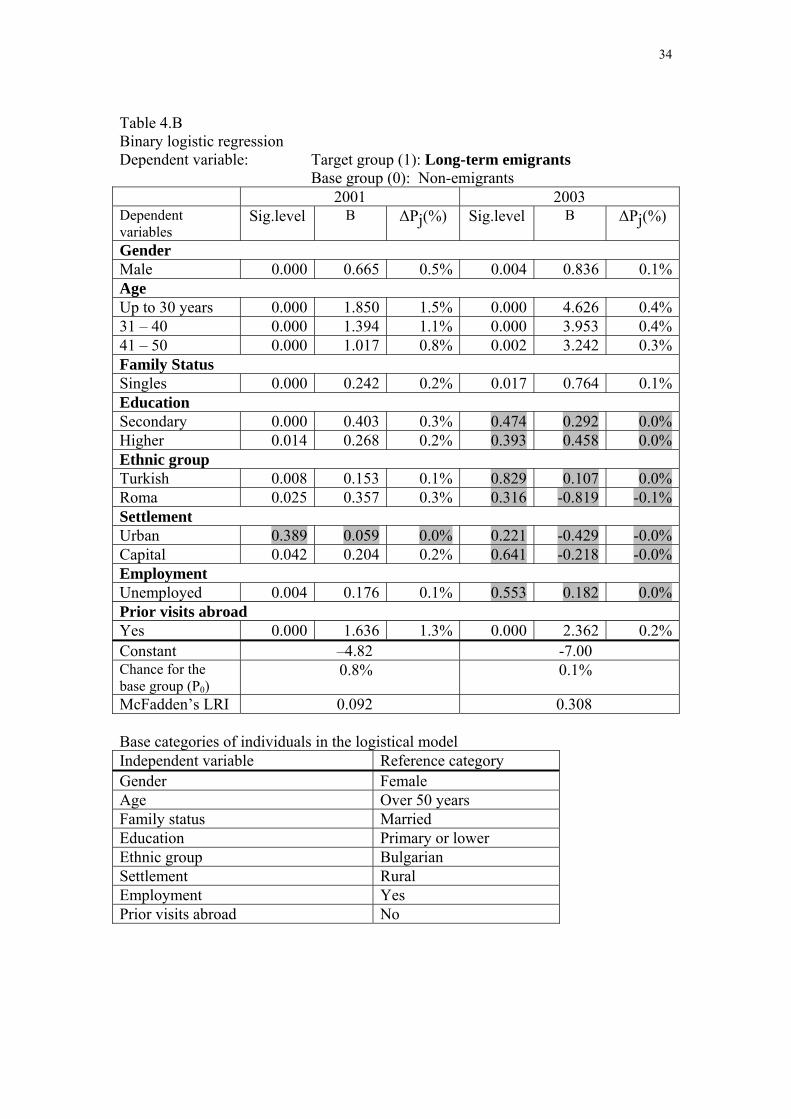
Logit model’s results
A logit model with a dependent variable, differentiating potential long-term
emigrants from non-emigrants, is also being estimated (Appendix 2 - Table 4.B).
McFadden’s LRI values obtained for 2003 survey’s data show a higher reliability in
comparison to potential settlers’ regression. Four independent variables – gender, age,
family status and prior stay abroad have significant net effects in 2003. Unlike
potential settlers’ gender characteristics, in this case men demonstrate a higher
propensity to emigrate than women. The strongest net effects are again to be seen
with age indicator variable and primarily for less than 30 years of age individuals. So
the high attitudes among young Bulgarians to leave for a long time, but not
necessarily for good are obvious. Similarly, the marital status indicator variable has a
significant net effect with a positive coefficient. Evidently, family limits the attitudes
towards long-term emigration. Prior stay abroad regression coefficient’s high values
both with 2001 and 2003 data outline the relevance of network theory assumptions as
regard to international migration (Gurak, Douglas T., and Fe Caces. 1992.). Clearly,
past foreign country’s experience is an important factor for both permanent and
temporary long-term emigration.
As regards education, ethnicity, type of settlement and employment variables
no significant effects are observed. No significant differences are observed between
university degrees’ holders and the reference group. One may conclude that the
education grade does not have the expected impact on long-term emigrants’ behavior.
The ethnic origin variable does not receive statistically significant coefficients also.
Finally, long-term emigration attitudes of Bulgarians, ethnic Turks and Roma
population are similar. Likewise the attitudes of working age population are

20
analogous irrespective of their type of settlements – urban or rural. No significant
effect of labor market status is also observed. Similarly, joblessness does not generate
emigration pressure. The regression coefficient of employment variable once more
shows a low value in 2001.
Destination, goals, expected employment and methods for implementation of
long-term emigrants’ intentions
Destination
The direction of potential long-term emigrants towards the EU Member States
(EU-15), Switzerland and Central Europe gets higher - from 71% in 2001 to 79,2% in
2003. Conversely – long-term emigration attitudes towards the USA and Canada are
declining by nearly 7% - from 19,2% during the 2001 survey to 12,5% in 2003.
(Appendix 2 - Table 6). European states are more attractive for people who do not
wish to emigrate for good. Leading destinations are Germany (21%), Greece (12,5%),
USA (11%), Spain and Italy – also 11 %. It is noteworthy that more than 40% of
long-term emigration from Bulgaria would be oriented towards Mediterranean
countries – Greece, Spain, Italy and Turkey. All of them, except for Turkey, which is
not only a receiving, but also a transit destination, and at the same time continues to
be a sending country as well (Martin, Philip 2003, p.14.), have until recently been
emigrant countries. Clearly the geographic and cultural proximity reveals the
preference of long-term emigration.
Goals
As evident from Table 7 (Appendix 2), the main goals of potential long-term
emigrants are to achieve „a higher living standard” and more specifically – „resolve
material problems”. At the same time, as in the case of potential settlers, the share of
individuals in search for professional accomplishment or life experience grows.
Unlike permanent emigrants, the motive “I no longer wish to live in Bulgaria” is not
present for this category of emigrants.
Expected employment
Over 60% of the potential long-term emigrants either have no idea what they
would be doing in the receiving country, or like settlers, are targeting themselves at

21
unskilled job. The share of individuals, who would practice crafts, is also falling –
from 15,8% in 2001 to 9,8% in 2003. The number of individuals is increasing,
however, who would work in services (trade and hotel-keeping) – from 5,1% to
13,0%; or in agriculture – from 9,6% to 15,2%. Also growing is the share of
respondents, who would stay with relatives and friends – from 2% in 2001 to about
10% in 2003.
Methods for implementation of long-term emigrants’ intentions
A decline is observed in the intentions for long-term emigration by means of
companies, providing contracts with foreign-based enterprises or through individual
contract arrangement (from 31,2% to 26,1% - in the former case and from 11,5% to
9,1% - in the latter). At the same time the orientation is growing towards self-
organization of departure or at the invitation of relatives, etc. In 2003 more than 40%
of respondents would prefer these two methods for fulfillment of long-term
emigration.
7. Socio-demographic profile of potential short-term emigrants
Persons, who prefer to spend abroad less than a year, are not emigrants by
definition. I.e. the perception of this category of respondents as potential short-term
emigrants is conditional (Kalchev, Iordan. 2001, pp.65-69.). One way or another,
short-term cross-border mobility is an alternative to long-term emigration. In this
section we outline the profile and the intentions precisely of potential short-term
emigrants from Bulgaria.
Gender, age, family status and ethnic origin of potential short-term emigrants
– scope/structure and intensity
The gender structure of potential short-term emigration is closer to the similar
structure of long-term emigrants, than that of the settlers. Short-term emigration is
recruited mainly among men, their relative share growing from 59,4% in 2001 to
64,6% in 2003. At the same time the intensity among the working-age male
population shows a certain increase, and among women – conversely – a decline. It
must be pointed out that the intensity of short-term emigration intentions is weaker,
than for long-term emigration. (Appendix 2 - Table - 5.A.).
22
On the other hand, the short-term emigration age structure differs considerably
from that of long-term emigrants and particularly of settlers’ age breakdown. Potential
short-term emigrants are recruited mostly among the young (under 30 years old), but
also in the higher age intervals, including among persons over 50 years. (Appendix 2 -
Table - 5.A.). From this point of view, short-term emigration shall be defined as an
alternative for older working-age population. Intensity of intentions is highest in the
first age interval – up to 30 years of age, increasing in the period from 6% to 8,5%.
Unlike the emigrant types, reviewed in the preceding sections, about 2/3 of
short-term emigration would be recruited among married persons. Their relative share
grows from 60,2% in 2001 to as much as 68,8% in the second survey of 2003. The
intensity is almost the same irrespectively of the marital status. However it prevails
slightly among married respondents. This is also a distinction between short-term and
long-term cross-border mobility. (Appendix 2 - Table 5.A.).
Short-term emigrants are recruited mainly among Bulgarian ethnic group.
However their relative share declines by nearly 9% (from 85,6% in 2001 to 77,1% in
2003). Conversely, the share of working age Roma population gets bigger from 4,1%
to 14,6%. This is in conformity with their increased short-term emigration intensity,
which arrives at 10,4% in 2003. It’s nearly twice over when compared to Bulgarians
and ethnic Turks. (Appendix 2 - Table 5.A.). The ethnic makeup of potential short-
term mobility is similar to that of permanent emigration. In this sense, short-term
emigration could be viewed as an alternative, not only for older individuals, but for
the Roma population as well.
Type of settlements, education, employment, incomes and prior stays abroad
of potential short-term emigrants – scope/structure and intensity
Type of settlements’ structure of potential short-term emigrants is almost the
same as that of the sample observed. Likewise the intensity is similar among urban
and rural working age population. (Appendix 2 - Table 5.A.). Unlike the two other
emigrant types, no higher intensity is observed among capital-city citizens. Such
could probably be viewed only in regions, bordering on Greece.
The education variable of potential short-term emigration is characterized by
the well known high relative share of individuals with secondary education. However
the higher intensity among university degrees holders emblematic for long-term
emigration is not observed (Appendix 2 - Table 5.A.).

23
The joblessness does not stimulate short-term emigration. In addition,
employed individuals’ intensity towards long-term, incl. permanent emigration is
higher in comparison with their short-term emigration attitudes. This could be
interpreted from the point of view of emigration costs. The labor supply in Bulgaria
seems to be motivated (to a certain degree) by the need to earn for emigration
purposes.
Incomes’ variable does not differ notably from both short-term and long term
emigrants’ perspective. Once again ¾ of short-term emigrants are recruited among
individuals, earning up to two minimum salaries a month. The intensity of
respondents, earning more than three minimum salaries a month is also higher,
although to a lesser degree, in comparison with long-term emigrants.
The situation in regard to prior stays abroad variable is also similar. In 2001
only 15% of potential short-term emigrants have been abroad, while in 2003 their
relative share is nearly double. In the course of both opinion polls a higher intensity is
observed among individuals, having foreign country experience – about 12-13%.
However this is greatly below the intensity of long-term mobility attitudes (Appendix
2 - Table 5.A.).
Logit model’s results
Short-term emigrants’ logit -model has the lowest explanatory capacity in
comparison to the previous two models, which is evident from the 2003 McFadden’s
LRI level (Appendix 2 - Table 5.A.). Five independent variables receive significant
regression coefficients – gender, age, prior stays abroad, ethnic origin (in regard to
the Roma population) and education.
In the case of short-term emigration, males differ from females by their
stronger attitudes in favor of short-term mobility. Age indicator variable attains stable
over time net effects, identical with previous models’ results. Evidently less ten 30
years age interval gets higher coefficients’ values. Similarly prior visit abroad
variable shows a strong and stable over time net effect on emigration behavior. The
higher education grade received stimulates short-term emigration. The chance for
such attitudes is higher among university degrees holders as compared to the
reference group (primary and lower education). It is worth noting that the chance for
short-term emigration among the Roma is visibly greater in comparison to the
24
reference group (Bulgarians). This is not the case, however, for ethnic Turks, where
the indicator variable has an insignificant coefficient.
Unlike the long-term emigration, marital status variable does not acquire
significant net effect. Logically, family is not a discouraging factor for the short-term
mobility. Once more types of settlements and employment status variables have not
significant effects. Moreover, even based on 2001 large sample’s data, the
employment status’s regression coefficient obtains a statistically insignificant value.
Evidently the availability of employment doesn’t reduce the emigration pressure in
Bulgaria.
Destination, goals, expected employment and methods for implementation of
short-term emigrants’ intentions
Destination
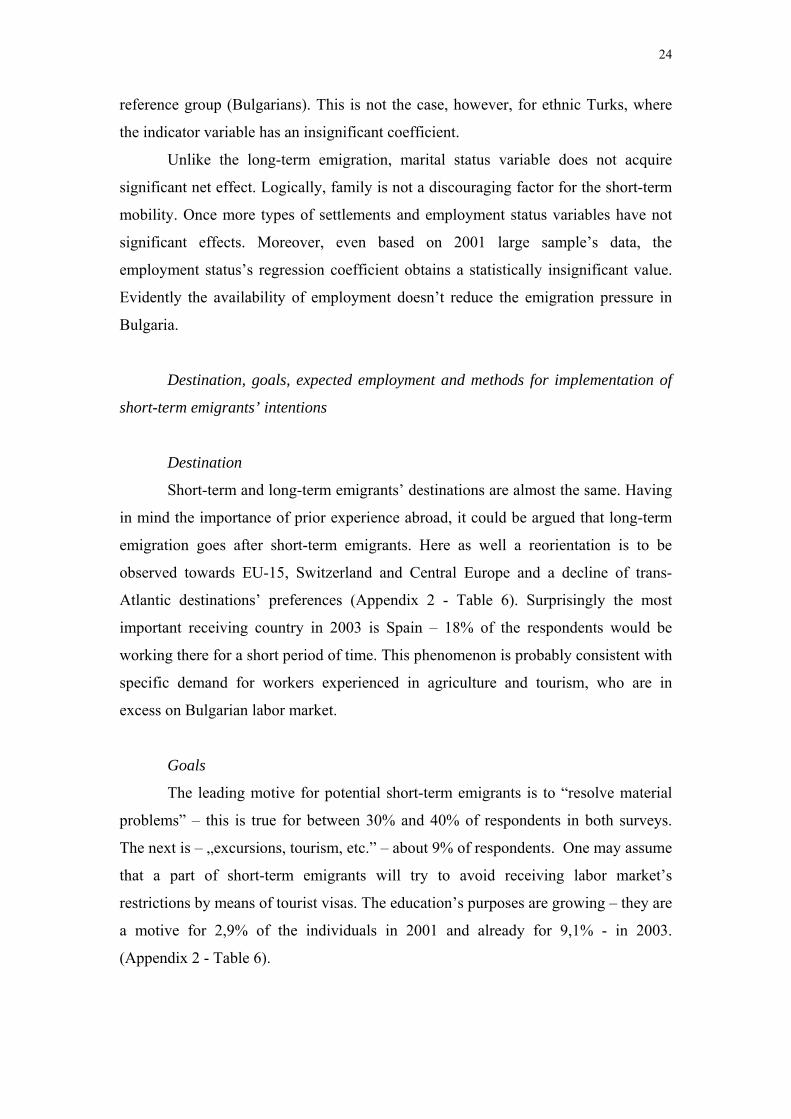
Short-term and long-term emigrants’ destinations are almost the same. Having
in mind the importance of prior experience abroad, it could be argued that long-term
emigration goes after short-term emigrants. Here as well a reorientation is to be
observed towards EU-15, Switzerland and Central Europe and a decline of trans-
Atlantic destinations’ preferences (Appendix 2 - Table 6). Surprisingly the most
important receiving country in 2003 is Spain – 18% of the respondents would be
working there for a short period of time. This phenomenon is probably consistent with
specific demand for workers experienced in agriculture and tourism, who are in
excess on Bulgarian labor market.
Goals
The leading motive for potential short-term emigrants is to “resolve material
problems” – this is true for between 30% and 40% of respondents in both surveys.
The next is – „excursions, tourism, etc.” – about 9% of respondents. One may assume
that a part of short-term emigrants will try to avoid receiving labor market’s
restrictions by means of tourist visas. The education’s purposes are growing – they are
a motive for 2,9% of the individuals in 2001 and already for 9,1% - in 2003.
(Appendix 2 - Table 6).

25
Expected employment
Nearly 40% of respondents in 2001 and ¼ in 2003 has no idea what exactly
they would be doing. In 2003 those, who would engage in farming or would live at
relatives are evenly split. The share of the latter grows from 1,6% to 14,3% for the
time between two opinion polls. At the same time the share of people, who would
practice crafts, is declining. However the respondents, willing to be engaged in sport
and culture activities, are more numerous in 2003 survey.
Methods for organization of the short-term emigration
Nearly half of potential short-term emigrants would organize their stay on
their own or with the assistance of compatriots, living abroad. The share of
individuals, relying on employment companies, declines visibly – from 31,5% in 2001
to 24,5% in 2003. For the two years the number of those, who would like to arrange
individual contracts, is preserved and even grows – from 10% to 12,2%. (Appendix 2
- Table 6).
8. Conclusion
Bulgaria’s emigration potential, not counting potential short-term emigration,
amounts to 14-15% of its working-age population. Taking into account the attitudes
for migration only in the current year, it would not exceed 4-5%, i.e. by 1-2% more
than the 3%-4% Rule of Thumb (Leyard, R, Blanchard, O, Dornbusch, R, and
Krugman, P, 1992, Straubhaar, Thomas 2001, p. 169). In this sense, the current study
confirms that the “East-West” migration flow would exceed by only a few percent the
currently existing labor mobility within the boundaries of the European Union (EU-
15).
The analysis of the first two groups of socio-demographic variables, where in
addition to cross-tabulations we estimate in series three separate logit models for each
type of potential emigrants, leads to the following conclusions and summaries:
1. Gender has a substantial net effect on potential temporary emigration. This
is true more specifically for short-term mobility. Emigrants – men, who do not wish to
settle, are more mobile. Things are different with the emigration for good, where in
conformity with the new economics of migration assumptions (Stark, 1991) the

26
decision is rather a collective one – of the family, and where no differences between
the attitudes of the genders are observed.
2. As regards age the highest result is obtained in regard to temporary long-
term emigration. Considerable is the difference between settlers and short-term
emigrants. In accordance with the human capital theory one may conclude that older
individuals’ mobility grows when planned stay abroad is shorter.
3. In regard to family characteristics (in our case – marital status) similar
conclusions are reached. Family is a deterrent factor for potential long-term
emigration, but not for short-term one, where the mobility of married individuals is
even greater (Marital status variable obtains a negative regression coefficient).
4. The ethnic background of potential emigration is unavoidable. Only in the
case of temporary long-term emigration similar attitudes are established among
Bulgarians, Turks and Roma. It may be claimed that the settler potential of Bulgarian
Turks is exhausted – in 2003 the regression coefficient has a negative value in regard
to the reference group – the Bulgarian ethnic group. On the other hand, quite
logically, the Roma appeared more mobile among potential short-term emigrants.
5. As regards the other variables – type of settlements, education, employment
(incomes – only in the 2003 survey) and prior stays abroad; significant results are
obtained only for the prior stays abroad variable. Its net effect is almost as
significant, as that of age. Clearly network theory assumptions in regard to the
significance of prior stays abroad deserve special attention.
6. Education variable shows a significant net effect only for short-term
emigrants. Contrary to expectations, the employment and incomes variables have not
significant impact. The same could also be said about the respondents’ settlements.
The one-dimensional analysis shows a situation, which is paradoxical at first sight:
employed and higher income individuals have higher emigration attitudes.
The third group of variables – destination, goals, expected employment and
methods for departure, have not been tested by a logit model, because potential non-
emigrants don’t answer the respective questions. Nevertheless, cross-tabulations show
interesting similarities.
7. The migration flow from Bulgaria is redirected towards the countries of the
European Union (EU-15 and the new member-states) and Switzerland. However the
share of settlers, choosing overseas destinations remains higher. The Mediterranean is
particularly attractive for short-term emigrants – not so much Greece and Italy, which
27
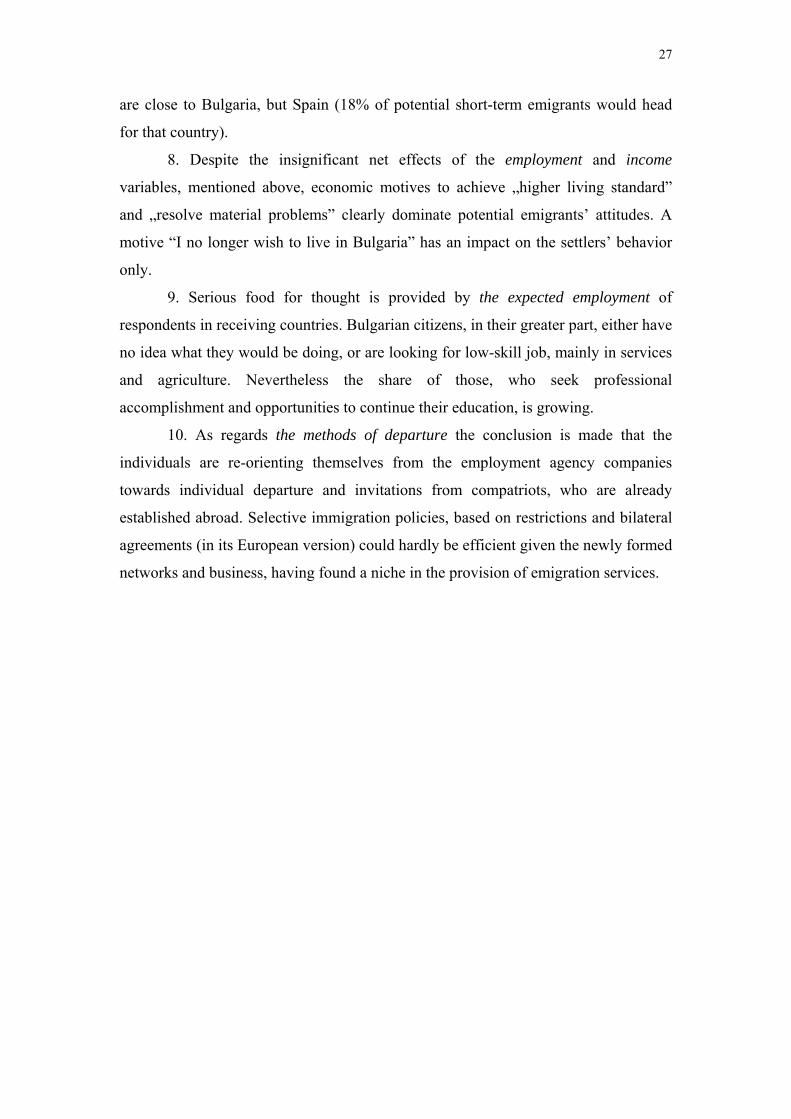
are close to Bulgaria, but Spain (18% of potential short-term emigrants would head
for that country).
8. Despite the insignificant net effects of the employment and income
variables, mentioned above, economic motives to achieve „higher living standard”
and „resolve material problems” clearly dominate potential emigrants’ attitudes. A
motive “I no longer wish to live in Bulgaria” has an impact on the settlers’ behavior
only.
9. Serious food for thought is provided by the expected employment of
respondents in receiving countries. Bulgarian citizens, in their greater part, either have
no idea what they would be doing, or are looking for low-skill job, mainly in services
and agriculture. Nevertheless the share of those, who seek professional
accomplishment and opportunities to continue their education, is growing.
10. As regards the methods of departure the conclusion is made that the
individuals are re-orienting themselves from the employment agency companies
towards individual departure and invitations from compatriots, who are already
established abroad. Selective immigration policies, based on restrictions and bilateral
agreements (in its European version) could hardly be efficient given the newly formed
networks and business, having found a niche in the provision of emigration services.

28
References:
Bastyr, I. 2001, “Impact of the Czech Republic’s entry into the EU on
relations with Austria with an emphasis on employment, labor market and migration”.
In: Migration potential of the Czech Republic’s population (Migration potential
model), analytical part, vol.1a.
Bauer, Thomas K. and Klaus F. Zimmermann. 1999, “Assessment of Possible
Migration Pressure and its Labour Market Impact Following EU Enlargement to
Central and Eastern Europe”, IZA Research Report No. 3.
Boeri, Tito and Herbert Bruecker. 2001, “Eastern Enlargement and EU-
Labour-Markets: Perceptions, Challenges and Opportunities”, IZA DP No. 256.
Borjas, G. 1999, “Economic research on the determinants of emigration:
Lessons for the European Union”, World Bank technical paper, no.438.
Burda, M. 1995, “Migration and the option value of waiting”, Economic and
Social Review, no.27, pp.1-19.
Census 2001, Volume 6, Book 3 Territorial mobility of population, National
Institute of Statistics, Sofia.
Drinkwater, Stephen. 2002, “Go West? Assessing the willingness to move
from Central and Eastern European Countries”, University of Surrey, UK,
Department of Economics, mimeo. (www.econ.surrey.ac.uk/sdrinkwater/go-west.pdf)
Fassmann, H. and R. Munz. 2002, “EU enlargement and future East-West
migration in Europe”, in F. Laczko et al. (eds), New Challenges for Migration Policy
in Central and Eastern Europe, IOM, ICMPD and TMC Asser Press.
Gashter, A. 2002, “The Ambiguities of Emigration: Bulgaria since 1988”,
International Migration Papers, 39, ILO, Geneva.
Greene, W.H. (2000) Econometric Analysis. 4th Edition, NJ: Prentice Hall.
Gurak, Douglas T. and Fe Caces. 1992, “Migration networks and the shaping
of migration systems” in Mary Kritz, Lin Lean Lim, and Hania Zlotnik (eds),
International Migration Systems: a Global Approach, Oxford, Clarendon Press, pp.
150-176.
Hazans, Mihalis. 2003, “Potential emigration of Latvian labour force after
joining the EU and its impact on Latvian labour market”, University of Latvia and
BICEPS, mimeo.
International Organisation for Migration, 1999, “Migration Potential in
Central and Eastern Europe”, Geneva.

29
International Organisation for Migration, 2001, “Profile and Motives of
Potential Migrants from Bulgaria”, Sofia.
Kalchev, Iordan. 2001, International Migration of Population in Bulgaria,
Dunav Press.
Kule, Dhori and Ahmet Mancellari, Harry Papapanagos, Stephen Qirici, Peter
Sanfey. 2000, “The causes and consequences of Albanian emigration during
transition: Evidence from micro-data”.
Leyard, R. and Blanchard, O., Dornbusch, R., Krugman, P. 1992, East-West
Migration: The Alternatives, MIT Press, Cambridge MA.
Markova, Evgenia and Alexander H. Sarris. 1997, “The Performance of
Bulgarian Illegal Immigrants in the Greek Labor Market”, South European Society &
Politics, Vol. 2, No 2 (Autumn), pp. 55-77.
Martin, Philip. 2003, “Managing International Labor Migration in the 21st
Century”, South Eastern Europe Journal of Economics.
Massey, Douglas S. and Joaquin Arango, Graeme Hugo, Ali Kouaouci, Adela
Pellegrino, J. Edward Taylor. 1993, “Theories of International Migration: A Review
and Appraisal”, Population and Development Review 19, No 3, pp. 431-465.
Minkov, M. 1994, “La migration internationale en Bulgarie”, Revue
Européenne des Migrations Internationales, Vol. 10, No 10.
Mintchev, V. 2003, “Old, new and future European Union citizens: path
through full participation to democratic life”, in Research/action on citizenship
education for old, new and future EU citizens (SATCHEL), Code: 101486-CP-2002-
IT-Grundving-G1, mimeo.
Mintchev, V. 1999, “External Migration and External Migration Policy in
Bulgaria”, South-East Europe Review, Quarterly of the Hans Bockler Foundation,
No3, pp.124-126.
Papapanagos, Harry and Peter Sanfey. 1998, “Intention to emigrate in
transition countries: the case of Albania”, mimeo.
Piracha, Matloob and Roger Vickerman, “Immigration, Labour Mobility and
EU Enlargement”.
Sjaastad, L. 1962, “The costs and returns of human migration”, Journal of
Political Economy, 70, pp. 80-93.
Stark, Oded. 1991, “Migration decision making: A review article”, Journal of
Development Economics 14, pp.251-259.
30
Straubhaar, Thomas. 2001, “East-West Migration: Will it be a Problem?”,
Intereconomics, July/August.
Appendix 1
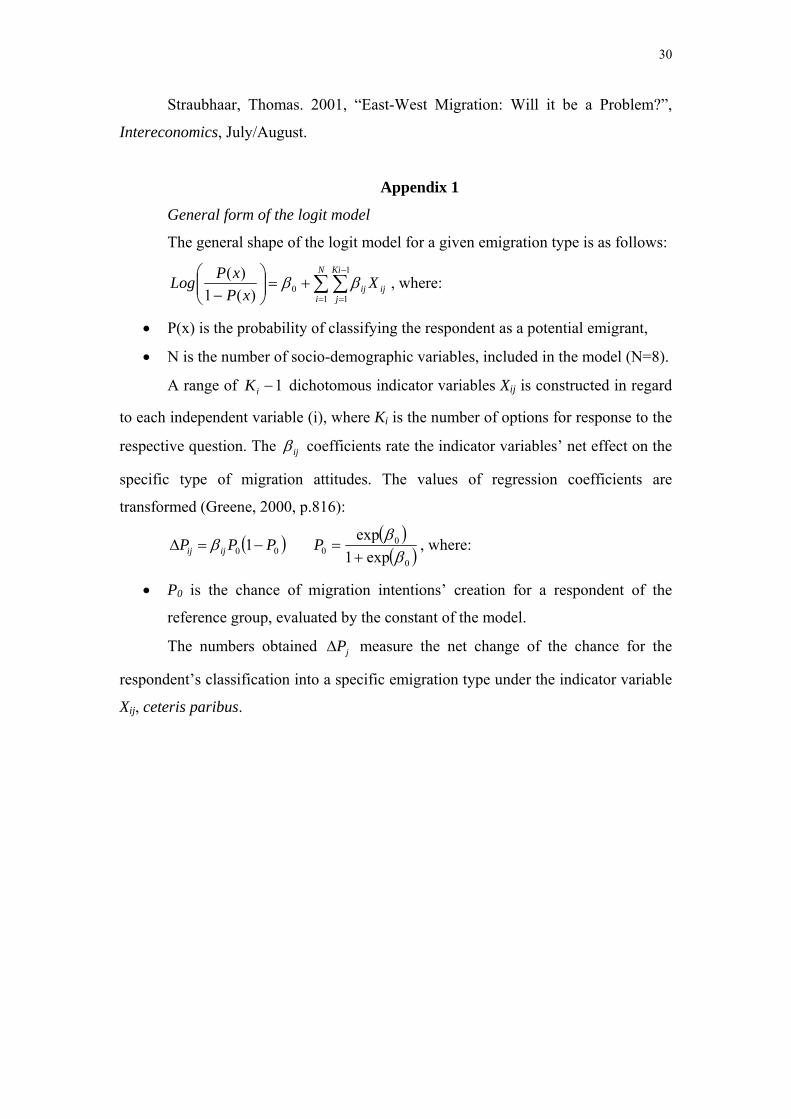
General form of the logit model
The general shape of the logit model for a given emigration type is as follows:
∑∑=
−
=+=⎟⎟
⎠
⎞⎜⎜⎝
⎛−
N
i
Ki
jijij XxP
xPLog1
1
10)(1
)( ββ , where:
• Р(х) is the probability of classifying the respondent as a potential emigrant,
• N is the number of socio-demographic variables, included in the model (N=8).
A range of 1−iK dichotomous indicator variables Xij is constructed in regard
to each independent variable (i), where Ki is the number of options for response to the
respective question. The ijβ coefficients rate the indicator variables’ net effect on the
specific type of migration attitudes. The values of regression coefficients are
transformed (Greene, 2000, p.816):
( )00 1 PPP ijij −=∆ β ( )( )0
00 exp1
expβ
β+
=P , where:
• P0 is the chance of migration intentions’ creation for a respondent of the
reference group, evaluated by the constant of the model.
The numbers obtained jP∆ measure the net change of the chance for the
respondent’s classification into a specific emigration type under the indicator variable
Xij, ceteris paribus.
31
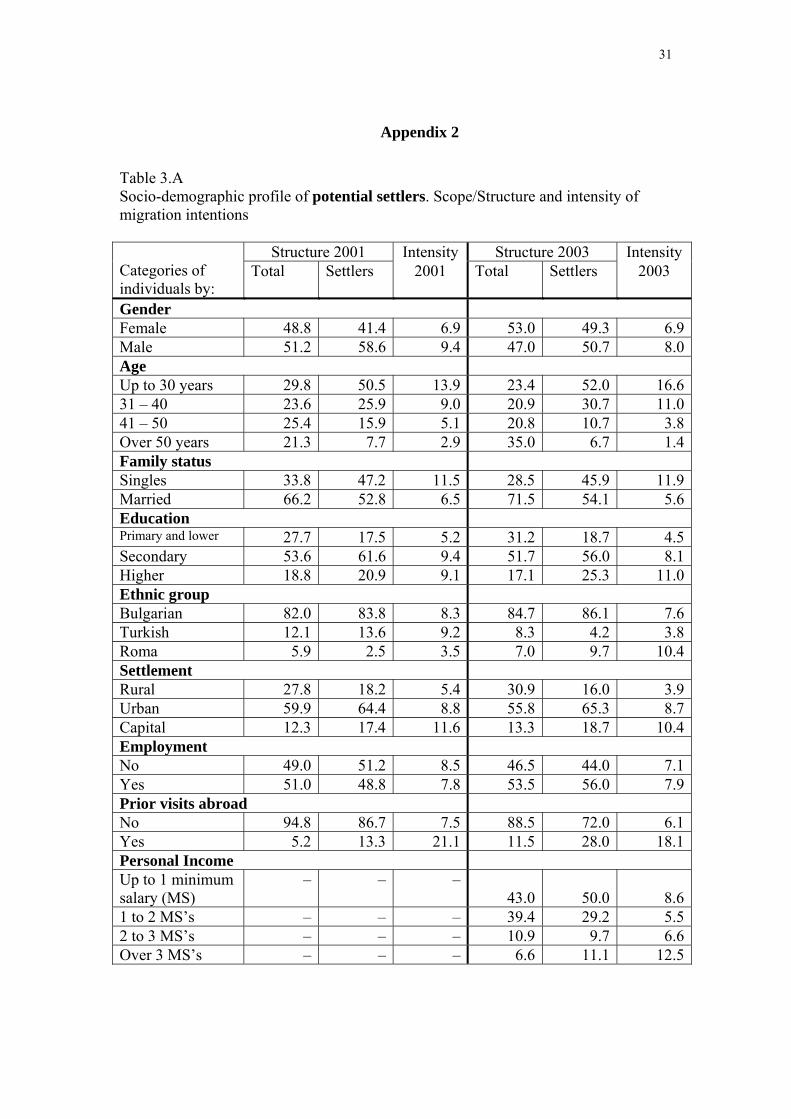
Appendix 2
Table 3.A Socio-demographic profile of potential settlers. Scope/Structure and intensity of migration intentions
Structure 2001 Intensity Structure 2003 Intensity Categories of individuals by:
Total Settlers 2001 Total Settlers 2003
Gender Female 48.8 41.4 6.9 53.0 49.3 6.9Male 51.2 58.6 9.4 47.0 50.7 8.0Age Up to 30 years 29.8 50.5 13.9 23.4 52.0 16.631 – 40 23.6 25.9 9.0 20.9 30.7 11.041 – 50 25.4 15.9 5.1 20.8 10.7 3.8Over 50 years 21.3 7.7 2.9 35.0 6.7 1.4Family status Singles 33.8 47.2 11.5 28.5 45.9 11.9Married 66.2 52.8 6.5 71.5 54.1 5.6Education Primary and lower 27.7 17.5 5.2 31.2 18.7 4.5Secondary 53.6 61.6 9.4 51.7 56.0 8.1Higher 18.8 20.9 9.1 17.1 25.3 11.0Ethnic group Bulgarian 82.0 83.8 8.3 84.7 86.1 7.6Turkish 12.1 13.6 9.2 8.3 4.2 3.8Roma 5.9 2.5 3.5 7.0 9.7 10.4Settlement Rural 27.8 18.2 5.4 30.9 16.0 3.9Urban 59.9 64.4 8.8 55.8 65.3 8.7Capital 12.3 17.4 11.6 13.3 18.7 10.4Employment No 49.0 51.2 8.5 46.5 44.0 7.1Yes 51.0 48.8 7.8 53.5 56.0 7.9Prior visits abroad No 94.8 86.7 7.5 88.5 72.0 6.1Yes 5.2 13.3 21.1 11.5 28.0 18.1Personal Income Up to 1 minimum salary (MS)
– – –43.0 50.0 8.6
1 to 2 MS’s – – – 39.4 29.2 5.52 to 3 MS’s – – – 10.9 9.7 6.6Over 3 MS’s – – – 6.6 11.1 12.5
32
Table 3.B Binary Logistical Regression Dependent variable: Target group (1): Potential settlers Base group (0): Non-emigrants 2001 2003 Sig.level B ∆Pj(%) Sig.level B ∆Pj(%) Gender Male 0.000 0.410 0.3 0.816 0.066 0.02Age 30 years 0.000 1.808 1.4 0.000 2.898 0.8931 – 40 0.000 1.271 1.0 0.000 2.575 0.7941 – 50 0.000 0.623 0.5 0.157 0.904 0.28Family Status Singles 0.000 0.236 0.2 0.015 0.737 0.23Education Secondary 0.000 0.501 0.4 0.447 0.345 0.11Higher 0.000 0.608 0.5 0.152 0.772 0.24Ethnic group Turkish 0.000 0.489 0.4 0.067 -1.359 -0.42Roma 0.000 -0.699 -0.5 0.481 0.420 0.13Settlement Urban 0.000 0.515 0.4 0.130 0.576 0.18Capital 0.000 0.820 0.6 0.664 0.224 0.07Employment Безработни 0.000 0.227 0.2 0.212 0.392 0.12Prior visits abroad Yes 0.000 1.597 1.2 0.000 2.517 0.77Constant –4.86 -5.78 Chance for the base group (Р0)
0.8% 0.3%
McFadden’s LRI 0.108 0.248 Reference categories of individuals in the logistical model Independent variable Reference category Gender Female Age Over 50 years Family Status Married Education Primary or lower Ethnic group Bulgarian Settlement Rural Employment Yes Prior visits abroad No

33
Table 4.А Socio-demographic profile of long-term emigrants. Scope/Structure and intensity of migration intentions
Structure 2001 Intensity Structure 2003 Intensity Categories of individuals by:
Total Long-term emigrants
2001 Total Long-term emigrants
2003
Gender Female 48.8 34.6 4.7 53.0 32.9 4.9Male 51.2 65.4 8.5 47.0 67.1 11.2Age Up to 30 yrs. 29.8 47.1 10.6 23.4 51.9 17.431 – 40 23.6 25.9 7.3 20.9 26.6 10.041 – 50 25.4 20.0 5.3 20.8 19.0 7.2Over 50 21.3 7.0 2.2 35.0 2.5 0.6Family status Singles 33.8 45.8 9.0 28.5 46.2 12.6Married 66.2 54.2 5.5 71.5 53.8 5.9Education Primary or lower 27.7 23.9 5.8 31.2 16.5 4.1Secondary 53.6 60.5 7.5 51.7 65.8 10.0Higher 18.8 15.6 5.6 17.1 17.7 8.1Ethnic group Bulgarian 82.0 78.7 6.4 84.7 82.3 8.0Turkish 12.1 13.1 7.2 8.3 15.2 15.0Roma 5.9 8.1 9.2 7.0 2.5 3.0Settlement Rural 27.8 28.3 6.8 30.9 34.2 8.7Urban 59.9 58.4 6.5 55.8 46.8 6.6Capital 12.3 13.3 7.2 13.3 19.0 11.2Employment No 49.0 53.6 7.3 46.5 40.3 6.7Yes 51.0 46.4 6.1 53.5 59.7 8.6Prior visits abroad No 94.8 87.0 6.1 88.5 65.8 5.8Yes 5.2 13.0 16.9 11.5 34.2 23.3Personal income Up to 1 minimum salary (MS)
– – –43.0 42.3 7.9
1 to 2 MS’s – – – 39.4 37.2 7.62 to 3 МS’s – – – 10.9 11.5 8.5Over 3 MS’s – – – 6.6 9.0 10.9
34
Table 4.B Binary logistic regression Dependent variable: Target group (1): Long-term emigrants Base group (0): Non-emigrants 2001 2003 Dependent variables
Sig.level B ∆Pj(%) Sig.level B ∆Pj(%)
Gender Male 0.000 0.665 0.5% 0.004 0.836 0.1%Age Up to 30 years 0.000 1.850 1.5% 0.000 4.626 0.4%31 – 40 0.000 1.394 1.1% 0.000 3.953 0.4%41 – 50 0.000 1.017 0.8% 0.002 3.242 0.3%Family Status Singles 0.000 0.242 0.2% 0.017 0.764 0.1%Education Secondary 0.000 0.403 0.3% 0.474 0.292 0.0%Higher 0.014 0.268 0.2% 0.393 0.458 0.0%Ethnic group Turkish 0.008 0.153 0.1% 0.829 0.107 0.0%Roma 0.025 0.357 0.3% 0.316 -0.819 -0.1%Settlement Urban 0.389 0.059 0.0% 0.221 -0.429 -0.0%Capital 0.042 0.204 0.2% 0.641 -0.218 -0.0%Employment Unemployed 0.004 0.176 0.1% 0.553 0.182 0.0%Prior visits abroad Yes 0.000 1.636 1.3% 0.000 2.362 0.2%Constant –4.82 -7.00 Chance for the base group (Р0)
0.8% 0.1%
McFadden’s LRI 0.092 0.308 Base categories of individuals in the logistical model Independent variable Reference category Gender Female Age Over 50 years Family status Married Education Primary or lower Ethnic group Bulgarian Settlement Rural Employment Yes Prior visits abroad No
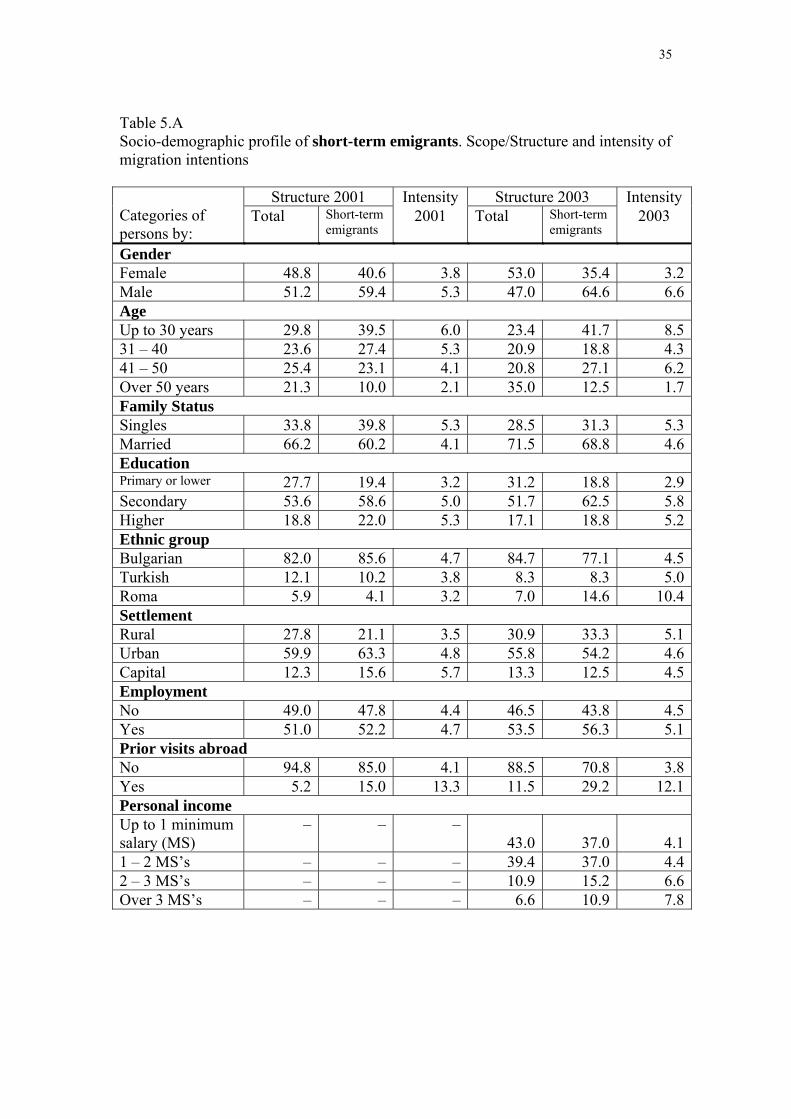
35
Table 5.А Socio-demographic profile of short-term emigrants. Scope/Structure and intensity of migration intentions
Structure 2001 Intensity Structure 2003 Intensity Categories of persons by:
Total Short-term emigrants
2001 Total Short-term emigrants
2003
Gender Female 48.8 40.6 3.8 53.0 35.4 3.2Male 51.2 59.4 5.3 47.0 64.6 6.6Age Up to 30 years 29.8 39.5 6.0 23.4 41.7 8.531 – 40 23.6 27.4 5.3 20.9 18.8 4.341 – 50 25.4 23.1 4.1 20.8 27.1 6.2Over 50 years 21.3 10.0 2.1 35.0 12.5 1.7Family Status Singles 33.8 39.8 5.3 28.5 31.3 5.3Married 66.2 60.2 4.1 71.5 68.8 4.6Education Primary or lower 27.7 19.4 3.2 31.2 18.8 2.9Secondary 53.6 58.6 5.0 51.7 62.5 5.8Higher 18.8 22.0 5.3 17.1 18.8 5.2Ethnic group Bulgarian 82.0 85.6 4.7 84.7 77.1 4.5Turkish 12.1 10.2 3.8 8.3 8.3 5.0Roma 5.9 4.1 3.2 7.0 14.6 10.4Settlement Rural 27.8 21.1 3.5 30.9 33.3 5.1Urban 59.9 63.3 4.8 55.8 54.2 4.6Capital 12.3 15.6 5.7 13.3 12.5 4.5Employment No 49.0 47.8 4.4 46.5 43.8 4.5Yes 51.0 52.2 4.7 53.5 56.3 5.1Prior visits abroad No 94.8 85.0 4.1 88.5 70.8 3.8Yes 5.2 15.0 13.3 11.5 29.2 12.1Personal income Up to 1 minimum salary (MS)
– – –43.0 37.0 4.1
1 – 2 MS’s – – – 39.4 37.0 4.42 – 3 MS’s – – – 10.9 15.2 6.6Over 3 MS’s – – – 6.6 10.9 7.8
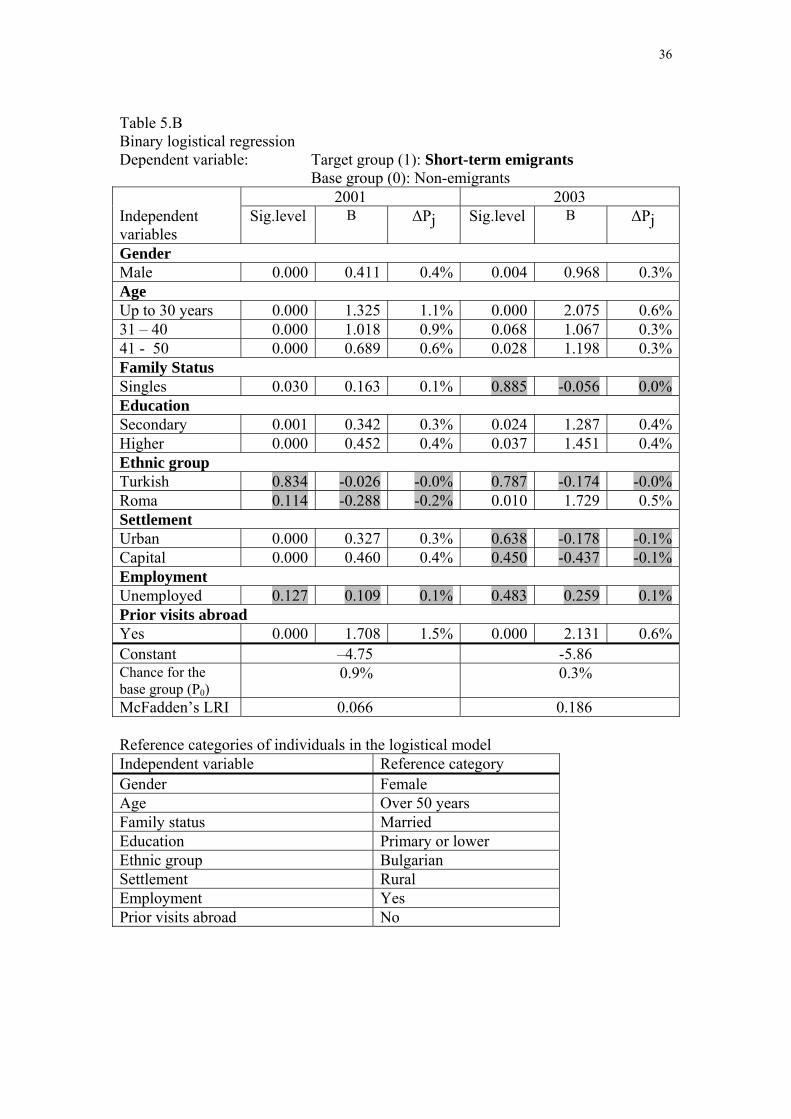
36
Table 5.B Binary logistical regression Dependent variable: Target group (1): Short-term emigrants Base group (0): Non-emigrants 2001 2003 Independent variables
Sig.level B ∆Pj Sig.level B ∆Pj
Gender Male 0.000 0.411 0.4% 0.004 0.968 0.3%Age Up to 30 years 0.000 1.325 1.1% 0.000 2.075 0.6%31 – 40 0.000 1.018 0.9% 0.068 1.067 0.3%41 - 50 0.000 0.689 0.6% 0.028 1.198 0.3%Family Status Singles 0.030 0.163 0.1% 0.885 -0.056 0.0%Education Secondary 0.001 0.342 0.3% 0.024 1.287 0.4%Higher 0.000 0.452 0.4% 0.037 1.451 0.4%Ethnic group Turkish 0.834 -0.026 -0.0% 0.787 -0.174 -0.0%Roma 0.114 -0.288 -0.2% 0.010 1.729 0.5%Settlement Urban 0.000 0.327 0.3% 0.638 -0.178 -0.1%Capital 0.000 0.460 0.4% 0.450 -0.437 -0.1%Employment Unemployed 0.127 0.109 0.1% 0.483 0.259 0.1%Prior visits abroad Yes 0.000 1.708 1.5% 0.000 2.131 0.6%Constant –4.75 -5.86 Chance for the base group (Р0)
0.9% 0.3%
McFadden’s LRI 0.066 0.186 Reference categories of individuals in the logistical model Independent variable Reference category Gender Female Age Over 50 years Family status Married Education Primary or lower Ethnic group Bulgarian Settlement Rural Employment Yes Prior visits abroad No

37
Table 6. “Target” country/region of potential emigrants from Bulgaria
2001 2003 For which country would you leave?
Settlers
Long-term emigrants
Short-term emigrants Settlers
Long-term emigrants
Short-term emigrants
EU, Central Europe, Switzerland 53.9% 71.0% 71.9% 70.1% 79.2% 78.9%USA, Canada 32.3% 19.2% 18.8% 23.9% 12.5% 10.5%Turkey 4.3% 2.0% 2.3% – 6.9% 2.6%Australia, N. Zealand 4.0% 1.9% 2.3% 3.0% – 5.3%Other countries 5.6% 5.9% 4.8% 3.0% 1.4% 2.6%Total 100% 100% 100% 100% 100% 100% Table 7. Main goals for leaving abroad
What are the main goals of your leaving for abroad
2001 2003
Settlers
Long-term emigrants
Short-term emigrants Settlers
Long-term emigrants
Short-term emigrants
Higher standard of living 55.5% 35.5% 32.7% 30.6% 30.8% 25.8%Solving material problems 20.7% 48.9% 42.6% 26.9% 32.3% 34.8%I no longer wish to live in Bulgaria 9.3% 1.7% 2.1% 11.9% 1.5% 3.0%Excursions, tourism, visits 4.8% 3.1% 8.0% 1.9% 3.8% 9.1%To receive the desired education 2.9% 2.8% 2.9% 8.8% 6.0% 9.1%Achieve professional accomplishment 2.1% 3.4% 5.0% 6.9% 11.3% 4.5%Live with relatives, friends 1.9% 0.6% 0.7% 2.5% 2.3% 3.0%Gain experience, see the world 1.2% 2.2% 4.3% 8.1% 10.5% 6.1%Marriage 0.6% 0.5% 0.2% 2.5% 1.5% 3.0%For health reasons 0.4% 0.1% 0.1% – – –Other reason 0.8% 1.3% 1.4% – – 1.5%Total 100.0% 100.0% 100.0% 100.0% 100.0% 100.0%

38
Table 8. Expected employment abroad
What do you expect you occupation will be there?
2001 2003
Settlers
Long-term emigrants
Short-term emigrants Settlers
Long-term emigrants
Short-term emigrants
Not sure at present 42.9% 41.9% 39.4% 37.5% 23.9% 24.5%Crafts 12.3% 15.8% 13.8% 12.5% 9.8% 4.1%Trade, hotel-keeping 7.3% 5.1% 6.9% 9.1% 13.0% 6.1%Farming activity 6.0% 9.6% 9.2% 9.1% 15.2% 14.3%Industrial activity 4.1% 5.4% 5.6% 4.5% 4.3% 4.1%Continue one’s education 3.8% 4.1% 3.5% 8.0% 5.4% 4.1%Live with relatives, friends 3.5% 2.0% 1.6% 3.4% 9.8% 14.3%Medical services 2.9% 3.2% 2.6% 1.1% 1.1% 4.1%Research, teaching activity 2.2% 1.3% 2.3% 2.3% 1.1% 2.0%Sports, arts 2.0% 1.6% 1.6% 3.4% 2.2% 10.2%Marriage 1.2% 1.2% 0.7% 2.3% 1.1% –Other 11.6% 8.7% 12.7% 6.8% 13.0% 12.2%Total 100.0% 100.0% 100.0% 100.0% 100.0% 100.0%

39
Table 9. Preferred modes of departure How do you intend to carry out your trip?
2001 2003
Settlers
Long-term emigrants
Short-term emigrants Settlers
Long-term emigrants
Short-term emigrants
Own travel / stay 24.1% 23.8% 23.9% 25.9% 26.1% 30.6%By means of companies providing contracts with foreign based enterprises 18.8% 31.2% 31.5% 14.8% 26.1% 24.5%Application for green card 14.4% 8.3% 7.1% 13.6% 6.8% 2.0%Invitation from relatives 13.9% 8.0% 8.9% 23.5% 14.8% 16.3%Individual contract arrangement 11.4% 11.5% 10.0% 7.4% 9.1% 12.2%Contract with international organizations 5.4% 6.8% 7.0% 2.5% 8.0% 6.1%Tourist agency 4.0% 3.0% 4.6% 3.7% 2.3% 4.1%Application for education 3.8% 4.8% 4.5% 7.4% 5.7% 4.1%Marriage 1.3% 0.5% 0.3% – 1.1% –Other 2.9% 2.2% 2.3% 1.2% – –Total 100.0% 100.0% 100.0% 100.0% 100.0% 100.0%


![THE EMIGRATION ACT, 1983epcom.org/Emigration-Act-1983.pdf · 1 THE EMIGRATION ACT, 1983 [31 of 1983, dt. 10-9-1983 ] An Act to consolidate and amend the law relating to emigration](https://static.fdocuments.in/doc/165x107/5e4809dfa0b97a0b973726e3/the-emigration-act-1-the-emigration-act-1983-31-of-1983-dt-10-9-1983-an-act.jpg)