Who Holds What? A Factor Model for Direct Stockholding
30
Internet Appendix Who Holds What? A Factor Model for Direct Stockholding Vimal Balasubramaniam John Y. Campbell Tarun Ramadorai Benjamin Ranish 51
Transcript of Who Holds What? A Factor Model for Direct Stockholding

Internet Appendix
Who Holds What?
A Factor Model for Direct Stockholding
Vimal Balasubramaniam John Y. Campbell
Tarun Ramadorai Benjamin Ranish
51

A Details of Orthogonalization Procedure
We apply an iterative procedure to orthogonalize each stock characteristic with respect to
the set of stock characteristics with stronger clienteles. Specifically, in the kth iteration,
we identify the k characteristics with the largest c(k − 1)′Ωvhc(k − 1), where c(k − 1)
represents characteristics resulting from the k − 1st iteration and c(0) = c. Next, we
use this set of k vectors c to predict the remaining characteristics using a multivariate
kernel regression. This local linear regression uses a Euclidean distance measure over the
k predictor characteristics, and applies a truncated Gaussian kernel with bandwidth for
each stock such that 10% of other stocks fall within twice the parameter, applying zero
weight beyond. We define the rank of the residuals (over the interval -0.5 to 0.5) from
this regression as c(k), setting c(k) = c(k− 1) for the k strongest selected characteristics.
After C − 1 iterations, with C being the total number of characteristics, we have our
sequentially orthogonalized set of characteristics co = c(C − 1).28
28A few of our categorical variables are collinear (e.g. region). From each such set, we drop the variablewith the smallest c′Ωv
hc prior to running the orthogonalization.
52

Table A.1Stock Characteristic Clientele Strength
Account Size Weighted Estimates
This table is constructed as Table 2, but weights investors according to their account size (instead of
equal weighting).
Raw Orthogonalized
Characteristic Variance % Off-diagonal Std. Dev Variance % Off-diagonal Std. Dev
Stock Age 0.055 20.2% 0.234 0.055 20.16% 0.234Business Group: Any 0.036 12.0% 0.328 0.037 10.50% 0.332Zone: West 0.034 12.3% 0.317 0.031 10.33% 0.307Realized Skew 0.036 14.0% 0.190 0.030 7.32% 0.173Industry: Manufacturing 0.033 8.4% 0.314 0.029 5.15% 0.295Realized Returns 0.026 20.6% 0.161 0.028 11.63% 0.166Beta 0.021 15.5% 0.144 0.026 7.46% 0.160Stock Turnover 0.019 11.4% 0.139 0.023 6.98% 0.153Zone: South 0.030 12.5% 0.301 0.023 10.33% 0.260Industry: Financial Services 0.019 14.4% 0.239 0.019 12.86% 0.239Dividend Paying 0.016 12.6% 0.218 0.019 10.47% 0.237Realized Volatility 0.019 22.7% 0.138 0.017 6.42% 0.131Share Price 0.015 32.0% 0.122 0.017 17.52% 0.130Market Capitalization 0.007 36.4% 0.083 0.017 10.65% 0.130Book/Market 0.016 25.2% 0.126 0.014 10.86% 0.120Industry: IT 0.030 11.5% 0.302 0.014 8.51% 0.204Industry: Food, Agro. & Textiles 0.010 7.1% 0.172 0.007 1.38% 0.148Business Group: Reliance (DAG) 0.006 4.5% 0.137 0.006 4.22% 0.138Industry: Construction 0.012 4.1% 0.189 0.006 10.73% 0.137Public Sector Enterprise 0.009 26.5% 0.160 0.006 12.53% 0.129Business Group: Tata 0.005 12.5% 0.126 0.005 10.91% 0.123Industry: Oil & Gas 0.005 10.8% 0.127 0.004 6.53% 0.115Zone: North 0.016 8.7% 0.219 0.004 1.65% 0.114Business Group: Jindal 0.003 9.9% 0.090 0.003 9.63% 0.090Business Group: Suzlon 0.002 1.2% 0.079 0.002 1.12% 0.079Business Group: Jaypee 0.002 4.7% 0.075 0.002 4.25% 0.073Business Group: Mahindra 0.001 0.3% 0.061 0.001 0.95% 0.064Business Group: Vedanta 0.001 5.3% 0.050 0.001 5.52% 0.050Business Group: Reliance (ADAG) 0.001 15.5% 0.048 0.001 7.40% 0.045Business Group: Birla Aditya 0.001 8.2% 0.039 0.001 1.80% 0.045Business Group: Adani 0.000 10.2% 0.030 0.000 6.48% 0.032Industry: Other 0.001 7.3% 0.061Zone: East 0.006 2.1% 0.129
53

Table A.2Stock Characteristic Clientele Strength
Robustness
This table compares the variance of characteristic tilts (using orthogonalized characteristics) across
investors–the fourth column of Table 2–against alternatives that exclude the least diversified accounts
(those with HHI > 0.2) or that exclude either the most popular 10 or 50 stocks (based on their average
portfolio share).
Total Variance (Orthogonalized Characteristics)
Characteristic All HHI ≤ 0.2 Excl. Top 10 stocks Excl. Top 50 stocks
Stock Age 0.074 0.025 0.060 0.064Dividend Paying 0.049 0.012 0.044 0.050Share Price 0.045 0.014 0.049 0.059Stock Turnover 0.045 0.011 0.047 0.050Business Group: Any 0.042 0.011 0.041 0.044Realized Returns 0.040 0.012 0.044 0.046Zone: West 0.040 0.008 0.039 0.042Beta 0.035 0.010 0.042 0.045Industry: Financial Services 0.033 0.008 0.032 0.030Realized Skew 0.030 0.008 0.038 0.044Realized Volatility 0.030 0.006 0.031 0.037Industry: Manufacturing 0.026 0.007 0.029 0.033Book/Market 0.026 0.006 0.037 0.039Market Capitalization 0.025 0.008 0.029 0.033Industry: Oil & Gas 0.022 0.003 0.011 0.009Business Group: Reliance (ADAG) 0.021 0.001 0.007 0.001Zone: South 0.018 0.004 0.024 0.026Industry: IT 0.013 0.003 0.019 0.018Industry: Construction 0.012 0.003 0.004 0.006Public Sector Enterprise 0.012 0.003 0.015 0.014Business Group: Reliance (DAG) 0.012 0.003 0.000 0.001Industry: Food, Agro. & Textiles 0.010 0.002 0.007 0.009Zone: North 0.008 0.002 0.008 0.009Business Group: Tata 0.007 0.002 0.004 0.003Business Group: Suzlon 0.003 0.000 0.000 0.000Business Group: Mahindra 0.003 0.001 0.004 0.001Business Group: Jaypee 0.002 0.000 0.004 0.002Business Group: Jindal 0.002 0.000 0.004 0.002Business Group: Birla Aditya 0.002 0.001 0.003 0.003Business Group: Adani 0.002 0.000 0.002 0.002Business Group: Vedanta 0.001 0.000 0.002 0.002
54

Table A.3Stock Characteristic Clientele Strength
Robustness: Off-Diagonal Share of Total Variance
This table compares the off-diagonal share of the total variance of characteristic tilts (using orthogonalized
characteristics) across investors against alternatives that exclude the least diversified accounts (those with
HHI > 0.2) or that exclude either the most popular 10 or 50 stocks (based on their average portfolio
share).
Off-Diagonal Share of Total Variance (Orthogonalized Characteristics)
Characteristic All HHI ≤ 0.2 Excl. Top 10 stocks Excl. Top 50 stocks
Stock Age 0.118 0.432 0.160 0.217Dividend Paying 0.119 0.440 0.139 0.195Share Price 0.128 0.569 0.151 0.216Stock Turnover 0.070 0.275 0.126 0.177Business Group: Any 0.059 0.180 0.126 0.168Realized Returns 0.074 0.333 0.137 0.163Zone: West 0.052 0.111 0.121 0.155Beta 0.060 0.262 0.107 0.148Industry: Financial Services 0.070 0.286 0.099 0.147Realized Skew 0.039 0.199 0.067 0.138Realized Volatility 0.054 0.174 0.072 0.113Industry: Manufacturing 0.017 0.062 0.069 0.143Book/Market 0.039 0.181 0.116 0.118Market Capitalization 0.069 0.317 0.096 0.110Industry: Oil & Gas 0.090 0.162 0.187 0.280Business Group: Reliance (ADAG) 0.115 0.189 0.544 0.383Zone: South 0.030 0.118 0.055 0.132Industry: IT 0.014 0.065 0.111 0.114Industry: Construction 0.091 0.175 0.084 0.161Public Sector Enterprise 0.058 0.179 0.111 0.220Business Group: Reliance (DAG) 0.067 0.063 0.145 0.361Industry: Food, Agro. & Textiles 0.047 0.005 0.044 0.106Zone: North 0.009 0.020 0.063 0.125Business Group: Tata 0.028 0.093 0.133 0.225Business Group: Suzlon 0.014 -0.010 0.132 0.182Business Group: Mahindra 0.008 -0.015 0.081 0.201Business Group: Jaypee 0.073 0.047 0.159 0.437Business Group: Jindal 0.014 0.023 0.151 0.188Business Group: Birla Aditya 0.013 0.007 0.220 0.480Business Group: Adani 0.056 0.044 0.363 0.452Business Group: Vedanta 0.025 0.064 0.098 0.243
55

Table A.4Stock Characteristic Clientele Strength in the Data and under Alternative Models
This table decomposes the August 2011 cross-sectional variance of characteristic tilts (orthogonalized
characteristics) from Table 2 into the contribution from stock holdings (diagonal elements of the cohold-
ings matrix) and coholdings, and compares these quantities with those from three model-based alter-
natives where investors hold the same number of stocks. Under the float-capitalization based model,
portfolios are formed by randomly selecting stocks with probabilities proportional to the capitalization
of their float, and investing an equal amount in each selected stock. Under the MVO models, investors
choose the mean-variance optimal portfolio (derived via LASSO) when assuming that either the CAPM
or 4 Factor Model (market, size, value, momentum) hold.
StockAge
DividendPaying
SharePrice
StockTurnover
RealizedReturns
Beta RealizedSkew
RealizedVolatility
Book/Market MarketCap
Holdings ContributionEmpirical 0.0656 0.0434 0.0395 0.0415 0.0375 0.0325 0.0289 0.0280 0.0248 0.0236Float-capitalization based 0.0497 0.0151 0.0119 0.0234 0.0254 0.0240 0.0246 0.0152 0.0144 0.0149MVO: CAPM 0.0030 0.0018 0.0065 0.0021 0.0019 0.0010 0.0010 0.0030 0.0040 0.0028MVO: 4 Factor Model 0.0009 0.0002 0.0027 0.0009 0.0058 0.0018 0.0049 0.0027 0.0042 0.0030
Coholdings ContributionEmpirical 0.0088 0.0058 0.0058 0.0031 0.0030 0.0021 0.0012 0.0016 0.0010 0.0017Float-capitalization based 0.0008 0.0001 0.0001 0.0002 0.0004 0.0002 0.0004 0.0002 0.0002 0.0002MVO: CAPM 0.0074 0.0041 0.0251 0.0062 0.0093 0.0001 0.0047 0.0162 0.0165 0.0055MVO: 4 Factor Model 0.0027 0.0010 0.0114 0.0010 0.0202 0.0013 0.0054 0.0101 0.0129 0.0040
56

Table A.5Correlations of Investors’ Characteristic Tilts
Account Size Weighted Estimates
These tables are constructed similarly to Table 3, but using account size weighted (instead of equal
weighted) correlations of investors’ characteristic tilts.
Panel A: Ordered by Characteristic Clientele Strength
Panel B: Ordered by Cluster
57

Table
A.6
Who
Ow
ns
What
:C
har
acte
rist
icT
ilts
Sin
gle
Fac
tor
Model
Est
imat
es:
Busi
nes
sG
roups
Th
ista
ble
exte
nd
sth
ean
alysi
sof
Tab
le4
toth
ese
tof
inve
stors
’b
usi
nes
sgro
up
tilt
s.
Reli
an
ceA
DA
GT
ata
Reli
an
ceD
AG
Bir
laJayp
ee
Jin
dal
Mah
ind
raS
uzl
on
Ved
anta
Ad
an
iP
SE
Siz
e-4
.39
0.56
1.39
-0.1
20.
180.
020.
14-0
.34
0.29
0.95
0.57
(0.0
04)
(0.0
03)
(0.0
04)
(0.0
01)
(0.0
02)
(0.0
02)
(0.0
02)
(0.0
02)
(0.0
01)
(0.0
01)
(0.0
04)
9.22
0.48
1.55
0.07
0.14
0.00
0.07
0.38
0.72
4.74
0.26
No.
Sto
cks
-1.7
70.
220.
060.
010.
030.
070.
01-0
.15
0.16
0.37
-0.0
1(0
.005
)(0
.003
)(0
.004
)(0
.001
)(0
.002
)(0
.002
)(0
.002
)(0
.002
)(0
.001
)(0
.001
)(0
.004
)1.
510.
070.
000.
000.
000.
020.
000.
080.
220.
730.
00A
ge-1
.03
0.45
0.75
-0.0
3-0
.18
-0.0
3-0
.12
-0.4
60.
010.
190.
15(0
.005
)(0
.003
)(0
.004
)(0
.001
)(0
.002
)(0
.002
)(0
.002
)(0
.002
)(0
.001
)(0
.001
)(0
.004
)0.
500.
310.
450.
000.
130.
000.
050.
730.
000.
190.
02T
urn
over
-0.6
1-0
.06
-0.8
90.
040.
05-0
.01
-0.0
50.
010.
090.
110.
12(0
.005
)(0
.003
)(0
.004
)(0
.001
)(0
.002
)(0
.002
)(0
.002
)(0
.002
)(0
.001
)(0
.001
)(0
.004
)0.
180.
010.
640.
010.
010.
000.
010.
000.
070.
060.
01Sin
gle
Sto
ckD
um
my
4.12
-0.0
6-1
.32
0.09
-0.2
9-0
.21
-0.1
80.
08-0
.26
-1.0
2-0
.36
(0.0
04)
(0.0
03)
(0.0
04)
(0.0
01)
(0.0
02)
(0.0
02)
(0.0
02)
(0.0
02)
(0.0
01)
(0.0
01)
(0.0
04)
8.10
0.01
1.41
0.04
0.34
0.19
0.12
0.02
0.57
5.51
0.11
No.
Sto
cks
Tra
ded
-1.6
00.
14-0
.41
0.00
0.06
0.02
0.04
-0.1
00.
180.
320.
09(0
.005
)(0
.003
)(0
.004
)(0
.001
)(0
.002
)(0
.002
)(0
.002
)(0
.002
)(0
.001
)(0
.001
)(0
.004
)1.
230.
030.
140.
000.
020.
000.
010.
030.
280.
530.
01E
aste
rn-0
.58
0.20
-0.1
70.
000.
09-0
.01
0.07
0.07
0.04
0.06
0.43
(0.0
05)
(0.0
03)
(0.0
04)
(0.0
01)
(0.0
02)
(0.0
02)
(0.0
02)
(0.0
02)
(0.0
01)
(0.0
01)
(0.0
04)
0.16
0.06
0.02
0.00
0.04
0.00
0.02
0.02
0.01
0.02
0.15
Sou
ther
n-0
.94
-0.0
2-0
.53
0.07
-0.0
5-0
.01
0.12
0.05
0.05
0.06
-0.1
6(0
.005
)(0
.003
)(0
.004
)(0
.001
)(0
.002
)(0
.002
)(0
.002
)(0
.002
)(0
.001
)(0
.001
)(0
.004
)0.
430.
000.
230.
020.
010.
000.
050.
010.
020.
020.
02W
este
rn0.
450.
170.
42-0
.08
-0.3
00.
05-0
.13
-0.1
10.
020.
12-0
.20
(0.0
05)
(0.0
03)
(0.0
04)
(0.0
01)
(0.0
02)
(0.0
02)
(0.0
02)
(0.0
02)
(0.0
01)
(0.0
01)
(0.0
04)
0.10
0.04
0.14
0.03
0.37
0.01
0.06
0.04
0.00
0.07
0.03
Nor
ther
n0.
84-0
.33
0.16
0.04
0.34
-0.0
4-0
.02
0.03
-0.1
1-0
.24
0.07
(0.0
05)
(0.0
03)
(0.0
04)
(0.0
01)
(0.0
02)
(0.0
02)
(0.0
02)
(0.0
02)
(0.0
01)
(0.0
01)
(0.0
04)
0.33
0.17
0.02
0.01
0.46
0.01
0.00
0.00
0.09
0.31
0.00
58
Table
A.7
Who
Ow
ns
What
:C
har
acte
rist
icT
ilts
Sin
gle
Fac
tor
Model
Est
imat
es:
Indust
ryC
har
acte
rist
ics
Th
ista
ble
exte
nd
sth
ean
alysi
sof
Tab
le4
toth
ese
tof
inve
stors
’in
du
stry
tilt
s.
Const
ruct
ion
Fin
an
cial
Serv
ices
Food,
Agri
.&
Texti
les
Info
rmati
on
Tech
nolo
gy
Manu
fact
uri
ng
Oil
and
Gas
Siz
e-0
.43
2.98
-0.7
2-0
.69
0.35
-3.4
3(0
.004
)(0
.006
)(0
.003
)(0
.004
)(0
.005
)(0
.005
)0.
152.
720.
500.
370.
055.
38N
o.Sto
cks
-0.5
70.
18-0
.65
-0.2
80.
02-1
.58
(0.0
04)
(0.0
06)
(0.0
03)
(0.0
04)
(0.0
05)
(0.0
05)
0.26
0.01
0.40
0.06
0.00
1.15
Age
0.07
-0.0
60.
030.
260.
00-1
.00
(0.0
04)
(0.0
06)
(0.0
03)
(0.0
04)
(0.0
05)
(0.0
05)
0.00
0.00
0.00
0.05
0.00
0.46
Turn
over
-1.0
7-0
.16
-0.6
1-0
.30
-0.2
8-0
.63
(0.0
04)
(0.0
06)
(0.0
03)
(0.0
04)
(0.0
05)
(0.0
05)
0.92
0.01
0.35
0.07
0.03
0.18
Sin
gle
Sto
ckD
um
my
0.49
-0.5
10.
840.
56-0
.37
3.35
(0.0
04)
(0.0
06)
(0.0
03)
(0.0
04)
(0.0
05)
(0.0
05)
0.19
0.08
0.68
0.24
0.05
5.13
No.
Sto
cks
Tra
ded
-0.9
50.
32-0
.77
-0.4
10.
05-1
.51
(0.0
04)
(0.0
06)
(0.0
03)
(0.0
04)
(0.0
05)
(0.0
05)
0.73
0.03
0.57
0.13
0.00
1.04
Eas
tern
-0.3
40.
32-0
.27
-0.0
60.
08-0
.51
(0.0
04)
(0.0
06)
(0.0
03)
(0.0
04)
(0.0
05)
(0.0
05)
0.09
0.03
0.07
0.00
0.00
0.12
Sou
ther
n-0
.83
1.62
-0.3
90.
21-0
.17
-1.4
5(0
.004
)(0
.006
)(0
.003
)(0
.004
)(0
.005
)(0
.005
)0.
550.
810.
150.
040.
010.
96W
este
rn0.
52-1
.48
0.26
-0.0
90.
080.
88(0
.004
)(0
.006
)(0
.003
)(0
.004
)(0
.005
)(0
.005
)0.
220.
670.
060.
010.
000.
36N
orth
ern
0.46
-0.1
00.
29-0
.06
0.01
0.77
(0.0
04)
(0.0
06)
(0.0
03)
(0.0
04)
(0.0
05)
(0.0
05)
0.17
0.00
0.08
0.00
0.00
0.27
59

Table A.8Who Owns What: Characteristic Tilts
Single Factor Model Estimates: Geography
This table extends the analysis of Table 4 to the set of investors’ tilts towards stocks in different geo-
graphical zones.
South West North
Size -0.23 -1.64 0.11(0.004) (0.006) (0.003)
0.03 0.68 0.02No.Stocks -0.11 -0.52 0.16
(0.004) (0.006) (0.003)0.01 0.07 0.03
Age -0.11 0.35 0.36(0.004) (0.006) (0.003)
0.01 0.03 0.17Turnover 0.02 -0.87 0.03
(0.004) (0.006) (0.003)0.00 0.19 0.00
Single Stock Dummy 0.64 1.62 -0.48(0.004) (0.006) (0.003)
0.23 0.66 0.29No. Stocks Traded 0.08 -0.91 0.04
(0.004) (0.006) (0.003)0.00 0.21 0.00
Eastern -0.61 -0.82 -0.54(0.004) (0.006) (0.003)
0.21 0.17 0.38Southern 2.58 -2.57 0.03
(0.004) (0.006) (0.003)3.71 1.66 0.00
Western -0.45 2.98 -0.06(0.004) (0.006) (0.003)
0.11 2.24 0.00Northern -1.55 -0.35 0.45
(0.004) (0.006) (0.003)1.33 0.03 0.26
60

Table
A.9
Who
Ow
ns
What
:C
har
acte
rist
icT
ilts
Sin
gle
Fac
tor
Model
Est
imat
es:
Acc
ount
Siz
eW
eigh
ted
Est
imat
es
Th
ista
ble
pre
sents
the
anal
ysi
sin
Tab
le4
usi
ng
inve
stor
size
wei
ghte
dre
gre
ssio
ns
inst
ead
of
equ
all
yw
eighti
ng
all
inves
tors
.
Sto
ckA
ge
Div
idend
Payin
gShare
Pri
ceT
urn
over
Bus.
Gp.
Any
Realize
dR
etu
rns
Mark
et
Beta
Realize
dSkew
Realize
dV
ola
tility
Book
/M
ark
et
Mark
et
Cap.
Siz
e1.
322.
362.
60-0
.38
-1.0
20.
54-1
.60
-1.4
5-0
.27
-2.2
4-1
.86
(0.0
05)
(0.0
03)
(0.0
03)
(0.0
03)
(0.0
04)
(0.0
04)
(0.0
04)
(0.0
04)
(0.0
03)
(0.0
03)
(0.0
03)
0.67
7.16
8.77
0.13
0.61
0.22
2.10
1.48
0.08
7.44
4.54
No.
Sto
cks
0.56
-0.0
2-0
.05
0.04
0.16
0.22
-0.0
20.
36-0
.01
0.17
-0.0
5(0
.002
)(0
.001
)(0
.001
)(0
.002
)(0
.002
)(0
.002
)(0
.002
)(0
.002
)(0
.001
)(0
.001
)(0
.001
)0.
530.
000.
020.
000.
060.
160.
000.
400.
000.
190.
01A
ge4.
392.
001.
61-1
.53
-0.4
81.
22-1
.51
0.39
-0.7
1-1
.03
-1.2
7(0
.007
)(0
.004
)(0
.004
)(0
.004
)(0
.006
)(0
.005
)(0
.005
)(0
.005
)(0
.004
)(0
.003
)(0
.004
)4.
302.
961.
941.
210.
080.
651.
080.
060.
340.
921.
22T
urn
over
-9.0
8-6
.18
-4.7
65.
510.
94-4
.11
4.15
0.13
2.36
3.54
1.85
(0.0
21)
(0.0
11)
(0.0
11)
(0.0
13)
(0.0
17)
(0.0
15)
(0.0
14)
(0.0
15)
(0.0
12)
(0.0
11)
(0.0
11)
1.98
3.03
1.81
1.70
0.03
0.79
0.88
0.00
0.41
1.15
0.28
Sin
gle
Sto
ckD
um
my
-2.0
50.
360.
720.
81-2
.23
-0.2
0-0
.99
-1.1
30.
86-1
.27
-0.3
2(0
.011
)(0
.006
)(0
.006
)(0
.007
)(0
.009
)(0
.008
)(0
.007
)(0
.008
)(0
.006
)(0
.006
)(0
.006
)0.
370.
040.
150.
140.
670.
010.
180.
210.
200.
540.
03N
o.Sto
cks
Tra
ded
-0.1
8-0
.08
0.00
0.40
-0.2
7-0
.20
-0.0
8-0
.12
0.05
0.13
-0.2
2(0
.003
)(0
.002
)(0
.002
)(0
.002
)(0
.002
)(0
.002
)(0
.002
)(0
.002
)(0
.002
)(0
.001
)(0
.002
)0.
040.
030.
000.
490.
150.
100.
020.
040.
010.
090.
22E
aste
rn-0
.78
-0.3
6-0
.83
0.12
0.57
0.43
0.33
0.17
0.57
0.45
0.93
(0.0
08)
(0.0
05)
(0.0
05)
(0.0
05)
(0.0
07)
(0.0
06)
(0.0
06)
(0.0
06)
(0.0
05)
(0.0
04)
(0.0
04)
0.09
0.06
0.34
0.00
0.08
0.05
0.03
0.01
0.15
0.12
0.45
Sou
ther
n-0
.47
1.96
1.90
1.24
-3.9
6-2
.46
-2.3
8-3
.66
-0.8
1-1
.89
-1.8
0(0
.008
)(0
.004
)(0
.004
)(0
.005
)(0
.006
)(0
.005
)(0
.005
)(0
.005
)(0
.004
)(0
.004
)(0
.004
)0.
042.
322.
200.
664.
332.
142.
194.
420.
362.
511.
99W
este
rn2.
22-0
.69
-0.4
3-1
.00
2.73
2.26
1.05
2.70
0.45
1.08
0.11
(0.0
07)
(0.0
04)
(0.0
04)
(0.0
05)
(0.0
06)
(0.0
05)
(0.0
05)
(0.0
06)
(0.0
04)
(0.0
04)
(0.0
04)
0.90
0.29
0.11
0.42
2.08
1.83
0.43
2.42
0.11
0.82
0.01
Nor
ther
n-2
.44
-1.2
6-1
.20
-0.1
50.
38-0
.80
1.26
0.39
-0.1
40.
421.
50(0
.009
)(0
.005
)(0
.005
)(0
.006
)(0
.007
)(0
.006
)(0
.006
)(0
.007
)(0
.005
)(0
.005
)(0
.005
)0.
760.
670.
610.
010.
030.
160.
430.
030.
010.
090.
97
61

Table A.10Who Owns What: Characteristic Clusters
Single Factor Model Estimates: Account Size Weighted Estimates
This table reconstructs the analysis in Table 5 – applying size-weighted univariate regressions of size
weighted PC (of investors’ characteristic tilts) on account attributes. Loadings of characteristics on
size-weighted PC are shown in Figure A.6.
PC1 PC2 PC3
Size 0.0221 0.0304 -0.0330(0.000) (0.000) (0.000)
0.015 0.038 0.062No.Stocks 0.0045 -0.0032 0.0001
(0.000) (0.000) (0.000)0.005 0.003 0.000
Age 0.0474 0.0028 -0.0268(0.000) (0.000) (0.000)
0.052 0.000 0.030Turnover -0.1492 -0.0158 0.1300
(0.000) (0.000) (0.000)0.026 0.000 0.036
Single Stock Dummy -0.0196 0.0219 -0.0110(0.000) (0.000) (0.000)
0.003 0.004 0.001No. Stocks Traded -0.0016 0.0024 0.0020
(0.000) (0.000) (0.000)0.000 0.001 0.001
Eastern -0.0091 -0.0082 0.0035(0.000) (0.000) (0.000)
0.001 0.001 0.000Southern 0.0016 0.0607 -0.0111
(0.000) (0.000) (0.000)0.000 0.081 0.004
Western 0.0197 -0.0388 -0.0020(0.000) (0.000) (0.000)
0.007 0.034 0.000Northern -0.0281 -0.0109 0.0161
(0.000) (0.000) (0.000)0.009 0.002 0.006
62

Table
A.1
1W
ho
Ow
ns
What
:C
har
acte
rist
icT
ilts
Mult
iF
acto
rM
odel
Est
imat
es
Th
eta
ble
pre
sents
am
ult
ivar
iate
ver
sion
ofth
ean
aly
sis
inT
ab
le4.
Each
chara
cter
isti
cti
ltis
regre
ssed
on
the
full
set
of
acc
ou
nt
att
rib
ute
sin
stea
d
ofea
chon
ese
par
atel
y.
Sto
ckA
ge
Div
idend
Payin
gShare
Pri
ceT
urn
over
Bus.
Gp.
Any
Realize
dR
etu
rns
Mark
et
Beta
Realize
dSkew
Realize
dV
ola
tility
Book
/M
ark
et
Mark
et
Cap.
Siz
e5.
6710
.49
8.35
0.77
-5.3
41.
94-1
.81
-1.5
40.
96-2
.45
-2.4
8(0
.011
)(0
.009
)(0
.009
)(0
.009
)(0
.009
)(0
.009
)(0
.008
)(0
.007
)(0
.007
)(0
.007
)(0
.007
)N
o.Sto
cks
0.03
-1.2
8-1
.28
-0.1
70.
980.
530.
150.
65-0
.47
0.00
0.32
(0.0
12)
(0.0
09)
(0.0
09)
(0.0
09)
(0.0
09)
(0.0
09)
(0.0
08)
(0.0
08)
(0.0
08)
(0.0
07)
(0.0
07)
Age
2.21
-1.3
2-1
.01
-3.0
60.
411.
70-1
.40
1.24
1.14
1.40
-1.2
0(0
.009
)(0
.007
)(0
.007
)(0
.007
)(0
.007
)(0
.007
)(0
.006
)(0
.006
)(0
.006
)(0
.005
)(0
.005
)T
urn
over
0.63
0.37
-2.4
52.
09-1
.12
-0.1
10.
290.
981.
730.
56-0
.37
(0.0
09)
(0.0
07)
(0.0
07)
(0.0
07)
(0.0
07)
(0.0
07)
(0.0
06)
(0.0
06)
(0.0
06)
(0.0
06)
(0.0
05)
Sin
gle
Sto
ckD
um
my
-1.9
2-0
.96
3.63
-1.2
4-0
.50
-0.9
1-0
.55
-0.6
0-1
.62
-0.4
0-0
.87
(0.0
10)
(0.0
08)
(0.0
08)
(0.0
08)
(0.0
08)
(0.0
08)
(0.0
07)
(0.0
07)
(0.0
06)
(0.0
06)
(0.0
06)
No.
Sto
cks
Tra
ded
-0.6
9-0
.74
-0.6
90.
86-0
.06
-1.1
20.
770.
210.
370.
45-0
.36
(0.0
11)
(0.0
08)
(0.0
09)
(0.0
09)
(0.0
08)
(0.0
08)
(0.0
08)
(0.0
07)
(0.0
07)
(0.0
07)
(0.0
07)
Sou
ther
n-0
.32
0.58
-0.1
70.
31-0
.42
0.44
0.20
0.17
0.08
-0.1
8-0
.82
(0.0
13)
(0.0
10)
(0.0
10)
(0.0
10)
(0.0
10)
(0.0
10)
(0.0
09)
(0.0
08)
(0.0
08)
(0.0
08)
(0.0
08)
Wes
tern
-0.5
1-0
.99
0.43
-1.2
30.
62-0
.36
-1.1
80.
41-0
.29
-0.2
5-0
.42
(0.0
14)
(0.0
11)
(0.0
11)
(0.0
11)
(0.0
11)
(0.0
10)
(0.0
10)
(0.0
09)
(0.0
09)
(0.0
08)
(0.0
08)
Nor
ther
n-1
.55
-0.9
90.
31-1
.05
0.54
-0.6
8-0
.29
-0.1
3-0
.67
-0.0
90.
13(0
.013
)(0
.010
)(0
.010
)(0
.010
)(0
.010
)(0
.010
)(0
.009
)(0
.008
)(0
.008
)(0
.008
)(0
.008
)
Adj.
Rsq
8.02
20.3
511
.94
4.15
5.06
3.38
2.21
1.31
3.14
2.15
3.09
63

Table A.12Who Owns What: Characteristic Clusters
Multi Factor Model Estimates
This table presents a multivariate version of the regressions in Table 5. Here, each PC is regressed on
the full set of account attributes, instead of each one individually.
PC1 PC2 PC3
Size 0.0803 -0.0743 0.0879(0.000) (0.000) (0.000)
No. Stocks -0.0049 0.0130 -0.0069(0.000) (0.000) (0.000)
Age 0.0084 0.0015 0.0088(0.000) (0.000) (0.000)
Turnover 0.0216 0.0268 -0.0088(0.000) (0.000) (0.000)
Single Stock Dummy -0.0324 -0.0316 0.0036(0.000) (0.000) (0.000)
No. Stocks Traded -0.0034 0.0078 -0.0155(0.000) (0.000) (0.000)
Eastern 0.0168 0.0042 0.0020(0.000) (0.000) (0.000)
Southern 0.0233 0.0111 0.0090(0.000) (0.000) (0.000)
Western 0.0125 -0.0017 0.0059(0.000) (0.000) (0.000)
Adj. R squared 0.110 0.082 0.137
64

Table A.13Who Owns What: Characteristic Clusters
Single Factor Model Estimates: All Characteristics
This table presents a version of Table 5 where the principal components are extracted from the set of all
investor characteristic tilts (e.g. including business group, industry and geographical zone).
PC1 PC2 PC3
Size 0.1070 -0.0271 -0.1033(0.000) (0.000) (0.000)9.91% 0.88% 17.73%
No.Stocks 0.0432 -0.0131 -0.0250(0.000) (0.000) (0.000)1.62% 0.21% 1.04%
Age 0.0274 -0.0221 -0.0302(0.000) (0.000) (0.000)0.65% 0.59% 1.51%
Turnover 0.0107 0.0164 0.0480(0.000) (0.000) (0.000)0.10% 0.32% 3.83%
Single Stock Dummy -0.0813 0.0204 0.0303(0.000) (0.000) (0.000)5.73% 0.50% 1.53%
No. Stocks Traded 0.0387 -0.0022 -0.0024(0.000) (0.000) (0.000)1.30% 0.01% 0.01%
Eastern 0.0129 0.0019 0.0034(0.000) (0.000) (0.000)0.14% 0.00% 0.02%
Southern 0.0322 0.0159 0.0026(0.000) (0.000) (0.000)0.90% 0.30% 0.01%
Western -0.0163 -0.0217 -0.0080(0.000) (0.000) (0.000)0.23% 0.56% 0.11%
Northern -0.0221 0.0083 0.0043(0.000) (0.000) (0.000)0.42% 0.08% 0.03%
65

Table A.14Time-series of Characteristic Clientele Strength
This table presents the variance of investors’ characteristic tilts (i.e. characteristic clientele strength)
separately for each August cross-section 2002 through 2011. All characteristics are orthogonalized in the
same order as is applied in 2011.
Characteristic 2002 2003 2004 2005 2006 2007 2008 2009 2010 Average 2011
Age 0.063 0.082 0.079 0.084 0.078 0.074 0.078 0.075 0.079 0.077 0.074Dividend Payer 0.045 0.042 0.047 0.042 0.053 0.044 0.051 0.052 0.047 0.047 0.049Share Price 0.031 0.026 0.034 0.044 0.037 0.037 0.031 0.034 0.042 0.035 0.045Turnover 0.030 0.036 0.040 0.046 0.053 0.050 0.065 0.041 0.064 0.047 0.044Business Group - Any 0.044 0.041 0.041 0.039 0.041 0.040 0.039 0.043 0.040 0.041 0.042Returns 0.041 0.050 0.040 0.029 0.032 0.045 0.038 0.033 0.038 0.038 0.040Zone - West 0.037 0.036 0.034 0.034 0.034 0.035 0.033 0.035 0.038 0.035 0.040Beta 0.030 0.025 0.026 0.032 0.045 0.029 0.048 0.039 0.035 0.034 0.035Industry - Financial Services 0.024 0.024 0.030 0.030 0.034 0.030 0.025 0.026 0.024 0.028 0.033Skewness 0.052 0.041 0.046 0.051 0.056 0.044 0.032 0.044 0.043 0.046 0.030Volatility 0.024 0.022 0.025 0.036 0.032 0.036 0.039 0.045 0.029 0.032 0.030Industry - Manufacturing 0.023 0.024 0.024 0.022 0.032 0.033 0.025 0.028 0.026 0.026 0.026Book/Market 0.038 0.032 0.035 0.043 0.033 0.035 0.021 0.027 0.026 0.032 0.026Market Cap 0.021 0.022 0.029 0.031 0.030 0.026 0.022 0.020 0.032 0.026 0.025Industry - Oil & Gas 0.001 0.001 0.001 0.010 0.006 0.006 0.045 0.037 0.026 0.015 0.022Business Group - Reliance (ADAG) 0.000 0.000 0.000 0.001 0.004 0.005 0.036 0.026 0.023 0.011 0.021Zone - South 0.013 0.018 0.017 0.018 0.018 0.017 0.012 0.015 0.016 0.016 0.018Industry - Info. & Comm. Tech. 0.008 0.007 0.009 0.009 0.011 0.012 0.011 0.012 0.013 0.010 0.013Industry - Construction 0.001 0.002 0.002 0.002 0.002 0.004 0.007 0.008 0.013 0.004 0.012Public Sector Enterprise 0.013 0.017 0.023 0.023 0.018 0.014 0.012 0.013 0.013 0.016 0.012Business Group - Reliance (DAG) 0.000 0.000 0.000 0.010 0.020 0.015 0.014 0.013 0.012 0.009 0.012Industry - Food, Agro. & Textiles 0.004 0.004 0.004 0.004 0.006 0.004 0.003 0.007 0.009 0.005 0.010Zone - North 0.007 0.008 0.009 0.011 0.008 0.007 0.006 0.007 0.007 0.008 0.008Business Group - Tata 0.008 0.008 0.008 0.011 0.009 0.008 0.006 0.006 0.006 0.008 0.007Business Group - Suzlon 0.000 0.000 0.000 0.000 0.000 0.000 0.000 0.002 0.004 0.001 0.003Business Group - Mahindra 0.001 0.001 0.000 0.000 0.001 0.001 0.000 0.000 0.003 0.001 0.003Business Group - Jaypee 0.001 0.001 0.001 0.003 0.001 0.001 0.002 0.002 0.003 0.002 0.002Business Group - Jindal 0.001 0.001 0.001 0.000 0.000 0.000 0.000 0.001 0.001 0.001 0.002Business Group - Birla Aditya 0.003 0.003 0.003 0.002 0.002 0.003 0.002 0.002 0.002 0.003 0.002Business Group - Adani 0.000 0.000 0.000 0.000 0.000 0.000 0.001 0.001 0.003 0.001 0.002Business Group - Vedanta 0.002 0.001 0.001 0.001 0.001 0.001 0.001 0.001 0.001 0.001 0.001Zone - East 0.000 0.000 0.000 0.000 0.000 0.000 0.000 0.000 0.000 0.000 0.000Industry - Other Retail 0.000 0.000 0.000 0.000 0.000 0.000 0.000 0.000 0.000 0.000 0.000
66

Table A.15Robustness over Time
Correlations of Investors’ Characteristic Tilts
The panels below present the time-series average correlations of investors’ characteristic tilts (using or-
thogonalized characteristics, excluding business group, industry and geographic zone) for August vintages
of the data between 2003 and 2010. The shading illustrates the sign and magnitude of the correlations
indicated in gray text. In Panel A, characteristics are presented in order of their clientele strength
(Table 2), whereas Panel B reorders the characteristics to illustrate the presence of clusters of (coheld)
characteristics.
Panel A: Ordered by Characteristic Clientele Strength
Panel B: Ordered by Cluster

Table
A.1
6R
obust
nes
sov
erT
ime
Who
Ow
ns
What
:C
har
acte
rist
icT
ilts
Sin
gle
Fac
tor
Model
Est
imat
es
Th
ista
ble
rep
orts
the
tim
e-se
ries
aver
age
fact
or
load
ings,
stan
dard
dev
iati
on
of
load
ings,
and
the
aver
ageR
2fr
om
un
ivari
ate
regre
ssio
ns
of
inves
tors
’
char
acte
rist
icti
lts
(in
colu
mn
s,u
sin
gor
thog
onali
zed
chara
cter
isti
cs)
on
acc
ou
nt
att
rib
ute
s(i
nro
ws)
usi
ng
Au
gust
cross
-sec
tion
sof
the
data
bet
wee
n
2003
and
2010
.S
had
ing
ofco
effici
ents
corr
esp
on
ds
toth
eir
sign
an
dm
agn
itu
de.
Sto
ckA
ge
Div
iden
dP
ayin
gS
hare
Pri
ceT
urn
over
Bu
s.G
p.
Any
Reali
zed
Retu
rns
Mark
et
Beta
Reali
zed
Skew
Reali
zed
Vola
tili
tyB
ook
/M
ark
et
Mark
et
Cap
.
Siz
e6.
658.
375.
830.
57-1
.87
1.06
-1.8
8-1
.54
0.58
-0.8
9-0
.11
(1.8
89)
(1.3
49)
(1.9
59)
(2.8
67)
(2.1
85)
(2.3
62)
(2.7
68)
(1.8
85)
(1.8
97)
(0.8
14)
(1.5
16)
6.38
17.2
610
.54
1.42
2.01
1.91
2.41
1.32
1.13
0.52
0.82
No.
Sto
cks
3.42
2.26
1.15
0.70
-0.1
60.
78-0
.74
-0.1
60.
56-0
.02
0.17
(0.9
97)
(1.1
71)
(0.6
84)
(1.2
71)
(1.2
20)
(0.9
78)
(1.4
18)
(0.7
71)
(0.6
51)
(0.4
68)
(0.5
57)
1.74
1.47
0.47
0.35
0.35
0.45
0.55
0.15
0.21
0.07
0.13
Age
5.85
1.71
0.28
-1.2
0-0
.20
0.85
-1.6
60.
030.
701.
170.
34(1
.363
)(1
.734
)(0
.871
)(2
.086
)(2
.288
)(2
.628
)(2
.391
)(1
.152
)(1
.243
)(0
.746
)(0
.712
)4.
821.
240.
211.
261.
221.
871.
950.
300.
550.
600.
25T
urn
over
-0.9
5-2
.84
-3.1
81.
860.
75-0
.42
0.67
0.46
1.55
-0.0
20.
55(1
.090
)(1
.220
)(0
.818
)(1
.248
)(0
.349
)(1
.062
)(1
.524
)(1
.026
)(1
.324
)(0
.654
)(0
.446
)0.
262.
382.
981.
000.
190.
390.
650.
291.
160.
140.
18S
ingl
eS
tock
Du
mm
y-4
.98
-3.3
0-1
.39
-1.4
70.
30-1
.10
0.94
0.32
-1.2
50.
29-0
.80
(1.4
50)
(2.6
27)
(1.7
21)
(3.1
74)
(2.3
34)
(2.0
30)
(2.8
22)
(1.6
37)
(1.9
06)
(0.8
18)
(1.3
87)
3.62
3.82
1.26
1.93
1.30
1.49
1.84
0.63
1.29
0.27
0.91
No.
Sto
cks
Tra
ded
1.13
0.73
-0.1
61.
75-0
.06
0.06
0.02
0.01
1.13
-0.3
40.
35(0
.996
)(1
.178
)(0
.534
)(1
.345
)(0
.648
)(0
.739
)(1
.355
)(0
.916
)(0
.916
)(0
.442
)(0
.428
)0.
300.
390.
080.
910.
100.
150.
420.
210.
560.
110.
12E
aste
rn0.
520.
00-0
.18
0.58
0.23
0.00
0.20
0.02
-0.1
2-0
.24
0.71
(0.3
47)
(0.6
56)
(0.2
45)
(0.4
92)
(0.2
86)
(0.2
32)
(0.3
13)
(0.4
48)
(0.4
48)
(0.2
46)
(0.1
81)
0.05
0.09
0.02
0.11
0.03
0.01
0.04
0.04
0.06
0.04
0.21
Sou
ther
n-1
.26
1.00
-0.4
80.
61-1
.01
0.13
-0.5
0-0
.35
0.23
-0.1
6-0
.01
(1.5
10)
(0.7
37)
(0.2
04)
(0.6
86)
(0.1
39)
(0.4
81)
(0.6
47)
(0.5
79)
(0.7
28)
(0.1
85)
(0.5
65)
0.48
0.35
0.08
0.16
0.29
0.06
0.15
0.10
0.15
0.02
0.12
Wes
tern
2.19
-0.0
20.
65-0
.77
0.67
0.05
0.03
-0.0
70.
290.
34-0
.68
(1.4
73)
(0.9
30)
(0.2
45)
(0.7
10)
(0.2
29)
(0.7
43)
(0.7
98)
(0.6
32)
(0.7
62)
(0.2
53)
(0.3
12)
0.89
0.18
0.13
0.27
0.14
0.14
0.16
0.09
0.18
0.05
0.21
Nor
ther
n-1
.74
-0.9
6-0
.16
-0.1
00.
03-0
.18
0.30
0.41
-0.4
7-0
.07
0.29
(0.4
48)
(0.1
41)
(0.3
61)
(0.8
15)
(0.4
96)
(0.7
76)
(0.7
62)
(0.9
01)
(0.3
76)
(0.3
09)
(0.3
72)
0.43
0.23
0.04
0.12
0.06
0.16
0.17
0.21
0.11
0.03
0.08
68

Table A.17Robustness Over Time
Who Owns What: Characteristic ClustersSingle Factor Model Estimates
This table reports the average factor loadings, the time-series standard deviation of loadings, and the
average R2 from univariate regressions of the characteristic portfolios formed by fixing the composition
of the three PCs to that estimated in August 2011 in the August cross-sections between 2003 and 2010
on account attributes. Shading of coefficients corresponds to their sign and magnitude. The estimates
equally weight all investors in the data.
PC1 PC2 PC3
Size 0.0812 -0.0630 0.0630(0.033) (0.023) (0.023)
8.282 9.802 9.802No.Stocks 0.0386 -0.0137 0.0137
(0.017) (0.006) (0.006)1.903 0.519 0.519
Age 0.0517 -0.0204 0.0204(0.024) (0.015) (0.015)
3.438 1.407 1.407Turnover -0.0042 0.0330 -0.0330
(0.018) (0.010) (0.010)0.414 2.536 2.536
Single Stock Dummy -0.0590 0.0168 -0.0168(0.037) (0.020) (0.020)
4.719 1.405 1.405No. Stocks Traded 0.0208 0.0043 -0.0043
(0.019) (0.007) (0.007)0.738 0.157 0.157
Eastern 0.0057 0.0020 -0.0020(0.008) (0.002) (0.002)
0.083 0.020 0.020Southern -0.0033 0.0066 -0.0066
(0.016) (0.004) (0.004)0.315 0.140 0.140
Western 0.0155 -0.0123 0.0123(0.016) (0.008) (0.008)
0.664 0.437 0.437Northern -0.0192 0.0066 -0.0066
(0.005) (0.008) (0.008)0.463 0.217 0.217
69

Table A.18Who Owns What
Stock-level Multi Factor Model Estimates
This table reports the characteristic-weighted loadings of stockholdings on account attributes, using
orthogonalized characteristics. Each column corresponds to a characteristic, centered at zero and scaled
so that positive and negative weights each sum to one. Colors indicate the magnitude and sign of
coefficients.
−1.0 −0.8 −0.6 −0.4 −0.2 0.0 0.2 0.4 0.6 0.8 1.0
Sto
ck A
ge
Div
iden
d P
ayin
g
Sha
re P
rice
Sto
ck T
urno
ver
Rea
lized
Ret
urns
Mar
ket B
eta
Rea
lized
Ske
w
Rea
lized
Vol
atili
ty
Boo
k/M
arke
t
Mar
ket C
apita
lizat
ion
Age
Size
Turnover
No.Stocks
No.Stocks Traded
Single Stock Dummy
Southern
Northern
Western
0.57
1.46
0.16
0.01
−0.18
−0.49
−0.08
−0.40
−0.13
−0.32
2.57
0.09
−0.31
−0.18
−0.24
0.14
−0.24
−0.24
−0.26
2.15
−0.63
−0.33
−0.18
0.94
−0.04
0.08
0.11
−0.79
0.20
0.54
−0.04
0.22
−0.32
0.08
−0.27
−0.32
0.44
0.50
−0.03
0.14
−0.29
−0.23
0.11
−0.17
−0.09
−0.36
−0.47
0.07
0.04
0.20
−0.14
0.05
−0.07
−0.30
0.32
−0.40
0.25
0.17
0.05
−0.15
0.04
−0.03
0.11
0.29
0.25
0.45
−0.12
0.10
−0.42
0.02
−0.17
−0.08
0.36
−0.63
0.14
0.00
0.12
−0.10
−0.05
−0.02
−0.06
−0.31
−0.64
−0.09
0.08
−0.09
−0.23
−0.21
0.03
−0.11
70

Table A.19Who Owns What
Stock-level Multi Factor Model Estimates
This table reports the characteristic-weighted loadings of stockholdings on characteristic tilts, using
orthogonalized characteristics. Each column corresponds to a characteristic, centered at zero and scaled
so that positive and negative weights each sum to one. Colors indicate the magnitude and sign of
coefficients.
−1.0 −0.8 −0.6 −0.4 −0.2 0.0 0.2 0.4 0.6 0.8 1.0
Sto
ck A
ge
Div
iden
d P
ayin
g
Sha
re P
rice
Sto
ck T
urno
ver
Rea
lized
Ret
urns
Mar
ket B
eta
Rea
lized
Ske
w
Rea
lized
Vol
atili
ty
Boo
k/M
arke
t
Mar
ket C
apita
lizat
ion
Stock Age
Dividend Paying
Share Price
Stock Turnover
Realized Returns
Market Beta
Realized Skew
Realized Volatility
Book/Market
Market Capitalization
1.18
0.38
0.26
−0.15
0.18
0.18
0.14
0.14
0.16
−0.05
−0.08
0.27
0.12
0.09
−0.15
−0.03
−0.07
−0.18
−0.02
0.16
−0.11
0.22
0.48
0.01
−0.20
0.01
−0.15
−0.19
−0.11
0.22
−0.04
−0.21
−0.32
0.45
−0.19
0.16
−0.03
0.12
0.10
0.07
0.11
−0.12
−0.06
−0.14
0.52
−0.10
0.07
−0.01
−0.07
−0.21
0.04
−0.24
−0.18
0.21
−0.14
0.32
−0.05
0.03
0.06
0.12
0.26
0.16
0.04
−0.14
0.33
0.01
0.20
0.18
0.03
−0.31
0.18
0.32
0.22
−0.06
0.22
0.05
0.15
0.36
0.06
−0.16
0.12
0.13
0.01
−0.04
0.01
0.00
0.05
0.10
0.23
−0.16
−0.26
−0.62
−0.52
0.27
−0.37
0.04
−0.24
−0.20
−0.05
0.44
71

Table A.20Stock-level Estimates: Observable and Unobservable Factor Model Summary
The first two rows of this table compare the R-squareds of the observed factor model in Table 6 with the
R-squared from the first ten principal components of the stockholding data Qv. The left column presents
an R-squared across all 3,103 stocks, with columns to the right presenting R-squareds excluding the top
1, 10 and 50 stocks based on average portfolio share from the calculation. The bottom three rows of the
table present R-squareds associated with each of the first three principal components.
Full sample W/o Top 1 W/o Top 10 W/o Top 50
Observed Factor Model 3.96 2.30 0.66 0.29PCA 1-10 31.51 21.99 1.36 0.04PC1 12.37 0.33 0.04 0.01PC2 6.77 7.58 0.03 0.01PC3 2.00 2.28 0.02 0.00
Table A.21Characteristic Return and Tilt Variances and Covariances
Account Size Weighted Estimates
This table presents a reconstruction of Table 9 using account size weights in the construction of the
characteristic tilt (co)variances.
Dep. Var: Return Factor (Co)Variance Variances Covariances
(1) (2) (3) (4) (5) (6)Holding Factor (Co)variance -0.004 0.003
(0.004) (0.003)Of which, coholding contribution -0.005 0.030 0.042*** 0.054***
(0.017) (0.026) (0.009) (0.010)Of which, holding contribution -0.015 -0.009***
(0.009) (0.003)Constant Y Y Y Y Y YAdj. R-squared -0.010 -0.115 0.076 0.002 0.301 0.384N 10 10 10 45 45 45
* p < 0.10, ** p< 0.05, *** p < 0.01
72

Table A.22Stock Return and Holding Variances
This table presents a regression of empirical return variance estimates on holdings variance. The return
variance measures are based on weekly returns data for a year leading up to August 2011. Column (1)
presents the regression with the raw measures, Column (2) with rank normalized measures and Column
(3) the relationship when holdings variance is rank normalized to be between 0 and 1. Standard errors
in parentheses.
Dep. Var: Return VarianceRaw Rank normalized Raw(1) (2) (3)
Constant 0.000*** 0.627*** 0.007***(0.000) (0.011) (0.000)
Holdings Variance -0.206(0.160)
... Rank normalized -0.253*** -0.002***(0.020) (0.000)
Adj. R-squared 0.001 0.064 0.002Observations 3103 3103 3103
* p < 0.10, ** p< 0.05, *** p < 0.01
Table A.23Stock Covariances and Holding Covariances
This table presents a regression of empirical return covariance estimates on empirical holdings covariance
in columns (1) and (2). The return covariance measures are based on weekly returns data for a year leading
up to August 2011. Column (2) present the relationship when both measures are rank normalized to be
between 0 and 1, and Column (3) the relationship when empirical holdings covariance is rank normalized
to be between 0 and 1. Standard errors in parentheses.
Dep. Var: Return CovarianceRaw ×100 Rank normalized Raw ×100
(1) (2) (3)Constant 0.100*** 0.443*** 0.071***
(0.000) (0.000) (0.000)Coholdings 199.490*
(117.990)... Rank normalized 0.114*** 0.034***
(0.001) (0.000)R-squared 0.0040 0.0130 0.010Observations 4,812,753 4,812,753 4,812,753
* p < 0.10, ** p< 0.05, *** p < 0.01
73

Table
A.2
4C
har
acte
rist
icR
eturn
and
Tilt
Var
iance
san
dC
ovar
iance
sO
ver
Tim
e
Th
ista
ble
pre
sents
coeffi
cien
tsfr
omre
gres
sion
sin
colu
mn
s3
an
d6
of
Tab
le9,
run
usi
ng
Au
gu
stcr
oss
-sec
tion
sfr
om
each
year
bet
wee
n2006
an
d
2011
.C
har
acte
rist
icT
ilt
(co)
vari
ance
sar
eco
nst
ruct
edu
sin
gd
ata
from
Marc
h2002
thro
ugh
Au
gust
of
the
giv
enye
ar.
Var
iance
sC
ovar
iance
s
2006
2007
2008
2009
2010
2011
2006
2007
2008
2009
2010
2011
Coh
oldin
gC
ontr
ib.
0.05
6*0.
069*
*0.
076
0.05
20.
077*
*0.
120*
**0.
057*
**0.
065*
**0.
061*
**0.
066*
**0.
061*
**0.
063*
**(0
.032
)(0
.033
)(0
.050
)(0
.037
)(0
.033
)(0
.038
)(0
.011
)(0
.010
)(0
.010
)(0
.011
)(0
.008
)(0
.006
)H
oldin
gC
ontr
ib-0
.009
-0.0
16*
-0.0
21-0
.013
-0.0
16**
-0.0
20**
-0.0
09**
*-0
.009
***
-0.0
18**
*-0
.016
***
-0.0
10**
*-0
.010
***
(0.0
07)
(0.0
08)
(0.0
14)
(0.0
10)
(0.0
07)
(0.0
08)
(0.0
03)
(0.0
02)
(0.0
03)
(0.0
03)
(0.0
02)
(0.0
01)
Adj.
R-s
quar
ed0.
126
0.23
40.
038
0.00
60.
279
0.49
90.
355
0.46
90.
436
0.44
40.
545
0.68
5
Table
A.2
5R
obust
nes
sov
erT
ime
Sto
ckC
ovar
iance
san
dH
oldin
gC
ovar
iance
s
Th
ista
ble
pre
sents
the
resu
lts
from
are
gres
sion
of
emp
iric
al
retu
rnco
vari
an
cees
tim
ate
son
norm
ali
zed
emp
iric
alh
old
ings
cova
rian
ceas
inC
olu
mn
(3)
ofT
able
A.2
0,ev
ery
Au
gust
for
the
yea
rs2003-2
011.
Sta
nd
ard
erro
rsin
pare
nth
eses
.
Dep
.V
ar:
Retu
rnC
ovari
an
cex
100
2003
2004
2005
2006
2007
2008
2009
2010
2011
Con
stan
t0.
083*
**0.
167*
**0.
082*
**0.
191*
**0.
044*
**0.
257*
**0.
444*
**0.
061*
**0.
071*
**(0
.001
)(0
.000
)(0
.000
)(0
.000
)(0
.000
)(0
.000
)(0
.000
)(0
.000
)(0
.000
)
Ran
kn
orm
aliz
ed0.
029*
**0.
093*
**0.
147*
**0.
140*
**0.
040*
**0.
116*
**0.
081*
**0.
013*
**0.
034*
**H
old
ings
Cov
aria
nce
(0.0
01)
(0.0
01)
(0.0
01)
(0.0
00)
(0.0
00)
(0.0
01)
(0.0
01)
(0.0
00)
(0.0
00)
R-s
qu
ared
0.00
10.
006
0.01
90.
059
0.00
90.
019
0.00
50.
001
0.01
Ob
serv
atio
ns
3,08
1,40
33,
158,
841
3,36
5,71
53,
638,
253
3,94
6,64
54,
200,
651
4,29
3,91
54,
537,
578
4,81
2,75
3
74

Fig
ure
A.1
Sum
mar
ySta
tist
ics
Pan
elA
plo
tsth
enu
mb
erof
inve
stor
sin
our
data
(rig
ht
axis
)in
mil
lion
s,an
dth
enu
mb
erof
stock
sin
ou
rd
ata
(lef
taxis
)ov
erti
me.
Pan
elB
plo
tsth
esh
are
ofea
chb
usi
nes
sgr
oup
(x-a
xis
)in
the
aver
age
inve
stor’
sst
ock
hold
ings.
Pan
elC
plo
tsth
egeo
gra
ph
icre
gio
nof
the
inves
tor;
Pan
elD
sum
mar
izes
the
pre
sen
ceof
each
ind
ust
ry(y
-axis
)in
the
aver
age
inve
stors
’p
ort
foli
o.
Pan
elA
:N
um
ber
ofO
bse
rvat
ions
Pan
elB
:B
usi
nes
sG
roups
2500
2600
2700
2800
2900
3000
3100
0246810
Jul
2
003
Jul
2
004
Jul
2
005
Jul
2
006
Jul
2
007
Jul
2
008
Jul
2
009
Jul
2
010
Jul
2
011
Sam
ple
perio
d: S
ep 2
003
− A
ug 2
011
No.
of S
ecur
ities
No.
of I
nves
tors
0.000.100.200.30
0.11
0.04
0.07
0.01
0.01
0.01
0.01
0.02
0.01
0.01
0.16
Reliance (ADAG)
Tata
Reliance (DAG)
Birla Aditya
JaypeeOm Prakash Jindal Mahindra and Mahindra
Suzlon
Vedanta
Adani
Others
Pan
elC
:G
eogr
aphy
Pan
elD
:In
dust
ry
Sou
thE
ast
Nor
thW
est
0.00.10.20.30.40.5
0.22
0.11
0.23
0.43
Fin
anci
al
Ser
vice
s
Foo
d, A
gri.
and
Tex
tiles
Info
rmat
ion
Tec
hnol
ogy
Man
ufac
turin
g
Oil
and
Gas
Oth
er R
etai
l
0.0
0.1
0.2
0.3
0.4
0.5
0.04
0.07
0.01
0.01
0.01
0.01
75

Figure A.2Comparison of U.S. and Indian Household Stock Wealth
This figure presents the empirical kernel density plot of the logarithmic value of all equity investments in
US dollars in the United States (black dashed line) from the Survey of Consumer Finances (SCF), 2013
and in Indian depository accounts in August 2011. The Indian portfolio value distribution is scaled by
the ratio of per capita GDP in India to the United States.
0 5 10 15 20
0.00
0.05
0.10
0.15
0.20
0.25
Log(Portfolio Value)
United States (SCF, 2013)India (Aug 2011), Scaled by Ratio of Per Capita GDP
76

Figure A.3Correlation Matrix
This figure plots the correlation between the set of account attributes and characteristic tilts constructed
as in Table 1.
77

Figure A.4Stock Characteristic Clusters
Principal Component Analysis: Account Size Weighted Estimates
This figure reconstructs the analysis in Figure 3 using PCs and regressions that weight accounts by their
size.
Load
ings
−1.
0−
0.5
0.0
0.5
1.0
−1.
0−
0.5
0.0
0.5
1.0
StockAge
DividendPaying
MarketBeta
Book/Market
RealizedSkew
StockTurnover
RealizedVolatility
(Low)SharePrice
RealizedReturns
MarketCapitalization
PC1 PC2 PC3
98.74% 36.01% 58.24% 17.94% 76.05% 30.72% 2% 30.69% 69.02% 7.61%Rsq. =
78

Figure A.5Stock Characteristic Clusters
Principal Component Analysis: All Characteristics
This figure reconstructs the analysis in Figure 3 when using PCs constructed from the full set of investors’
characteristic tilts (e.g. including business groups, industries and geographic zones).
Load
ings
−1.
0−
0.5
0.0
0.5
1.0
−1.
0−
0.5
0.0
0.5
1.0
Sto
ckA
ge
Div
iden
dP
ayin
g
Sto
ckTu
rnov
er
Oil
&G
as
Wes
tern BG
Any
Fin
anci
alS
ervi
ces
Rea
lized
Vol
atili
ty
Sha
reP
rice
Rea
lized
Ret
urns
Mar
ket
Cap
italiz
atio
n
Foo
dA
gric
ultu
re
Con
stru
ctio
n
Rea
lized
Ske
w
Mar
ket
Bet
a IT
Man
ufac
turin
g
Boo
k/M
arke
t
Nor
ther
n
Sou
ther
n
PC1 PC2 PC3
87.59% 60.02% 45.3% 56.33% 48.9% 50.61% 42.51% 26.96% 58.67% 25.77% 19.17% 25.68% 42.77% 18.28% 23.93% 2.31% 8.83% 8.9% 0.3% 4.76%Rsq. =
79
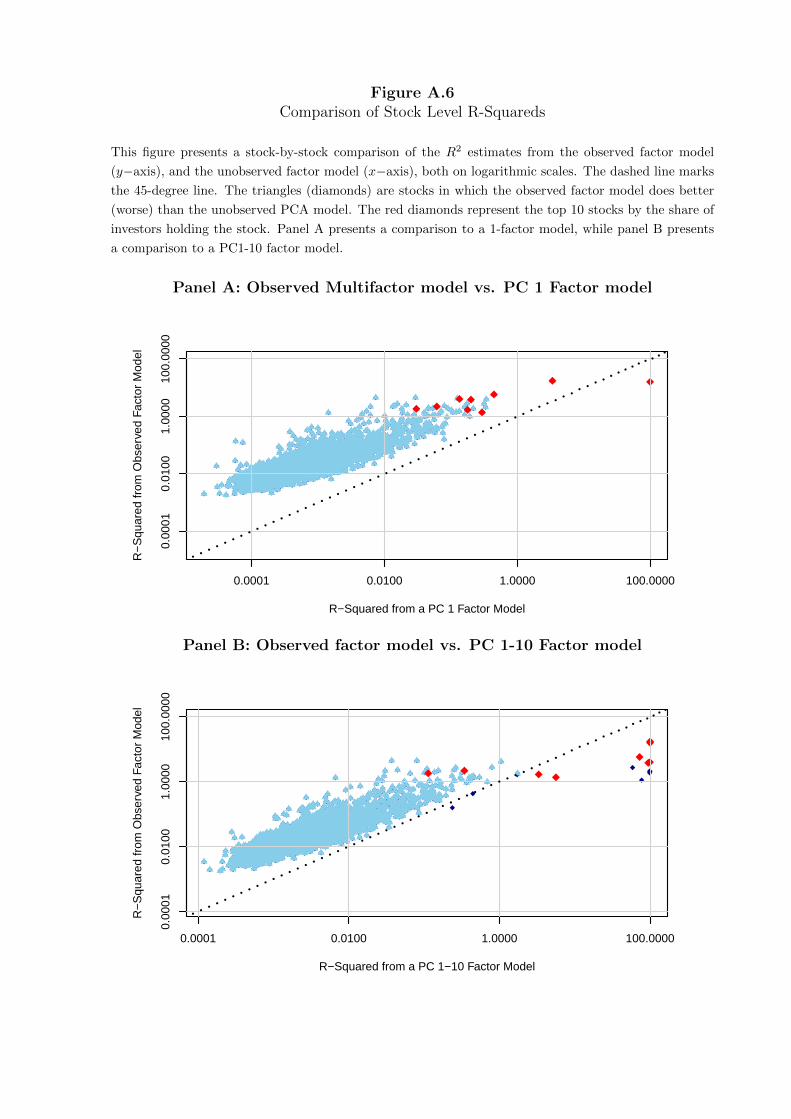
Figure A.6Comparison of Stock Level R-Squareds
This figure presents a stock-by-stock comparison of the R2 estimates from the observed factor model
(y−axis), and the unobserved factor model (x−axis), both on logarithmic scales. The dashed line marks
the 45-degree line. The triangles (diamonds) are stocks in which the observed factor model does better
(worse) than the unobserved PCA model. The red diamonds represent the top 10 stocks by the share of
investors holding the stock. Panel A presents a comparison to a 1-factor model, while panel B presents
a comparison to a PC1-10 factor model.
Panel A: Observed Multifactor model vs. PC 1 Factor model
0.0001 0.0100 1.0000 100.0000
0.00
010.
0100
1.00
0010
0.00
00
R−Squared from a PC 1 Factor Model
R−
Squ
ared
from
Obs
erve
d Fa
ctor
Mod
el
Panel B: Observed factor model vs. PC 1-10 Factor model
0.0001 0.0100 1.0000 100.0000
0.00
010.
0100
1.00
0010
0.00
00
R−Squared from a PC 1−10 Factor Model
R−
Squ
ared
from
Obs
erve
d Fa
ctor
Mod
el