Freedom Charities Trust An ISO 9001:2008 Certified Committing to Country …

WHO DO YOU TRUST TO WHO DO YOU TRUST TO WHO DO YOU TRUST TO WHO DO YOU TRUST TO RUN THE RUN THE RUN THE RUN THE
COUNTRY?COUNTRY?COUNTRY?COUNTRY?
DEMOCRACY, TRUST AND POLITICS IN AUSTRALIA
MARK EVANS, MAX HALUPKA AND GERRY STOKER
2
When the budget reckoning is over and Australian households have made marginal adjust-
ments to their spending plans one fundamental question will remain – who do you trust to run
the country? In February and March this year, the Museum of Australian Democracy (MoAD)
and the Institute for Governance and Policy Analysis (IGPA) commissioned Ipsos to survey
1444 Australians on the relationship between trust in the political system and attitudes towards
democracy. Drawing upon questions posed in the long running Australian Election Study,
we carefully crafted the survey to ensure time series data on most questions. The findings
make difficult reading for Australian political parties but strong clues as to how to respond.
Please consider the following findings.
Forward
3
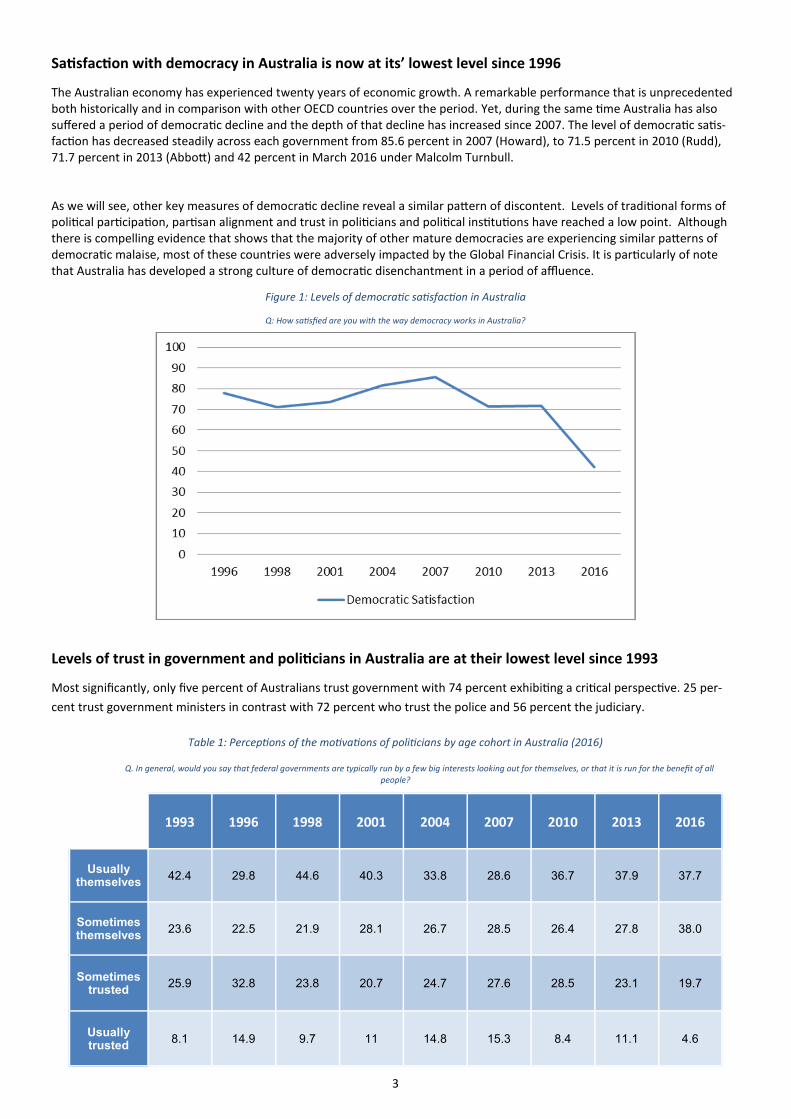
Sa�sfac�on with democracy in Australia is now at its’ lowest level since 1996
The Australian economy has experienced twenty years of economic growth. A remarkable performance that is unprecedented
both historically and in comparison with other OECD countries over the period. Yet, during the same $me Australia has also
suffered a period of democra$c decline and the depth of that decline has increased since 2007. The level of democra$c sa$s-
fac$on has decreased steadily across each government from 85.6 percent in 2007 (Howard), to 71.5 percent in 2010 (Rudd),
71.7 percent in 2013 (Abbo1) and 42 percent in March 2016 under Malcolm Turnbull.
As we will see, other key measures of democra$c decline reveal a similar pa1ern of discontent. Levels of tradi$onal forms of
poli$cal par$cipa$on, par$san alignment and trust in poli$cians and poli$cal ins$tu$ons have reached a low point. Although
there is compelling evidence that shows that the majority of other mature democracies are experiencing similar pa1erns of
democra$c malaise, most of these countries were adversely impacted by the Global Financial Crisis. It is par$cularly of note
that Australia has developed a strong culture of democra$c disenchantment in a period of affluence.
Levels of trust in government and poli�cians in Australia are at their lowest level since 1993
Most significantly, only five percent of Australians trust government with 74 percent exhibi$ng a cri$cal perspec$ve. 25 per-
cent trust government ministers in contrast with 72 percent who trust the police and 56 percent the judiciary.
Figure 1: Levels of democra�c sa�sfac�on in Australia
Q: How sa�sfied are you with the way democracy works in Australia?
1993 1996 1998 2001 2004 2007 2010 2013 2016
Usually themselves 42.4 29.8 44.6 40.3 33.8 28.6 36.7 37.9 37.7
Sometimes themselves 23.6 22.5 21.9 28.1 26.7 28.5 26.4 27.8 38.0
Sometimes trusted 25.9 32.8 23.8 20.7 24.7 27.6 28.5 23.1 19.7
Usually trusted 8.1 14.9 9.7 11 14.8 15.3 8.4 11.1 4.6
Table 1: Percep�ons of the mo�va�ons of poli�cians by age cohort in Australia (2016)
Q. In general, would you say that federal governments are typically run by a few big interests looking out for themselves, or that it is run for the benefit of all
people?

4
Australians no longer trust their poli�cians
In our view, the most remarkable finding from this extraordinary survey and a measure of the degree of discontent is that
the Baby Boomers (ci$zens born between 1946 and 1964) who have benefi1ed most in economic terms from a period of
affluence no longer trust their poli$cians.
However, it is equally evident that Australian ci$zens are interested in poli$cs (see Figure 5). Hence the level of par$san
alignment is a reflec$on of the inability of mainstream poli$cal par$es to capture the poli$cal imagina$on. In par$cular,
mainstream poli$cal par$es are clearly failing to engage with young Australian ci$zens in ways that are likely to a1ract
a1en$on and ul$mately support.
Figure 3: Percep�ons of the level of poli�cal honesty and integrity for local MPs in Australia by age cohort (2016)
Q: How much do you personally trust each of the following? (Answer = MPs (local))
Figure 2: Percep�ons of the level of poli�cal honesty and integrity for Federal Government in Australia by age cohort
(2016)
Q: How much do you personally trust each of the following? (Answer = Federal Government)

5
Le$? Right? Or an alterna�ve? I'll decide on the day because I am indifferent!
Everything is therefore up for grabs at the federal elec$on this year because vo$ng vola$lity is at an all-$me high and ci$-
zens indifferent about who wins the elec$on anymore! These are very fer$le condi$ons for independent candidates and
minority par$es with ambi$ous poli$cal agendas. Coali$on government of some kind is the most likely outcome.
Figure 4: Percep�ons of party loyalty in Australian over �me
Q: Before the most recent Federal elec�on for the House of Representa�ves, had you always voted for the same party, or had you some�mes voted
for different par�es?
Figure 5. Interest in poli�cs in Australia by age cohort (2016)
Q. Generally speaking how much interest do you have in what is going on in poli�cs?
6
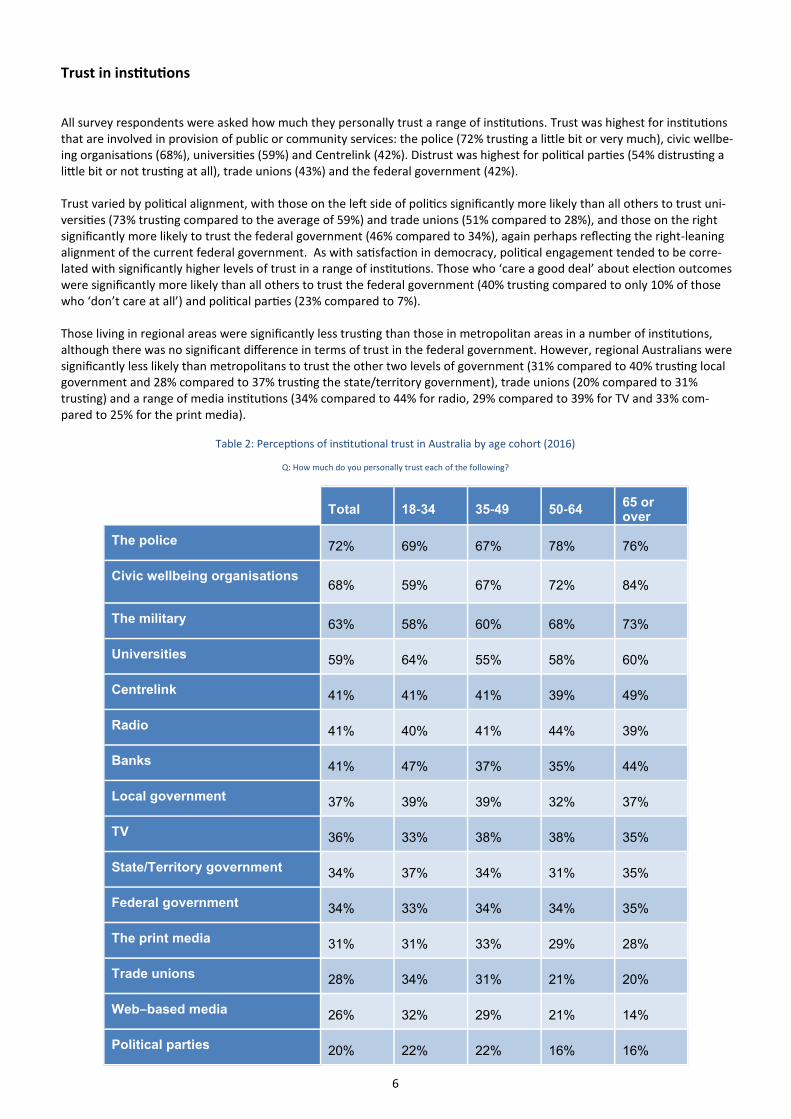
Trust in ins�tu�ons
All survey respondents were asked how much they personally trust a range of ins$tu$ons. Trust was highest for ins$tu$ons
that are involved in provision of public or community services: the police (72% trus$ng a li1le bit or very much), civic wellbe-
ing organisa$ons (68%), universi$es (59%) and Centrelink (42%). Distrust was highest for poli$cal par$es (54% distrus$ng a
li1le bit or not trus$ng at all), trade unions (43%) and the federal government (42%).
Trust varied by poli$cal alignment, with those on the leC side of poli$cs significantly more likely than all others to trust uni-
versi$es (73% trus$ng compared to the average of 59%) and trade unions (51% compared to 28%), and those on the right
significantly more likely to trust the federal government (46% compared to 34%), again perhaps reflec$ng the right-leaning
alignment of the current federal government. As with sa$sfac$on in democracy, poli$cal engagement tended to be corre-
lated with significantly higher levels of trust in a range of ins$tu$ons. Those who ‘care a good deal’ about elec$on outcomes
were significantly more likely than all others to trust the federal government (40% trus$ng compared to only 10% of those
who ‘don’t care at all’) and poli$cal par$es (23% compared to 7%).
Those living in regional areas were significantly less trus$ng than those in metropolitan areas in a number of ins$tu$ons,
although there was no significant difference in terms of trust in the federal government. However, regional Australians were
significantly less likely than metropolitans to trust the other two levels of government (31% compared to 40% trus$ng local
government and 28% compared to 37% trus$ng the state/territory government), trade unions (20% compared to 31%
trus$ng) and a range of media ins$tu$ons (34% compared to 44% for radio, 29% compared to 39% for TV and 33% com-
pared to 25% for the print media).
Total 18-34 35-49 50-64 65 or
over
The police 72% 69% 67% 78% 76%
Civic wellbeing organisations 68% 59% 67% 72% 84%
The military 63% 58% 60% 68% 73%
Universities 59% 64% 55% 58% 60%
Centrelink 41% 41% 41% 39% 49%
Radio 41% 40% 41% 44% 39%
Banks 41% 47% 37% 35% 44%
Local government 37% 39% 39% 32% 37%
TV 36% 33% 38% 38% 35%
State/Territory government 34% 37% 34% 31% 35%
Federal government 34% 33% 34% 34% 35%
The print media 31% 31% 33% 29% 28%
Trade unions 28% 34% 31% 21% 20%
Web–based media 26% 32% 29% 21% 14%
Political parties 20% 22% 22% 16% 16%
Table 2: Percep$ons of ins$tu$onal trust in Australia by age cohort (2016)
Q: How much do you personally trust each of the following?

7
Trust in individuals
All survey par$cipants were asked how much they trust a range of individuals. Judges (trusted a li1le bit or very much by
56%), public servants (39%) and business people (33%) were the most likely to be trusted. The most distrusted were gov-
ernment ministers (46% not trus$ng at all or distrus$ng a li1le bit), Trade unionists (21%) and MPs in general (29%). Nota-
bly, people were significantly more likely to trust their local MP (33% trusted) than MPs in general (26% trusted) or govern-
ment ministers (25% trusted).
These findings show that ci$zens have different aMtudes towards government ministers, poli$cians, local poli$cians and
public servants.
Similarly to trust in organisa$ons, those aligned to the poli$cal leC were significantly more likely to trust trade unionists
(42% trus$ng compared to an average of 24%), while those on the right were significantly more likely to trust ‘government
ministers’ (34% compared to 25%), their local MP (42% compared to 33%), business people (46% compared to 33%) and
judges (65% compared to 56%). Engagement once again led to higher levels of trust, with those who cared a good deal
about elec$on outcomes significantly more likely than all others to trust all individuals listed. Income made some differ-
ence, with those from households with an annual income less than $50,000 significantly less likely to trust public servants
(31% compared to 39%) and judges (47% compared to 56%).
There were also some differences in trust by loca$on, with those in regional areas significantly less likely to trust trade un-
ionists (18% compared to 26%) and public servants (30% compared to 42%) than those in metropolitan loca$ons.
Total 18-34 35-49 50-64 65 or over
Government ministers 25% 27% 26% 19% 31%
MPs in general 26% 29% 24% 23% 28%
Journalists 28% 28% 33% 23% 25%
Judges 56% 59% 52% 54% 59%
Local councillors 30% 34% 29% 25% 29%
Public servants 39% 46% 38% 34% 33%
Your local MP 33% 31% 33% 30% 42%
Trade unionists 24% 31% 25% 17% 16%
Business people 33% 31% 32% 32% 42%
Table 3: Percep$ons of trust in individuals in Australia by age cohort (2016)
Q: How much do you personally trust each of the following?

8
Ci�zen percep�ons of the capacity of federal government to deliver
All respondents were asked a series of ques$ons about the federal government in general – rather than the current federal
government. The following defini$on of the federal government was provided: ‘People have different ideas about the fed-
eral government. These ideas don't refer to a par$cular party (e.g. Labor or Liberal) but just to the idea of government at
the Commonwealth level in general. We want to see what you think about these ideas.’
Respondents were presented with a list of issues and asked how confident they were in the ability of the federal govern-
ment in general to address these issues, with results outlined below. Confidence was low, with fewer than half of respond-
ents describing themselves as ‘somewhat’ or ‘very confident’ in federal governments’ ability to address any of the issues
listed. The only issue where the majority (59%) were confident was na$onal security. Confidence was lowest in rela$on to
climate change (25% confident) and refugees/asylum seekers (32%).
Figure 6: Confidence in government to address issues
Q: How confident are you in the ability of the federal government in general to address the following issues?

9
We don’t trust any level of government very much
It isn’t just Federal government that can’t be trusted. State government can't be trusted either, but local government does
marginally be1er. This suggests a role for localism in a successful trust building project.
The majority of Australians think that their poli$cians are corrupt and too aligned with Big interests (business or unions).
Given these data, a poli$cal project focusing on cleaning up prac$ces within the Magic Kingdom (the federal parliament in
Canberra) is likely to gain followers.
I do not trust
them at all I distrust them
a little bit
I neither trust nor distrust
them
I trust them a little bit
I trust them very much
State 15.0 22.2 28.7 27.8 6.3
Federal 19.6 22.3 24.4 26.8 6.9
Local 12.8 20.2 28.1 29.7 5.5
Table 4: Percep�ons of the level of poli�cal honesty and integrity for Federal Government in Australia by age cohort (2016)
Q: How much do you personally trust each of the following?
Not giving a straight answer
Misusing official ex-
penses and
allowances.
Making promises they
know they can't keep.
Breaking
promises
Accepting Bribes
Not at all common 1.3 1.2 .9 .5 5.5
Not very common 2.3 6.2 2.8 3.0 18.2
Neither 9.1 14.4 10.9 11.6 31.9
Somewhat common 25.7 37.2 33.4 32.4 30.3
Very common 61.6 41.0 52.0 52.6 14.0
Table 5: Concern about poor poli�cal behaviour in Australia by age cohort in Australia (2016)
Q. Please indicate how concerned you are about the following ac�vi�es by elected poli�cians in Australia today
10
So what type of poli�cal project would Australians trust?
Our findings draw a1en$on to two important dilemmas for Australia’s poli$cal class. Firstly, that ci$zens view
poli$cians and democra$c poli$cs as one and the same – an$-poli$cs equals an$-party poli$cs. In a tradi$onal
culture of deference, the confla$on of poli$cs, democracy and poli$cians was viewed as an equa$on for social
and poli$cal stability but in $mes of rapid social change it may well become a source of ungovernability. It
should also be of significant concern that this pa1ern of discontent has emerged in a period of rela$ve affluence
unlike in the United States and the United Kingdom. Secondly, we can iden$fy a culture of an$-poli$cs at the
heart of the Australian poli$cal system. Paradoxically, the evidence also demonstrates that poli$cians and poli$-
cal par$es need to be the solu$on to these two dilemmas.
The evidence presented here shows that a new poli$cal project based on different forms of trust building is like-
ly to a1ract significant support. Hence reforms that (1) made decision-making more transparent and poli$cians
more accountable for their ac$ons; (2) where poli$cians became the key agents of change in a moral agenda
aimed at cleaning-up the Canberra village; (3) all party commitment to moving away from adversarial poli$cs
and towards a collabora$ve governance approach; and (4) where all federal ins$tu$ons would have a legisla$ve
responsibility to connect-up Australian ci$zens with the Canberra-village in policy-making, regula$on and oper-
a$onal delivery. Fundamentally, however, there is the need for a na$onal democra$c audit in which to pose
three ques$ons to the Australian ci$zenry – how would you imagine your ideal democracy? What should we
expect from our poli$cians within it? And, how is the present system failing you?
These ques$ons will be further explored in the Museum of Australian Democracy’s exci$ng new exhibi$on in
Old Parliament House, The Power of Us, which will be launched in early 2017.
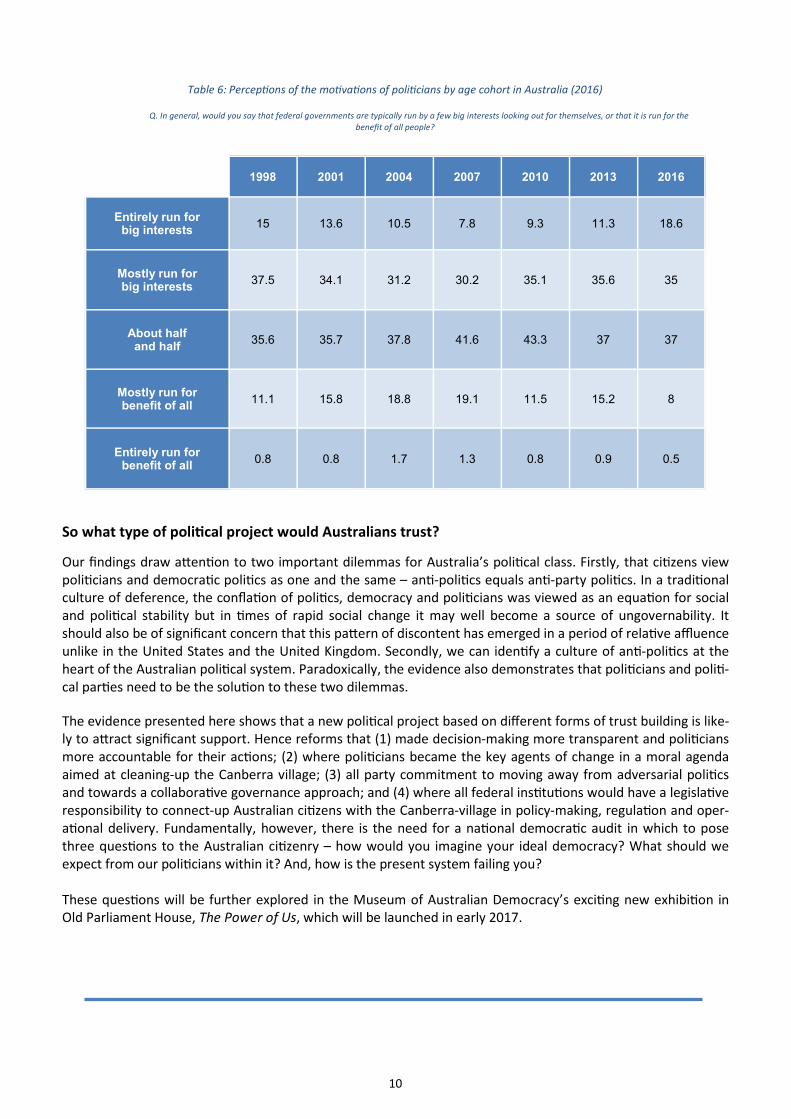
1998 2001 2004 2007 2010 2013 2016
Entirely run for big interests 15 13.6 10.5 7.8 9.3 11.3 18.6
Mostly run for big interests 37.5 34.1 31.2 30.2 35.1 35.6 35
About half and half 35.6 35.7 37.8 41.6 43.3 37 37
Mostly run for benefit of all 11.1 15.8 18.8 19.1 11.5 15.2 8
Entirely run for benefit of all 0.8 0.8 1.7 1.3 0.8 0.9 0.5
Table 6: Percep�ons of the mo�va�ons of poli�cians by age cohort in Australia (2016)
Q. In general, would you say that federal governments are typically run by a few big interests looking out for themselves, or that it is run for the
benefit of all people?
11
ReferencesReferencesReferencesReferences Evans, M., Stoker, G. & Nasir, J. (2013), How do Australians
imagine their democracy? Australian Survey of Poli�cal En-
gagement 2013. Canberra, IGPA. Available online at:
h1p://www.governanceins$tute.edu.au/magma/media/
upload/ckeditor/files/DEMOCRACY%20REPORT-%20final
(1).pdf
Evans, M., Stoker, G. & Halupka, M. (2015), Power, power-
lessness and Australian democracy, Museum of Australian
Democracy/IGPA. Available online at:
h1p://www.governanceins$tute.edu.au/magma/media/
upload/ckeditor/files/The%20Power%20of%20One%20Voice
-V%209-print%20version(1).pdf
Evans, M. and Stoker, G. (2016), ‘Poli$cal par$cipa$on in
Australia: Con$ngency in the behaviour and aMtudes of ci$-
zens’, Australian Journal of Poli�cal Science, DOI:
10.1080/10361146.2015.1123672
Stoker, G. and Evans, M. (2014), The “Democracy-Poli$cs
Paradox”: The Dynamics of Poli$cal Aliena$on. Democra�c
Theory, 1, 2, pp. 26-36.
12
About this survey The Museum of Australian Democracy (MoAD) along with the Ins$tute for Governance and Policy
Analysis (IGPA). commissioned the Ipsos Social Research Ins$tute (Ipsos) to conduct an online survey
exploring the community’s aMtudes towards democracy to inform the upcoming ‘Power of Us’ exhi-
bi$on. The survey aimed to understand the impact Australians’ lack of trust in the poli$cal system
and poli$cians has on aMtudes towards democracy.
Par$cipants for this survey were selected based on quotas corresponding to age, gender, loca$on,
Aboriginal and Torres Strait Islander status and immigra$on status. Par$cipants were aged 18 years
or older. Results were post weighted (n = 1444) age, gender, loca$on, Aboriginal and Torres Strait
Islander status and immigra$on status. Small varia$on in sample size can occur from rounding errors
as a result of the weigh$ng process. The survey was therefore representa$ve of the adult Australian
popula$on by age, gender, loca$on, Aboriginal and Torres Strait Islander status and immigra$on sta-
tus. Analysis of the survey results was undertaken by the Ins$tute for Governance and Policy Analysis
(IGPA)

13
For more informa$on:
Professor Mark Evans
P: (02) 6206 8622
W: h1p://www.governanceins$tute.edu.au/