Social contexts of fertility desire among non-childbearing ...

8
Lara Patrício Tavares Dondena Centre for Research on Social Dynamics Bocconi University
No. 2010-17May 2010
ISE
R W
orking Paper S
eriesw
ww
.iser.essex.ac.uk
Who delays childbearing? The relationships between fertility, education and personality traits
Instituto Superior de Ciências Sociais e Políticas Universidade Técnica de Lisboa

Non-Technical summary
In many developed countries fertility rates are now too low for the population toreplace itself from one generation to the next. In this context, fertility timingsare particularly relevant, especially the age at first birth. Childbearing age hasincreased all over Europe. In England and Wales, for example, the mean age at firstbirth jumped from 25.2 in 1980 to 30.2 in 2006. Delaying motherhood has threepotentially adverse effects on fertility. Firstly, it reduces the time-span for havingmore children; secondly, it may result in involuntary childlessness; and finally, itallows for downward revision of childbearing intentions.
Great part of the empirical literature sees education as one of the main drivingforces of childbearing postponement. The idea is that more educated women facehigher maternity costs than less educated women because they have to forgo higherwages or put on hold better careers when having a child. In this paper we usethe British Household Panel Survey (BHPS) to explore other possible determinants.We assess the role of personality traits in timing of childbearing and investigatewhether, and in what way, personality traits can explain the differences in maternitytiming between more and less educated women. The personality traits are measuredby the Big Five, collected for the first time in 2005. The Big Five personalitytraits correspond to the following five main personality dimensions: Extraversion(vs Introversion), Agreeableness (vs Antagonism), Conscientiousness (vs Lack ofDirection), Neuroticism (vs Emotional Stability) and Openness (vs Closedness toExperience). To the best of our knowledge there is no other study examining therelationship between the Big Five personality traits and timing of motherhood.
Given that nowadays women’s fertility reflects, to a greater extent, their basic pref-erences and that personality traits are intimately related to individual’s preferences,we expect to find an association between personality traits and fertility. Indeed,we find that whereas high levels of Agreeableness, Extroversion and Neuroticismaccelerate childbirth, high levels of Conscientiousness and Openness are associatedwith childbirth postponement.
The nature of the relationship between education and postponement of fertility is farless clear. We explore two possible ways through which personality traits might helpexplain the fertility timing gap between more and less educated women: one is thatsome of the personality traits that drive some women to study more also influencetheir fertility behaviour; the other one is that individual differences in personalitytraits translate into variation in time to first birth especially among more educatedwomen. Our results support both hypotheses i.e. on the one hand, personality traitsinfluence both education and fertility decisions; on the other hand, more educatedwomen do not equally delay childbirth compared with less educated women: themore “open-minded” ones postpone childbearing for longer.

Who delays childbearing? The relationships between fertility,
education and personality traits∗
Lara Patrıcio Tavares†
Dondena Centre for Research on Social Dynamics,
Bocconi University
Instituto Superior de Ciencias Sociais e Polıticas,
Universidade Tecnica de Lisboa
Using data from the British Household Panel Survey, this paper assesses the influence of person-ality traits on the timing of motherhood and investigates whether, and in what way, personalitytraits can explain the differences in maternity timing between more and less educated women.We estimate a log-logistic model of the time to first child birth and show that there is a statisti-cally significant relationship between the Big Five personality traits and timing to motherhood.The results also show that within the more educated group, women who have an average tohigh score on Openness have lower hazards of childbirth.
Keywords: childbearing postponement, time to first childbirth, personality traits, Big Five
JEL classification: J13, I21, Z0
∗This paper is a revised part of my Ph.D dissertation at ISER, University of Essex. I would like to thankmy supervisors John Ermisch and Emilia Del Bono; Steve Pudney, Francesco Billari, Arnstein Aassve, FrancescaZantomio, Priscila Ferreira, Chiara Pronzato; the participants at the BHPS Conference (Colchester, 2007), theEALE conference (Oslo, 2007), the workshop on “Labour Markets and Demographic Change” (Rostock, 2008), theIZA Labour Economics Summer School (Buch am Ammersee, 2008), the seminar in Bocconi University (Milan,2008), the ESPE conference (London, 2008) and at the seminar at the Max-Planck Institute for DemographicResearch (Rostock, 2008), in particular to Joshua Goldstein for his thorough comments. The financial supportfrom the Fundacao para a Ciencia e Tecnologia (contract SFRH/BD/18356/2004) as well as the support from theInstituto Superior de Ciencias Sociais e Polıticas (Universidade Tecnica de Lisboa) are gratefully acknowledged.
†Postal address: Dondena Centre for Research on Social Dynamics, Bocconi University, via G. Roent-gen n. 1, 4th floor, Room A2-15, 20136 Milan, Italy; tel. +39.02.58365386; fax +39.02.58362798; email:[email protected]
INTRODUCTION
At the end of the 20th century, fertility decline and sub-replacement fertility have become
widespread and this development has been more persistent than in other periods in history
(Morgan and Taylor, 2006). In this context, fertility timings are particularly relevant, especially
the age at first birth. Delaying motherhood has three potentially adverse effects on fertility.
Firstly, it reduces the time-span for having more children, and therefore it may reduce completed
fertility (Kohler et al., 2002); secondly, it may also result in involuntary childlessness given that
after the age of thirty the probability of a successful pregnancy decreases, even more so after
the age of thirty-five (Leridon, 2004); finally, it allows for downward revision of childbearing
intentions due to competing interests (Morgan and Taylor, 2006). In fact, Kohler, Billari and
Ortega (2002) argue that the lowest-low fertility in Spain and Italy is highly associated with
childbearing postponement, and recent evidence suggests that the slowing down of childbearing
postponement in some countries is associated with a rise in total fertility rate (Sobotka, 2008).
Education has been seen as one of the main culprits of delayed motherhood. The trade-off
between working career and motherhood is on the basis of this positive association between edu-
cation and childbearing postponement. Since children demand a substantial time investment in
their childcare and upbringing, the transition to motherhood entails two important opportunity
costs, the current opportunity cost of the forgone wage during the period spent out of work,
and the expected future cost associated with the forgone human capital accumulation due to
the career interruption, which is bigger the steeper is the (concave) lifetime earnings profile and
the earlier the work interruption occurs (Cigno and Ermisch, 1989). And so, given that more
educated (or skilled) women are those expected to have steeper earning profiles, they are also
expected to postpone childbirth more.
Several studies provide empirical evidence of the maternity penalty. Amuedo-Dorantes and
Kimmel (2006) analyse the motherhood wage gap and find that college-educated women gain
in delaying first birth until the age of 30. Miller (2005) finds that motherhood delay leads to
a substantial increase in career earnings, and that the postponement premium is largest for
college-educated women. Ellwood et al. (2004) find that the costs of childbearing are vastly
1

higher for high skilled women, for whom the age-earnings profiles are steeper, and that having
children later may reduce their costs. Van Bavel (2009) finds that both the starting wage and
the steepness of the earnings profile are associated with postponement. Correll et al. (2007)
not only provide evidence of the maternity wage penalty but also of hiring discrimination.
Many studies on childbearing postponement have focused on childbearing costs, more specif-
ically on education for it is assumed to capture the higher opportunity costs of maternity. One
remark is in order here. In most cases we only observe women’s revealed preference i.e. the
result of the weighting between childbearing costs and benefits. To assume that education is a
mere proxy for childbearing costs is perhaps too simplistic; the level of education might also re-
flect the value of children. Moreover, looking at the effect of education on childbearing decisions
thinking of education in terms of a proxy for childbearing costs and not taking into account the
rewards of parenthood amounts to assume that women value children equally. This is clearly
a strong assumption. Different women faced with the same costs might take different decisions
because they value children differently or because they weight costs and rewards in a different
way - in fact, what matters for decision making are the perceived costs and rewards. In other
words, women’s traits and attitudes should be taken into account. However, only a few studies
do it (Miller, 1992; Kohler, 2005 and Von der Lippe, 2006).
The aim of this paper is twofold: the first aim is to assess the influence of personality in
timing of childbearing. The measure of personality used is the Big Five personality traits. To
the best of our knowledge there is no other study examining the relationship between the Big
Five and timing of motherhood. The second aim is to investigate whether, and in what way,
personality can explain the differences in maternity timing between more and less educated
women.
FERTILITY AND PERSONALITY TRAITS
The trend of childbearing postponement which started in the U.S among the cohorts of the
late 1930s, was then picked up by England and Wales and the Netherlands, and sooner or
later by other European countries as well (Frejka and Sardon, 2006). Whereas in the U.S. the
postponement process ceased, in Britain the age at first birth has been rising continuously since
2
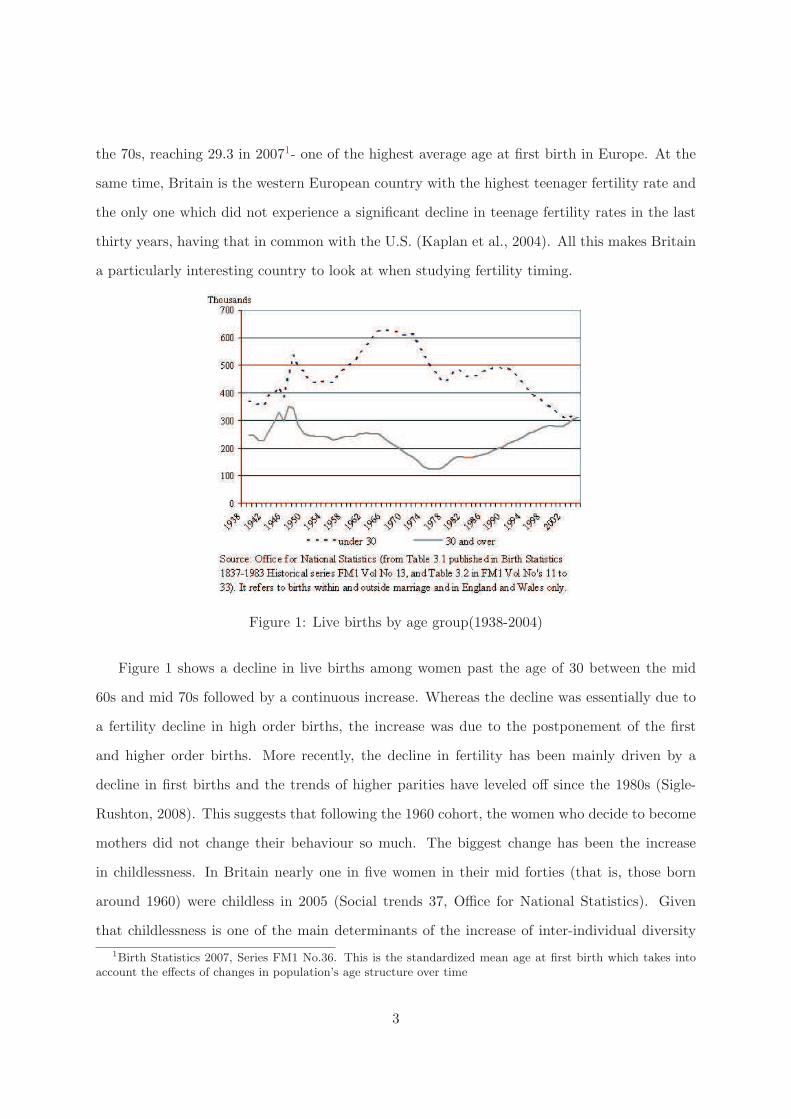
the 70s, reaching 29.3 in 20071- one of the highest average age at first birth in Europe. At the
same time, Britain is the western European country with the highest teenager fertility rate and
the only one which did not experience a significant decline in teenage fertility rates in the last
thirty years, having that in common with the U.S. (Kaplan et al., 2004). All this makes Britain
a particularly interesting country to look at when studying fertility timing.
Figure 1: Live births by age group(1938-2004)
Figure 1 shows a decline in live births among women past the age of 30 between the mid
60s and mid 70s followed by a continuous increase. Whereas the decline was essentially due to
a fertility decline in high order births, the increase was due to the postponement of the first
and higher order births. More recently, the decline in fertility has been mainly driven by a
decline in first births and the trends of higher parities have leveled off since the 1980s (Sigle-
Rushton, 2008). This suggests that following the 1960 cohort, the women who decide to become
mothers did not change their behaviour so much. The biggest change has been the increase
in childlessness. In Britain nearly one in five women in their mid forties (that is, those born
around 1960) were childless in 2005 (Social trends 37, Office for National Statistics). Given
that childlessness is one of the main determinants of the increase of inter-individual diversity
1Birth Statistics 2007, Series FM1 No.36. This is the standardized mean age at first birth which takes intoaccount the effects of changes in population’s age structure over time
3

in the number of children women have, the trends above suggest that the variability of number
of children in Britain must have increased as it happened in the U.S. In fact, Shkolnikov et al.
(2004) show that the proportions of women having half of children decreased from 0.30 (in the
1933-34 cohort) to 0.26 (in the 1958-59 cohort) in the U.S. and from 0.30 to 0.28 in England
and Wales (for the 1944-45 cohort and the 1955-56 cohort, respectively). These countries are
the ones where there is more variability in terms of the number of children women have.
These trends in fertility can be seen as part of the so-called Second Demographic Transition
(Lesthaeghe and van de Kaa, 1986; van de Kaa, 1987). According to Van de Kaa and Lesthaeghe
the declining fertility rates are associated with a transition to an individualistic family model,
characterized by self-development, individual autonomy and gender equality. In other words,
the change in values that resulted in a greater weight being given to individual preferences was
one of the major determinants of the Second Demographic Transition. The idea is that in a
new era in which women gained control over their fertility and in which social control weakened,
having children became a matter of choice. Only from then on could women decide, according
to their preferences and by assessing the benefits and costs of childbearing, whether or not to
have a(nother) child. Also in Hakim’s preference theory (Hakim, 2003) women’s preferences are
seen as the main determinant of women’s choices. This, as the author points out, allows one to
acknowledge the heterogeneity in lifestyle preferences and choices.
According to the psychology literature, behaviour or attitudes are manifestations of a combi-
nation between basic traits and external influences such as cultural norms, for example (McCrae
and Costa, 1999). Whereas basic traits are fundamentally stable, behaviours and attitudes can
change.
Interpreting basic traits as preferences, the theories above suggest that personality traits
must have gained explanatory power in terms of fertility behaviour. Using Danish twin data
to study the intergenerational transmission of fertility Kohler et al. (1999, 2002) document
moderate effects of shared family environment and low genetic effects, except for the cohorts
experiencing the demographic transitions. They interpret their findings as suggesting that the
weakening of social norms regarding childbearing over time gave room for genetically mediated
differences (e.g. in personality) to be expressed as observed fertility outcomes. Given that
4

nowadays women’s fertility reflect, to a greater extent, their intrinsic preferences and that per-
sonality traits are intimately related to individual’s preferences, we expect to find an association
between personality traits and fertility.
EDUCATION, CHILDBIRTH POSTPONEMENT AND PERSONALITY TRAITS
Another interesting question is whether personality traits also help explaining the maternity
timing gap between more and less educated women. That being the case, how? The association
between education and postponement of fertility is indisputable: more educated women delay
motherhood compared with less educated women. Most studies do find evidence of a positive
relationship between education and age at first birth (Wilkie, 1981; Rindfuss et al., 1996,
Ermisch and Ogawa, 1994; Bloemen and Kalwij, 2001; Nicoletti and Tanturri, 2005 and Klasen
and Launov, 2006). However, the nature of this relationship is far less clear.
The difficulty in studying the relationship between education and fertility is that it might
be spurious, as the paper by Billari and Phillipov (2001) so well argues. Cognitive ability, for
example, which is known to be associated with education might also be related to timing of
childbearing (Retherford and Swell, 1989; Shearer et al., 2002). Another example is career-
orientation: if more career-oriented women strive to obtain more education, and if that char-
acteristic also leads them to delay childbearing, then education would be endogenous (Bratti,
2006). In fact, the thorough review of the empirical psychological literature on women’s career
development by Phillips and Imhoff (1997) conveys precisely the idea that women’s decisions
about career and family are highly intertwined and that they are shaped quite early in women’s
lives.
Some studies try to get around the endogeneity problem. McCrary and Royer (2005) use
the differences in the age at which a child enrols in school as identification strategy. Their
results suggest that increases in female education lead to small and statistically insignificant
changes in fertility choices, and therefore indicate a limited causal role for education in women’s
fertility planning. Fort (2006) relies on an educational reform for identification - a nationwide
reform that took place in Italy in the early 1960s that increased compulsory schooling from
5 to 8 years. She finds that education causes childbearing postponement only for women for
5

whom the reform is binding, and therefore would have had their first child at young ages. Since
these results suffer from low external validity they do not provide an overall explanation for the
observed relationship between educational qualifications and childbearing postponement. The
results of Rodgers et al. (2008), who use a behaviour genetic model, suggest that differences in
education (and cognitive ability) amongst sisters in the same family are not causally related to
differences in age at first birth. Taken together the available evidence suggests that selection is
one important mechanism behind the association between education and fertility.
However, there might be other explanations as well. In fact, some authors suggest that high
educated women are not particularly career-oriented (Wilkie, 1981; Mott and Shapiro, 1983;
Sobotka and Testa, 2006), and others show that more educated women are as keen to have
children as lower educated women, and maybe even more so (Weston et al., 2004; Heiland et
al., 2005; Yu, 2006).2 This might be particularly true for the younger generations for whom
completing secondary school is rather common. In other words, the extension of the educational
system weakened selection into education.
More educated women are usually considered as a homogeneous group, sharing the same
career prospects and childbearing costs. However, there is no reason to assume homogeneity
among more educated women in what concerns their attitude towards children. It is not reason-
able to assume that highly educated women value children equally. Two papers point out that
the field of education is as important as the level of education in explaining fertility behaviour,
or even more. Martın-Garcıa and Baizan (2006) show that differences in the education field
are associated with important fertility differences among women with the same education level.
Hoem et al. (2006), who study the relationship between education field and childlessness, find
that women with qualifications in teaching and health care have a much lower permanent child-
lessness, at each educational level, than women in any other major grouping and that women
educated in arts and humanities have unusually high fractions of permanent childlessness. This
illustrates the point that there might be substantial heterogeneity among more educated women
in what childbearing behaviour is concerned.
2The data used in this paper also show a positive correlation between education and the expectation abouthaving children in the future among childless women - see section ‘Data’.
6

In fact, there is evidence of higher inter-individual variation in births among more educated
women (Shkolnikov et al., 2004). But is there evidence on heterogeneity in terms of timing of
motherhood? Sullivan (2005) found that it was heterogeneity across racial groups that better
explained the bimodal pattern of hazard of first births observed in the U.S. in the beginning
of the 1990s, but as far as education is concerned there is no evidence. However, there are
good reasons to expect more educated women to be more heterogeneous in terms of timing
of motherhood. The argument is as follows: being childlessness one of the factors behind the
increase in the average inter-individual variation in births (Kohler et al., 1999 and Shkolnikov
et al., 2004), and strongly related to severe childbearing postponing, it is plausible that highly
educated women have a more disperse distribution of age at first birth. Indeed, our data
confirms it (see following section).
Kohler and Rogers (2003) show that the overlapping sources of genetic influences on edu-
cation and fertility are relatively small. As such, it could be that the personality traits that
play a role in selection into education have no bearing in fertility decisions, in which case we
would expect more and less educated women to be similar in terms of the personality traits
that matter in terms of fertility preferences. That being the case, personality traits (alone)
would not contribute to explain the fertility timing gap between more and less educated women.
However, if differences in personality manifest themselves more in the fertility behaviour of
more educated women - perhaps because they are less subject to the social pressure of having
children - that is to say, if there is a mismatch between the preferences and behaviour of less
educated women in that for these women delaying is not so socially acceptable and therefore
they do not it as much regardless of their intrinsic preferences, then personality would play a
part in the explanation for the timing gap between the two educational groups. This would be
consistent with more heterogeneity in terms of fertility timing among more educated women.
So, another possible explanation for the fertility timing gap between more and less educated
women is that the average age at motherhood among more educated women is being pushed
up by a particular type of more educated women who are severely postponing childbirth -
as opposed to resulting from more educated women behaving more or less alike, all delaying
childbearing compared with less educated women.
7
Summing up, a priori there are two possible ways through which personality traits might help
explain the fertility timing gap between more and less educated women: one is that women self-
select into education according to personality traits that also influence their fertility behaviour
(the selection story); the other one is that heterogeneity in personality traits translates into
variation in time to first birth especially among more educated women, in which case personality
traits should matter more for highly educated women.
DATA
This analysis makes use of the first 15 waves of the British Household Panel Survey (BHPS).
The BHPS is conducted annually since 1991 on a nationally representative sample of more than
5000 households. Given that BHPS is household-based, each year every adult (16 years old or
more) within the household is interviewed.
A consolidated marital, cohabitation and fertility file containing the retrospective lifetime
histories and subsequent panel data related to respondents’ partnerships and childbearing pro-
vides the fertility history of the BHPS respondents (Pronzato, 2007). In this file there are
16,015 women with complete information on their fertility histories. From these 16,015 women,
439 were dropped because of missing information on their educational qualifications. Therefore,
there are 15,576 women for whom there is both complete information on their fertility histo-
ries and (some) information on their educational attainment - i.e. education qualifications are
available in at least one wave.
In 2005, the BHPS asked for the first time questions on personality traits. Given that these
variables are essential for the analysis, only the women who “survived” as BHPS respondents
up until the last wave, and for whom these variables are not missing, are included in the sample.
Finally, only women aged between 18 and 75 by the time of the last interview were included in
the sample. The women younger than 18 were excluded to ensure that all women in the sample
could have obtained the high school certificate, and the women older than 75 were excluded to
minimize potential recall errors. So, the final sample consists of 6,596 women.
The majority of the women in the sample (71%) had a child (Table 5 in the appendix).
Among the mothers, the mean age at first birth is 24.6 years old . As expected more educated
8

women (those with high school certificate or higher educational qualifications) have their first
child later - there is a 2 years gap between the two educational groups (Table 6 in the appendix).
The distribution of age at motherhood for the less educated women (who did have a child) is
quite concentrated at young ages, whereas the distribution for the more educated women seems
to be more dispersed (Figure 2).
Figure 2: Age at motherhood by educational group
In fact, the standard deviation of age at motherhood is bigger for the more educated group
(5.02 vs 4.68) and the Levene’s robust test statistic for the equality of variances between the
two groups rejected the null hypothesis that the variances are equal against the hypothesis that
the standard deviation is bigger for the more educated group.3 The data show very clearly that
childlessness is particularly prevalent in the more educated group. Whereas the mothers are
evenly split between the two educational qualifications groups, among the childless women more
than 70% have at least an high school certificate (Table 5 in the appendix). However, when
childless woman are asked if they think they will have children, the percentage saying ‘yes’ is
higher among the more educated women (Table 6 in the appendix).4
3We used this test statistic instead of the traditional F-test because this variable is not normally distributedand Levene’s test statistic is robust under nonnormality.
4This could just be due to the fact that the childless women who are more educated are also younger - onaverage. However, the results of a multinomial logit of the expectations about future childbearing on education
9

Education is a dummy variable that assumes value 1 if the highest level of education qualifi-
cations ever obtained is high school certificate or higher qualifications, and 0 otherwise.5 Ideally,
we would use the education level before childbirth, as this event might truncate women’s educa-
tional attainment. As is this is unobservable we have to assume that the observed educational
qualifications were obtained before childbirth. This is not an unreasonable assumption as for
most women childbearing does follow the end of formal education (Kiernan, 1980; Blossfeld
and Huinink, 1991) and the highest educational qualifications considered are not just higher
education qualifications but also high-school graduation.
The Big Five: a measure of personality traits
The measures of basic traits used here are the Big Five personality traits as defined by the
Five-factor model developed in Personality Psychology. This is a hierarchical model in which
five main domains of personality are extracted from a larger set of more specific personal-
ity characteristics.6 According to this classification the five main personality dimensions are:
Extraversion (Vs introversion), Agreeableness (Vs antagonism), Conscientiousness (Vs lack of
direction), Neuroticism (Vs emotional stability) and Openness (Vs closedness to experience).
Extraversion is mainly characterized by sociability. Extroverts tend to be sociable, talkative
and assertive as opposed to reserved and quiet. Agreeableness relates to the willingness to
help others, to be caring, gentle, co-operative, kind and affectionate; it contrasts a prosocial
orientation toward others with antagonism. Someone who scores high on Conscientiousness
tends to follow the rules, to be reliable, well-organized, self-disciplined; the low scorers tend
to be undependable, disorganized, lazy and negligent. Neuroticism summarizes traits related
to emotional stability. High scorers in Neuroticism tend to be anxious, depressed, insecure.
Openness to experience - also called autonomy - relates to unconventionality and intellect.
Someone who scores high on Openness tends to question the conventions, to be imaginative,
creative, curious about the world, complex and broad-minded.
qualifications and age still show this positive association between education and the expectation of having a child.5What here is called high school certificate is in fact the A-levels, which are exams taken at the end of
secondary school when students are 16-18 years old (after compulsory school). These exams are a screeningdevice for entrance in university as well as important signals for the labour market.
6The Big five are empirical concepts, that is, they are not a theory of personality (Srivastava, 2006).
10

The purpose of the Five-factor model is to provide a personality taxonomy that can be used
to describe major personality differences within the population - it is not meant to give a detailed
description of an individual’s personality. Even though it is not universally accepted, the five-
factor model is the one gathering more consensus as a general taxonomy for the personality
structure (John and Srivastava, 1999).
According to the Five Factor Theory, the five factors of personality capture basic tendencies
which are regarded as biologically based dispositions and capabilities, and that is the view
taken here. In fact, it has been shown that the genetic contribution to individual differences in
personality is quite substantial (Jang et al., 1998; Plomin and Caspi, 1999; Loehlin, 2005).7
The genetic influence on personality is one of the main mechanisms of continuity over the
life course. Continuity has been measured in several different ways in psychology and each one
corresponds to a different definition. Even though there are a few studies that look at continuity
at an individual level, most studies use measures that look at continuity at a group level. When
looking at continuity throughout adulthood, the empirical evidence is that personality is quite
stable. That is not to say that personality stops changing in adulthood but that the changes
that occur are small in magnitude (Caspi and Roberts, 2001; Srivastava et al. 2003). Using
genetics jargon, one could say that whereas the personality traits genotype is “fixed”, there
is some room for the phenotype to change in response to the environment. This is one of
the main mechanisms thought to produce changes in personality (Alea et al., 2004). However,
individuals tend to respond to the environment in a way that it is consistent with their existing
personality and so, the person-environment interactions can be, at the same time, a powerful
mechanism in promoting continuity (Caspi and Roberts, 2001). In other words, the changes
that do occur reinforce personality consistency - Roberts and DelVecchio (2000) show that traits
become increasingly consistent with age.
One can think that the Big Five capture personality in the same way Spearman’s g is used
7Although it is consensual in behavioural genetics that about half of the variance in personality is shapedby genes, the more reliable measurement of traits from multiple perspectives (peer, spouse, or observer ratingsin addition to self-report questionnaires) yields heritability estimates for personality that are even higher thanthis: Riemann et al., 1998 estimated heritabilities of .66 to .79 for the composite of questionnaire and ratings(Loehlin, 2005). Note: heritability is a statistic that describes the effect size of genetic influence and refers tothe proportion of observed (phenotypic) variance that can be explained by genetic variance (Plomin and Caspi,1999); it is not to be confounded with parents-offspring correlation (Loehlin, 2005)
11

to measure general intelligence. The difference is that in the case of personality there is not
one factor only but five. In fact, the Five-factor model has its origins in the work of Cattell
who was a protege of Spearman - in 1933 Cattell published an analysis of non-intellectual traits
that maybe regarded as the first glimpse of the Big five (Digman, 1996). Both the Big Five and
Spearman’s g are measures resulting from the use of factor analysis - a statistical method for
data reduction pioneered by Spearman.
Just as many intelligence tests are designed to measure the Spearman’s g, many of widely
used personality questionnaires are designed to measure the Big Five traits. The more commonly
used Big-Five instruments are: Goldberg’s 100-item Trait Descriptive Adjectives (TDA), Costa
and McCrae’s NEO Personality Inventory (the 240-item NEO PI-R and the 60-item NEO-FFI)
and John, Donahue and Kentle’s 44-item Big Five Inventory (BFI).
Whereas TDA follows a lexical approach and is a list of 100 single adjectives, the other two
follow a questionnaire approach and use questionnaire scales - the NEO’s items are full sentences
and the BFI’s items are short phrases. Each of these instruments has been thoroughly tested
and their validity is well established (John and Srivastava, 1999).
The choice of the instrument is dictated either by the research question (whether one is
interested in broadly defined personality traits or in specific traits) or by the research setting,
that is, by the time that the survey can spare for the personality questionnaire. In surveys
where the participants’ time is at premium, a short instrument like the BFI that takes five
minutes to complete is an efficient solution (John and Srivastava, 1999).
There is a trade-off between having a measure of personality dimensions in surveys - like the
longitudinal studies - and its quality. To have a 44-item in a longitudinal study would make the
questionnaire as a whole too burdensome. But despite the superiority of long instruments over
the short ones, in terms of psychometric properties, the costs associated with short instruments
are not that high (Gosling et al., 2003).8
8In fact, those authors developed even shorter measures (5 and 10-item inventories) and showed that theyreach adequate levels in each the criteria against which they were evaluated, therefore being reasonable proxiesfor longer Big-Five instruments.
12

The Big Five in the BHPS
Due to time constraints a short version of the well-established 44-item BFI was used in the
BHPS, the BFI-S.9 Gerlitz and Schupp (2005) show that the BFI-S displays strong internal
coherence; that to a large extent it is able to replicate the results of the 25-item BFI; and that
the reliability test produced a satisfactory result. The BFI-S is composed of fifteen questions,
three on each of the five personality domains - see table 1. Each question rates on a 7-point
scale ranging from 1 (‘Does not apply to me at all’) to 7 (‘Applies to me perfectly’).
Even though in the BHPS the internal consistency of personality trait scales obtained from
the BFI-S questions - as measured by the values of the Cronbach’s alpha10 - is not impressive,
this should not be of great concern because it results from the small number of items used to
assess each trait.11 In fact some researchers argue that alphas are misleading when calculated
on scales with a small number of items (Gosling, 2004). Short instruments like the BFI-S are
meant to optimize validity and not reliability.
The personality trait scales to which Table 1 refers to were constructed using all the people
in BHPS’s wave 15 (men and women) who replied to the personality traits questions. Each
personality scale was constructed only the observations for which none of the three answers
relating to that personality trait is missing. The scales were then standardized for the sample
used in the estimations to have mean zero and standard deviation one. These standardized
personality traits were the ones used in the analysis.
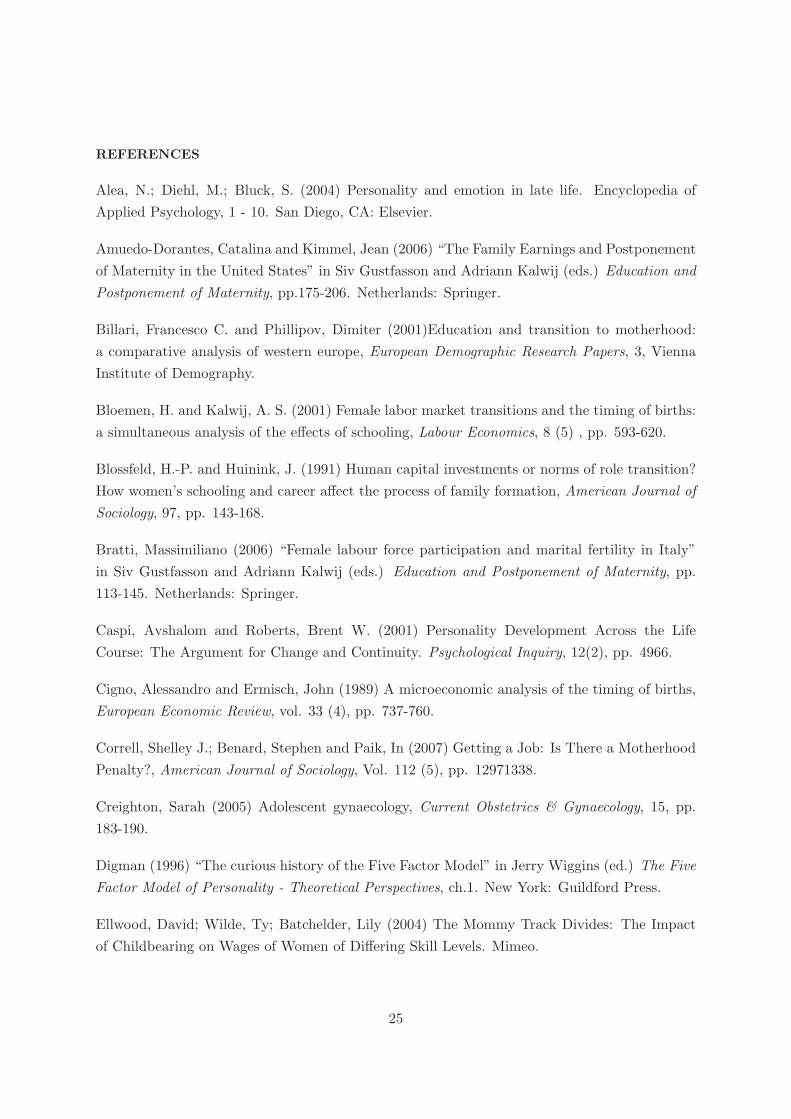
The distribution of Conscientiousness for the more educated group is more left-skewed than
the distribution for the less educated group, reflecting the well-known association between that
trait and educational attainment. As for the Openness trait the distributions are similar for
the two groups, but the one of the more educated group is shifted to the right. The distribu-
tions of the other three personality traits, by educational groups, are even more similar thus
9The BFI-S was designed by GSOEP Researchers. The GSOEP introduced a measure of personality traits in2005 based on a pretest. “A pretest was conducted in 2004 on a number of different short item scales to test theBig Five approach, with the goal of developing a useful and widely applicable short item scale (BFI-S) for the2005 SOEP survey. The short inventory of questions developed in the present study, BFI-S, contains 15 itemsand can be completed within two minutes.” Gerlitz and Schupp (2005).
10The Cronbach’s alpha measures how well a set of variables measures a single unidimensional latent construct.11The Cronbach’s alpha is a function of the number of items used (as well as of the average inter-correlation
among the items); the higher the number of items, the higher is the Cronbach’s alpha.
13

Table 1: The Big Five personality traits in the BHPS
Personality Traits Questions in BHPS Alpha AICIs talkative 0.5384 0.2777
Extraversion Is outgoing, sociableIs reservedIs sometimes rude to others 0.5275 0.2750
Agreeableness Has a forgiving natureIs considerate and kind to almost everyoneDoes a thorough job 0.5138 0.2789
Conscientiousness Tends to be lazyDoes things efficientlyWorries a lot 0.676 0.4077
Neuroticism Gets nervously easilyIs relaxed, handles stress wellIs original, comes up with new ideas 0.6731 0.4110
Openness Values artistic, aesthetic experiencesHas an active imaginationAlpha: Cronbach’s Alpha; AIC: Average interitem correlation
corroborating the hypothesis that the two groups of women are not very different, trait-wise
(the distributions of personality traits by educational group can be found in the appendix)
Ideally, the personality traits should be measured before the event of interest, childbirth.
Unfortunately, that is not the case here. As mentioned before, the personality traits were
assessed in the last wave used in the analysis. Even though personality traits are fundamentally
stable, this might create biases and a reverse causality problem. Cross-section studies suggest
that the modest changes in personality throughout adulthood are as follows: Extroversion,
Neuroticism and Openness decrease, and Agreeableness and Conscientiousness increase (McCrae
and Costa, 1999) - which is very intuitive. So, as an attempt to overcome the potential biases
and reverse causality problem, we are going to focus mainly on Openness when looking at the
results because this trait decreases with age. Given the positive correlation between Openness
and time to first childbirth, and that the observed variance of Openness is expected to be bigger
than the one we would have were women’s personality traits to be measured before childbirth,
we expect our estimated coefficients to be downward biased. We expect the observed variance
of Openness to be bigger than the one we would have were women’s personality traits to be
measured before childbirth (and therefore younger) because with age some women become less
14

‘open-minded’. In fact, Figure 3 shows that the distribution of Openness for the oldest cohort
is more disperse than the others precisely because of the higher concentration of observations at
the bottom of the distribution.12 By focusing on Openness, we also avoid the reverse causality
problem as there is no reason to expect childbirth to affect the mother’s Openness - but again,
if it does, one would expect the effect to be negative i.e. the woman would become less “open-
minded” after having had the child.
Figure 3: Distribution of ‘Openness’ by cohorts
STATISTICAL MODEL
Since our aim is to explain time to first birth, we will use a duration model. This kind of model,
unlike the linear or logistic models, takes into account not only whether the event (childbirth)
occurred or not but also when it occurred by having time as the dependent variable. Thus, it
is necessary to establish when the clock starts ticking. The most natural “time origin” is the
moment when individuals became at risk of experiencing the event. In the case of childbirth, the
onset of risk is the age at menarche. As the BHPS does not have information on the women’s
12Tests on the equality of variances between cohorts confirm that the variance of Openness decreases from theoldest cohort to the youngest, and that the differences are statistically significant.
15

menarcheal age, we will set it to 13 years old.13 The duration time ends with whichever event
happens first: the first child is born, the end of the study (those are the right-censored cases)
or the 50th birthday, by assumption the age at menopause.14
The survival times used here come the fertility history of the BHPS respondents, and is mea-
sured in months. The survival times can be treated as observations on a continuous or discrete
random variable according to the underlying behavioral process that generates them. Another
aspect to take into consideration when deciding the nature of the variable - whether continuous
or discrete - is the process by which the data were recorded, as one can have observations on
an intrinsically continuous random variable that are recorded in a grouped form. In this case,
it is appropriate to use a continuous specification provided that the ratio of the length of the
intervals used for grouping to the typical spell length is small (Jenkins, 2005). Given the nature
of the process at stake - getting pregnant and giving birth - the smallness of the ratio between
the length of the intervals used for grouping and the typical spell length (1/161), and also the
low value of the incidence rate (0.0041743), we chose a continuous specification.15
We use a Log-logistic regression model which, in its linearized form, can be written as
ln(T ) = β′X + ǫ (1)
Where T is the survival time and ǫ follows a logistic distribution.16 In this model the hazard
function can be non-monotonic and therefore can accommodate the hazard suggested by the
literature and by the shape of the Kaplan-Meier estimate of the empirical hazard (see Figure
10 in the appendix). The model specification was based on several tests and the choice of the
13According to Creighton (2005) the onset of puberty in girls occurs between the ages of 8 and 13.5 years, andThomas et al. (2001) propose 13.3 years old as the mean age at menarche in Britain.
14Based on data on age at menopause obtained for 26 countries (there is no data specifically for Britain),Thomas et al. (2001) calculated the mean age of menopause to be 49.24 years (SD 1.73).
15When working with grouped data - when an event is known to occur in an interval (j-1, j) instead of beingknown to occur in a particular point in time - researchers usually set the duration equal to j and treat this asthe exact duration. By doing so, the likelihood contribution of the observation becomes the probability densityof experiencing a transition at duration j, and the likelihood based on this probability density yields inconsistentestimates of the parameters of the hazard rate. This is the so-called time-aggregation bias. So, what is crucialto know is whether the bias is negligible or not. Petersen (1991) shows that if the incident rate is smaller that0.1, the relative bias - the asymptotic value towards which the bias converges - is small, i.e., less than 5%
16The distribution of ǫ follows from the assumption that the survival time follows a Log-logistic distribution
16

log-logistic, in particular, was determined by the AIC.17
In the full-model the vector of covariates, X, includes the highest educational qualifications
attained, the standardized personality traits, dummies for the women’s birth cohorts and fam-
ily background variables such as parental education, number of siblings, a dummy indicating
whether the women lived with both parents up to the age of 16 and the area in which she lived
during childhood (inner city, suburbs or rural area).18
In order to investigate whether personality traits matter more for the more educated women
than for the less educated- one of the aims of this paper - we have to compare the estimated
coefficients for the personality traits of the two groups i.e. we have to estimate equation (1) for
the two groups separately.
RESULTS
Table 2 reports the maximum likelihood estimates of our model of time to first child birth. The
first column shows the estimated coefficients of the personality traits when no other covariates
are included. All the personality traits are statistically significant (at the 5% level). Whereas in-
creases in Agreeableness, Extroversion and Neuroticism accelerate childbirth (failure), increases
in Conscientiousness and Openness lengthen time to motherhood.
When education is added to the list of covariates (mod.2) all the estimated personality
traits coefficients remain significant at the 5% level with the exception of Conscientiousness.
This was expected given that this personality trait is known to be the most important in terms
of educational success. In terms of the changes in the coefficients’ sizes, Openness shows the
biggest proportional change. The decrease in the Openness coefficient reveals the also known
positive relationship between this personality trait and educational qualifications. And, as we
know from the literature, education is associated with delaying childbirth. Every thing else
17Starting with the generalized gamma model (the most flexible one) we tested for the appropriateness ofthe exponential, weibull and log-normal models. Of these, only the log-normal was not rejected. Then, thecomparison of the AIC of the log-normal with the AIC of the log-logistic showed that the latter was lower, whichmakes the log-logistic the preferred model. The choice of a parametric model over a non-parametric one was dueto the fact that the shape of hazard of having a first child is known. In this case, the use of a parametric modelis justified on efficiency grounds.
18To test for a potential omitted variables problem we also run the model allowing for unobserved heterogeneity(frailty) and the estimated coefficients are very similar.
17

equal, the estimated survival time for more educated women (high school certificate or higher
qualifications) is 1.32 times bigger than the one for less educated women.19
Table 2: Estimates (whole sample)
(1) (2) (3)agreeableness -0.063*** -0.047*** -0.048***
(0.009) (0.009) (0.009)
conscientiousness 0.019* 0.015 0.020*(0.009) (0.009) (0.009)
extroversion -0.023** -0.028*** -0.043***(0.008) (0.008) (0.009)
neuroticism -0.029*** -0.025** -0.020*(0.008) (0.008) (0.008)
openness 0.103*** 0.068*** 0.056***(0.008) (0.008) (0.009)
highest qualifications 0.276*** 0.197***(0.016) (0.017)
intact family 0.107***(0.021)
sibs -0.022***(0.004)
mother’s education 0.085***(0.010)
suburban area ref
inner city area -0.107***(0.030)
village, town, etc -0.090***(0.020)
born before 1960 ref
cohort 1960-1970 0.011(0.019)
cohort 1971-1990 -0.008(0.022)
constant 4.953*** 5.112*** 4.798***(0.012) (0.008) (0.037)
ln gammaconstant -1.075*** -1.047*** -1.116***
(0.012) (0.012) (0.013)Observations 6596 6596 5678***, ** and * indicate significance at 0.1%, 1% and 5% level.Standard errors in parenthesis
However, not everything is equal i.e. family background is an important determinant of
educational attainment. So, not surprisingly, when all family background variables and cohort
dummies are added (mod.3), the “effect” of education qualifications on timing of motherhood
weakens. The personality traits’ coefficients also change but not nearly as much. Interestingly,
the estimated coefficients of Agreeableness, Conscientiousness and Extroversion become bigger.
For the full model (mod.3), the estimated median survival time is 166.94 months, which means
19This is the so-called time ratio, i.e. exp(0.276).
18

that the estimated median age at first birth is 26 years and 11 months. 20
By specifying the distribution of survival time we are implicitly specifying the hazard func-
tion. Therefore, we can estimate the hazard function and obtain an approximation to the
probability of having survived exactly t months conditional on having survived until then.
Figure 4 shows the estimated hazards calculated using different values for some of the
covariates (educational group and Openness trait), while all the other covariates are set at
their mean.
Figure 4: Estimated hazard functions by educational group and level of Openness
Besides showing that more educated women delay childbirth compared with less educated
women, this figure shows interesting differences in the childbearing hazard by level of Openness
within each educational group. It also shows that less educated women who score high on
Openness have a lower childbirth hazard than more educated women who score low on that
trait, even though this result might be partly driven by the assumption that the coefficients are
the same for the two groups (which might exacerbate the effect of the personality trait for the
less educated women and dwarf the effect for the more educated).
20Given that the event is not certain to occur (a woman may remain forever childless) the survival time T canbe undefined. For this reason we can not calculate the mean age at childbirth. However, we can calculate themedian age at childbirth provided we define it as age at which half of the population has had a child (Rodriguez,2008).
19

Estimates from separate regressions
By running the regression on a sample of less and more educated women together one is imposing
that the coefficients and the baseline hazards are equal across groups. However, a test on the
whether the baseline hazard is the same for the two groups rejected that hypothesis. So, we
will now look at the results from the separate regressions.
Table 3 shows the results of the full model estimated separately for less and more educated
women. The first interesting thing to notice is that the coefficients of Conscientiousness and
Neuroticism are significant in the less educated group but not in the more educated group.
Then, more importantly, the effects of the personality traits that are significant in both groups
are bigger, in absolute terms, in the more educated group.
Table 3: Estimates from separate regressions
less educated more educated
(1) (2) (1) (2)agreeableness -0.043*** -0.052*** -0.054*** -0.048***
(0.012) (0.013) (0.012) (0.012)
conscientiousness 0.041*** 0.041** -0.014 -0.005(0.012) (0.013) (0.012) (0.013)
extroversion -0.025* -0.030* -0.030** -0.053***(0.012) (0.012) (0.011) (0.012)
neuroticism -0.047*** -0.035** -0.007 -0.007(0.011) (0.012) (0.011) (0.011)
openness 0.041*** 0.038** 0.093*** 0.076***(0.012) (0.013) (0.012) (0.012)
intact family 0.123*** 0.072**(0.032) (0.028)
sibs -0.021*** -0.027***(0.005) (0.006)
mother’s education 0.086*** 0.081***(0.018) (0.011)
suburban area ref ref
inner city area -0.076 -0.116**(0.043) (0.043)
village, town, etc -0.028 -0.131***(0.032) (0.024)
born before 1960 ref ref
cohort 1960-1970 -0.022 0.056*(0.030) (0.024)
cohort 1971-1990 -0.161*** 0.088**(0.036) (0.027)
constant 4.950*** 4.759*** 5.225*** 5.032***(0.012) (0.062) (0.010) (0.048)
ln gamma -1.046*** -1.097*** -1.108*** -1.143***constant (0.017) (0.019) (0.017) (0.018)
Observations 2827 2408 3769 3270***, ** and * indicate significance at 0.1%, 1% and 5% level.Standard errors in parenthesis
20

In order to test the hypothesis that personality traits matter more for the highly educated
women, we calculated a measure of explained variation for use with censored survival data
for each of the groups - we will call it R-squared.21 This measure is intended for use with
proportional hazard models. In non-proportional hazard models, as the one used here, this
measure is not interpretable as a measure of explained variation. However, it can be used as an
indication (see Royston, 2006 for details), and here it is used just for comparison purposes. 22
As it can be seen in table 4, personality traits alone explain more variation in the timing of
first child for the more educated women than for less educated women: the R’s-squared are 2.0%
and 1.3% respectively.23 These results give support to the hypothesis that personality traits
matter more for more educated women than for less educated women (in terms of childbearing
timing).
Table 4: R-squared of the different models by educational group
set of covariates less educated more educatedpersonallity traits only 0.0129 0.0201family background only 0.0197 0.0433personallity traits and family background 0.0326 0.0594
These figures may come across as quite small and one could be tempted to say that, in
the end, personality traits are unimportant in explaining timing of motherhood. Two remarks
are in order here. First, even though the R-squared gives us some idea about the explained
variation in the models, it cannot be interpreted as a proper explained variation measure; and
then, the R-squared of the model with personality traits only is not much smaller than the one
with just the traditional background variables (4.3% and 2.0%, for the more and less educated
groups respectively) - and yet, the literature unanimously recognize family background as an
important factor in explaining fertility timing. It would very interesting to contrast the R-
21This explained variation statistic, developed by Royston (2006), is calculated as R2 = Vπ2/6+V
, where V =
ρ2k
1−ρ2k
and ρ2k = 1− exp(−X2/e). X2 is the likelihood statistic for comparing the model with index Xβ with the
null Xβ = 0, which follows a χ2 on dim(β) degrees of freedom under the null that β = 0, and e is the numberof events. The idea is to use ρ2k to approximate other explained variation statistic for the proportional modelswhich is very complex but correcting for the bias in this measure when there is a large amount of censoring.
22We also calculated this R-squared using a Cox-model specification and the results are qualitatively the same.23A difference persists even when allowing for unobserved heterogeneity.
21

squared of family background reported here with the R-squared of other studies on timing of
childbearing but unfortunately that is not possible as they are never reported. So, it is not
possible to ascertain whether such R-squared is standard, or if it is unusually small.
DISCUSSION AND CONCLUSIONS
Using data from the British Household Panel Survey, this paper assesses the influence of the
Big Five personality traits on timing of motherhood, thereby contributing to both the literature
on fertility timing and to the recent strand of literature on non-cognitive skills.
By interpreting personality traits as intrinsic preferences, and by taking on board the idea
that preferences are key in women’s fertility choices, one can expect to see an association between
personality traits and fertility timing. In fact, the estimates of a log-logistic model presented
here are evidence of such relationship. Whereas high levels of Agreeableness, Extroversion
and Neuroticism “accelerate” childbirth, high levels of Conscientiousness and Openness are
associated with childbirth postponement.
The results on Agreeableness and Openness are in line with Miller’s (1992) results on the
determinants of childbearing motivation. He finds that Nurturance24 has a significant positive
relation with women’s positive childbearing motivation whereas for Autonomy25 the relation is
negative. This suggests that Agreeableness and Openness influence both childbearing motiva-
tion and behaviour. More agreeable women are more motivated to have a child and do it earlier;
women who score high on Openness are less motivated to have a child and delay doing so.
Taking into consideration that Agreeableness includes traits such as altruism and tender-
mindedness (sympathy for others), the association between being agreeable and being keen on
having children (and consequently giving birth early) is not surprising. As for the Openness
trait, its positive relation with time to motherhood might be explained by the fact that “more
open-minded” people are more autonomous in terms of their values i.e. they are ready to
question the conventions, tend to undertake actions that are based on their own beliefs (Van
24Someone who scores high on this trait gives sympathy and comfort; assists others whenever possible; offersa helping hand to those in need - a trait related to Agreeableness.
25Someone scoring high on this trait tries to break away from restraints, confinement, or restrictions; enjoysbeing unattached, free, not tied to people, places, or obligations; may be rebellious - a trait associated withOpenness
22

der Zee et al., 2002) and tend to believe that it is good to think for oneself (Langston and
Sykes, 1997). In that respect, more “open-minded” people might be less vulnerable to the
social pressure for having children. Moreover, because people who score high on Openness
usually have wide interests, they are less likely to be exclusively family-oriented. Consequently,
they might value their careers more and therefore face higher psychological childbearing costs.
The other aim of this paper was to investigate whether, and in what way, personality traits
can explain the gap in maternity timing between more and less educated women. Very often
researchers attempting to study the causal effect of education on fertility timing dwell on the
potential endogeneity between education and career-orientation, the idea being that more career-
oriented women self-select into education. The problem is, of course, that career-orientation is
usually unobserved. Given that personality traits (usually unobserved) are correlated with both
education and fertility decisions they are another potential source of endogeneity. So, selection
into education in terms of personality traits could be one of the explanations for the maternity
timing gap between more and less educated women. Our results show that there is indeed some
selection into education in terms of Openness but that is not the whole story. When education is
added to the list of covariates the estimated coefficient of Openness goes down when compared
to a baseline model where the set of covariates is composed of the personality traits only, but
by no means is the effect of Openness washed away.
Another possible story is that there is substantial heterogeneity, traits-wise, among less and
more educated women but these differences in personality manifest themselves more in the
fertility behaviour of the more educated women. As a consequence, there would be a particular
group among the more educated women (characterized by some personality traits) severely
postponing childbirth. The results support this hypothesis. First, personality traits explain
more variation in timing of first birth for the more educated women than for less educated
women. And then, within the more educated group, women who have an average to high score
on Openness have lower hazards of childbirth.
Summing up, our results show that personality traits contribute to the differences in fertility
timing between more and less educated women in two different ways: first, personality traits
influence both education and fertility decisions; and second, some highly educated women - the
23

more “open-minded” - severely postpone childbearing and therefore they push up the average
age at first birth within the group of more educated women thereby creating a fertility timing
gap between more and less educated women.
24
REFERENCES
Alea, N.; Diehl, M.; Bluck, S. (2004) Personality and emotion in late life. Encyclopedia of
Applied Psychology, 1 - 10. San Diego, CA: Elsevier.
Amuedo-Dorantes, Catalina and Kimmel, Jean (2006) “The Family Earnings and Postponement
of Maternity in the United States” in Siv Gustfasson and Adriann Kalwij (eds.) Education and
Postponement of Maternity, pp.175-206. Netherlands: Springer.
Billari, Francesco C. and Phillipov, Dimiter (2001)Education and transition to motherhood:
a comparative analysis of western europe, European Demographic Research Papers, 3, Vienna
Institute of Demography.
Bloemen, H. and Kalwij, A. S. (2001) Female labor market transitions and the timing of births:
a simultaneous analysis of the effects of schooling, Labour Economics, 8 (5) , pp. 593-620.
Blossfeld, H.-P. and Huinink, J. (1991) Human capital investments or norms of role transition?
How women’s schooling and career affect the process of family formation, American Journal of
Sociology, 97, pp. 143-168.
Bratti, Massimiliano (2006) “Female labour force participation and marital fertility in Italy”
in Siv Gustfasson and Adriann Kalwij (eds.) Education and Postponement of Maternity, pp.
113-145. Netherlands: Springer.
Caspi, Avshalom and Roberts, Brent W. (2001) Personality Development Across the Life
Course: The Argument for Change and Continuity. Psychological Inquiry, 12(2), pp. 4966.
Cigno, Alessandro and Ermisch, John (1989) A microeconomic analysis of the timing of births,
European Economic Review, vol. 33 (4), pp. 737-760.
Correll, Shelley J.; Benard, Stephen and Paik, In (2007) Getting a Job: Is There a Motherhood
Penalty?, American Journal of Sociology, Vol. 112 (5), pp. 12971338.
Creighton, Sarah (2005) Adolescent gynaecology, Current Obstetrics & Gynaecology, 15, pp.
183-190.
Digman (1996) “The curious history of the Five Factor Model” in Jerry Wiggins (ed.) The Five
Factor Model of Personality - Theoretical Perspectives, ch.1. New York: Guildford Press.
Ellwood, David; Wilde, Ty; Batchelder, Lily (2004) The Mommy Track Divides: The Impact
of Childbearing on Wages of Women of Differing Skill Levels. Mimeo.
25

Ermisch, John and Ogawa, Naohiro (1994) Age at motherhood in Japan, Journal of Population
Economics, 7, pp. 393-420.
Frejka, Tomas and Sardon, Jean-Paul (2006) First birth trends in developed countries: Persist-
ing parenthood postponement. Demographic Research, 15, pp. 147-180.
Fort, Margherita (2006) Education and the Timing of Births: Evidence from a Natural Exper-
iment in Italy. Mimeo.
Gerlitz, Jean-Yves and Schupp, Jurgen (2005) Zur Erhebung der Big-Five-basierten Persnlichkeitsmerk-
male im SOEP, DIW Research Notes 2005-4. Berlin: DIW Berlin.
Gosling, Samuel D., Rentfrow, Peter J. and Swann Jr., William B. (2003) A very brief measure
of the Big-Five personality domains, Journal of Research in Personality, 37, pp. 504-528.
Gosling (2004) “A Note on Alpha Reliability and Factor Structure in the TIPI” in
http://homepage.psy.utexas.edu/homepage/faculty/gosling/tipi_alpha_note.htm
Hakim, Catherine (2003) A New Approach to Explaining Fertility Patterns: Preference Theory. Popu-
lation and Development Review, 29 (3), pp. 349-374.
Heiland, Frank; Prskwetz, Alexia; Sanderson, Warren C. (2005) Do more educated individuals prefer
smaller families?, Vienna Insitute of Demography WP 03/2005.
Hoem, Jan M.; Neyer, Gerda; Anderson, Gunnar (2006) Education and childlessness. The relationship
between educational field, educational level, and childlessness among Swedish women born in 1955-59.
Demographic Research, 14, pp. 331-30.
Jang, Kerry L.; McCrae, Robert R.; Angleitner, Alois; Riemann, Rainer and Livesley, W. John (1998)
Heritability of Facet-Level Traits in a Cross-Cultural Twin Sample: Support for a Hierarchical Model of
Personality. Journal of Personality and Social Psychology, 74 (6), 1556-1565.
Jenkins, Stephen P. (2005) Survival Analysis. Unpublished manuscript, Institute for Social and Economic
Research, University of Essex, Colchester, UK. Downloadable from
http://www.iser.essex.ac.uk/files/teaching/stephenj/ec968/pdfs/ec968lnotesv6.pdf
John, Olivier and Srivastava, Sanjay (1999) “The Big Five Trait Taxonomy: History, Measurement, and
Theoretical Perspectives” in Pervin, L. A. and John, O. P.(eds.) Handbook of Personality: Theory and
Research, ch. 4. New York: Guilford Press.
Kaplan, Greg; Goodman, Alissa; and Walker, Ian (2004) Understanding the Effects of Early Motherhood
in Britain: the Effects on Mothers, IZA Discussion paper 1131.
Kiernan, K.(1980) Teenage motherhood - associated factors and consequences - the experiences of a
British cohort, Journal of Biosocial Science, vol. 12(4), pp. 393-405.
26

Klasen, Stephan and Launov, Andrey (2006) Analysis of the determinants of fertility decline in the Czech
Republic. Journal of Population Economics, 19, pp. 25-54.
Kohler, Hans-Peter and Rodgers, Joseph L. and Christensen, Kaare (1999) Is fertility behaviour in our
genes? Findings from a Danish twins study, Population and Development Review, 25, pp. 253-288.
Kohler, Hans-Peter and Rodgers, Joseph L. and Christensen, Kaare (2002) Between Nurture and Nature:
The Shifting Determinants of Female Fertility in Danish Twin Cohorts, Social Biology, vol. 49, pp. 21848.
Kohler, Hans-Peter and Rodgers, Joseph L. (2003) “Education, fertility and heritability: Explaining a
paradox” in Wachter, Kenneth W. and Bulatao, Rodolfo A. (eds.) Offspring: Human Fertility Behavior
in Biodemographic Perspective, pp. 4690. Washington, D.C.: The National Academies Press.
Kohler, Hans-Peter; Billari, Francesco and Ortega, Jose-Antonio (2002) The emergence of lowest-low
fertility in Europe during the 1990s, Population and Development Review, 28, vol. 4, pp.641-680.
Kohler, Hans-Peter (2005) “Attitudes and Low Fertility: Reflections based on Danish Twin Data” in Ann
C. Crouter and Alan Booth (eds.) The New Population Problem: Why Families in Developed Counties
are Shrinking and What it Means, pp. 99113. Mahwah, N.J.: Lawrence Erlbaum Associates.
Langston, Christopher A. and Sykes, W. Eric (1997) Beliefs and the Big Five: Cognitive Bases of Broad
Individual Differences in Personality, Journal of Research in Personality, 1, pp.141165.
Leridon, Henri (2004) Can assisted reproduction technology compensate for the natural decline in fertility
with age? A model assessment. Human Reproduction, Vol. 19, No. 7, pp. 1548-1553.
Lesthaeghe, R. and van de Kaa, D. J. (1986) “Twee demografische transities?,” in R. Lesthaeghe and D. J.
van de Kaa (eds.), Groei of Krimp, Annual book issue of Mens en Maatschappij, Deventer (Netherlands):
Van Loghum-Slaterus, pp. 924.
Loehlin (2005) “Resemblance in Personality and Attitudes between Parents and Their Children: Genetic
and Environmental Contributions” in Bowles, S; Gintis, H; Groves, M (eds.) Unequal Chances: Family,
Background and Economic Success. Princeton: Princeton University Press.
Martın-Garcıa, Teresa and Baizan, Pau (2006) The Impact of the Type of Education and of Educational
Enrolment on First Births. European Sociological Review, 22 (3), pp. 259-275.
McCrae, Robert and Costa, Paul (1999) “A Five-Factor Theory of Personality” in Pervin, L and John,
O. (eds.) Handbook of Personality: Theory and Research, Ch. 5. New York: Guilford Press.
McCrary, Justin and Royer, Heather (2005) The effect of female education on fertility and infant health.
Evidence form school entry policies using exact dates of birth. Mimeo.
Miller, Warren B. (1992) Personality Traits and Developmental Experiences as Antecedents of Child-
bearing Motivation, Demography, 29 (2), pp. 265-285.
27

Miller, Amalia (2005) The Effects of Motherhood Timing on Career Path. Mimeo.
Morgan, S. Philip and Taylor, Miles G. (2006) Low fertility at the turn of the twenty-first century, Annual
Review of Sociology, vol. 32, pp. 375399.
Mott, F.L. and Shapiro, D. (1983) Complementarity of Work and Fertility among Young American
Mothers, Population Studies, 37 (2), pp. 239-252.
Nicoletti, Cheti and Tanturri, Maria-Letizia (2005) Differences in Delaying Motherhood across European
Countries: Empirical Evidence from the ECHP. Working Papers of the Institute for Social and Economic
Research 2005-4. Colchester: University of Essex.
Petersen, Trond (1991) Time-Aggregation Bias in Continuous-Time Hazard-Rate Models, Sociological
Methodology, 21, pp. 263-290.
Phillips, Susan D. and Imhoff, Anne R. (1997) Women and career development: A decade of research,
Annual Review of Psychology, vol. 48, pp. 31-59.
Plomin, Robert and Caspi, Avshalom (1999) “Behavioral Genetics and Personality” in Pervin, L. A. and
John, O. P.(eds.) Handbook of Personality: Theory and Research, ch. 9. New York: Guilford Press.
Pronzato, Chiara (2007) British Household Panel Survey Consolidated Marital, Cohabitation and Fer-
tility Histories, 1991-2005. UK Data Archive.
Retherford, Robert D., and Sewell, William H. (1989) How Intelligence Affects Fertility, Intelligence, vol.
13, pp. 16985.
Rindfuss, R. R.; Morgan, S.P.; Offutt, Kate (1996) Education and the Changing Age Pattern of American
Fertility: 1963-1989, Demography, 33 (3), pp. 277-290.
Roberts, Brent and Del Vecchio, Wendy F. (2000) The Rank-Order Consistency of Personality Traits
from Childhood to Old Age: A Quantitative Review of Longitudinal Studies, Psychology Bulletin, 126
(1), pp. 3-25.
Rodgers, Joseph Lee; Kohler, Hans-Peter; McGue, Matt; Behrman, Jere R.; Petersen, Inge; Bingley,
Paul and Christensen, Kaare (2008) Education and Cognitive Ability as Direct, Mediating, or Spurious
Influences on Female Age at First Birth: Behavior Genetic Models Fit to Danish Twin Data, American
Journal of Sociology, vol. 114 (Suppl.), pp. S202S232.
Rodriguez, German (2008) Survival models, lectures notes for the course “Generalized linear models”
taught at Princeton University, Chapter 7. Downloadable from
http://data.princeton.edu/wws509/notes/c7.pdf
Royston, Patrick (2006) Explained variation for survival models, The Stata Journal, 6 (1), pp. 83-96.
Shearer, Darlene L.; Mulvihill, Beverly A.; V. Klerman, Lorraine; Wallander, Jan L.; Hovinga, Mary
28

E.and Redden, David T. (2002) Association of Early Childbearing and Low Cognitive Ability, Perspec-
tives on Sexual and Reproductive Health, vol. 34, Number 5, pp. 236-243.
Shkolnikov, Vladimir M.; Andreev, Evgueni M.; Houle, Ren and Vaupel, James W. (2004) “To concen-
tration of reproduction in cohorts of US and European Women”, Max Planck Institute for Demographic
Research WP 2004-027.
Sigle-Rushton, Wendy (2008) England and Wales: Stable fertility and pronounced social status differ-
ences, Demographic Research, vol.19, article 15, pp.455-502.
Sobotka, Tomas (2008) “Does persistent low fertility threaten the future of European populations?”
in Johan Surkyn, Patrick Deboosere and Jan van Bavel (eds.) Demographic Challenges for the 21st
Century: A State of the Art in Demography, ch. 2.
Sobotka, Tomas and Testa, Maria Rita (2006) “Attitudes and Childlessness in Europe” in H.ohn, C.,
Avramov, D. and Kotowska, I. (eds.) People, Population Change and Policies: Lessons from the Popu-
lation Policy Acceptance Study, ch. 9. Netherlands: Springer.
Srivastava, S. (2006) Measuring the Big Five Personality Factors. Retrieved [23rd May 2007] from
http://www.uoregon.edu/ sanjay/bigfive.html.
Srivastava, Sanjay; John, Oliver P.; Gosling, Samuel D. and Potter, Jeff (2003) Development of Person-
ality in Early and Middle Adulthood: Set Like Plaster or Persistent Change? Journal of Personality and
Social Psychology, 84 (5), pp. 1041-1053.
Sullivan, Rachel (2005) The Age Pattern of First-Birth Rates among U.S. Women: The Bimodal 1990s,
Demography, Vol. 42, No. 2, pp. 259-273.
Thomas, Frederic; Renaud, Franois; Benefice, Eric; Meeus, Thierry; Guegan, Jean-Franois (2001) Inter-
national Variability of Ages at Menarche and Menopause: Patterns and Main Determinants. Human
Biology, 73 (2), pp. 271-290.
Van Bavel, Jan (2009) Choice of study discipline and the postponement of motherhood in Europe: the
impact of expected earnings, gender composition and family attitudes, forthcoming in Demography.
van de Kaa, Dirk J. (1987) “Europe’s second demographic transition”, Population Bulletin, vol. 42(1).
Van der Zee, Karen; Thijs, Melanie; Schakel, Lolle (2002) The Relationship of Emotional Intelligence
with Academic Intelligence and the Big Five, European Journal of Personality, 16, pp. 103125.
Von der Lippe, Holger (2006) On the psychological determinants of fertility. A panorama of concepts
and approaches, and evidence from eastern Germany, Max Planck Institute for Demographic Research
WP 2006-050.
Weston, Ruth; Qu, Lixia; Parker, Robyn; Alexander, Michael (2004) ”It’s not for lack of wanting kids”:
a report on the Fertility Decision Making Project, report no. 11, Australian Institute of Family Studies.
29

Wilkie, Jane R. (1981) The Trend toward Delayed Parenthood, Journal of Marriage and the Family,
43(3), pp. 583-591.
Yu, Peng (2006) Higher Education, the Bane of Fertility? An Investigation with the HILDA survey,
Centre for Economic Policy Research DP No. 512, the Australian National University.
30

APPENDIX
Table 5: Summary statistics
Had a child Childless71.4 28.6
highest qualifications (in %)no high school certificate 42.9 48.8 28.0high school certificate or higher 57.1 51.2 72.0birth cohorts (in %)born before1960 44.3 53.1 22.3cohort 1960 to1970 24.7 29.1 13.6cohort 1971 to 1990 31.0 17.8 64.1intact family (in %) (obs: 6069)no 19.6 18.8 22.2yes 80.4 81.2 77.8sibs (in %) (obs: 6082)0 9.7 9.5 10.01 30.3 27.4 38.52 24.7 24.3 26.03 or more 35.4 38.9 25.5mother’s education (in %) (obs: 5694)never went to school 0.9 1.1 0.3left school with some qualifications 54.0 60.9 34.6left school with no qualifications 23.6 20.8 31.6got further education qualifications 17.2 14.2 25.4got univerity or higher education degree 4.4 3.0 8.1father’s education (in %) (obs: 5430)never went to school 1.1 1.3 0.7left school with some qualifications 48.6 53.6 34.3left school with no qualifications 15.9 13.7 22.3got further education qualifications 27.4 26.0 31.2got univerity or higher education degree 7.0 5.4 11.5area lived in childhood (in %) (obs: 6084)inner city 9.9 10.8 7.3suburban area 21.9 20.9 24.6village, town, rural or countryside, moved around 68.3 68.3 68.1age at last interviewmin 18 18 1825th percentile 32 37 22median 43 47 2875th percentile 56 58 43max 75 75 75age ended studies (obs: 5954)min 5 5 1325th percentile 16 16 17median 18 18 1975th percentile 23 24 22max 75 75 70
31

Table 6: Summary statistics by women’s educational level
no high school certificate high school certificate or highermother’s sub-sampleage at first childbirthmin 14 1425th percentile 20 22median 23 2575th percentile 26 29max 42 46mean age at first childbirth 23.4 25.7child born in a union (in %) (obs: 1637)no 21.5 16.9yes 78.5 83.1child conceived in a union (in %) (obs: 1635)no 37.7 26.2yes 62.3 73.9childless women’s sub-samplethink will have children (in %) (obs: 1976)no 24.2 17.7varied over time 10.4 9.8yes 65.5 72.5
Figure 5: Distribution of ‘Conscientiousness’ by educational group
32

Figure 6: Distribution of ‘Openness’ by educational group
Figure 7: Distribution of ‘Agreeableness’ by educational group
33
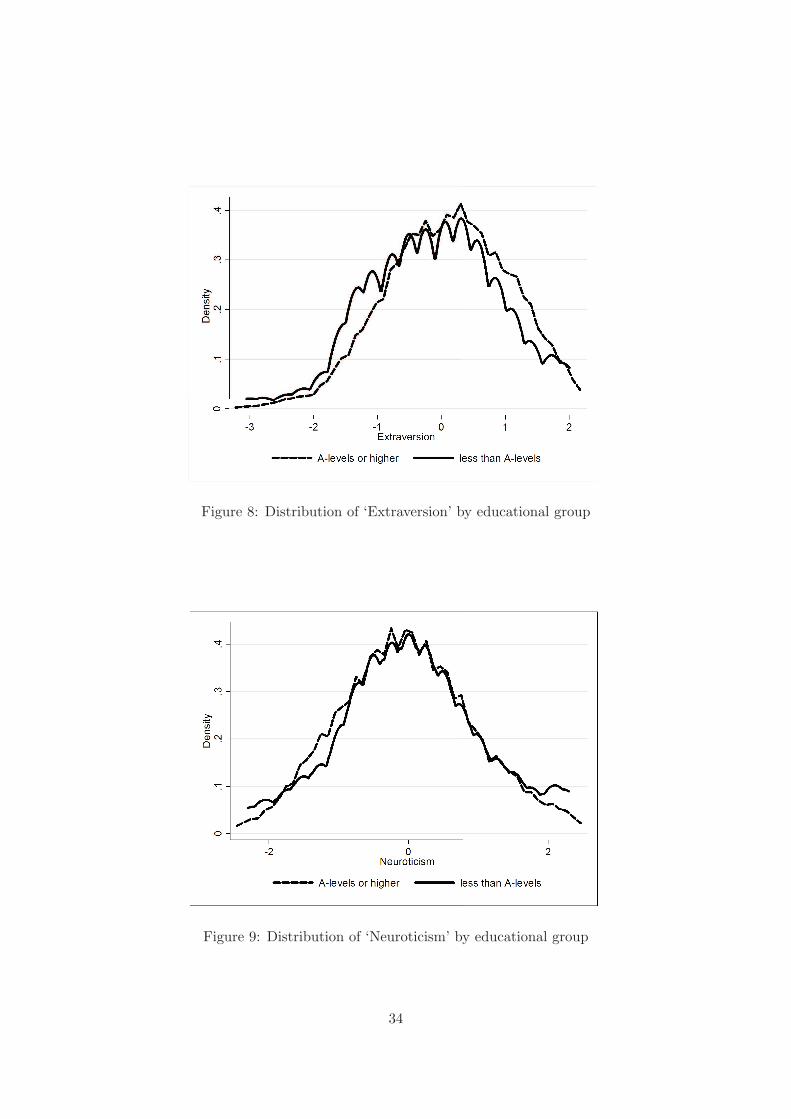
Figure 8: Distribution of ‘Extraversion’ by educational group
Figure 9: Distribution of ‘Neuroticism’ by educational group
34

Figure 10: Non-parametric hazard functions by educational group
35