Who Benefits More from Social Media wise updatesmisrc.umn.edu/wise/2014_Papers/127.pdfWho Benefits...
31
Who Benefits More from Social Media: Evidence from Large-Sample Firm Value Analysis (Preliminary) Lorin Hitt The Wharton School, University of Pennsylvania [email protected] Fujie Jin The Wharton School, University of Pennsylvania [email protected] Lynn Wu The Wharton School, University of Pennsylvania [email protected] Abstract This study examines the relationship between social media presence and the market value of firms. Using the creation of a Facebook Company page as a social media adoption event, we find that while firms are deriving some positive value from using social media, the effects are heterogeneous. Specifically, we find that social media adoption and use are complementary to “data skills” – the market value created by a marginal dollar of an addition skill related to data analytics increase the return to using social media. However, we find that general IT skills, which are often found to complement traditional IT systems, do not seem to offer any additional benefits when firms adopt social media. These results suggest that social media differ from traditional IT systems and requires a different set of organizational complements. Only firms who possess the necessary data analytical skills can truly take advantage of the a massive amount of data that social media can provide. In turn, they benefit from social media adoption more than firms that lack data analytic capabilities. Keywords: Social Media, Data Analytics, Skills, Market Value, Complementarities
Transcript of Who Benefits More from Social Media wise updatesmisrc.umn.edu/wise/2014_Papers/127.pdfWho Benefits...

Who Benefits More from Social Media:
Evidence from Large-Sample Firm Value Analysis (Preliminary)
Lorin Hitt The Wharton School, University of
Pennsylvania [email protected]
Fujie Jin The Wharton School, University of
Pennsylvania [email protected]
Lynn Wu The Wharton School, University of Pennsylvania
Abstract
This study examines the relationship between social media presence and the market value of firms.
Using the creation of a Facebook Company page as a social media adoption event, we find that while
firms are deriving some positive value from using social media, the effects are heterogeneous.
Specifically, we find that social media adoption and use are complementary to “data skills” – the market
value created by a marginal dollar of an addition skill related to data analytics increase the return to using
social media. However, we find that general IT skills, which are often found to complement traditional IT
systems, do not seem to offer any additional benefits when firms adopt social media. These results
suggest that social media differ from traditional IT systems and requires a different set of organizational
complements. Only firms who possess the necessary data analytical skills can truly take advantage of the
a massive amount of data that social media can provide. In turn, they benefit from social media adoption
more than firms that lack data analytic capabilities.
Keywords: Social Media, Data Analytics, Skills, Market Value, Complementarities
Introduction
As of 2014, more than 60% of the Internet users have a Facebook account, and many more use
specialized social media platforms such as LinkedIn, Twitter or Pinterest. By engaging with customers
and other stakeholders in social media, a firm can potentially reach new customers, increase interaction
with existing customers and generate positive word of mouth for new and existing product offerings (Aral
et al. 2013). As firms are increasingly interested in adopting and incorporating social media into their
marketing and product strategy, it is increasingly important to understand when and how social media can
create firm value. However, a recent a recent survey shows only about 15% of marketing executives
believe that they can quantify the impact of social media on their businesses (CMO Survey 2014) 1. With
corporate social media spending expected to double in the next five years, the pressure to prove the value
of social media investments is mounting.
It has long been recognized that the benefits of information technology innovations may have an
uncertain and varying impact on firms depending on their capabilities, market position and ability to make
complementary investments. For instance, research has found that decentralized organizational structures
and complementary investments in human capital were associated with incremental returns to enterprise
computing investments in the 1980s and 1990s (Bresnahan, Brynjolfsson and Hitt, 2002) in part because
this better enables firms to make use of information generated as a byproduct of operational activities (see
e.g., McAfee, 2002). The ability to obtain and integrate external information into firm operations has
been shown to be an important complement in the Internet era (Aral, Brynjolfsson & Wu, 2012;
Brynjolfsson, Hitt and Tambe, 2013). Recently, there is evidence that a firm’s ability to engage in data-
driven decision making is becoming increasingly important (Brynjolfsson, Hitt and Kim, 2012). It is
therefore likely that effective use of social media will require different skills and capabilities, some of
which may be distinct from the capabilities required to effectively use prior technologies.
1 http://blogs.wsj.com/cmo/2014/09/03/social-media-spending-is-on-the-rise-but-impact-is-hard-to-measure/?KEYWORDS=social+media

One of the distinct capabilities of social media is that they provide a massive amount of information
about clients, consumers and users in real time, much of which was previously not available to firms
(such as relationships among users). We therefore hypothesize that firms that are endowed with or are
investing in data-related capabilities are the most likely to be incorporating social media into their
marketing and product strategy, and the most able to receive benefits from these investments. We further
argue that these capabilities are likely to be more important for social media technologies than for prior
technologies such as general IT investment or enterprise computing. To the extent that many firms are
experimenting with social media investments, but not all have the required complementary data skills (or
the ability to rapidly acquire the required skills) this will generate cross-sectional and time series variation
in the apparent returns to social media investments, especially in “forward-looking” performance
measures such as market valuation. Moreover, this variation will be predicted by the level of data-related
capabilities, and that data-related capabilities will have less influence on the returns to other types of
information technology investment.
Industry observers have noted that the lack of convincing evidence on the financial benefit of social
media strategy is an impediment to substantial investment in this area (Divol et al. 2012). However, there
has been some prior work on the economic impact of social media. A number of studies examined the
effects of specific types of social media, such as recommender systems, and marketing outcomes such as
brand perception, customer satisfaction and even product sales (Chevalier et al. 2006; Dellarocas et al.
2007; Duan et al. 2008; Forman et al. 2008; Zhu et al. 2010). There is also an emerging literature that
examines the connection between social media and overall firm value or performance. For instance, Luo
et al. (2013) examined whether social media investment is predictive of market value. Chung et. al. (2014)
also utilizes a market value framework to show that user-generated rather than firm-generated social
media content is associated with increased market value. By focusing on market value, we are also able
to work solely with observations of social media use as opposed to also measuring costs. However, we
differ by focusing on how firm characteristics enable these returns to be realized.
In this paper we seek to complement and extent prior work in three specific ways: 1) we consider a
broader sample -- all publicly traded US firms -- in contrast to industry or firm-focused studies that
dominate the existing literature, 2) we utilize a market value framework which reduces the need to make
cost-related assumptions and is capable of making inferences on the long-term benefits of social media
interactions, and 3) we examine the role complementary organizational and industry factors play in
generating social media benefits. In this respect our approach is similar to Luo et. al (2013) and Chung et.
al. (2014) except we rely on an econometric rather than prediction framework (in contrast with the
former). More importantly, we focus on organizational complements in addition to social media behavior
to understand the return to social media use.
We compiled a 7-year panel (2007-2013) of social media adoption decisions by US publicly traded
firms. For each firm we have the date when they first created a Facebook page, and for those firms that
are on Facebook we have statistics on social media usage on their page (posts, likes, shares, comments) as
well as the full text of all posts and comments that appear on their page. We match our social media data
to financial data on Compustat, which provides additional information on industry, assets, market value,
advertising, and R&D investments. We focus on Facebook because it is the most widely used social
media platform in the US and appears to be the most likely site for a first adoption and focus on publicly
traded US firms due to the availability of comparable performance information. Finally, we derive our
measures of corporate capabilities by analyzing the skill set of a very large sample of employees derived
from online resume data which has proven to be useful in identifying a wide variety of corporate
characteristics (see e.g., Tambe and Hitt, 2013 or Tambe, 2014).
Our empirical approach is based on estimating the market value effects of social media adoption
using the Tobin’s q framework, an econometric model that relates the market value of a firm to the
quantities of the assets that the firm possesses. We also control for firm, industry and time effects to limit
unobserved heterogeneity, consistent with prior work utilizing this framework. This approach has several
advantages for our study as it enables the detection of long-term value creation (in contrast to productivity

analysis which is better suited to identifying short-run effects) and is consistent with the view that
consumer awareness and engagement are assets whose value can be influenced by additional investment
and firm strategy. The use of a market value framework also enables the calculation of net benefits
without having to make assumptions about the actual cost or investment in social media use.
We find that firms that have complementary analytics capability, as measured by the skill sets of
their employees, receive greater benefits from Facebook adoption. To a lesser extent, the returns to social
media adoption are higher for firms with communications and marketing capability. In contrast, we find
that these same skills have a weaker or negligible effect on prior types of information technology
investments such as ERP adoption. Moreover, traditional information technology skills (programming,
networking) still continue to complement prior technologies, but are not complementary to social media
technologies. Overall, this suggests that benefits of social media are higher in firms with a specific set of
analytically-related capabilities, and that these capabilities are distinct from those that had been
complementary to IT investments in the past.
The fact that social media adoption is complementary to some types of valuable capabilities but not
others addresses some types some potential endogeneity issues (such as the possibility that “good” firms
invest and adopt more leading edge technologies and skills). We also find that the direct effects of social
media adoption are highest in industries with low levels of adoption, which is inconsistent with an
alternative argument that the relationship is caused by firms in highly valued emerging industries (e.g.
Internet companies) being early adopters of social media. Finally, further analysis of actual social media
activities shows that the benefits only accrue from use, measured by either firm or consumer activity, not
simply the adoption event. These observations increase our confidence that we are indeed observing
marginal effects of social media use.2
2 We are continuing to work on developing better metrics for social media use recognizing that different types of content may be more plausibly associated with a causal relationship between use and value. We are also exploring the connection between social media use and the value of advertising and brand assets which can better establish a potential causal relationship using additional insights from q theory and developing more extensive measures for internal firm capabilities likely associated with social media use.
Theory
Social Media and Firm Market Value
Prior work on social media have shown they can provide a variety of benefits including increasing
brand recognition, facilitating demand prediction and improving marketing technology (Ghose et al.
2011). Research has also increasingly revealed the mechanisms by which social media generates benefits.
Observing contagion in social networks, Bapna et al. (2012) documents how social ties can affect product
sales. Li and Wu (2014) show how word of mouth on Facebook can complement herding to affect sales
of daily deals. Some have also shown that social media primarily generate value through user-generated
content and how this relationship is distinct from the value (if any) of firm-generated content (Bapna et al.
2012; Chen et al. 2009; Goh et al. 2013).
While customer satisfaction, brand recognition and even product sales can be good indicators for
predicting firm performance, they do not determine whether social media can increase overall firm value.
An important reason is that while outcome variables such as sales can be easily captured, it is very
difficult to observe the cost of using social media. Even if costs are observable in some rare cases, it is
difficult to attribute the costs to the realized sales (Agarwal et al. 2011). Furthermore, most studies focus
on only one division or a single product line to examine the impact of social media use on sales, making it
even harder to attribute general marketing related expenses to a single channel, such as social media.
Consequently, it is difficult to ascertain if the benefit of using social media exceeds the cost.
Thus, to understand whether social media generate value for the adopting firms, it is important to
conduct a large sample studies involving a variety of firms across many industries. To mitigate the fact
that costs of social media is rarely observed or difficult to attribute and to measure, we use the market
value of the firm as the main outcome of interest. Market value should, in theory, account for the both the
benefit and the costs of using social media, allowing us to assess whether they can indeed create value. If
social media can generate benefits through transforming how individuals and firms interact, communicate,

consume and create, we should expect that firms that adopt social media to have greater market value than
those that did not.
Hypothesis 1: Firm’s adoption of social media strategy contributes positively to the valuation of the
firm.
Data Analytic Skills and Social Media
Although the average market value could increase when firms adopt social media technology, the
effect is likely to be heterogeneous. Just like the return to investing in IT can vary dramatically depending
on firm’s existing organizational practices, the effect of social media on firm value is also likely to vary
depending on firms’ existing assets. An important capability of social media is to reach a broad set of
interested users. Through interacting with these users, firms can obtain data about user interests, business
environment, product feedbacks, and employee satisfactions, all in real time. Thus, to benefit from social
media, it is important for firms to have the ability to efficiently process data, streamline the associated
analysis, and utilize the information obtained to improve various firm strategies. Often, these data skills
are embodied in the company’s workforce and having these skills or other organizational complements
may be even more important for new technologies, such as social media, than for traditional enterprise
systems. In contrast to enterprise systems such as ERP or data warehousing, that generally have a high
upfront cost, starting a social media effort, such as building a Facebook Company Page, is just a few
clicks away. With minimal barrier to entry, social media’s effect on firm performance may solely relies
on firms’ capability to collect, monitor, manage and analyze the data provided through social media.
Focusing on processing and teasing meaningful signals from noise, data analytics skills are distinct
from the traditional skills such as education or IT skills that often complement general technology use. To
effectively leverage social media, firms often need to continuously monitor and learn from the massive
amount data about their customers, employees and products. The size of the data and the speed required
to manage the data are growing at an unprecedented rate (Cisco 2014). Not only are firms facing
difficulties in simply collecting and storing the data, they have even more difficulties in processing and

teasing business intelligence from the data. Without these data analytics skills, firms could mismanage
their social media effect that can negative effects on firm’s brands, customer engagements and product
sales (Divol et al. 2012). For example, when Silent Bob used Twitter to complain about his flight
experience with Southwest airlines, the company was hit with a flood of negative publicity. It took
months of public relations effort to quell consumer dissatisfaction. While social media can provide a great
channel to communicate to a vast number of users, they could also be used to transmit negative publicity.
Thus, firms need to constantly monitor their social media activities to ensure negative publicity does not
spiral out of control.
While directly working with social media data is important, their use should not be limited to
employees who work directly the technology but also applied to workers in different parts of firms’
operations. Because social media can provide signals just about every parts of the firm’s operation, it is
important to incorporate the signals learned from social media into the overall corporate strategy. As users
directly interact with firms’ new product offerings through comments and reviews, firms that can
effectively these data is in a better position to predict future demands and improve their existing product
lines. Signals learned from social media sentiment could feed direct to the product design, which in turn
affects operations, marketing, and sales3. Thus, tightly integrating social media data with firms’ operation
and marketing efforts is critical (Ghose et al. 2012). While having dedicated social media personnel with
data analytic skills is useful, social media would have a much bigger impact if social media data can be
fed into various strategic areas. When employees in various parts of the organization can make sense of
the social media data and effectively incorporate them into firm strategies, social media could have a
much more profound effect on the firm than simply the marketing department. Using signals learned from
social media can help guide firms to flexibly adjust to changes in the business environment.
By contrast, firms that do not have existing capabilities in handling data may in fact be at a
disadvantage. Not only do they have to learn specific social media skills, such as generating content, they
3 http://www.ft.com/intl/cms/s/2/3591cb26-6abf-11e4-a038-00144feabdc0.html

would also face significant hurdles in learning how to analyze the data. Hiring new employees with the
appropriate data analytics skills is helpful, but having them work effectively in a new environment cannot
be achieved in a short amount of time. Thus, firms with existing data analytics capabilities are in a better
position to reap benefit from social media and explain the variation in the return to using social median
among firms.
H2: Firms with capabilities relating to data management and analytics derive more value from
social media.
Empirical Framework
Data
In this study, we combine firm data from Compustat, with firms’ social media usage data from
Facebook. Facebook is among the earliest social media platforms and is still currently one of the most
popular social media sites. Firms create their Facebook Page in a manner similar to how individuals
create their own personal pages, providing information on the name, category of products and location
information. Once a page is created, companies and organizations can use it to post content and
individuals can engage with the firm’s content, by “liking” a post, adding a comment, or writing posts on
the page directly to share with other users in their network.
The sample of firms used in this study consists of public traded firms in Compustat that are operating
in 2007.4 For each of the firms in the sample, we queried Facebook to see whether the firm has a page,
and if so, when it was first created. We utilized Facebook’s search box to look up the corresponding page
for each of the firms. If no relevant page showed up, then we assume this particular firm has not yet
started its Facebook page. If a page turns up in the search result, we performed an additional check to
ensure a correct match, before proceeding to collect the contents on that page. For each Facebook page 4 A simple screening rules was is used to make sure all the observations are indeed from firms, instead of funds or public debts. Such rules include, for example, whether the firm reports the value of its fixed assets, or the number of employees.
we identified, we computed the total number of posts, likes, comments, and shares appearing on the page
in each time period. These data provide information about both consumer and firm behavior on Facebook.
Whether a firm actively posts on Facebook would indicate how intensively the firm uses the social media
platform. The interaction from the users, as reflected by clicking to “like” or “share” the post, or issuing
comments, would capture to the level of individual users’ engagement with the firm’s social media
activities. Prior research suggests these two types of interactions could have distinct effects (Cheng et. al,
2014).
Among our sample of 10,171 firms, a total of 1,921 (about 19%) are found to have Facebook pages
over our time period. In Table 1, we summarize the total number and the percentage of Facebook
adopters in each industry, as well as the industry break down for all the Facebook adopters. The industry
classification is performed using Standard Industrial Classification (SIC) codes at the “1.5 digit” level to
identify 13 different industries (see Table 1). Overall, our sample includes a significant number of firms
in all industries. Moreover, we find that retailers and computer-related firms are especially likely to have
Facebook pages, consistent with expectations.
We link the data on social media adoption and use to quarterly data from Compustat from 2007 to
2013. Since our data suggests that the majority of the firms joined Facebook between 2009 and 2012, the
time span of our panel should be adequate for identifying relationship between social media use and
subsequent changes in market value. The primary dependent variable in this analysis is firm market value,
which is calculated as the sum of the market value of equity (based on stock prices at the end of the
period) plus the book value of debt. The primary independent variables are fixed assets (property plant
and equipment), other assets (principally financial assets and intangibles), R&D expenditure, and
advertising expenditure. Our primary models also include industry and time controls derived from these
data. These measures are similar to those utilized in prior studies of IT value based on a similar
framework (e.g. Brynjolfsson and Yang, 1999; Hitt and Brynjolfsson, 1996). Summary statistics for the
variables and their correlations are reported in Tables 2 and 3.

In order to test for how data skills among employees influence firms’ ability to obtain value from
social media usage, we use an additional data source of individual full text resumes collected in the year
2007. These data are similar to other large sample resume datasets used for prior work in IT value and
technology diffusion (see e.g., Tambe and Hitt, 2013a or Tambe and Hitt, 2013b for a more detailed
discussion of the advantages and limitations of these datasets generally). Using professional tools, we
parsed the resumes to identify each skill of the employee, as reflected in the resume. We specifically
looked at data analytics skills: including skills in data centric analytics and data mining. Examples of job
titles of individuals with data analytic skills include: consultant, financial analyst, systems engineer,
customer service specialist, program manager, and systems analyst. We assume the employee has these
skills at the start of working on the job related to these titles. For each employee in our data, we identify
whether a skills is present and aggregate the total number of employees with the skill for each firm. Using
a similar method, we also account for employees with IT, communication, and marketing skills for each
firm. We match this single cross-section of skills in 2007 to all firms in our panel across all years. IT
workers are identified either by titles that are clearly related to information technology (for example,
software engineer, systems analyst, programmer analyst) or contain keywords that suggest the employees
is an IT worker (for example, computer, website, software). We conducted various alternative measures
of identifying IT or job skills and they do not qualitatively change our analysis.
The individual resume dataset also enables us to estimate firms’ usage of Enterprise Resource
Planning (ERP) system. We use ERP as a representative enterprise IT system and compare its effect on
firm performance with that of social media. Specifically, we look at individuals’ description of job
responsibilities and experiences corresponding each of their employment spells. If usage of ERP systems
is mentioned in an individual’s description, e.g. “used ERP system to conduct inventory control”, then we
conservatively deduce that by the time of the termination of employment of this individual with the
employer, the given firm has already implemented an ERP system. Compared other sources of data that
look at the time when a firm purchases ERP software or the date that it implements the system through

the organization, our approach puts more emphasis on actual usage of the system, as reflected by reported
experience with the system from the employees. This measurement should provide a more accurate
account of the status of ERP implementation in the firms.
These measures would allow for a comparison between the “traditional” information technologies, as
represented by the ERP system, and the new technology, as represented by social media, and particularly,
how data skills would influence the two technologies differently.
Methods
Under the “q theory” of investment (Tobin, 1969), a firm should invest in assets until the marginal
value of an additional dollar of the asset is equal to a dollar of market value. This ratio of market value of
a firm to total book value is known as Tobin’s q. While theory implies that it is the marginal value of q
that should be approximately one, it is commonly assumed in empirical work that the average value of
Tobin’s q is a good approximation for the marginal value. This implies an estimating equation of the
form:
𝑀𝑎𝑟𝑘𝑒𝑡 𝑉𝑎𝑙𝑢𝑒 = 𝛼!𝐴!!∈{!""#$ !"#$%}
Where 𝐴! represents the quantity (book value or investment cost) of different assets and 𝛼! is the
marginal value (which should be 1 in equilibrium for each asset). Essentially, this equation suggests that
the value of firm is the sum of the value of its assets. To implement this equation empirically, we relate
market value to the book value of fixed assets, other assets, and use expenditure as a proxy for the asset
value of R&D and Advertising. In addition, we add controls for industry, quarter. This yields:
𝑀𝑎𝑟𝑘𝑒𝑡 𝑉𝑎𝑙𝑢𝑒 =
𝛼 + 𝛽!𝐹𝑖𝑥𝑒𝑑 𝐴𝑠𝑠𝑒𝑡𝑠 + 𝛽!𝑂𝑡ℎ𝑒𝑟 𝐴𝑠𝑠𝑒𝑡𝑠 + 𝛽!𝐹𝑎𝑐𝑒𝑏𝑜𝑜𝑘𝐴𝑑𝑜𝑝𝑡𝑖𝑜𝑛 + 𝛽!𝐴𝑑𝑣𝑒𝑟𝑡𝑖𝑠𝑖𝑛𝑔𝐸𝑥𝑝𝑒𝑛𝑠𝑒 +
𝛽!𝑅&𝐷 𝐸𝑥𝑝𝑒𝑛𝑠𝑒 + 𝑖𝑛𝑑𝑢𝑠𝑡𝑟𝑦 𝑐𝑜𝑛𝑡𝑟𝑜𝑙𝑠 + 𝑡𝑖𝑚𝑒 𝑐𝑜𝑛𝑡𝑟𝑜𝑙𝑠 + 𝜀

We measure the effect of Facebook adoption on firms’ market value through the coefficient 𝛽!.
Both the direct effects of Facebook adoption as well as its interactions with various labor skills are a part
of our model. Theory suggests a linear relationship between market value and assets. However, since
these data vary substantially in size, outliers can cause OLS to perform poorly in market value regressions,
especially when a large firm has characteristics that deviate significantly from population mean. We
therefore use Least Absolute Deviations (LAD) regression, which essentially causes the regression line to
pass through the median rather than the average and weights the residuals by the absolute value rather
than the square. By reduces the influence of extreme points, LAD can mitigate the outlier issues
associated in the data and it has been utilized in prior work on the market value of IT investments in both
the econometric technique and the general form of the estimating equation (Brynjolfsson, Hitt and Yang,
2003; Brynojolfsson and Yang, 1999; Brynjolfsson and Hitt, 1998). It should be noted, however, that in
panel data this approach will tend to underestimate the size of the standard errors due to repeated
sampling of the same firm in the (lowering it by as much as the square root of the length of the time
dimension) so we will generally consider only effects that are strongly statistically significant.
Results
Social Media Adoption and Firm Valuation
In Table 4, we present the baseline estimates of our market value regression. We begin with the
simplest variant of the analysis where we include the four asset measures (fixed assets, other assets,
advertising, R&D) and add a binary variable that takes the value of 1 following the creation of a
Facebook public page for that firm (“Facebook Adoption”). We find that the market value of a firm is
$9M higher following Facebook adoption (column 1). The value of fixed assets is approximately 1 as
implied by theory and we find other assets to be “worth” approximately 0.5 to 0.7 which is similar to
prior estimates of this equation in other work (see e.g., Brynjolfsson, Hitt and Yang, 2003). Both R&D
and advertising expense contribute to market value positively, although it is difficult to directly interpret
the value since we are using annual expense as a proxy for the accumulated value of R&D and
Advertising assets. In column 2, we estimate the same model but restricting the sample to only Facebook
users. Although the sample is reduced substantially (omitting about 80% of the data for firms that do not
have a Facebook page), results are similar to column 1. Thus we use the smaller sample to examine how
different measures of firm (posts) and user (likes, shares, comments) engagement can affect market value.
Interestingly, as soon as we introduce measures of social media use in the model, the direct effect of
Facebook adoption becomes negative and Facebook engagement metrics have become positive and
statistically significant. Since all usage measures are demeaned with a standard deviation of one, the
result in column 3 suggest that a one standard deviation increase in posting frequency is associated with a
$21 million in market value when compared to firms with an average number of posts. The fact that the
direct effect of Facebook adoption turns negative helps rule out some types of reverse causality. If the
results are driven by highly valued firms adopting social media early, this would imply a positive direct
effect on Facebook adoption. Here, we find that social media only increases value when it is actively
used by firms or their customers while the mere adoption of the technology does not suggest that our
results are not subject to this type of reverse causality.
We also compare the effects of different types of social media engagement. In addition to the number
of posts, we also measured the number of likes, shares and comments to existing posts. Using these
Facebook engagement measures, we show that consumer engagements on social media are associated
with a substantial increase in firms’ market value (column 4-6). While results show positive and
significant effect for each of these variables on the market value of the firm individually, we remain
cautious about the interpretation of these effects since the user interactions may also be capturing latent
factors such as how engaged users are, which could be heterogeneous across firms. The correlations
among the three user engagement variables are 0.55 or greater, suggesting they may be measuring the
same underlying mechanism. To simplify interpretation, we construct a composite measure of user
engagement from the first principal component of these three measures (the composite explains 68% of

the variance). Estimates on the resulting variable (“FB_Engagement”) suggest that firms with one
standard deviation higher user engagement have about a $78M higher market value.
Although we find that the market value effect comes from social media use rather than mere
adoption, it is still possible that some types of highly valued firms are naturally a better fit for social
media and therefore they may simultaneously have higher social media activities and higher market value.
To examine this effect, we divide firms into two groups by their industry: those that are involved in the
production or sales of consumer related products and services, the remainder, which consists of other
industries not directly dealing with the end consumers. We choose this division because the former group
is consist of consumer-facing firms that are more likely to use social media to attract and interact with
their consumers. We call this group the large social media presence group. This is made up mainly of
three industries 1) Retail; 2) Computer Related Industries; 3) Consumer product related manufacturing
industries. The rest of the industries represent the small Facebook presence group that does not place
consumer interactions as their primary activities. This classification is also corroborated by the actual
Facebook adoption rates in the two groups. Among the large Facebook presence group, 38.6% have
adopted Facebook public page, in contrast to 16.4% in the low Facebook presence group. The χ! test
show that the between group difference is statistically significant (p < 0.0001) suggesting that on average
the adoption rates for the two groups are different. If the effect of social media use on market value is
being driven by industries with a large Facebook presence we would expect a stronger effect for the large-
presence group than for the small-presence group.
In Table 5, we show that for the group of large social media presence firms, the marginal benefit of
social media adoption on their market value is not different from zero. In contrast, for the group of small
social media presence firms, having Facebook page significantly improves their market value. On
average, Facebook adoption is associated with adding $7 million in market value. When we compare only
within the group of Facebook users, same pattern emerges: firms in the small social media presence
group benefit more from using the social media than firms in large social media presence group. These

results are not consistent the reverse causality hypothesis where highly valued firms tend to adopt social
media. This also implies that Facebook adoption is associated with higher market value only in industries
where the social media presence would be unusual. This is perhaps not surprising – having a Facebook
page may be a competitive necessity in consumer-facing industries, while a Facebook page might provide
a (small) source of differentiation in industries where customer engagement through online media is less
the norm. Nonetheless, it does provide support for Facebook representing a potentially effective
mechanism to reach customers for firms who would not normally engage with customers directly online,
expanding the ability of firms in these industries to interact with their customers in a cost efficient manner.
Social Media and “Big Data” Skill
While having a Facebook company page is shown to be helpful for firms on average, the effect
across firms is likely to vary. To truly leverage the power of social media, firms not only need to engage
users on social media, but they also need to understand the data provided by the users. Firms can only
ultimately succeed in leveraging the full potential of social media when they can effectively implement
actionable strategies learned from the data. Understanding the massive amount of data provided through
social media is not trivial and requires a substantial data analytics talent in the workforce. To the extent
that a firm can benefit from social media may be tightly linked to data analytics talent embodied in the
employees. To gauge firms’ existing data analytics talent, we analyze the skill composition in their
employees, focusing specifically on data analytics skills such as data mining and the ability to conduct
analysis using data-centric software.
In Table 6, we explore the marginal effect of having data skills on the return to social media adoption.
For readability purposes, we replicate column 2 of Table 5 in the first column of Table 6. In column 2, we
examine the performance effect of having data analytics skills within the company’s workforce and its
interaction with social media adoption. Not only are data analytics skills an important factor in generating
firm value itself, it can also magnify the effect of adopting Facebook. Specifically, a one-standard-
deviation increase in a firm’s data analytics skills is correlated with $216MM in additional market value

when the firm adopts Facebook. These results suggest the ability to collect, process and analyze the
massive amount of social media data and incorporate them into various parts of the firm’s operation is
key to benefit from social media. However, it is possible that data skill could just be another proxy for the
firm’s overall IT skills which has been shown to have a tremendous effect on firm performance
(Brynjolfsson, Hitt, & Yang, 2002). Thus, we examine whether it is simply the raw IT skills that
complements technology adoptions including social media as opposed to the data analytics skills we
measured. In Column 5, we show that while existing IT talent in the work force is positively associated
with firm equity (Tambe & Hitt, 2013b), we find that the interaction between IT skills and Facebook is
not. This is exactly the opposite of the complementarities results we have shown for data analytics skills.
To ensure that IT skills are not subject to measurement error, we explore the interaction between IT skills
and whether the firm has adopted enterprise IT systems such as ERP. As previous studies have shown that
IT skills are complementary to general IT technologies, especially for large enterprise systems (Aral,
Brynjolfsson, & Wu, 2012; Brynjolfsson et al., 2002), we would expect the same positive interaction
between IT skills and IT systems. Indeed, we show that IT skills continue to be a strong complement to
ERP (column 6 and 7), conforming to earlier studies (Aral et al., 2012). Yet, we continue to observe that
IT skills are not complementary to social media. These results suggest that our measurement of IT skills
is likely to be correct and that skills in data analytics are distinct from IT and have different effects
depending on the technologies. In Column 8, we include the Facebook, data analytics skills, ERP and IT
skills in the model. Again we observe the same complementarities: 1) IT skills are complement to
traditional IT systems, such as ERP and 2) data skills are complement to social media such as Facebook.
These results suggest that data analytics skills are unique in generating complementarities with new types
of technology, such as social media. This new complementarities are distinct from earlier complements
that are found to associated with general information technology investment. To successfully manage and
leverage social media, firms need to adopt a different set of capabilities and complements. The ability to
manage and learn from data has become an important capability for firms to full advantage of social

media. The extent that firms can benefit from social media is largely dependent on whether it has existing
data analytics capabilities.
Robustness Checks
Instrumental Variable of Industry Level Data Skills
We primarily employ two ways to identify our results, through carefully identifying possible paths of
reverse causality, selection, or omitted variable biases and as well as using various Haussman type
instruments variables. First, we examine whether the type of firms that chooses to adopt social media may
just naturally find social media useful for their businesses. We identify two categories of firms by their
potential social media presence (as shown in the result section). If selection plays an important role in
detecting the return to using social media, we would expect firms that naturally find social media useful in
engaging customers (large social media presence group) to derive greater value from social media than
firms in the low social presence group. Instead, we find the opposite that firms in small social media
presence category to do better with social media. This results shows that at least the selection by firm’s
propensity to use social media is not the reason behind our results.
Next we explore whether the complementary relationship between social media and data analytics
skills is also subject to reverse causality or general omitted variable biases. If data analytics skills were
simply a proxy for firms’ skills related to general technology and social media were just a proxy for
general technology investment, the complementarities we’ve shown could just be evidence for the general
complementarities between IT investment and IT skills (Tambe & Hitt, 2013a). Instead we find that
general IT skills do not complement social media while data analytics skills still do. Furthermore, we do
not find a positive interaction between general IT skills and social media. Collectively, these results
suggest that the complementary paring between data analytics skills and social media adoption is unique
and distinct from earlier complements associated with IT. Only when firms possess both social media and
have substantial capabilities in handling the data can they maximize their return to using social media.
We are aware that additional unobserved endogeneity concerns can arise. For example, high market
value may signals that the firm is an attractive place to work, especially for workers with data analytics
skills. To address this type of reverse causality issues, we repeated the analysis instrumenting the data
skills in each firm with a Hausman type of instruments that calculates the intensity of data skills in all
firms in the same at 3-digit NAICS level. Specifically, we calculate the number of employees with data
analytics skills in each firm and then average over all these firms that belongs to the same industry.
Presumably, the data analytics skills embodied in other firms in the same industry should be similar to the
data talent in the focal firm, but they should not have any direct effect on firm’s own market value.
Preliminary results using this approach suggest that this measure passes weak instrument tests, and
subsequent 2SLS analysis is similar to our earlier results. We are aware that Facebook adoption can also
be endogenous, and we are in the process of using the same type of Hausman instruments that leverages
the adoption statistics of other firms in the same industry.
Conclusion
In this study, we examine estimate the relationship between social media use, complementary
organizational and industry factors, and firm market value. This work complements prior work on social
media value by expanding the pool of firms, conducting the analysis in a market value framework which
does not require cost estimates to calculate value and can capture long-run benefits (at least those
perceived by outside investors), and developing measures for plausible complementary investments or
capabilities.

Overall our baseline results suggest that social media investments are valuable in general, at least to
the extent that adoption is followed by actual consumer or firm use. Moreover, our measured marginal
benefits of social media appear higher in industries with lower social media presence. Furthermore, we
find support for our core hypothesis – that analytics skills are complementary to social media adoptions.
While we find that data skills and social media use are associated with higher value generally, firms that
combine social media adoption with data skills receive an additional benefit. This benefit is unique to
social media – data skills do not appear to be strongly complementary to other types of IT innovations
such as ERP. The fact that use and low penetration of social media are associated with greater value, and
the contrasting complementarity results between different technologies argue against simple alternative
explanations related to unobserved heterogeneity, and initial instrumental variables estimates confirm our
base results (although these are preliminary and much more needs to be done on this dimension). These
results affirm that investments in social media can create firm value, and provide some insight into the
complementary investments needed to realize this value.
Reference
Agarwal, A., Hosanagar, K., and Smith, M. D. 2011. "Location, location, location: An analysis of
profitability of position in online advertising markets," Journal of Marketing Research (48:6), pp
1057-1073.
Aral, S., Dellarocas, C., and Godes, D. 2013. "Introduction to the special issue-social media and business
transformation: A framework for research," Information Systems Research (24:1), pp 3-13.
Aral, S., Brynjolfsson, E., & Wu, L.2012. Three-way complementarities: Performance pay, human
resource analytics, and information technology. Management science, 58(5), 913-931.
Bapna, R., and Umyarov, A. 2012. "Do your online friends make you pay? A randomized field
experiment in an online music social network," NBER working paper).
Bharadwaj, A. S., Bharadwaj, S. G., and Konsynski, B. R. 1999. "Information technology effects on firm
performance as measured by Tobin's q," Management science (45:7), pp 1008-1024.
Brynjolfsson, E., & Yang, S. 1999. The intangible costs and benefits of computer investments: Evidence
from the financial markets. Paper presented at the Atlanta, Georgia: Proceedings of the
International Conference on Information Systems.

Brynjolfsson, E., Hitt, L., and Kim, H. 2011. "Strength in Numbers: How Does Data-Driven
Decisionmaking Affect Firm Performance?," Available at SSRN: http://ssrn.com/abstract
=1819486.
Brynjolfsson, E., Hitt, L. M., and Yang, S. 2002. "Intangible assets: Computers and organizational
capital," Brookings papers on economic activity (2002:1), pp 137-198.
Chen, C., and Chellappa, R. 2009. "Music sales and online user activity at social networking sites,"
Citeseer.
Chevalier, J. A., and Mayzlin, D. 2006. "The effect of word of mouth on sales: Online book reviews,"
Journal of marketing research (43:3), pp 345-354.
Chung, Sunghun and Animesh, Animesh and Han, Kunsoo and Pinsonneault, Alain, Firms' Social Media
Efforts, Consumer Behavior, and Firm Performance: Evidence from Facebook (June 10, 2014).
Available at SSRN: http://ssrn.com/abstract=2448510
Dellarocas, C., Zhang, X. M., and Awad, N. F. 2007. "Exploring the value of online product reviews in
forecasting sales: The case of motion pictures," Journal of Interactive marketing (21:4), pp 23-45.
Divol, R., Edelman, D., and Sarrazin, H. 2012. "Demystifying social media," McKinsey Quarterly (2:12),
pp 66-77.
Duan, W., Gu, B., and Whinston, A. B. 2008. "Do online reviews matter?—An empirical investigation of
panel data," Decision Support Systems (45:4), pp 1007-1016.
Forman, C., Ghose, A., and Wiesenfeld, B. 2008. "Examining the relationship between reviews and sales:
The role of reviewer identity disclosure in electronic markets," Information Systems Research
(19:3), pp 291-313.
Fosfuri, A., and Giarratana, M. S. 2009. "Masters of War: Rivals' Product Innovation and New
Advertising in Mature Product Markets," Management Science (55:2), pp 181-191.
Ghose, A., and Han, S. P. 2011. "An empirical analysis of user content generation and usage behavior on
the mobile Internet," Management Science (57:9), pp 1671-1691.
Ghose, A., Ipeirotis, P. G., and Li, B. 2012. "Designing ranking systems for hotels on travel search
engines by mining user-generated and crowdsourced content," Marketing Science (31:3), pp 493-
520.
Goh, K.-Y., Heng, C.-S., and Lin, Z. 2013. "Social media brand community and consumer behavior:
Quantifying the relative impact of user-and marketer-generated content," Information Systems
Research (24:1), pp 88-107.
Hall, B. H., Jaffe, A., and Trajtenberg, M. 2005. "Market value and patent citations," RAND Journal of
economics), pp 16-38.
Hitt, L. M., & Brynjolfsson, E. 1996. Productivity, business profitability, and consumer surplus: three
different measures of information technology value. MIS quarterly, 121-142.
Kumar, V., Bhaskaran, V., Mirchandani, R., & Shah, M. (2013). Practice Prize Winner—Creating a
Measurable Social Media Marketing Strategy: Increasing the Value and ROI of Intangibles and
Tangibles for Hokey Pokey. Marketing Science, 32(2), 194-212.
Lang, L. H., and Stulz, R. M. 1993. "Tobin's q, corporate diversification and firm performance," National
Bureau of Economic Research.
Li, X., and Wu, L. 2014. "Herding and Social Media Word-of-Mouth: Evidence from Groupon,"
Available at SSRN: http://ssrn.com/abstract=2264411.
Luo, X., Zhang, J., and Duan, W. 2013. "Social media and firm equity value," Information Systems
Research (24:1), pp 146-163.
McAfee, A. 2002. "The impact of enterprise information technology adoption on operational performance:
an empirical investigation," Production and operations management (11:1), pp 33-53.
Miller, A. R., and Tucker, C. 2013. "Active social media management: the case of health care,"
Information Systems Research (24:1), pp 52-70.
Pennings, J. M., and Harianto, F. 1992. "Technological networking and innovation implementation,"
Organization Science (3:3), pp 356-382.
Rishika, R., Kumar, A., Janakiraman, R., and Bezawada, R. 2013. "The effect of customers' social media
participation on customer visit frequency and profitability: an empirical investigation,"
Information systems research (24:1), pp 108-127.
Tambe, P., Hitt, L. M., and Brynjolfsson, E. 2012. "The extroverted firm: How external information
practices affect innovation and productivity," Management Science (58:5), pp 843-859.
Tambe, P., & Hitt, L. M. (2013a). Job hopping, information technology spillovers, and productivity
growth. Management science, 60(2), 338-355.
Tambe, P., & Hitt, L. M. (2013b). Measuring information technology spillovers. Information Systems
Research, 25(1), 53-71.
Tambe, P. 2014. "Big Data Investment, Skills, and Firm Value," Management Science (60:6), pp 1452-
1469.
Wu, L. and Jin, F. & Hitt, L. M. , Are All Spillovers Created Equal? A Network Perspective on IT Labor
Movements (November 20, 2014). Available at SSRN: http://ssrn.com/abstract=2528762
Zhu, F., and Zhang, X. 2010. "Impact of online consumer reviews on sales: The moderating role of
product and consumer characteristics," Journal of Marketing (74:2), pp 133-148.


Table 1 Facebook Adoption by Industry
Industry
# Facebook Users
# Total Firms
Portion of FB user in Industry
Portion of All FB Users
Durable Manufacturing 362 1,839 19.68% 18.84% Mining 267 1,702 15.69% 13.90%
Finance, Insurance & Real Estate 224 1,681 13.33% 11.66% Non-durable Manufacturing 254 1,492 17.02% 13.22%
Computer, Software 222 904 24.56% 11.56% Services, except Financial 157 691 22.72% 8.17%
Utilities 146 684 21.35% 7.60% Retail Trade 149 420 35.48% 7.76%
Transportation 61 238 25.63% 3.18% Wholesale Trade 35 228 15.35% 1.82%
Public Administration 21 182 11.54% 1.09% Construction 15 79 18.99% 0.78%
Agriculture, Forestry & Fishing 8 31 25.81% 0.42% Total 1,921 10,171 18.89% 100.00%
Table 2 Summary Statistics
Variable Obs. Mean Std. Dev. Min Max Market Value 115,403 4,697.58 27,166.47 0 971,689 Fixed Assets 115,403 2,369.70 13,734.80 0 493,970 Other Assets 115,403 2,452.27 33,987.33 -245,869 2,000,478
Advertising Expense 47,424 113.15 625.36 0 10,924 R&D Expense 30,483 90.36 453.46 0 9,729
Facebook Adoption 115,403 0.07 0.25 0 1 Num_Posts 22,493 3.92 9.19 0 105
Total_length 22,493 1,154.22 2,821.69 0 47,125 Total_likes 22,493 210.14 1,111.41 0 26,718
Total_comments 22,493 34.02 221.35 0 7,281 Total_shares 22,493 24.77 215.31 0 13,748
Total Employees 64,110 74.49 337.41 0 7567 IT Skills 51,846 0.123 0.185 0 1
Data Skills 51,846 0.276 0.252 0 1 Communication Skills 51,846 0.285 0.260 0 1
Marketing Skills 51,846 0.360 0.277 0 1 Consumer Skills 51,846 0.112 0.181 0 1
Other Analytical Skills 51,846 0.278 0.258 0 1

Table 3 Correlations between Main Variables
1 2 3 4 5 6 7 8 9 10 11 12 13 14 15 1.Market Value 1.000 2.Fixed Assets 0.712 1.000 3.Other Assets 0.895 0.609 1.000 4.Advertising Expense 0.762 0.799 0.756 1.000 5.R&D Expense 0.850 0.610 0.843 0.644 1.000 6.Facebook Adoption 0.120 0.114 0.090 0.114 0.094 1.000 7.Num_Posts 0.094 0.030 0.074 0.037 0.074 0.658 1.000 8.Total_length 0.127 0.043 0.099 0.039 0.101 0.630 0.949 1.000 9.Total_likes 0.151 0.147 0.076 0.140 0.093 0.359 0.504 0.429 1.000 10.Total_comments 0.115 0.124 0.041 0.083 0.066 0.265 0.343 0.317 0.606 1.000 11.Total_shares 0.056 0.031 0.031 0.028 0.041 0.145 0.217 0.192 0.462 0.190 1.000 12. Total Employees 0.423 0.509 0.215 0.486 0.107 0.081 0.023 0.029 0.157 0.125 0.016 1.000 13. IT Skills -0.003 -0.033 0.011 -0.063 0.036 -0.024 0.019 0.036 -0.037 -0.046 -0.011 -0.079 1.000 14. Data Skills -0.002 -0.076 0.005 -0.070 0.031 0.003 -0.001 0.017 -0.060 -0.028 -0.025 -0.071 0.283 1.000 15. Total Employees -0.010 -0.074 0.011 -0.089 0.035 -0.028 -0.045 -0.021 -0.114 -0.058 -0.045 -0.100 0.112 0.232 1.000
Note: Measures of skills are normalized by the total number of employees at the firm;

Table 4 Facebook Adoption and Market Value of Firms
dv: market value (1) (2) (3) (4) (5) (6) (7) Sample All FB_user FB_user FB_user FB_user FB_user FB_user Fixed Assets 0.992*** 0.989*** 0.989*** 0.985*** 0.988*** 0.988*** 0.985*** (1.94e-05) (6.98e-05) (6.88e-05) (7.00e-05) (5.05e-05) (5.19e-05) (7.09e-05) Other Assets 0.691*** 0.505*** 0.504*** 0.503*** 0.504*** 0.504*** 0.503*** (7.46e-06) (2.89e-05) (2.85e-05) (2.89e-05) (2.09e-05) (2.15e-05) (2.93e-05) Advertising 0.0321*** 0.126*** 0.128*** 0.117*** 0.0848*** 0.0859*** 0.117*** Expense (0.000964) (0.00420) (0.00414) (0.00421) (0.00301) (0.00310) (0.00426) R&D 0.0861*** 0.393*** 0.390*** 0.369*** 0.362*** 0.366*** 0.364*** Expense (0.000557) (0.00211) (0.00208) (0.00211) (0.00151) (0.00156) (0.00214) Facebook 9.527*** 8.057*** -8.689*** -6.871** -7.291*** -7.358*** -7.520** Adoption (1.035) (2.629) (2.992) (3.041) (2.192) (2.253) (3.078) Num_Posts 20.97*** 9.450*** 14.20*** 17.18*** 8.813*** (1.201) (1.302) (0.908) (0.922) (0.974) Total _likes 81.21*** (1.071) Total_comments 46.54*** (0.730) Total _shares 48.16*** (0.736) FB_Engagement 78.39*** (1.085) Other Controls Industry,
Quarter, Dummy for
Missing Value
Industry, Quarter,
Dummy for Missing Value
Industry, Quarter,
Dummy for Missing Value
Industry, Quarter,
Dummy for Missing Value
Industry, Quarter,
Dummy for Missing Value
Industry, Quarter,
Dummy for Missing Value
Industry, Quarter,
Dummy for Missing Value
Constant 85.18*** 215.2*** 222.1*** 229.3*** 112.6*** 110.4*** 231.4*** (3.946) (12.82) (12.66) (12.87) (5.923) (13.03) (13.03) Observations 115,403 22,493 22,493 22,493 22,493 22,493 22,493 Notes: i. Column 1 uses all sample; columns 2-7 use only firms that have Facebook page
ii. Num_Posts, Total Likes, Total Comments, Total Shares have been appropriately centralized iii. FB_Engagement is a principle component of Total Likes, Total Comments and Total Shares

iv. Standard errors in parentheses; *** p<0.01, ** p<0.05, * p<0.1
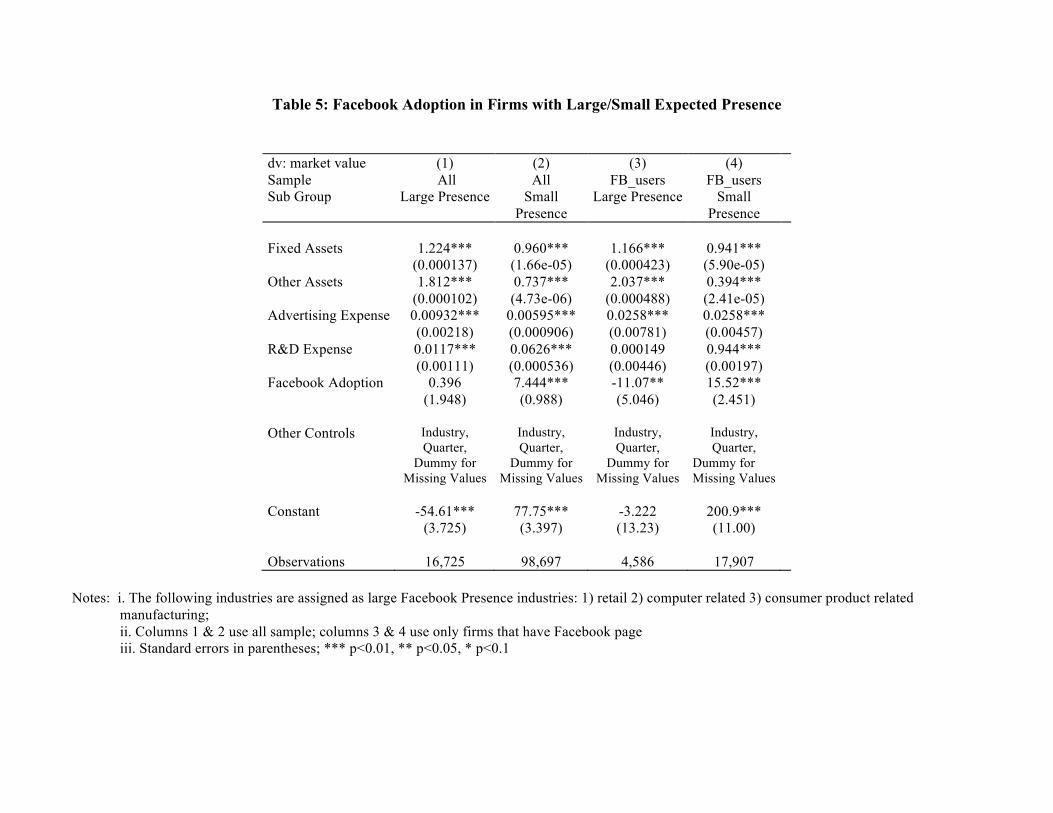
Table 5: Facebook Adoption in Firms with Large/Small Expected Presence
dv: market value (1) (2) (3) (4) Sample Sub Group
All Large Presence
All Small
Presence
FB_users Large Presence
FB_users Small
Presence
Fixed Assets 1.224*** 0.960*** 1.166*** 0.941*** (0.000137) (1.66e-05) (0.000423) (5.90e-05) Other Assets 1.812*** 0.737*** 2.037*** 0.394*** (0.000102) (4.73e-06) (0.000488) (2.41e-05) Advertising Expense 0.00932*** 0.00595*** 0.0258*** 0.0258*** (0.00218) (0.000906) (0.00781) (0.00457) R&D Expense 0.0117*** 0.0626*** 0.000149 0.944*** (0.00111) (0.000536) (0.00446) (0.00197) Facebook Adoption 0.396 7.444*** -11.07** 15.52*** (1.948) (0.988) (5.046) (2.451) Other Controls Industry,
Quarter, Dummy for
Missing Values
Industry, Quarter,
Dummy for Missing Values
Industry, Quarter,
Dummy for Missing Values
Industry, Quarter,
Dummy for Missing Values
Constant -54.61*** 77.75*** -3.222 200.9*** (3.725) (3.397) (13.23) (11.00) Observations 16,725 98,697 4,586 17,907
Notes: i. The following industries are assigned as large Facebook Presence industries: 1) retail 2) computer related 3) consumer product related
manufacturing; ii. Columns 1 & 2 use all sample; columns 3 & 4 use only firms that have Facebook page iii. Standard errors in parentheses; *** p<0.01, ** p<0.05, * p<0.1

Table 6: Skills and Technology Implementation
DV: Market Value (1) (2) (3) (4) (5) (6) (7) (8) Fixed Assets 0.983*** 0.960*** 0.960*** 0.960*** 0.960*** 0.958*** 0.960*** 0.960*** Fixed Assets (0.000226) (0.000182) (0.000188) (0.000198) (0.000193) (0.000208) (0.000196) (0.000203) Other Assets 0.608*** 0.585*** 0.584*** 0.584*** 0.582*** 0.581*** 0.580*** 0.582*** Other Assets (7.85e-05) (6.30e-05) (6.52e-05) (6.85e-05) (6.66e-05) (7.18e-05) (6.73e-05) (7.05e-05) Advertising 0.693*** 0.348*** 0.351*** 0.343*** 0.477*** 0.503*** 0.504*** 0.337*** Advertising Expense (0.0108) (0.00857) (0.00886) (0.00932) (0.00918) (0.00988) (0.00926) (0.00954) Expense R&D Expense 4.430*** 4.217*** 4.182*** 4.185*** 4.174*** 4.176*** 4.171*** 4.175*** R&D Expense (0.00612) (0.00492) (0.00509) (0.00535) (0.00528) (0.00569) (0.00532) (0.00552) Total_Employees 0.995*** 1.002*** 0.965*** 2.453*** 2.400*** 2.396*** 1.819*** Total_Employees (0.0204) (0.0211) (0.0222) (0.0120) (0.0129) (0.0121) (0.0280) Facebook Adoption 60.24*** 86.94*** 80.89*** -15.97 -13.19 67.77*** Facebook Adoption (16.19) (12.85) (13.95) (13.66) (13.78) (14.30) ERP Adoption 193.1*** -288.5*** -294.2*** 167.2*** 154.9*** -331.4*** ERP Adoption (8.505) (36.77) (38.64) (37.76) (35.61) (43.89) IT_skills 752.5*** 328.8* 416.8** -771.3*** IT_skills (5.218) (173.8) (163.9) (194.9) Facebook Adoption -292.5*** -266.6*** -752.0*** Facebook Adoption × IT_skills (12.28) (12.39) (21.98) × IT_skills ERP Adoption 400.5** 344.1** 1,454*** ERP Adoption × IT_skills (173.8) (163.9) (195.1) × IT_skills Data_skills 1,205*** 2,685*** 2,693*** 3,222*** Data_skills (8.732) (151.6) (159.3) (188.1) Facebook Adoption 216.4*** 237.8*** 787.3*** Facebook Adoption × Data_skills (11.10) (12.13) (21.36) × Data_skills ERP Adoption -1,483*** -1,504*** -2,928*** ERP Adoption × Data_skills (151.4) (159.1) (187.9) × Data_skills Other Controls Industry,
Quarter, Dummy for
Missing Values
Industry, Quarter,
Dummy for Missing Values
Industry, Quarter,
Dummy for Missing Values
Industry, Quarter,
Dummy for Missing Values
Industry, Quarter,
Dummy for Missing Values
Industry, Quarter,
Dummy for Missing Values
Industry, Quarter,
Dummy for Missing Values
Industry, Quarter,
Dummy for Missing Values
Other Controls
Constant 662.1*** 820.1*** 784.8*** 801.3*** 791.2*** 1,177*** 1,174*** 1,151*** Constant (74.26) (62.43) (76.59) (71.91) (56.56) (68.42) (71.89) (76.11) Observations 32,380 32,380 32,380 32,380 32,380 32,380 32,380 32,380 Observations
Notes: i. ERP adoption is a 0/1 variable, defined as having at least one employee having reported using ERP systems during employment at the given firm; ii. Each type of skills is represented by the total number of employees with the reported skill at the firm; iii. Data skills are identified as data-centric software skills and data mining skills iv. Standard errors in parentheses; *** p<0.01, ** p<0.05, * p<0.1

Table 7. IV with Industry Level Controls for Data Skill
(1) (2) (3)
Stage: 1st 1st 2nd DV: Data_skills FB×Data_skills Market Value Fixed Assets 2.11e-06*** -7.25e-07*** 1.033*** (1.30e-07) (1.47e-07) (0.0278) Other Assets 9.11e-07*** 1.44e-07** 0.323*** (6.66e-08) (6.11e-08) (0.0129) Advertising Expense -7.16e-05*** 6.58e-06 6.035*** (5.65e-06) (7.41e-06) (1.061) R&D Expense 0.000110*** -2.40e-06 12.76*** (3.20e-06) (4.33e-06) (0.864) Total_Employees 0.00216*** 0.000229*** 76.47*** (5.52e-06) (2.86e-05) (6.527) Facebook Adoption -0.00311 0.0930*** -2,839** (0.00851) (0.0196) (1,220) ERP Adoption 0.0396*** 0.00874*** 3,329*** (0.00447) (0.00243) (278.2) Data_skills -38,894*** (3,673) Facebook Adoption 33,806*** × Data_skills (8,423) Data_skills (Industry) 0.0347*** 0.000817 (0.00237) (0.000772) Facebook Adoption 0.0607*** 0.0721*** × Data_skills (Industry) (0.00839) (0.0206) Other Controls Industry,
Quarter, Dummy for
Missing Values
Industry, Quarter,
Dummy for Missing Values
Industry, Quarter,
Dummy for Missing Values
Constant -0.278*** -0.0261*** -8,067*** (0.0133) (0.00411) (1,055) Observations 32,281 32,281 32,281 R-squared 0.853 0.111 0.432
Notes: Used 2SLS for this table, excluded outliers; Industry clusters are defined using 3 digit NAICS code; Data_skills (Industry) measure for each firm is the estimated total number of workers with data skills in each industry, not counting those employed by the firm itself;

31