Who are the persistently NEET young people - files.eric.ed.gov · PO Box 8288 Station Arcade,...
56
RESEARCH REPORT Who are the persistently NEET young people? John Stanwick Cameron Forrest Peta Skujins National Centre for Vocational Education Research
Transcript of Who are the persistently NEET young people - files.eric.ed.gov · PO Box 8288 Station Arcade,...

RESEARCH REPORT
Who are the persistently NEET young people?
John Stanwick Cameron Forrest Peta Skujins National Centre for Vocational Education Research

Publisher’s note
The views and opinions expressed in this document are those of the author/project team and do not necessarily reflect
the views of the Australian Government, or state and territory governments. Any interpretation of data is the
responsibility of the author/project team.
Additional information relating to this research is available in Who are the persistently NEET young people? — literature
overview support document. It can be accessed from NCVER’s Portal <http://www.ncver.edu.au>.
To find other material of interest, search VOCEDplus (the UNESCO/NCVER international database
<http://www.voced.edu.au>) using the following keywords: demographics; dropout; outcomes; participation; policy
implications; unemployed; unemployment; youth; youth at risk; and youth transitions.
© Commonwealth of Australia, 2017
With the exception of cover design, artwork, photographs, all logos, and any other material where copyright is owned by
a third party, all material presented in this document is provided under a Creative Commons Attribution 3.0 Australia
<http://creativecommons.org/licenses/by/3.0/au>.
This document should be attributed as Stanwick, J, Forrest, C & Skujins, P 2017, Who are the persistently NEET young
people?, NCVER, Adelaide.
NCVER is an independent body responsible for collecting, managing and analysing, evaluating and
communicating research and statistics about vocational education and training (VET).
NCVER’s inhouse research and evaluation program undertakes projects which are strategic to the
VET sector. These projects are developed and conducted by NCVER’s research staff and are
funded by NCVER. This research aims to improve policy and practice in the VET sector.
COVER IMAGE: GETTY IMAGES/iStock
ISBN 978-1-925173-97-0
TD/TNC 129.15
Published by NCVER, ABN 87 007 967 311
Level 5, 60 Light Square, Adelaide SA 5000
PO Box 8288 Station Arcade, Adelaide SA 5000, Australia
Phone +61 8 8230 8400 Email [email protected]
Web <https://www.ncver.edu.au> <http://www.lsay.edu.au>
Follow us: <https://twitter.com/ncver> <https://www.linkedin.com/company/ncver>

About the research Who are the persistently NEET young people?
John Stanwick, Cameron Forrest, Peta Skujins, NCVER
Of enduring policy interest and concern are the transitions of young people from school to further education
and the labour market. Young people represent the future workforce of this country so it is of great interest
that young people make successful transitions. However, they do not all make these successful transitions
and for some this may result in poorer outcomes later in life.
Using data from the Longitudinal Surveys of Australian Youth (LSAY), this investigation focussed on the
group of young people not in education, employment or training (NEET), which is seen as a key indicator
internationally of youth disengagement — and more specifically on those people who are NEET for longer
periods of time, six or more months continuously, referred to as persistently NEET. While many young
people experience episodes of being NEET in their early post-schooling years as they make their transition
from education to the world of work, there is a small, more vulnerable group who experience periods of
being persistently NEET.
It is argued that this group may represent those who are more at risk of poorer outcomes in the longer term
than those who spend fleeting amounts of time being NEET; recognising that even within the more
contained group of the persistently NEET there will be some who are not as vulnerable. Clearer information
on this group of young people can help to develop nuanced policy responses that cater for the diverse
individual and also broader labour market and institutional circumstances facing them. There is a need to
better characterise this vulnerable group of young people in order to help target early and effective policy
interventions.
This research investigates the incidence of being persistently NEET among those aged 15—24, the socio-
demographic characteristics associated with the NEET state, and the outcomes at ages 20—24 for those who
had one or more periods of being persistently NEET from ages 15 through to 19, as compared to their not
persistently NEET counterparts.
Key messages
� Persistently NEET status is shown to be correlated with non-completion of year 12; having a child; and to
some degree coming from a more disadvantaged background.
� There are some observed gender differences in the activities of the persistently NEET with males being
more likely than females to be unemployed.
� The largest single activity for females with persistently NEET status and not in the labour force, was
home duties or caring for children, whereas for males there was a variety of activities.
� Persistent NEET status at ages 15—19 is associated with further persistent NEET spells at ages 20—24. It
is also associated with poorer education outcomes by age 24.
� Labour market conditions at the time that young people are transitioning from school to work can also
impact on the probability of being persistent NEET. There is evidence that the Global Financial Crisis
had an impact but differentially for those who were 18 at the time the effects were felt and those who
were 21 at the time. This reflects their different underlying life stage dynamics.
Craig Fowler
Managing Director, NCVER

Who are the persistently NEET young people?

NCVER 5
Contents
Executive summary 8
Introduction 12
Literature overview 14
Data and methodology 17
Data source 17
Definition and derivation of persistently NEET 17
Analysis for this paper 19
Data considerations and limitations 21
Findings 23
Composition of the sample 23
Demographic and other characteristics breakdown 25
Main activities of the persistently NEET group 29
Longer-term outcomes of being persistently NEET during the ages of 15–19 35
Discussion and conclusions 38
References 41
Appendix A: What constitutes persistently NEET? 42
Appendix B: Attrition analysis 43
For the Y03 survey 43
For the Y06 survey 43
Appendix C: Detailed results 45
Appendix D: Main activities for the persistently NEET by gender 51

Who are the persistently NEET young people?
Tables and figures
Tables 1 Numbers and proportions of the Y03 and Y06 cohorts who were
never NEET, ever NEET and persistently NEET 23
2 Months and proportion of time spent NEET 25
3 Socio-demographic characteristics for the whole sample (%) 26
4 Socio-demographic description of the persistently NEET groups (%) 27
5 Likelihood of being persistently NEET by selected demographics (%) 28
6 Summary of main activities for the persistently NEET group not in
the labour force by gender, and proportions unemployed —
numbers summed across waves (%) 30
7 Wave by wave activity for those in a persistently NEET block at
interview point for the Y03 cohort 32
8 Wave by wave activity for those in a persistently NEET block at
interview point for the Y06 cohort 33
9 Summary table of odds ratios for three outcome variables for the
15–19 years persistently NEET group 35
C1 Associations between the wave 2 sample and those still present in
wave 10 by socio-demographic characteristics 45
C2 Associations between socio-demographic characteristics and
persistently NEET status for those still in the survey at wave 10 45
C3 Associations between socio-demographic characteristics and
persistently NEET status between the ages of 15 and 19 for those
still in the survey at wave 10 45
C4 Logistic regression results for the likelihood of being persistently
NEET at any time by socio-demographic characteristics for the Y03
cohort 46
C5 Logistic regression results for the likelihood of being persistently
NEET at any time by socio-demographic characteristics for the Y06
cohort 46
C6 Logistic regression results for the likelihood of being persistently
NEET at ages 15—19 by socio-demographic characteristics for the
Y03 cohort 47
C7 Logistic regression results for the likelihood of being persistently
NEET at ages 15—19 by socio-demographic characteristics for the
Y06 cohort 47
C8 Logistic regression results for the likelihood of being persistently
NEET at ages 20—24 for those who were early persistently NEET for
the Y03 cohort 48

NCVER 7
C9 Logistic regression results for the likelihood of being persistently
NEET at ages 20—24 for those who were early persistently NEET
for the Y06 cohort 48
C10 Logistic regression results for the likelihood of studying for or
achieving a certificate III or higher by age 24 for those who were
early persistently NEET for the Y03 cohort 49
C11 Logistic regression results for the likelihood of studying for or
achieving a certificate III or higher by age 24 for those who were
early persistently NEET for the Y06 cohort 49
C12 Logistic regression results for the likelihood of being in
employment at age 24 for those who were early persistently NEET
for the Y03 cohort 50
C13 Logistic regression results for the likelihood of being in
employment at age 24 for those who were early persistently NEET
for the Y06 cohort 50
D1 Wave-by-wave activity for females who were in a persistently
NEET block at interview point for the Y03 cohort 51
D2 Wave-by-wave activity for males who were in a persistently NEET
block at interview point for the Y03 cohort 52
D3 Wave-by-wave activity for females who were in a persistently
NEET block at interview point for the Y06 cohort 53
D4 Wave-by-wave activity for males who were in a persistently NEET
block at interview point for the Y06 cohort 54
Figures Figure 1 Factors considered in the derivation of the NEET status 18

8 Who are the persistently NEET young people?
Executive summary The journey of young people immediately post-secondary schooling is of significant
interest for policy makers, the wider community and students and their parents. While it
is commonly accepted that many young people may experience a short period of not being
in education, employment or training (NEET) as a normal part of their transition from
school to work and/or further education, of more concern are those individuals who
experience 6 or more months of NEET continuously and are considered in this report as
persistently NEET.
This group of persistently NEET young people are seen as being at risk of not making
successful transitions to the labour market and having poorer employment and other
outcomes later on. As a consequence, understanding the underpinning reasons that
contribute to individuals being persistently NEET and the potential long term impacts are
of significant interest as governments strive to develop and implement informed policy
and programs that can support young people to prepare for life post–school.
This report provides a greater level of insight into the issues that contribute to
persistently NEET with a focus on young people aged between 15 and 24.
The research explores:
� what socio-demographic characteristics are associated with being persistently NEET?
� what are the activities of the persistently NEET group of young people?
� what are the outcomes of those who have a persistently NEET period(s) at ages 15
through to 19 in terms of likelihood of:
- persistently NEET period(s) between the ages of 20 and 24
- studying for or completing a certificate III or above qualification by age 24
- being employed at age 24?
The Longitudinal Surveys of Australian Youth (LSAY) survey students aged 15—25 as they
transition from school to work. LSAY provides significant and nationally representative
information about young people and their education, training, work, financial matters,
health, social activities, and related issues. For this research, data were analysed for two
cohorts of LSAY: 15 year olds who began the survey in 2003 and 15 year olds who began in
2006 (known as the Y03 and Y06 cohorts respectively). However, due to data availability
for the Y06 cohort at the time of the analysis, only the first ten sample years were
analysed; that is, when the cohorts were approximately 24 years of age. Furthermore,
limitations to the data limit the generalisability of the results for this study, but
nevertheless provide useful insights.

NCVER 9
The size and socio-demographic characteristics of the group
In considering the extent of being persistently NEET across all the survey months, 6.7% of
the Y03 cohort and 11.7% of the Y06 cohort had a persistently NEET period(s) (including
those that dropped out of the survey at some point). There were clearly higher
proportions of the survey sample that experienced a persistently NEET period(s) in the Y06
cohort as compared to the Y03 cohort with a proportional 5% increase in the Y06 cohort.
When the analysis focussed on a more restricted period of time, when survey respondents
were aged 15 through to 19 (‘early’ NEET), the same trend in persistently NEET period(s)
is apparent: 1.8% of the Y03 cohort and 6.5% of the Y06 cohort.
For participants who stayed throughout the duration of the survey, there were even higher
proportions that had a persistently NEET period(s) at any time — 10.7% for the Y03 cohort
and 17.1% for the Y06 cohort.
There could be a range of reasons contributing to the increase in persistently NEET across
the two cohorts. However, other research (Carcillo et al, 2015) has indicated that there
was an increase in NEET in OECD countries following the Global Financial Crisis (GFC), and
there is a high likelihood that the GFC is a high contributing factor to the observed
increase in persistent NEET in the Y06 cohort.
The key socio-demographic characteristics identified from the samples that were clearly
associated with being persistently NEET included:
� not completing year 12
� having children
� to some degree, coming from a more disadvantaged background.
The main socio-demographic characteristics can be used as predictors when examining
longer term outcomes. The analysis indicates that the characteristics hold true across both
the Y03 and Y06 cohorts and also whether individuals had a persistently NEET period at
any time during the survey or at ages 15 through to 19 (the early persistently NEET group).
In addition, the socio-demographic distributions of those who were persistently NEET in
the Y03 cohort were more skewed, in comparison to the Y06 cohort, towards the lowest
index of economic, social and cultural status (ESCS ) quartile, non-completion of year 12
schooling (particularly for the early persistently NEET), having children, being female and
coming from a regional location. This is a possible effect of the GFC whereby it has
affected young people who were aged 18, and at a critical period in their transition from
school to work or further study, more evenly.
The main activities of the persistently NEET group
Information on activities for those not in the labour force and those who were unemployed
was collected at the time of LSAY interviews. Analysis affords insight into the types of
activities being undertaken by the persistently NEET group and provides a further
dimension to the exploration of the socio-demographic characteristics. In considering the
10 Who are the persistently NEET young people?
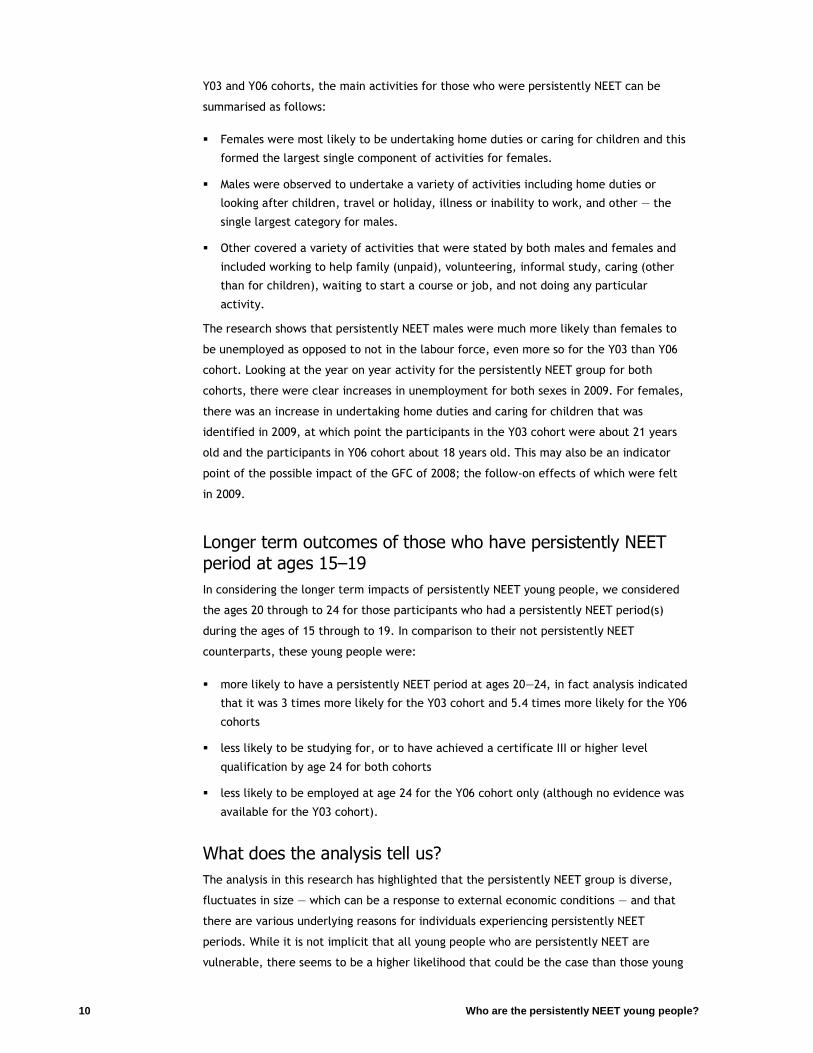
Y03 and Y06 cohorts, the main activities for those who were persistently NEET can be
summarised as follows:
� Females were most likely to be undertaking home duties or caring for children and this
formed the largest single component of activities for females.
� Males were observed to undertake a variety of activities including home duties or
looking after children, travel or holiday, illness or inability to work, and other — the
single largest category for males.
� Other covered a variety of activities that were stated by both males and females and
included working to help family (unpaid), volunteering, informal study, caring (other
than for children), waiting to start a course or job, and not doing any particular
activity.
The research shows that persistently NEET males were much more likely than females to
be unemployed as opposed to not in the labour force, even more so for the Y03 than Y06
cohort. Looking at the year on year activity for the persistently NEET group for both
cohorts, there were clear increases in unemployment for both sexes in 2009. For females,
there was an increase in undertaking home duties and caring for children that was
identified in 2009, at which point the participants in the Y03 cohort were about 21 years
old and the participants in Y06 cohort about 18 years old. This may also be an indicator
point of the possible impact of the GFC of 2008; the follow-on effects of which were felt
in 2009.
Longer term outcomes of those who have persistently NEET period at ages 15–19
In considering the longer term impacts of persistently NEET young people, we considered
the ages 20 through to 24 for those participants who had a persistently NEET period(s)
during the ages of 15 through to 19. In comparison to their not persistently NEET
counterparts, these young people were:
� more likely to have a persistently NEET period at ages 20—24, in fact analysis indicated
that it was 3 times more likely for the Y03 cohort and 5.4 times more likely for the Y06
cohorts
� less likely to be studying for, or to have achieved a certificate III or higher level
qualification by age 24 for both cohorts
� less likely to be employed at age 24 for the Y06 cohort only (although no evidence was
available for the Y03 cohort).
What does the analysis tell us?
The analysis in this research has highlighted that the persistently NEET group is diverse,
fluctuates in size — which can be a response to external economic conditions — and that
there are various underlying reasons for individuals experiencing persistently NEET
periods. While it is not implicit that all young people who are persistently NEET are
vulnerable, there seems to be a higher likelihood that could be the case than those young

NCVER 11
people who have less than six months of continuous NEET. These may include those of the
group who have not completed year 12 schooling and those who have children under the
age of 20 (which may be not in the labour force or unemployed). There are others in this
group that warrant attention including those who are disengaged (which is difficult to
separate out from our analyses), and some of those who are unavailable for work.
In terms of the role of Vocational Education and Training, it can provide an important
pathway for some persistently NEET young people to gain further skills in addition to other
community support to enable them in gaining meaningful and long-term employment
and/or training.

12 Who are the persistently NEET young people?
Introduction
A key indicator of youth disengagement internationally is the status ‘not in education,
employment or training’ (NEET), an indicator also of considerable interest from a policy
perspective. Young people in this group are often considered an ‘at risk’ group, the
argument being that they are less likely to possess the skills and experience for a
successful future transition into employment and further education, and are more likely to
have poorer employment and other outcomes later in life. Consequently, various policy
responses have been developed for this group of young people, with the aim of enabling
them to re-establish contact with education and training and the labour market.
As a group, however, young people who are NEET at a point in time are characterised by a
very broad range of circumstances and cannot be considered a homogenous group. Indeed,
it is quite normal for young people to be NEET at some period during their transition from
education into the labour market. This could include a period of unemployment between
finishing education and starting a job, taking time off to travel (for example, a gap year),
spending time volunteering instead of working for pay, or undertaking unpaid caring
duties. Many of these young people are NEET for only short periods of time and are
generally not at risk.
Other young people, however, are NEET for longer periods of time, and included in this
group are those who are likely to be at risk and facing long-term disadvantage. There is
value, then, in looking at those who face being NEET for longer periods of time, or what
can be termed, ‘persistently NEET’. For the purposes of this paper, ‘persistently NEET’ is
defined as being NEET for a period of six consecutive months or longer.
This paper also has a particular interest in those who are persistently NEET at some stage
during the ages of 15—19, as these young people are more likely to be vulnerable. We are
also interested in the changing labour market conditions of young people (such as the
effect of the Global Financial Crisis [GFC]) and examine two cohorts of young people three
years apart.
The questions examined in this research are:
� what socio-demographic characteristics are associated with being persistently NEET?
� what are the activities of the persistently NEET group of young people?
� what are the outcomes of those who have a persistently NEET period(s) at ages 15—19
in terms of their likelihood of:
- experiencing persistently NEET period(s) between the ages of 20 and 24 years
- studying for or completing a certificate III or above qualification by age 24 years
- being employed at age 24 years?
The Longitudinal Surveys of Australian Youth (LSAY), which follow young people aged 15—
251, are used as the primary source of data for this paper. Two cohorts of LSAY were used
1 Although for this paper the analyses are conducted until they were 24 years of age.

NCVER 13
for the analyses: 15-year-olds who began the survey in 2003 and 15-year-olds who began in
2006 (known as the Y03 and Y06 cohorts respectively).
The paper is structured as follows. The next section provides an overview of the research
on young people who are NEET. Following this is an explanation of the main
methodological approach for this paper. The next section looks at the main findings from
the analysis. The paper finishes with some concluding observations.

14 Who are the persistently NEET young people?
Literature overview
This section highlights some of the main themes identified from previous research in this
area to inform the current study. A more comprehensive overview can be found in the
support document.
Over the last two decades, identifying NEET young people has become one of the key
indicators for youth, the concept originating in the United Kingdom due to changes to the
unemployment benefit scheme in 1988 (Furlong 2006).
There is considerable discussion about the merits of the term ‘NEET’ in relation to its
usefulness as an indicator. In a summary of the various arguments, Furlong (2006)
identifies the strengths and weaknesses of using the term as an indicator. While the
strength is that NEET can be used as a predictor of future vulnerability (even though it
may contain many who are not really vulnerable), a core weakness is that it might not
capture the target group and so is of limited usefulness in terms of cohort-specific policy.
For example, there are many young people in uncertain or precarious employment
situations who may also have low levels of educational achievement. These young people
are vulnerable but not classified as being NEET. In contrast, there are those classified as
NEET who may be undertaking meaningful activities. Anlezark (2011b) indicates that such
young people could be stigmatised by the term.
Variations in definitions of the term are to be found across countries. Elder (2015)
provides excerpts from ten definitions of the term NEET from various sources, all of which
differ on some detail.
Following on from this, the group of NEET young people is heterogeneous. It is
heterogeneous in terms of some being not in the labour force (NILF) and some being
unemployed. Some within the NILF category are undertaking a variety of activities such as
caring, travelling or volunteering, while some may be ill or have a disability. Hence the
circumstances of young people within this categorisation can be quite different and, as
highlighted above, some are more vulnerable than others. An alternative approach to
viewing the heterogeneity of the group is achieved by examining the socio-demographic
characteristics of the young people more likely to be NEET, such as early school leavers,
and those who had children at a young age.2 Taking account of the heterogeneity of the
group is important in terms of formulating targeted policy responses.
Most data on NEET young people are presented as ‘snapshot’ figures; that is, they are
taken at a point in time and do not reflect the length of time a person has held NEET
status. However, many of those who hold this status do so for a short period of time; it is
quite normal for young people to have some period of NEET (Quintini, Martin & Martin
2007). It can therefore be argued that looking at longer periods of NEET can be more
useful, given that those who are NEET for longer are more likely to be vulnerable (see, for
example, Bynner & Parsons 2002; Furlong 2006). In addition, the New Zealand Ministry of
Business, Innovation and Employment (2013) in a study of that country found that the 12—
2 To clarify for the purposes of the remainder of the report, what we mean is they became parents at an
early age, as opposed to had children living with them.

NCVER 15
14% of 18 to 24-year-olds in their sample who experienced a long-term NEET period in a
given year represented more than 70% of all NEET days for their age group. Accordingly,
attention to this group is seen as warranted.
Long-term NEET can be defined various ways — there is no one ‘correct way’. However,
Furlong (2006) in his study used six or more months continuously NEET, with the rationale
that this is the qualifying time for 18-year-olds in the UK’s ‘New Deal for Young People’
program and may indicate difficulties. The New Zealand Ministry of Business, Innovation
and Employment (2013) used the same qualifying period: 26 weeks (or six months)
continuously NEET in their study. This paper adopts the same approach — six or more
consecutive months as NEET — as the definition of persistently NEET. More detail on the
selection of the figure of six or more consecutive months in our study is presented in
appendix A.
Some studies, mainly overseas, have looked at the long-term NEET group, and these
studies are described in the support document. While these studies used different
definitions of what constitutes long-term NEET, as well as looking at it across different age
and time periods, all of them found a sub-group of young people in their samples who
experienced periods of being long-term NEET. Several of these studies also examined the
socio-demographic characteristics of those who were long-term NEET, the most common
characteristic identified being low educational achievement/early school leaving (for
example, Social Exclusion Unit, 1999; Bynner & Parsons, 2002; OECD, 2016). In some
studies, however, socio-economic disadvantage was also found to be associated with long-
term NEET (Social Exclusion Unit, 1999; Furlong, 2006; New Zealand Ministry of Business,
Innovation & Employment, 2013), as were low levels of parental education (OECD, 2016),
being a parent, including teenage parenting (Ranzani & Rosati, 2013; New Zealand Ministry
of Business, Innovation & Employment, 2013) and being female (OECD, 2016).
Some of these studies examined the outcomes of those long-term NEET (by comparison
with their non-long-term NEET counterparts). These found that those who were long-term
NEET were also more likely to be NEET later on and have poorer employment outcomes at
some designated time in the future (Crawford, 2011; Ranzani & Rosati, 2013; New Zealand
Ministry of Business, Innovation & Employment, 2013; Samoilenko & Carter, 2015). A
couple of the studies additionally looked at further study outcomes. While one of these
(New Zealand Ministry of Business, Innovation & Employment, 2013) found poorer
outcomes for the long-term NEET group in terms of further study, the other (Samoilenko &
Carter, 2015) found no difference between the two groups. This study also found that the
long-term NEET group was more likely to be in receipt of benefits in the future. However,
these two studies also found some convergence in outcomes between the NEET and non-
NEET groups at a later time. Those who were NEET while young (at ages 15—17) seemed to
be most at risk of poor outcomes.
It is important to note that the size and nature of the NEET group needs to be examined in
the context of the young person’s broader circumstances. These include labour market
and economic conditions and the country’s education system, as well as a variety of other
factors, including the absolute size of the youth cohort.
While noting that a variety of factors affect the size and composition of the group, one of
the important factors of relevance to this study was the 2008 GFC. While its effects in
Australia were less substantial than in some other countries (see, for example, Carcillo et

16 Who are the persistently NEET young people?
al. 2015), there nevertheless were effects in terms of decreases in full-time employment
and increases in unemployment. This is particularly so for young people aged 15—24 years.
The GFC also affected the size of the NEET groups. In addition to an increase in the
number unemployed, there was also an increase in those not in the labour force (or
inactive). Carvalho (2015) also notes that within the overall group of young people, the
15—19 and 20—24 years age groups should be viewed differently in terms of labour market
dynamics and life stages (moving from full-time education and training to work), and so
require different policy responses.
A review of the literature indicates that the examination of the group of young people
who are NEET for longer periods of time is warranted. Little empirical research has been
undertaken in this area in Australia (apart from Hillman 2005 and OECD 2016, for
example). The current study, therefore, uses LSAY data to investigate the incidence,
socio-demographic characteristics, activities and outcomes of those who are NEET for six
or more consecutive months (referred to in this paper as ‘persistently NEET’).

NCVER 17
Data and methodology
This section discusses the data used for the analysis in this report, including the derivation
of persistently NEET, as well as the methods used for the analysis.
Data source
LSAY datasets (specifically the 2003 and 2006 cohorts, known as Y03 and Y06 respectively)
were used to undertake the analysis. LSAY surveys nationally representative cohorts of
young people from ages 15 through to 25 years, with interviews taking place annually.
(The collection of information at these points is known as a wave, so, for example, the
collection of data in the second year of the survey is known as wave 2.) Since 2003, the
samples for LSAY have been based on the sample for the Programme for International
Student Assessment (PISA). The PISA sample has certain exclusions, which include 15-year-
olds who are home-schooled or are between schools, in a non-educational institution, have
a disability that prevents them completing the test, left school prior to the age of 15,
have low English language ability, and are in very remote areas not easily accessed.
Similarly, these people are excluded from LSAY.
LSAY covers a large range of topics, including schooling, post-school education and
training, and transitions into the labour market, as well as aspirations, satisfaction with
various aspects of life and the young person’s personal circumstances.
The analysis in this paper examines persistently NEET up to wave 10, when respondents
were aged about 24 years. The final wave of data for Y06, when the young person would
be aged about 25 years, was not available at the time of the analysis for this report. For
consistency therefore the same range is used for the Y03 cohort. The analysis of
persistently NEET begins from January of the year for wave 2 of the survey (when most
respondents were aged 16 years), since by definition no one in the sample was NEET at the
time of wave 1 of the survey (as they were all at school). However, for the purposes of
this paper it is still relevant to refer to the 15 to 19-years age category (rather than the 16
to 19-years age category). In addition, not all respondents are exactly the same age at
each wave but most respondents were aged 15 years in wave 1, 16 in wave 2 and so forth.
Definition and derivation of persistently NEET
For this project, six or more months of consecutive NEET is used as the definition of
persistently NEET.3 The rationale for using this particular definition of persistently NEET is
contained in appendix A.
In describing the sample in the findings section of this paper, we quantify those who were
never NEET (including those not known to be NEET) during the sample period (and so
‘engaged’4 in every month of the survey), as well as those who were NEET on some
3 This six month or longer block does not have to encompass the interview point in LSAY.
4 Engaged participants are those who undertake some formal education or training, or who work for pay
(that is, are employed). This education, training or employment does not need to be full-time. That is,

18 Who are the persistently NEET young people?
occasion (that is, NEET for at least one month during the survey period; this would also
include the group of young people who are persistently NEET).
However, in the analysis for this report we focus on those who were persistently NEET
compared with those who were not persistently NEET (everyone else in the sample who
was not known to be persistently NEET). Those who were not persistently NEET serve as a
control group in some of the analyses undertaken for this paper. While ideally it would
have been useful to compare three groups (those who were never NEET, those who had
some NEET periods but not a persistently NEET period(s), and those who were persistently
NEET), the numbers of month-by-month missing data meant this would have been difficult
to achieve. Hence, we used a conservative approach by focusing on those we definitely
knew were persistently NEET, by comparison with the rest.
However, we do consider three groups of those who were persistently NEET in our
analysis. They are those who were persistently NEET at any time during the survey period,
those who were persistently NEET at a period(s) between ages 15—19, and those
persistently NEET at a period(s) between ages 20—24 years. It is worth noting that the 15—
19 and 20—24 age distinctions are based on wave rather than actual age, but most people
in the cohort were at the same age in each wave.
Derivation of the persistently NEETs
Figure 1 provides a simple representation of the factors considered in the derivation of
NEET status for any given month.
Figure 1 Factors considered in the derivation of the NEET status
LSAY does not have a readily easy-to-use month-by-month calendar of activities, which
meant that this information had to be derived using information available in the dataset.
participants who undertake any employment or education, regardless of how little in a month, will be
considered ‘engaged’.

NCVER 19
So, for example, while month-by-month employment variables were available, only start
and end dates were available for information on education.5
We have used a conservative approach to our derivation of NEET, that is, only those who
could be definitely identified as being NEET for any given month were classified as NEET.
Those for whom there was insufficient information to identify their NEET or otherwise
status were classified as not NEET for that month. Those who were categorised as NEET for
six or more consecutive months formed the persistently NEET group.
Because of this conservative derivation, the not NEET and not persistently NEET groups are
in fact the not known to be NEET and not known to be persistently NEET groups. However,
throughout the report, for ease of expression, they will be referred to as the not NEET and
not persistently NEET group.
The way the 15—19 years and 20—24 years persistently NEET groups were constructed
means there is some overlapping of a persistently NEET period across the two age ranges
for some individuals. Some individuals therefore may have been classified as persistently
NEET between the ages of 15 and 19 as well as between the ages of 20 and 24 on the basis
of one six-month period; that is, the six-month block of persistently NEET crosses from the
15—19 to the 20—24 years age distinctions. This is estimated to be a relatively small
number of individuals and is likely to have had a small impact on effect sizes. There is,
however, no clear way of dealing with these cases.
The persistently NEET spells are censored at the upper boundary of the survey period. This
means that there may be young people who began a persistently NEET period in less than
six months before the end of the survey period and so would not be counted as
persistently NEET. In this sense there would also be some underestimation of persistently
NEET numbers.
Analysis for this paper
Much of the focus of the analysis in this report is on those who were persistently NEET
between the ages of 15 to 19 years, also referred to in the report as early persistently
NEET. The reason for this focus is that the 15 to 19-years age group is particularly critical
in terms of learning for the world of work and also, for many, labour market entry.
Additionally, we have the advantage in LSAY of partitioning the cohort into the two
equidistant age groups: when they were aged 15—19, and when they were aged 20—24. As
noted, the analysis compares two cohorts of LSAY: Y03 and Y06.
The analytical approaches adopted for this study are now described.
Frequency distributions were used to describe the composition of the sample and also the
socio-demographic characteristics of the samples of interest. The frequency distributions
were based on a nationally representative starting sample of 15-year-olds and provide
insight into the occurrence of persistently NEET periods and the characteristics of those
affected.
5 The months covered by the survey were January 2004—February 2013 for the Y03 cohort, and January
2007—February 2016 for the Y06 cohort.

20 Who are the persistently NEET young people?
Frequency distributions were also used to describe the activities of those who were
persistently NEET at the time of interview (with information on activities only being
collected at the interview point, not on a month-by-month basis). To reiterate, this means
that activities were not captured for all those persistently NEET in the sample.
Chi-squared tests of independence were conducted to test for statistical differences (at
p<.01) across the various socio-demographic characteristics between the persistently NEET
group and their non-persistently NEET counterparts (the control group in our analysis). The
Cramer’s V effect size statistic is used in this analysis to understand whether the
significant difference is meaningful. That is, it is an indicator of the size of the difference
and takes into account sample size. As a guide, an effect size of V = 0.1 is small; 0.3 is
moderate; and 0.5 is large. Under 0.1 the effect is very small.
Logistic regression models were used for the remainder of the analysis. The benefit of this
type of analysis is that it allows for an assessment of the ‘main’ effect of a variable
independently of all the other variables under consideration. These models also have the
advantage of allowing us to make ‘causal’ claims where events are ordered (for example,
having children before a persistently NEET period).
The logistic regression models were firstly used to examine the socio-demographic
characteristics associated with the persistently NEET status (both being persistently NEET
at any time during the survey and early persistently NEET).
Secondly, the models were used to predict the likelihood of various outcomes occurring
between the ages of 20 and 24 for those who had a persistently NEET period(s) between
the ages of 15 and 19 (compared with their non-persistently NEET counterparts — the
control group).6 In particular:
� the likelihood of one or more persistently NEET periods between the ages of 20 and 24
� whether they were studying towards or obtained a certificate III or higher-level7
qualification by the final wave in our sample8
� whether they were in employment in the final wave of the survey (at about age 24).
Only those young people who were present in the final wave of the survey were used for
the models, with the exception of the model examining the characteristics associated with
early persistently NEET, which included young people present up to wave 5 of the surveys.
This is because we needed information on these individuals from the final wave in the
survey for our outcome measures. For the analysis of socio-demographic characteristics for
the early NEET group, those still present in wave 5 was used since this is when the early
persistently NEET period ends. In all of the models, a p<.01 value is used to denote
significance.
6 These are similar in vein to outcomes considered in some other studies on long-term NEET, such as NZ
Ministry of Business, Innovation and Employment (2013) and Samoilenko & Carter (2015).
7 Note that certificate I to advanced diploma level courses are delivered by the vocational education and
training sector, while diplomas and degrees are delivered by the higher education sector (with diplomas
being delivered by both sectors). Certificate III and above is often used in benchmark reporting for
educational attainment for the Australian population (see, for example, COAG 2009).
8 There are some who could have potentially completed a certificate III or higher-level qualification
before becoming persistently NEET between the ages of 15 and 19.
NCVER 21
For our models the following socio-demographic characteristics were used:
� Sex
� Indigenous status
� The PISA index of economic, social and cultural status (ESCS)
� Geographic location9
� Home language (either speak English at home or speak a language other than English)
� Completed Year 1210 (the final year of schooling in Australia)
� Whether they had become parents between the ages of 15 and 19, or 15 and 24
depending on the particular analyses.
Other variables that have been included in previous studies but not included in our models
include parental education and disability status. The highest level of education of the
student’s parent is a component of the ESCS measure used in our analyses so it was
decided not to include parental education separately. Disability was not included for a
variety of reasons, such as young people with learning and intellectual disabilities being
excluded from PISA and hence the LSAY sample, as well as other technical difficulties in
constructing a robust variable for this paper.
Data considerations and limitations
There are several considerations and limitations regarding the data in our sample of
interest. Some of the main ones are listed here.
Weighting
The LSAY data were not weighted for the analyses in this report. LSAY produces weights
for each year; however, the analyses in this report combine data across months and
therefore years, so use of year-by-year weights is not appropriate. It is not clear what
type of weights should be applied for this type of analysis: they would need to be
constructed specifically for this project and there would need to be several assumptions
made in producing a weighting methodology for these analyses.
Hence, the analyses pertain only to the LSAY samples and are not generalisable to the
Australian population of 15 to 24-year-olds, although, having said that, the initial sample
of 15-year-olds was representative of the Australian population. The analyses nevertheless
provide useful insights.
9 This refers to the location of the participant’s PISA school, not their residential address, and remains
unchanged from PISA (in wave 1). Also, note that, for this variable, unknowns are included as
metropolitan region.
10 The vocational equivalent of Year 12 (for example, the completion of a certificate II or III outside
school) is not included as part of this variable.

22 Who are the persistently NEET young people?
Attrition
A logistic regression was conducted on the socio-demographic characteristics used in our
analyses (including being ever NEET or persistently NEET) to predict completion of the
wave 10 survey. This was conducted to see how representative the wave 10 sample was by
comparison with the initial sample. More detailed information on the attrition analysis is
shown in appendix B. In summary, the significant predictors of non-completion of the
survey were being of Indigenous status, not completing Year 12 and being in the bottom
three ESCS quartiles. Having children was associated with a decreased likelihood of non-
completion, as was being NEET for at least one month across the survey period. For the
Y03 cohort only, females were more likely to not complete the survey than males.
Being ever NEET, Year 12 completion and having children are not time-bound within the
survey period; that is, there is an opportunity to gain these characteristics across the
survey period, so these need to be taken into account when interpreting the results of the
attrition analysis for these characteristics, although Year 12 completion for the vast
majority would occur by age 19. Nevertheless, in terms of the analyses in this report,
there needs to be some caution in interpreting the results for the variables associated
with attrition. Note also that systematic attrition in some of these variables is likely to
underestimate the true extent of persistently NEET.
Reporting of logistic regression results using odds ratios
Odds ratios are used to report the results of the logistic regressions rather than predicted
probabilities. Predicted probabilities, as the name suggests, predict the likelihood of an
event occurring. They require, however, the defining of a ‘typical’ case in the model.
However, the more variables in the model, and the more categories within variables (for
example, ESCS is reported in quartiles), the less representative of the sample the typical
case becomes.
The odds ratios used in the report are interpreted as follows. It is the probability of the
outcome being the same for two categories within a variable. If the odds ratio is one (1),
then the probability is the same for both categories. An odds ratio of greater than one (1)
for a category means that the outcome is more likely to occur for that category, relative
to the reference category. An odds ratio of less than one (1) means that it is less likely to
occur, relative to the chosen reference category.
An advantage of odds ratios is that — unlike predicted probabilities — they reflect the
effect of a variable as independent from all other variables in the model. The main
disadvantage of odds ratios is that a large odds ratio does not necessarily imply that the
probability of the outcome is high. For example, an odds ratio may indicate that one group
is at a tenfold higher risk of an outcome than another group, without either outcome
being especially likely (for example, 1% vs 0.1%). The results from the logistic regressions
should therefore be interpreted with caution, even when effects are significant.

NCVER 23
Findings This section presents the main findings of the analyses outlined in the methodology. The
findings make a comparison between the Y03 and Y06 cohorts, to take some account of the
different labour market and educational policy circumstances between the two cohorts.
Composition of the sample
We firstly examine the composition of the samples in terms of the size of the various NEET
groups, the average time spent in the NEET state, and the socio-demographic
characteristics across the two cohorts.
Size of the NEET groups
To set the scene for the analysis that follows, table 1 shows the size of the various groups in
the two cohorts, according to whether they were never NEET11, ever NEET (including those
who were persistently NEET), or persistently NEET, regardless of whether they dropped out
of the survey at some point or not, and also for those who were still present when the final
wave of the survey of our sample was completed. This information is presented for the
whole sample and also for when the cohort was aged between 15 and 19. It needs to be re-
emphasised that the never NEET group includes those not known to be NEET (that is, there
was no NEET status for all the months for which there were data available for an individual
but we do not know their status for months for which data were missing). Similarly, the ever
NEET group could theoretically include some individuals who had a persistently NEET period,
but because of data missing from some months we cannot be sure. This needs to be kept in
mind in the analysis below.
Table 1 Numbers and proportions of the Y03 and Y06 cohorts who were never NEET, ever NEET and persistently NEET
Wave 2 sample Y03 Y06
Across all months of the survey
Never NEET 7901 (84.3%) 6793 (72.5%)
Ever NEET 1477 (15.8%) 2579 (27.5%)
Persistently NEET* 630 (6.7%) 1095 (11.7%)
Ages 15–19 approx. Never NEET 9031 (96.3%) 7693 (82.1%)
Ever NEET 347 (3.7%) 1679 (17.9%)
Persistently NEET* 169 (1.8%) 612 (6.5%)
Still present in wave 10 Y03 Y06
Across all months of the survey
Never NEET 2926 (74.2%) 2175 (60.8%)
Ever NEET 1019 (25.8%) 1400 (39.2%)
Persistently NEET* 421 (10.7%) 612 (17.1%)
Ages 15–19 approx. Never NEET 3821 (96.9%) 2928 (81.9%)
Ever NEET 124 (3.1%) 647 (18.1%)
Persistently NEET* 58 (1.5%) 224 (6.3%)
*The persistently NEET are a sub-group of the ever NEET. Note: Numbers are rounded to one decimal place and may not sum to 100.
11 Including those not known to be NEET.

24 Who are the persistently NEET young people?
As would be expected, the never NEET group forms the largest group overall. The
proportions who are never NEET are higher during the time the samples were aged 15—19.
This is expected, given the more restricted time period. In addition, this is when the
majority of the attrition from the survey occurred, and therefore those people who
dropped out did not have the opportunity to become persistently NEET (particularly for
the Y03 cohort, where the risk of being early persistently NEET is comparatively quite
small for even those who were still in the survey at age 19). What this breakdown of the
sample also shows is that the persistently NEET group is a smaller sub-set of the overall
NEETs. So, for example, while 27.5% of the total sample across all months of the survey
(regardless of dropout) was ever NEET for the Y06 cohort, only 11.7% had a persistently
NEET period(s).
It can also be seen that there was a higher proportion of ever NEETs and persistently
NEETs at any time during the survey for those who were still present in the final wave of
the survey, the reason being that they would have had more opportunity to become so.
It is clear that there were higher proportions of ever NEET and also persistently NEET for
the Y06 cohort (noting that persistently NEET is a sub-set of the ever NEET group). Across
the length of the survey, for the total sample, 6.7% of the Y03 cohort reported a
persistently NEET period(s), while 11.7% of the Y06 cohort did so. That is quite an increase
in the size of the groups across the two cohorts. When we look at the more restricted time
period when the cohorts were aged 15—19, there are also considerably larger proportions
of persistently NEET in Y06 by comparison with Y03. Indeed, the Y03 sample of those who
had a persistently NEET period(s) between the ages of 15 and 19 is quite small,
particularly when restricted to those present in the final wave (58 people in total).
There could be various reasons to explain an increase in persistently NEET across the two
cohorts, part of which could be related to the vagaries of the samples. However, Carcillo
et al. (2015) point out that there was a rise in point-in-time NEETs in Organisation for
Economic Co-operation and Development (OECD) countries following the GFC (mainly
unemployed but in Australia also inactive [NILF] youth). It is possible that this had an
effect on the Y06 sample in this study. The young people from this sample would have
been aged about 18 when the effects of the GFC were felt in Australia (the age of labour
market entry for many), while the young people in the Y03 cohort would have been aged
about 21. This would also account, in part at least, for the larger proportion of 15 to 19-
year-olds who were persistently NEET in Y06.
Table 2 follows a similar theme by examining the amount and proportion of time spent in
the various NEET states.

NCVER 25
Table 2 Months and proportion of time spent NEET
Wave 2 sample Y03 Y06
Overall 1.4 months (1.9% of all months)
2.5 months (3.5% of all months)
Of those ever NEET (including persistently NEET)
9.1 months (12.3% of all months)
8.9 months (12.7% of all months)
Of those persistently NEET 17.3 months (23.4% of all months)
17.0 months (23.1% of all months)
Of those early persistently NEET (ages 15–19)
22.3 months (38.1% of all months)
18.9 months (29.6% of all months)
Still present in wave10 Y03 Y06
Overall 2.3 months (2.6% of all months)
3.9 months (3.7% of all months)
Of those ever NEET (including persistently NEET)
9.0 months (10.1% of all months)
9.9 months (9.4% of all months)
Of those persistently NEET 17.7 months (19.7% of all months)
18.7 months (17.8% of all months)
Of those early persistently NEET (ages 15–19)
28.6 months (31.6% of all months)
24.8 months (23.6% of all months)
Note: Those who were never NEET by definition would have zero months in the NEET state across the survey period.
Once again, the main feature is that it is quite clear (and expected) that those who are
ever NEET, and more so the smaller group of persistently NEET, are spending a much
higher proportion of the overall months in the NEET state; and an even higher proportion
for those persistently NEET when they are aged 15 up to when they are aged 19 (possibly
due to the more restricted time period). This high proportion of all months spent as NEET
by the persistently NEET group, and particularly the early persistently NEET group,
justifies the focus on this group of people in this paper, also noting the finding by the NZ
Ministry of Business, Innovation and Employment (2013), that the long-term NEET
represented more than 70% of all NEET days for their age group.
Demographic and other characteristics breakdown
Tables 3 and 4 provide breakdowns for the main socio-demographic characteristics that
will be used as predictors when examining longer-term outcomes.12
Table 3 shows the breakdown of socio-demographic characteristics for the wave 2 sample
(including those who dropped out of the survey) and the total sample still present at wave
10. Table 4 shows socio-demographic characteristics for those who were persistently NEET
at any time during the survey and were still in the survey at wave 10, and those who were
persistently NEET at any time at ages 15—19 (including those who dropped out of the
survey after their persistently NEET period). The tables also indicate (with the use of an
asterisk) for each category whether the socio-demographic characteristics for the
persistently NEET group are significantly different (at the p<.01 level) from the non-
persistently NEET (control) group for that category overall, and the effect size for that
significant difference (Cramer’s V).
12 More detailed tables are shown in appendix C, tables C1—C3.

26 Who are the persistently NEET young people?
Table 3 Socio-demographic characteristics for the whole sample (%)
Characteristics Wave 2 sample Total sample present in wave 10
Y03 Y06 Y03 V Y06 V
Sex
Female 50.8 52.3 50.2 52.7
Male 49.2 47.7 49.9 47.3
Indigenous status
Non-Indigenous 94.8 94.5 96.9* 0.08 96.6* 0.07
Indigenous 5.2 5.6 3.1 3.4
Geographic location
Metropolitan 70.7 69.3 72.6* 0.04 71.8* 0.04
Provincial 27.2 28.2 25.7 26.1
Remote 2.1 2.5 1.7 2.2
Language spoken at home
LOTE1 7.3 6.9 7.7 7.2
English 91.0 91.8 92.3 92.9
No information 1.7 1.3
Year 12 completion
Completed Year 12 71.4 69.1 89.2* *** 90.9* ***
Did not complete Year 12 17.6 16.7 10.8 9.2
At school at most recent interview 11.0 14.2 0.0 0
Children
Not reported having any children 95.4 96.6 93.0* 0.10 93.9* 0.12
Reported having children (at some point)
4.6 3.4 7.0 6.1
ESCS
Q1 (Highest) 25.8 27.7 33.3* 0.17 34.1* 0.14
Q2 25.5 26.4 26.7 28.1
Q3 24.7 24.3 22.6 21.7
Q4 (Lowest) 24.0 21.4 17.5 16.0
Unknown 0.0 0.3 0.0 0.1
Base total 9378.0 9372.0 3945.0 3575.0
Note: 1 LOTE (Language other than English). An asterisk indicates that the socio-demographic characteristic in question for the sample still present in wave 10 is significantly different (at the p<.01 level) in proportionality overall from the sample at wave 2. Cramer’s V statistic is also included to indicate the size of the effect.
At school for the total sample includes those who dropped out of the survey while they were still at school. Known completers and non-completers were those who had left school and had not returned to school at the time of their most recent survey. ***The effect is not meaningful for the Year 12 completion variable: for the total sample there were those still at school, while for those present at wave 10 there were none still at school, producing an artificial effect. Numbers are rounded to one decimal place and may not sum to 100.
The main feature in this table, apart from the fact that it provides socio-demographic
breakdowns, is the effects of attrition (particularly for young people who reported not
having any children and those from the lowest ESCS quartile, where Cramer’s V indicates a
small effect). Attrition was discussed in the methodology section of the report. It is worth
reiterating here however that the differences in sample distribution need to be kept in
mind in the analysis that follows.
Table 4 now specifically looks at the samples who were persistently NEET and which are
used in the ensuing analysis.

NCVER 27
Table 4 Socio-demographic description of the persi stently NEET groups (%)
Characteristics Persistently NEET at any time – present in wave 10
Early persistently NEET – present in wave 10
Y03 V Y06 V Y03 V Y06 V
Sex
Female 63.1* 0.09 54.6 60.3 52.7
Male 36.9 45.4 39.7 47.3
Indigenous status
Non-Indigenous 95.2 94.6* 0.05 91.4 93.8
Indigenous 4.8 5.4 8.6 6.3
Geographic location
Metropolitan 65.3* 0.06 65.9* 0.06 55.2* 0.05 61.6* 0.07
Provincial 32.8 30.9 43.1 37.1
Remote 1.9 3.3 1.7 1.3
Language spoken at home
LOTE 6.8 5.6 3.5 2.3* 0.05
English 93.3 94.4 96.5 97.8
Year 12 completion
Completed Year 12 74.8* 0.16 82.7* 0.13 31.0* 0.23 77.7* 0.12
Did not complete Year 12 25.2 17.3 69.0 22.3
Children
Not reported having any children
70.0* 0.31 80.9* 0.25 65.5* 0.13 79.0* 0.16
Reported having children 30.0 19.1 34.5 21.0
ESCS
Q1 (Highest) 24.8* 0.13 23.9* 0.13 13.8* 0.08 20.1* 0.10
Q2 20.7 26.8 19.0 25.0
Q3 23.6 25.3 27.6 31.3
Q4 (Lowest) 31.0 23.9 39.7 23.7
Unknown 0.0 0.2 0.0 0.0
Base total 421.0 612.0 58.0 224.0
Note: An asterisk indicates that the persistently NEET group in question for that particular socio-demographic characteristic is significantly different (at the p<.01 level) in proportionality from its non-persistently NEET counterpart. Cramer’s V statistic is also included to indicate the size of the effect. The completed Year 12 and had children variables for the early persistently NEET groups are as of their wave 5 status (so when they were about 19 years of age). Numbers are rounded to one decimal place and may not sum to 100.
The socio-demographic characteristics in table 4 with significant differences between the
persistently and not persistently NEETs13 across both cohorts are geographic location
(those living in provincial areas more likely to be persistently NEET); Year 12 completion
(not completing Year 12 more likely to be persistently NEET); reporting having children
(those who had children more likely to be persistently NEET); and ESCS (those from a
lower quartile more likely to be persistently NEET). However, when we examine the
Cramer’s V statistics (effect sizes), we see that only Year 12 completion and having
children have an acceptable effect size (albeit mainly small), while ESCS has a marginal
effect size. The largest effect sizes in table 4 were for having children for those who were
persistently NEET at any time.
There are some differences between the cohorts. The distributions are more skewed
towards being female, non-completion of Year 12, having children, and the lowest ESCS
13 The proportions that are not persistently NEET are not shown in table 4.

28 Who are the persistently NEET young people?
quartile for the Y03 cohort by comparison with the Y06 cohort. For the early persistently
NEET, the differences are even more pronounced and also include those living in a
provincial area. The most exaggerated difference is for the Year 12 completion variable,
where nearly 70% did not complete Year 12 for the Y03 cohort by comparison with 22% for
the Y06 cohort. This needs to be kept in mind for the analysis that follows.
In terms of an explanation, it is possible that the GFC in 2008 affected people more evenly
for the Y06 cohort than for the Y03 cohort. We saw from table 1 that there were
substantially more persistently NEETs in the Y06 cohort, which could possibly mean that it
affected a greater range of people. This group would have been aged about 18 years when
the effects of the GFC became apparent (as opposed to aged about 21 for the Y03 cohort)
and in that critical stage of transitioning from school to either the labour market or
further education and training.
A picture starts to emerge from the above examination of the socio-demographic
characteristics. We can go further with this analysis by examining how likely certain socio-
demographic characteristics are to be associated with persistently NEET, taking into
account (or holding constant) the effect of other socio-demographic characteristics. To do
this we ran two regression models: one with the outcome of interest being persistently
NEET at any time during the survey; and the other with the outcome being persistently
NEET at any time during the ages 15 through to 19. The results of this analysis are shown
in table 5 and are given in terms of odds ratios.14 The odds ratios are relative to the
reference group in any given category. In terms of interpretation, if we look at a couple of
examples in table 5 in the column persistently NEET at any time, we see an odds ratio of
1.41 for females in the Y03 cohort, which means that women are 1.41 times more likely to
be persistently NEET than men (or, alternatively, 41% more likely). A converse example is
for non-Indigenous people in the Y06 cohort. It is interpreted as non-Indigenous people are
0.66 more likely (or 34% less likely) to be persistently NEET than Indigenous people.
Table 5 Likelihood of being persistently NEET by s elected demographics (%)
Variable Level Persistently NEET at any time
Persistently NEET 15–19
Y03 Y06 Y03 Y06
Sex Female 1.41 0.98 1.55 0.96
Indigenous status Non-Indigenous 0.79 0.66 0.78 0.57
ESCS Lowest quartile 1.40 1.68 1.70 2.23
Second quartile 0.95 1.40 1.25 1.81
Third quartile 0.86 1.20 0.97 1.41
Geographic location Provincial 1.05 1.00 1.15 1.04
Remote 0.64 0.95 1.25 0.63
Completed Year 12 No 1.91 1.38 16.11 2.46
Home language Language other than English
1.17 0.92 0.47 0.47
Had children ages 15–19 Yes 10.27 8.15 9.14 9.26
Note: For both the had children and Year 12 completion variables, the age ranges of 15–19 are used to predict persistently NEET at ages 15–19, and ages 20–24 during the survey for predicting persistently NEET at any time. For ECSC the reference category is the top quartile (least disadvantaged), and for geographical location it is city.
14 More detailed tables are shown in appendix 3 tables A4—A7.

NCVER 29
Once again, becoming parents at ages 15—19, not completing Year 12 (especially for the
early persistently NEET for the Y03 cohort), and being in the lowest ESCS quartile (by
comparison with the highest ESCS quartile) are consistently associated with a greater
likelihood of being persistently NEET. Being non-Indigenous is associated with a
significantly lower likelihood of being persistently NEET for the Y06 cohort only (however,
we saw previously that the effect size was very small). Having children increases the
likelihood of being persistently NEET by about 10 times by comparison with not having
children (noting that this is a relative measure). We saw from table 4 that the percentage
of the overall sample of persistently NEET who had children was very high.
In comparison, the OECD (2016) study found long-term NEET in Australia15 to be higher for
women (particularly young women who were parents); those with low educational
attainment; Indigenous youth; and low parental education. While we found low
educational attainment to be associated with being persistently NEET, we did not find
enough evidence to make this claim for females and Indigenous youth. For Indigenous
youth, this could be due to the relatively small sample of persistently NEET, particularly
for the Y03 cohort. While there is some marginal evidence that females were more likely
to be persistently NEET for the Y03 cohort (over the entire survey period, not early
persistent NEET), there was no significant difference for the Y06 cohort. The way the
OECD defined long-term NEET, the different observation period, the different dataset and
the methodology used could partly account for these differences. But we also saw that the
GFC appears to have affected young people more evenly for the Y06 cohort, so that may
also account for why there was no significant effect for gender for this cohort.
In summary, our analysis has uncovered two factors that seem to be clearly associated
with a greater likelihood of having a persistently NEET period at any time during the
survey and also the period during which the survey participants were aged 15—19 by
comparison with their counterparts: having children, particularly at an early age; and not
completing Year 12 (but also to some extent being in the lowest ESCS quartile). Other
research, discussed in the literature overview and support document, has also found
related factors to be associated with being persistently NEET.
Main activities of the persistently NEET group
LSAY provides some insight into their activities at point of interview (not on a month-by-
month basis).16 The analysis here is intended to provide a broad indication of the types of
activities being undertaken by the persistently NEET group and therefore should be seen
as indicative only, but it adds a further dimension to the analysis of socio-demographic
characteristics. This section thus provides information on both those who were not in the
labour force and those who were unemployed.
Table 6 provides a summary of the main activities of those who were persistently NEET for
both the Y03 and Y06 cohorts and for both males and females. It also provides information
15 Although they had a different definition of long-term NEET, which was being NEET for more than 12
months in total over a 48-month observation period.
16 Hence, it does not capture those who were persistently NEET between interview points. It also does not
identify whether they were at the beginning of a persistent NEET block or not.

30 Who are the persistently NEET young people?
on the proportions that were not in the labour force and unemployed by cohort and
gender.
Table 6 Summary of main activities for the persist ently NEET group not in the labour force by gender, and proportions unemployed – numbers summed across waves (%)
Y03 Y06
Main activity Females Males Total Females Males Total
Study or training 2 15 5 3 5 4
Home duties or looking after children
72 18 58 60 24 48
Travel or holiday 9 9 9 13 29 19
Ill or unable to work 7 20 11 7 5 6
Other 9 38 16 16 36 23
Total 100 100 100 100 100 100
NILF 65 35 54 50 25 40
Unemployed 35 65 46 50 75 60
Total 100 100 100 100 100 100
Note: Only includes individuals once for a given activity, so the overall is total less than totals for each wave. However, some individuals will have reported more than one activity and in that sense will be counted more than once. For the purposes of this table, people reporting NILF or unemployed are only counted once (not for each wave they were NILF or unemployed). Numbers may not sum to exactly 100% due to rounding.
Table 6 quite clearly shows that by far the single largest activity type by females was
home duties or looking after children and this is so across both cohorts. Activities for
males were more evenly split, with some proportions undertaking home duties or looking
after children, ill or unable to work, or on holiday/travelling (particularly so for the Y06
cohort). The largest single category for males was ‘other’. Few in either sex were
undertaking study (this is presumably non-formal study).
We can see from the table that overall, there are quite a few ‘other’ responses. It is
possible to obtain the verbatim responses from LSAY given by the young people not in the
labour force where ‘other’ is stated as their main activity. We were able to obtain these
for the Y06 cohort and filter them, leaving us with the verbatims for respondents who
were persistently NEET at the time of interview. Many of these responses fell into
categories such as caring (other than for their children), working to help family (unpaid),
volunteering, gap year, and waiting to start a job. There were also quite a few who stated
that they were not doing anything at the moment. A small selection of these responses is
shown below for illustration.
Waiting to start TAFE next year
Full-time carer for ill mother
I am helping my parents in their family business
Doing an unregistered permaculture course for interest
About to have a baby
Having a break before I go into the navy
Volunteer work — going to China as a volunteer next month
Music rehearsing/practising with aim of further career in music
Fixing cars with my mate

NCVER 31
Table 6 also shows the proportions that were unemployed by comparison with NILF at the
time of interview. While this is a fairly rough guide, what is of interest is that the
proportions are very different between males and females. There are much higher
proportions of females not in the labour force than males and, conversely, there are much
higher proportions of unemployed males. The proportions unemployed are somewhat
higher for the Y06 cohort, consistent with our earlier comments on the possible impact of
the GFC and also consistent with the findings by Carcillo et al. (2015).
In terms of total numbers (refer to Appendix D, not shown in table 6), there were more
NILF females than males in both cohorts (about three-quarters are females in both
cohorts). This seems to be accounted for largely by the number of females reporting home
duties or caring for children. (Summed across both cohorts, there were 208 females
reporting this by comparison with 28 males; over seven times more.) The OECD (2016) also
found in their study of Australia’s NEETs higher inactivity rates by females than males,
particularly females with young children.
For those who were unemployed, the split was quite even (summed across both cohorts,
51% of people that reported being unemployed were males). Overall, in our point-in-time
analysis, there were considerably more females than males who were persistently NEET
(for both cohorts). However, our analysis of socio-demographic variables did not clearly
indicate being female as a significant variable in terms of being persistently NEET.
Tables 7 and 8 break this information down on a wave-by-wave basis. These tables are not
split by gender. For gender breakdowns of this information, see appendix D.

Table 7 Wave by wave activity for those in a persi stently NEET block at interview point for the Y03 c ohort
NILF 0 0 16 37 20 49 20 44 23 68 64 56 67 59 71 63 84 74
Unemployed 0 0 27 63 21 51 25 56 11 32 50 44 46 41 41 37 29 26
Total 0 0 43 100 41 100 45 100 34 100 114 100 113 1 00 112 100 113 100
Activity W2 2004 W3 2005 W4 2006 W5 2007 W6 2008 W7 2009 W8 2010 W9 2011 W10 2012
No. % No. % No. % No. % No. % No. % No. % No. % No. %
Study or training 0 0 0 0 0 0 1 5 2 9 5 8 2 3 3 4 0 0
Home duties or looking after children
0 0 12 75 14 70 16 80 18 78 41 64 48 72 48 68 54 64
Travel or holiday
0 0 1 6 0 0 0 0 0 0 4 6 3 4 6 8 9 11
Ill or unable to work
0 0 0 0 3 15 1 5 0 0 6 9 5 7 9 13 12 14
Other 0 0 3 19 3 15 2 10 3 13 8 13 9 13 5 7 9 11
Total 0 0 16 100 20 100 20 100 23 100 64 100 67 100 71 100 84 100

Table 8 Wave by wave activity for those in a persi stently NEET block at interview point for the Y06 c ohort
NILF 11 33 30 38 71 36 50 48 37 48 23 47 55 61 47 57 35 56
Unemployed 31 67 48 62 129 65 55 52 40 52 26 53 35 39 36 43 28 44
Total 46 100 78 100 200 100 105 100 77 100 49 100 9 0 100 83 100 63 100
Activity W2 2007 W3 2008 W4 2009 W5 2010 W6 2011 W7 2012 W8 2013 W9 2014 W10 2015
No. % No. % No. % No. % No. % No. % No. % No. % No. %
Study or training 0 0 1 3 3 4 1 2 1 3 0 0 1 2 0 0 2 6
Home duties or looking after children
6 55 13 43 27 38 27 54 16 43 19 83 32 58 35 74 26 74
Travel or holiday
0 0 2 7 15 21 8 16 2 5 2 9 5 9 4 9 4 11
Ill or unable to work
0 0 3 10 2 3 5 10 1 3 1 4 11 20 4 9 0 0
Other 5 45 11 37 24 34 9 18 17 46 1 4 6 11 4 9 3 9
Total 11 100 30 100 71 100 50 100 37 100 23 100 55 100 47 100 35 100

34 Who are the persistently NEET young people?
The wave-by-wave activity identifies interesting patterns. For the Y03 cohort, increases
in persistently NEET occurred when they were at about the age of 21, whereas for the
Y06 cohort, this occurred at about the age of 18 (although for the Y06 cohort the
numbers fall back again in the following wave). Both of these fall in the year of 2009 and
the increases occurred for both males and females. While we cannot definitively claim,
based on a two-cohort analysis (so we do not know the extent to which there was
random fluctuation in persistently NEET between the two cohorts), that these increases
were a consequence of the GFC17, the GFC clearly had an impact on employment in
Australia, particularly for young people, as has been demonstrated in the 2009 point-in-
time data.
If we unpack these numbers, we can discern differences between cohorts, between the
not in the labour force and unemployed categorisations, and by gender. Firstly, the two
cohorts are at different life stages, three years apart. The Y06 cohort was aged about 18
in 2009 and, while there was an increase in both the numbers unemployed and NILF, the
biggest increase in persistently NEET was for those who were unemployed. The numbers
persistently NEET then dissipate until another increase, mainly in those NILF in 2013,
when this cohort was aged 22. For the Y03 cohort, there was both an increase in
unemployment and NILF at age 21. This increase remains in the subsequent three waves,
but the distribution changes, with more becoming NILF and fewer unemployed. This
finding is supported by Carcillo et al. (2015), who noted that in Australia there was,
contrary to many other countries, an increase in the number who were inactive (or NILF)
following the GFC.
Differences by gender are also apparent. In the Y03 cohort, for males, there were mainly
increases in 2009 for those who were unemployed, while for females, there was a large
increase in home duties or looking after children (that remains for the subsequent three
waves), in addition to an increase in the unemployed. For the Y06 cohort, there were
large increases in unemployment for both males and females in 2009, and there was also
a substantial increase in NILF (mainly caring duties) for females.
The differences in trajectories after 2009 for both cohorts could be related to the
different life stages of the two cohorts and also the different compositions of the
persistently NEET group. By the age of 21, many of the Y03 cohort would have been
finishing post-school education, and the limited work opportunities would keep the
persistently NEET group relatively constant.18 The Y06 cohort, conversely, were
impacted following school, and the decrease in numbers persistently NEET after 2009
may in part be because some chose to go back to education, or for other not persistently
NEET, continue on in education or training. These data support the proposition made by
Carvalho (2015) that the 15—19 and 20—24 years age groups should be treated
differently in terms of their underlying dynamics.
17 And to reiterate, the numbers in the wave-by-wave analysis are indicative only, as they are only
those who were persistently NEET at the time of the survey.
18 Also, these are raw numbers rather than proportions of the LSAY population, so due to attrition from
the survey the same numbers may actually represent higher proportions in later waves.

NCVER 35
Longer-term outcomes of being persistently NEET during the ages of 15–19
The final section of the analyses considers three outcomes of the group who were
persistently NEET between the ages of 15 and 19.
To reiterate, we used a simple logistic regression model to examine the effect of being
early persistently NEET on one or more persistently NEET periods between the ages of 20
and 24, study outcomes by the age of 24 and employment at age 24. The socio-
demographic variables described previously are used as covariates in the analysis. Note
also that we are only looking at the sub-sample who answered wave 10 of the
questionnaire.
Table 9 presents the odds ratios for each of the three categories of outcomes for the Y03
and Y06 cohorts.19
Table 9 Summary table of odds ratios for three out come variables for the 15–19 years persistently NEET group
Variable Level Persistently NEET 20–24
Studying for or achieved cert III+ by
age 24
Employment at 24
Y03 Y06 Y03 Y06 Y03 Y06
Early persistently NEET Yes 3.03 5.39 0.30 0.28 0.65 0.35
Sex Female 1.89 1.14 1.59 1.71 0.69 0.93
Indigenous status Non-Indigenous 0.70 0.80 1.66 1.53 1.14 1.51
ESCS Lowest Quartile 1.88 2.12 0.27 0.39 1.11 1.01
Second Quartile 1.24 1.47 0.46 0.43 1.29 1.03
Third quartile 0.92 1.33 0.69 0.74 1.20 1.09
Geographic location Provincial 1.08 1.06 0.88 0.95 0.95 0.98
Remote 1.08 1.68 0.92 1.17 0.85 0.95
Completed Year 12 No 2.24 1.73 0.33 0.39 0.70 0.92
Home language Language other than English
0.97 0.95 1.94 2.14 0.76 0.59
Had children ages 15–19
Yes 4.42 7.97 0.53 0.87 0.69 0.44
Note: Bolded figures are significant at the p<.01 level. For ECSC the reference category is the top quartile (least disadvantaged), and for geographical location it is city.
Table 9 shows quite clearly that early persistently NEET is a significant factor in
predicting outcomes at ages 20—24. That is, they are more likely to have a persistently
NEET period between ages 20 and 24, less likely to be studying for or have completed a
certificate III or higher by age 24, and less likely to be in employment at age 24 (for the
Y06 cohort). The results for each of the outcome variables are discussed in more detail
below. The effects are more pronounced for the Y06 cohort.
19 More detailed tables are shown in appendix C tables C8—C13.

36 Who are the persistently NEET young people?
Persistently NEET after age 19
As was expected, being persistently NEET at ages 15—19 is a significant predictor of
being later persistently NEET. Indeed, the early persistently NEET group was three times
more likely for the Y03 cohort and around five-and-a-half (5.4) times more likely for the
Y06 cohort to have one or more persistently NEET periods between the ages of 20 and 24
than their non-persistently NEET counterparts.20 As has been highlighted, there was a
substantially larger early persistently NEET group for the Y06 cohort than the Y03 cohort
(quite possibly at least in part due to the GFC), which may influence the likelihood of
being persistently NEET at age 20—24 years.
The analysis in table 9 also indicates that those who have children at ages 15—19,
independently of being persistently NEET at these ages, are several times more likely to
have a persistently NEET period between the ages 20 and 24 than their counterparts who
do not have children, particularly for the Y06 cohort. Indeed, our demographic analysis
showed that those who had children at ages 15—19 were much more likely to be
persistently NEET than their counterparts who did not have children, so in that sense this
result is not surprising.
Those who did not complete Year 12 were also more likely to have a persistently NEET
period between the ages 20 and 24 compared with Year 12 completers, regardless of
being persistently NEET through ages 15 to 19. Once again this is not surprising, given
the more difficult labour market transitions this group faces. Lamb and Huo (2017) found
that, in Australia, those who did not complete Year 12 or equivalent qualifications by
age 19 were more likely than those who did to be disengaged in the long-term.21 In
addition, those in the lowest quartile of the ESCS measure were more likely have a
persistently NEET period by comparison with the top quartile.
Later education and training outcomes
Early persistently NEET is clearly associated with a lower likelihood of studying for or
achieving a certificate III or higher-level qualification by the age of 24. In fact, they
were only about as 0.3 times as likely to achieve the outcome variable as their not
persistently NEET counterparts and this applied across both cohorts.
Not having completed Year 12, or being in the lowest ESCS quartile (relative to the
highest quartile), independently of being early persistently NEET, is also associated with
a lower likelihood of achieving the outcome variable by age 24. Alternatively, females
and those whose home language was other than English are more likely than their
counterparts to have achieved the outcome variable.
Employment at age 24
It is expected that being early persistently NEET could have a negative effect on longer-
term employment outcomes. However, there is only a significant effect for the Y06
20 As was noted in the methodology there is a relatively small number of cases where the persistently
NEET spell overlaps the two age barriers. This is likely to have a relatively small impact on effect
sizes.
21 That is, not engaged in full-time work or study.

NCVER 37
cohort, with those who were early persistently NEET being 0.35 times as likely to be
employed at age 24 than their non-early persistently NEET counterparts. The effect for
the Y03 cohort was not significant. Part of this may be related to the small sample size
for early persistently NEET used in the model for the Y03 cohort; part of it may also be
due to the different composition of NEET between the two cohorts (there were more
unemployed NEET for the Y06 cohort, quite possibly due to the GFC) and so possibly
different longer-term outcomes.

38 Who are the persistently NEET young people?
Discussion and conclusions
In this report, we found that a sub-set of those who are NEET remains in that state
persistently. This was more so for the Y06 cohort than the Y03 cohort of LSAY.
The main socio-demographic characteristics associated with being persistently NEET in
our report are early school leaving and having children (particularly under the age of
20), and to some extent being in the lowest quartile of the ESCS measure of socio-
economic disadvantage. We also noted that the distributions are more skewed towards
these factors (and in addition, being female and coming from a regional location) for the
Y03 cohort.22 This may mean that the GFC affected young people more evenly in the Y06
cohort, coming as it did when they were aged 18 years. Indeed, we saw from our findings
that there was a considerably higher proportion of the sample persistently NEET in the
Y06 cohort, particularly early persistently NEET.
These characteristics are supported by other research in the area.23 However, some of
the other characteristics identified in other research, such as being female, of
Indigenous status, and from a remote location, were not clearly associated with
persistently NEET in our study. There were some significant differences for these
variables but they were not consistent and the effect of the differences was only very
small (so not particularly meaningful). Part of this may be attributable to the nature and
size of our sample and also the possible effects of attrition.
In terms of the not in the labour force activities of those who were persistently NEET (at
the time of interview), our analysis found that females were likely to be undertaking
home duties or caring for children, while males undertook a variety of activities. Males,
however, were considerably more likely to be unemployed. This was across both cohorts,
although the difference between males and females is not as great in the Y06 cohort. It
appears that the Global Financial Crisis, the effects of which would have been noticed in
about 2009, impacted on both cohorts. In our analysis, there were clearly increases in
unemployment for both sexes, and increases in home duties and caring for females in
2009 (at about age 21 for the Y03 cohort and age 18 for the Y06 cohort). While for the
Y06 cohort the numbers of persistently NEET reduced after 2009, this was not the case
for the subsequent three waves of the Y03 cohort. This reflects the different dynamics of
the two age groups, with the 18-year-olds possibly being more likely to return to
education or training.
Those who had a persistently NEET period(s) during the ages 15—19 were found, by
comparison with their not persistently NEET counterparts, to be, for both cohorts, more
likely to be persistently NEET at some period during the ages 20—24, and less likely to be
either studying for or achieving a certificate III level or higher qualification by age 24.
Those who were early persistently NEET were found to be less likely to be in
employment than the control group for the Y06 cohort only.
22 Particularly non-completion of year 12 for those that were early persistently NEET where nearly 70%
did not complete year 12.
23 See the literature overview of this report and the support document for more detail of other research
in this area.

NCVER 39
Taking into account all of the analyses, it appears that the GFC has had an impact in
terms of being persistently NEET on both cohorts, but differentially across the two
cohorts, given the different ages (18 and 21 years) and consequent life stages. This also
provides further evidence for what Anlezark (2011a) found regarding the economic
downturn in terms of employment being harder to find for young people and increases in
unemployment. We also found increases in those not in the labour force following the
GFC, mainly for women (also found by Carcillo et al. 2015).
In the background review, we mentioned the vulnerable/not vulnerable divide. It would
appear that not all those who are persistently NEET are vulnerable, although we posit
that this group is more likely to be so than those who spend fleeting amounts of time in
and out of NEET. NEET are a diverse group and includes those not in the labour force
who are travelling or volunteering, which can be a legitimate choice. In our analysis we
saw that many females in particular undertake home or caring duties, which may be a
legitimate choice but may also be a necessity. We also saw from the analyses that
teenage parenting is associated with being persistently NEET early. Furthermore, they
are considerably more likely than those who do not have children to be persistently NEET
at ages 20—24. This requires substantial consideration in terms of how policy can best
assist this group of people. There may be a variety of supports required for this group,
depending on their circumstances.
However, there are also others who are not in the labour force or unemployed who are
vulnerable and in need of support. We saw, for example, that early school leaving is
associated with a higher likelihood of being persistently NEET by comparison with those
who completed Year 12. While once again a variety of supports may be needed, for those
in this group of the persistently NEET who have not gone on to any further education or
training, completing Year 12 or its vocational equivalent is an important step towards a
transition to the labour market. Many programs and initiatives are available in Australia
that enables schools to adapt their learning programs to the needs of low achievers and
the disadvantaged (OECD 2016).
For those who have completed Year 12 and are persistently NEET (either not in the
labour force or unemployed), further skills acquisition, in addition to other supports,
may be appropriate. In this light vocational education and training is seen as an
important pathway, given its flexibility and accessibility to students across a wide range
of circumstances (OECD 2016).
These are just some examples. The main point is that there needs to be nuanced policy
responses to cater for the diverse individual and also broader labour market and
institutional circumstances facing the persistently NEET group. Furthermore, the focus
should be on those who are vulnerable in this group rather than on those who are there
by choice. Elder (2015), as noted in the support document, provides a systematic guide
to building policy responses for different categories of NEET (which would also apply to
those who are persistently NEET).
40 Who are the persistently NEET young people?
The analyses in this paper were a first attempt to explore the persistently NEET cohort
within the LSAY data.24 Further research on this group could deepen our understanding
considerably, a sensible first step being the updating of these current analyses for the
Y09 cohort as more waves of data for this group become available.
It would also be of interest to examine pathways out of the persistently NEET state, that
is, for those who were persistently NEET at some point between the ages of 15 and 19,
but not persistently NEET by age 24 — what they may have done differently from those
who remained in the persistently NEET state.
Further research could also be undertaken to understand the dynamics of particular sub-
groups. Research could more closely examine those who were persistently NEET at ages
15—17, as these would potentially be an even more vulnerable sub-group. It may also be
of interest to more closely examine the characteristics and pathways of those who only
become persistently NEET at ages 20—24 years.
24 To reiterate, because of weighting limitations, the findings pertain only to the samples in our
analyses, not the Australian population of 15-24 year olds.

NCVER 41
References Anlezark, A 2011a, Young people in an economic downturn, LSAY briefing paper no.23, NCVER,
Adelaide.
——2011b, At risk youth: a transitory state?, LSAY briefing paper no.24, NCVER, Adelaide, viewed 5 April 2016, <http://www.ncver.edu.au/publications/2342.html>.
ABS (Australian Bureau of Statistics) 2016, Survey of Education and work, cat.no.6227.0, ABS, Canberra.
Brotherhood of St Laurence 2014, On the treadmill: young and long-term unemployed in Australia, my chance, our future, Brotherhood of St Laurence, Fitzroy, viewed 5 April 2016, <http://www.bsl.org.au/pdfs/On_the_treadmill_young_long-term_unemployed_2014.pdf>.
Bynner, J & Parsons S, 2002, ‘Social exclusion and the transition from school to work: the case of young people not in education, employment or training (NEET)’, Journal of Vocational Behaviour, vol.60, pp.289—303.
COAG (Council of Australian Governments) 2009, National Agreement for Skills and Workforce Development, COAG, Canberra, viewed 18 April 2017, <http://www.federalfinancialrelations.gov.au/content/npa/skills/national-partnership/skills-reform_NA.pdf>.
Carvalho, P 2015, Youth unemployment in Australia, CIS research report 7, Centre for Independent Studies, Canberra.
Carcillo, S, Fernández, R, Königs, S & Minea, A 2015, NEET youth in the aftermath of the crisis: challenges and policies, OECD social, employment and migration working papers, vol.164, OECD Publishing, Brussels.
Elder, S 2015, What does NEETs mean and why is the concept so easily misinterpreted?, International Labour Office, Geneva.
Furlong, A 2006, ‘Not a very NEET solution: representing problematic labour market transitions among early school-leaver’, Work, Employment and Society, vol.20, no.3, pp.553—69.
Hillman, K 2005, Young people outside the labour force and full-time education: activities and profiles, LSAY research report no.45, Australian Council for Educational Research, Camberwell, viewed 5 April 2017, <http://www.lsay.edu.au/publications/1841.html>.
Lamb, S & Huo S 2017, Counting the costs of lost opportunity in Australian education, Mitchell Institute report no.02/2017, Mitchell Institute, Melbourne, viewed 25 June 2017, <http:// www.mitchellinstitute.org.au>.
NCVER (National Centre for Vocational Education Research) 2014, Longitudinal Surveys of Australian Youth annual report 2013, NCVER, Adelaide.
New Zealand Ministry of Business, Innovation and Employment 2013, Not in employment, education or training: the long-term NEET spells of young people in New Zealand, Ministry of Business, Innovation and Employment, Wellington.
OECD (Organisation for Economic Co-operation and Development), 2016, Investing in youth: Australia, OECD action plan for youth, OECD, Paris.
Quintini, G, Martin, J & Martin, S 2007, The changing nature of the school-to-work transition process in OECD countries, IZA discussion paper no.2582, IZA, Bonn, viewed 5 April 2016, <http://ftp.iza.org/dp2582.pdf>.
Samoilenko, A & Carter, K 2015, Economic outcomes of youth not in education, employment or training (NEET), New Zealand Treasury working paper no.15/01, New Zealand Treasury, Wellington, viewed 18 April 2017, <http://www.treasury.govt.nz/publications/research-policy/wp/2015/15-01/>.
42 Who are the persistently NEET young people?
Appendix A: What constitutes persistently NEET?
For the current project, six or more months of consecutive NEET is used as the definition
of persistence.25 Although six months NEET is somewhat arbitrary, half-a-year seems a
sensible cut-off length of time. A longer period, for example, nine months or a year,
would likely exclude a larger number of participants who have been shown to be ‘at risk’
in the literature and also decrease the sample. Shorter than six months in a block, for
example, three months, would include participants on holidays between formal
education, for example, schooling finishes in November but university starts in March,
leaving a period of three months unaccounted for (December, January and February).
Another reason for using six months or more of consecutive NEET relates to definitions
and eligibility for unemployment in Australia. Although the definition of long-term
unemployment in Australia is 12 months, government benefits for unemployment
typically have further criteria for eligibility at six months. That is, someone who is
unable to find employment by six months may be subject to further requirements of
either enforced work (for example, work experience), specific forms of job seeking, or
additional education that would lead to increased employability. There have been calls
to change unemployment benefits to a maximum of six months, reasoning that this
would force unemployed people into work rather than relying on benefits and becoming
long-term unemployed. So, although 12 months is considered long-term unemployed in
Australia, six months is also an indicator of problematic unemployment. It was also the
average duration of unemployment for young Australians in 2014 (Brotherhood of St
Laurence 2014). Six months therefore seems to be a good indicator of disengagement.
Instead of a six-month block (or more), an ‘in-and-out’ measure could have been
included in persistently NEET. For example, if a participant was NEET for a total of six
months in a 12-month period, they would be included as persistently NEET. This inclusion
is however problematic for two reasons. Firstly, the derivation of participants who are in
and out of persistently NEET for six of every 12 months would need to occur on a rolling
basis. That is, the 12 months is not a calendar year or an interview year, but any 12-
month period that contains six months of NEET. This would cause practical difficulties in
deriving the variable from the LSAY dataset.
Secondly, six of 12 months NEET may not be similar to six months plus in a block NEET.
Someone who is NEET for six months straight and starts off unemployed but becomes
NILF due to disengagement with the labour market would be different from someone
who took three months off for holidays before returning to work and then decided to
leave work and become unemployed for three months before starting a new job. There
may be much more flexibility in being NEET for six of 12 months compared with a six-
month block, but this is not the focus of the current project.
25 This six-month or longer block does not have to encompass the interview point in LSAY.

NCVER 43
Appendix B: Attrition analysis
The following provides the main highlights for the attrition analysis that was conducted
on both the Y03 and Y06 cohorts of LSAY, predicting the completion of the wave 10
surveys (using a logistic regression model approach).
The following variables were used in the regression models: sex, Indigenous status,
geographic location, language spoken at home, Year 12 completion, had children, ESCS,
NEET for any month across the period, and NEET for six consecutive months across the
period.
Significant predictors of non-completion were:
For the Y03 survey
� Individuals who were NEET for at least one month during the survey were 73.1% less
likely to drop out than individuals who were never known to be NEET (but note that
being in the survey longer increases opportunity to be NEET leading to a ‘chicken and
egg’ causality dilemma).
� Females were 21.3% more likely to drop out than males.
� Non-Indigenous participants were 47.1% less likely to drop out than Indigenous
participants.
� Participants who had not completed Year 12 by their most recent interview were 3.5
times more likely to drop out than those who had completed Year 12 by their most
recent interview (but note that being in the survey longer increases opportunity to
complete Year 12).
� Participants belonging to the lowest SES quartile were 2.4 times more likely to drop
out than participants belonging to the highest SES quartile.
� Participants belonging to the second SES quartile were 1.7 times more likely to drop
out than participants belonging to the highest SES quartile.
� Participants belonging to the third SES quartile were 1.4 times more likely to drop
out than participants belonging to the highest SES quartile.
For the Y06 survey
� Individuals who were NEET for at least one month during the survey were 47.2% less
likely to drop out than individuals who were never known to be NEET (but note that
being in the survey longer increases opportunity to be NEET).
� Non-Indigenous participants were 42.8% less likely to drop out than Indigenous
participants.
� Participants who had not completed Year 12 by their most recent interview were 3.5
times more likely to drop out than those who had completed Year 12 by their most
recent interview (but note that being in the survey longer increases opportunity to
complete Year 12).

44 Who are the persistently NEET young people?
� Participants belonging to the lowest SES quartile were 1.9 times more likely to drop
out than participants belonging to the highest SES quartile.
� Participants belonging to the second SES quartile were 1.6 times more likely to drop
out than participants belonging to the highest SES quartile.
� Participants belonging to the third SES quartile were 1.2 times more likely to drop
out than participants belonging to the highest SES quartile.

NCVER 45
Appendix C: Detailed results Table C1 Associations between the wave 2 sample an d those still present in wave 10 by
socio-demographic characteristics
Characteristic Y03 Y06
X2 df* p-value V X2 df* p-value V
Sex 1.20 1 0.2700 0.01 0.4 1 0.5500 0.006
Indigenous status 64.20 1 <.0001 0.08 50.3 1 <.0001 0.070
Geographic location 15.10 2 0.0005 0.04 17.5 2 0.0002 0.040
Home language 0.37 1 0.5500 0.01 0.1 1 0.7200 0.004
Year 12 completion 1215.70 2 <.0001 0.36** 1411.4 2 <.0001 0.390**
Had children 90.90 1 <.0001 0.10 127.7 1 <.0001 0.120
ESCS 280.80 3 <.0001 0.17 190.7 4 <.0001 0.140
Note: *Degrees of freedom. ** As was mentioned in the report, this is not a meaningful association because the wave 2 sample still had people at school, whereas those who were in wave 10 had no one still at school.
Table C2 Associations between socio-demographic ch aracteristics and persistently NEET status for those still in the survey at wave 10
Characteristic Y03 Y06
X2 df* p-value V X2 df* p-value V
Sex 31.5 1 <.0001 0.09 1.01 1 0.3100 0.017
Indigenous status 4.6 1 0.0300 0.03 8.80 1 0.0030 0.050
Geographic location 12.1 2 0.0020 0.06 14.40 2 0.0007 0.060
Home language 0.6 1 0.4600 0.01 2.60 1 0.1100 0.030
Year 12 completion 100.9 1 <.0001 0.16 59.40 1 <.0001 0.130
Had children 381.0 1 <.0001 0.31 220.50 1 <.0001 0.250
ESCS 65.4 3 <.0001 0.13 56.20 4 <.0001 0.130
Note: *Degrees of freedom.
Table C3 Associations between socio-demographic ch aracteristics and persistently NEET status between the ages of 15 and 19 for those stil l in the survey at wave 10
Characteristic Y03 Y06
X2 df* p-value V X2 df* p-value V
Sex 2.4 1 0.1200 0.03 0.0002 1 0.9900 0.0003
Indigenous status 6.1 1 0.0130 0.04 5.8000 1 0.0200 0.0400
Geographic location 9.4 2 0.0100 0.05 15.2000 2 0.0005 0.0700
Home language 1.4 1 0.2400 0.02 8.6000 1 0.0030 0.0500
Year 12 completion 205.8 1 <.0001 0.23 49.9000 1 <.0001 0.1200
Had children 68.1 1 <.0001 0.13 93.2000 1 <.0001 0.1600
ESCS 25.2 3 <.0001 0.08 33.8000 4 <.0001 0.1000
Note: *Degrees of freedom.

46 Who are the persistently NEET young people?
Table C4 Logistic regression results for the likel ihood of being persistently NEET at any time by socio-demographic characteristics for the Y03 co hort
Covariates Level B Standard error of B
df p-value Odds ratio
Sex Female 0.1727 0.0459 1 0.0002 1.412
Indigenous status Non-Indigenous -0.1196 0.0871 1 0.1697 0.787
ESCS Lowest quartile 0.3001 0.0734 1 <.0001 1.395
Second quartile -0.0825 0.0792 1 0.2976 0.952
Third quartile -0.1846 0.0817 1 0.0239 0.859
Geographic location Provincial 0.1824 0.127 1 0.151 1.051
Remote -0.3155 0.2304 1 0.1709 0.639
Completed Year 12 No 0.3239 0.0506 1 <.0001 1.911
Home language Language other than English
0.08 0.0873 1 0.3595 1.174
Had children ages 15–19
Yes 1.1644 0.0575 1 <.0001 10.265
Note: For ESCS the reference category is the top quartile (least disadvantaged), and for geographic location it is city.
Table C5 Logistic regression results for the likel ihood of being persistently NEET at any time by socio-demographic characteristics for the Y06 co hort
Covariates Level B Standard error of B
df p-value Odds ratio
Sex Female -0.0102 0.0348 1 0.7706 0.980
Indigenous status Non-Indigenous -0.2055 0.0665 1 0.0020 0.663
ESCS Lowest quartile 0.2562 0.0602 1 <.0001 1.676
Second quartile 0.0784 0.0585 1 0.1803 1.403
Third quartile -0.0747 0.0597 1 0.2106 1.203
Geographic location Provincial 0.0172 0.0809 1 0.8320 0.998
Remote -0.0359 0.1392 1 0.7962 0.947
Completed Year 12 No 0.1603 0.0412 1 0.0001 1.378
Home language Language other than English
-0.0415 0.0720 1 0.5644 0.920
Had children ages 15–19
Yes 1.0487 0.0614 1 <.0001 8.145
Note: For ESCS the reference category is the top quartile (least disadvantaged), and for geographic location it is city.

NCVER 47
Table C6 Logistic regression results for the likel ihood of being persistently NEET at ages 15–19 by socio-demographic characteristics for the Y03 cohort
Covariates Level B Standard error of B
df p-value Odds ratio
Sex Female 0.2203 0.1008 1 0.0289 1.554
Indigenous status Non-Indigenous -0.1268 0.1737 1 0.4655 0.776
ESCS Lowest quartile 0.3480 0.1547 1 0.0245 1.696
Second quartile 0.0398 0.1700 1 0.8149 1.247
Third quartile -0.2072 0.1880 1 0.2704 0.974
Geographic location Provincial 0.0185 0.2319 1 0.9363 1.151
Remote 0.1037 0.4092 1 0.8000 1.254
Completed Year 12 No 1.3898 0.1119 1 <.0001 16.114
Home language Language other than English
-0.3775 0.3126 1 0.2272 0.470
Had children ages 15–19
Yes 1.1064 0.1448 1 <.0001 9.142
Note: For ESCS the reference category is the top quartile (least disadvantaged), and for geographic location it is city.
Table C7 Logistic regression results for the likel ihood of being persistently NEET at ages 15–19 by socio-demographic characteristics for the Y06 cohort
Covariates Level B Standard error of B
df p-value Odds ratio
Sex Female -0.0214 0.0510 1 0.6746 0.958
Indigenous status Non-Indigenous -0.2794 0.0933 1 0.0027 0.572
ESCS Lowest quartile 0.3653 0.0863 1 <.0001 2.225
Second quartile 0.1599 0.0834 1 0.0552 1.812
Third quartile -0.0908 0.0875 1 0.2992 1.410
Geographic location Provincial 0.1845 0.1317 1 0.1610 1.044
Remote -0.3262 0.2361 1 0.1670 0.626
Completed Year 12 No 0.4503 0.0576 1 <.0001 2.461
Home language Language other than English
-0.3802 0.1329 1 0.0042 0.467
Had children ages 15–19
Yes 1.1126 0.1184 1 <.0001 9.255
Note: For ESCS the reference category is the top quartile (least disadvantaged), and for geographic location it is city.

48 Who are the persistently NEET young people?
Table C8 Logistic regression results for the likel ihood of being persistently NEET at ages 20–24 for those who were early persistently NEET for t he Y03 cohort
Covariates Level B Standard error of B
df p-value Odds ratio
Sex Female 0.3175 0.0581 1 <.0001 1.887
Indigenous status Non-Indigenous -0.1762 0.1376 1 0.2004 0.703
ESCS Lowest quartile 0.4385 0.097 1 <.0001 1.877
Second quartile 0.0250 0.0977 1 0.7979 1.241
Third quartile -0.2723 0.101 1 0.0070 0.922
Early persistent NEET
Yes 0.5550 0.1574 1 0.0004 3.034
Geographic location Provincial 0.0284 0.1484 1 0.8481 1.083
Remote 0.0233 0.2628 1 0.9294 1.078
Completed Year 12 No 0.4032 0.0762 1 <.0001 2.240
Home language Language other than English
-0.0153 0.1094 1 0.8888 0.970
Had children ages 15–19
Yes 0.7433 0.1645 1 <.0001 4.422
Note: For ESCS the reference category is the top quartile (least disadvantaged), and for geographic location it is city.
Table C9 Logistic regression results for the likel ihood of being persistently NEET at ages 20–24 for those who were early persistently NEET for t he Y06 cohort
Covariates Level B Standard error of B
df p-value Odds ratio
Sex Female 0.0671 0.0522 1 0.1980 1.144
Indigenous status Non-Indigenous -0.1124 0.1229 1 0.3602 0.799
ESCS Lowest quartile 0.3951 0.0946 1 <.0001 2.119
Second quartile 0.0299 0.0906 1 0.7412 1.471
Third quartile -0.0693 0.0867 1 0.4239 1.332
Early persistent NEET
Yes 0.8426 0.0766 1 <.0001 5.393
Geographic location Provincial -0.1339 0.1178 1 0.2557 1.059
Remote 0.3248 0.1986 1 0.1019 1.675
Completed Year 12 No 0.2750 0.0759 1 0.0003 1.733
Home language Language other than English
-0.0279 0.1062 1 0.7927 0.946
Had children ages 15–19
Yes 1.0376 0.2140 1 <.0001 7.967
Note: For ESCS the reference category is the top quartile (least disadvantaged), and for geographic location it is city.

NCVER 49
Table C10 Logistic regression results for the like lihood of studying for or achieving a certificate III or higher by age 24 for those who w ere early persistently NEET for the Y03 cohort
Covariates Level B Standard error of B
df p-value Odds ratio
Sex Female 0.2331 0.0497 1 <.0001 1.594
Indigenous status Non-Indigenous 0.2537 0.1208 1 0.0357 1.661
ESCS Lowest quartile -0.6907 0.0831 1 <.0001 0.272
Second quartile -0.1564 0.0822 1 0.0570 0.463
Third quartile 0.2341 0.0849 1 0.0058 0.685
Geographic location Provincial -0.0568 0.1330 1 0.6692 0.882
Remote -0.0119 0.2384 1 0.9601 0.922
Early persistent NEET
Yes -0.6000 0.1557 1 0.0001 0.301
Completed Year 12 No -0.5618 0.0630 1 <.0001 0.325
Home language Language other than English
0.3303 0.1133 1 0.0035 1.936
Had children ages 15–19
Yes -0.3171 0.1812 1 0.0800 0.530
Note: For ESCS the reference category is the top quartile (least disadvantaged), and for geographic location it is city.
Table C11 Logistic regression results for the like lihood of studying for or achieving a certificate III or higher by age 24 for those who w ere early persistently NEET for the Y06 cohort
Covariates Level B Standard error of B
df p-value Odds ratio
Sex Female 0.2669 0.0505 1 <.0001 1.705
Indigenous status Non-Indigenous 0.2141 0.1135 1 0.0593 1.534
ESCS Lowest quartile -0.4234 0.0912 1 <.0001 0.389
Second quartile -0.3162 0.0825 1 0.0001 0.433
Third quartile 0.2184 0.0855 1 0.0106 0.739
Geographic location Provincial -0.0896 0.1239 1 0.4692 0.947
Remote 0.1251 0.2176 1 0.5654 1.174
Early persistent NEET
Yes -0.6349 0.0784 1 <.0001 0.281
Completed Year 12 No -0.4683 0.0684 1 <.0001 0.392
Home language Language other than English
0.3800 0.1253 1 0.0024 2.138
Had children ages 15–19
Yes -0.0704 0.2038 1 0.7299 0.869
Note: For ESCS the reference category is the top quartile (least disadvantaged), and for geographic location it is city.

50 Who are the persistently NEET young people?
Table C12 Logistic regression results for the like lihood of being in employment at age 24 for those who were early persistently NEET for the Y03 cohort
Covariates Level B Standard error of B
df p-value Odds ratio
Sex Female -0.1880 0.0450 1 <.0001 0.687
Indigenous status Non-Indigenous 0.0641 0.1247 1 0.6070 1.137
ESCS Lowest quartile -0.0317 0.0880 1 0.7190 1.107
Second quartile 0.1190 0.0825 1 0.1493 1.287
Third quartile 0.0462 0.0772 1 0.5497 1.197
Early persistent NEET
Yes -0.2177 0.1604 1 0.1748 0.647
Geographic location Provincial 0.0167 0.1234 1 0.8925 0.947
Remote -0.0876 0.2179 1 0.6875 0.853
Completed Year 12 No -0.1755 0.0705 1 0.0128 0.704
Home language Language other than English
-0.1382 0.0804 1 0.0856 0.759
Had children ages 15–19
Yes -0.1850 0.1722 1 0.2827 0.691
Note: For ESCS the reference category is the top quartile (least disadvantaged), and for geographic location it is city.
Table C13 Logistic regression results for the like lihood of being in employment at age 24 for those who were early persistently NEET for the Y06 cohort
Covariates Level B Standard error of B
df p-value Odds ratio
Sex Female -0.03920 0.0429 1 0.3610 0.925
Indigenous status Non-Indigenous 0.20510 0.1071 1 0.0555 1.507
ESCS Lowest quartile -0.02560 0.0871 1 0.7687 1.005
Second quartile 0.00199 0.0776 1 0.9796 1.033
Third quartile 0.05420 0.0727 1 0.4559 1.088
Early persistent NEET Yes -0.52640 0.0747 1 <.0001 0.349
Geographic location Provincial 0.00489 0.1133 1 0.9656 0.983
Remote -0.02650 0.1983 1 0.8938 0.953
Completed Year 12 No -0.04470 0.0730 1 0.5405 0.915
Home language Language other than English -0.26550 0.0765 1 0.0005 0.588
Had children ages 15–19
Yes -0.41530 0.1839 1 0.0239 0.436
Note: For ESCS the reference category is the top quartile (least disadvantaged), and for geographic location it is city.

Appendix D: Main activities for the persistently NEET by gender
Note that the table totals for the activities only include individuals once for a given activity, so the overall total in the last column is less than totals for each wave.
However, some individuals will have reported more than one activity and in that sense will be counted more than once. Also, for the overall totals in the last column, the
total for NILF and unemployed is less than the sum of the NILF or unemployed across waves as individuals are only counted once (not for each wave they were NILF or
unemployed).
Table D1 Wave-by-wave activity for females who were in a persistently NEET block at interview point fo r the Y03 cohort
Activity W2 2004 W3 2005 W4 2006 W5 2007 W6 2008 W7 2009 W8 2010 W9 2011 W10 2012 Total
No. % No. % No. % No. % No. % No. % No. % No. % No. % No. %
Study or training 0 0 0 0 0 0 0 0 0 0 2 4 1 2 1 2 0 0 4 2
Home duties or looking after children
0 0 11 85 12 80 16 94 17 94 41 79 48 84 44 77 50 75 118 72
Travel or holiday
0 0 1 8 0 0 0 0 0 0 3 6 3 5 4 7 6 9 15 9
Ill or unable to work
0 0 0 0 1 7 0 0 0 0 2 4 2 4 7 12 8 12 12 7
Other 0 0 1 8 2 13 1 6 1 6 4 8 3 5 1 2 3 4 15 9
Total 0 0 13 100 15 100 17 100 18 100 52 100 57 100 57 100 67 100 164 100
NILF 0 0 13 46 15 56 17 53 18 75 52 72 57 74 57 72 67 83 146 65
Unemployed 0 0 15 54 12 44 15 47 6 25 20 28 20 26 22 28 14 17 80 35
Total 0 0 28 100 27 100 32 100 24 100 72 100 77 100 79 100 81 100 226 100

Table D2 Wave-by-wave activity for males who were i n a persistently NEET block at interview point for the Y03 cohort
Activity W2 2004 W3 2005 W4 2006 W5 2007 W6 2008 W7 2009 W8 2010 W9 2011 W10 2012 Total
No. % No. % No. % No. % No. % No. % No. % No. % No. % No. %
Study or training 0 0 0 0 0 0 1 33 2 40 3 25 1 10 2 14 0 0 8 15
Home duties or looking after children
0 0 1 33 2 40 0 0 1 20 0 0 0 0 4 29 4 24 10 18
Travel or holiday 0 0 0 0 0 0 0 0 0 0 1 8 0 0 2 14 3 18 5 9
Ill or unable to work
0 0 0 0 2 40 1 33 0 0 4 33 3 30 2 14 4 24 11 20
Other 0 0 2 67 1 20 1 33 2 40 4 33 6 60 4 29 6 35 21 38
Total 0 0 3 100 5 100 3 100 5 100 12 100 10 100 14 100 17 100 55 100
NILF 0 0 3 20 5 36 3 23 5 50 12 29 10 28 14 42 17 53 43 35
Unemployed 0 0 12 80 9 64 10 77 5 50 30 71 26 72 19 58 15 47 80 65
Total 0 0 15 100 14 100 13 100 10 100 42 100 36 100 33 100 32 100 123 100

Table D3 Wave-by-wave activity for females who were in a persistently NEET block at interview point fo r the Y06 cohort
Activity W2 2007 W3 2008 W4 2009 W5 2010 W6 2011 W7 2012 W8 2013 W9 2014 W10 2015 Total
No. % No. % No. % No. % No. % No. % No. % No. % No. % No. %
Study or training
0 0 1 7 2 5 0 0 0 0 0 0 1 2 0 0 1 3 5 3
Home duties or looking after children
5 63 8 54 23 55 25 63 15 50 15 94 30 70 33 87 24 83 90 60
Travel or holiday
0 0 1 7 5 12 7 18 1 3 1 6 1 2 3 8 1 3 20 13
Ill or unable to work
0 0 2 13 2 5 2 5 0 0 0 0 5 12 2 5 0 0 10 7
Other 3 38 3 20 10 24 6 15 14 47 0 0 6 14 0 0 3 10 24 16
Total 8 100 15 100 42 100 40 100 30 100 16 100 43 1 00 38 100 29 100 149 100
NILF 11 37 15 39 42 40 40 60 30 64 16 52 43 75 38 70 29 71 118 50
Unemployed 19 63 23 61 62 60 27 40 17 36 15 48 14 25 16 30 12 29 119 50
Total 30 100 38 100 104 100 67 100 47 100 31 100 57 100 54 100 41 100 237 100

Table D4 Wave-by-wave activity for males who were i n a persistently NEET block at interview point for the Y06 cohort
Activity W2 2007 W3 2008 W4 2009 W5 2010 W6 2011 W7 2012 W8 2013 W9 2014 W10 2015 Total
No. % No. % No. % No. % No. % No. % No. % No. % No. % No. %
Study or training
0 0 0 0 1 3 1 10 1 14 0 0 0 0 0 0 1 17 4 7
Home duties or looking after children
1 33 5 33 4 14 2 20 1 14 4 57 2 17 2 22 2 33 18 33
Travel or holiday
0 0 1 7 10 34 1 10 1 14 1 14 4 33 1 11 3 50 22 40
Ill or unable to work
0 0 1 7 0 0 3 30 1 14 1 14 6 50 2 22 0 0 4 7
Other 2 67 8 53 14 48 3 30 3 43 1 14 0 0 4 44 0 0 7 13
Total 3 100 15 100 29 100 10 100 7 100 7 100 12 100 9 100 6 100 55 100
NILF 4 25 15 38 29 30 10 26 7 23 7 39 12 36 9 31 6 27 43 25
Unemployed 12 75 25 63 67 70 28 74 23 77 11 61 21 64 20 69 16 73 126 75
Total 16 100 40 100 96 100 38 100 30 100 18 100 33 100 29 100 22 100 169 100

National Centre for Vocational Education Research
Level 5, 60 Light Square, Adelaide, SA 5000
PO Box 8288 Station Arcade, Adelaide SA 5000, Australia
Phone +61 8 8230 8400 Email [email protected]
Web <https://www.ncver.edu.au> <http://www.lsay.edu.au>
Follow us: <https://twitter.com/ncver> <https://www.linkedin.com/company/ncver>