WHO AND WHAT GETS LEFT BEHIND? - Brookings · John W. McArthur is a senior fellow in the Global...
58
WHO AND WHAT GETS LEFT BEHIND? ASSESSING CANADA’S DOMESTIC STATUS ON THE SUSTAINABLE DEVELOPMENT GOALS John W McArthur Krista Rasmussen GLOBAL ECONOMY & DEVELOPMENT WORKING PAPER 108 | OCTOBER 2017
Transcript of WHO AND WHAT GETS LEFT BEHIND? - Brookings · John W. McArthur is a senior fellow in the Global...

WHO AND WHAT GETS LEFT BEHIND? ASSESSING CANADA’S DOMESTIC STATUS ON THE SUSTAINABLE DEVELOPMENT GOALS
John W McArthur
Krista Rasmussen
GLOBAL ECONOMY & DEVELOPMENT WORKING PAPER 108 | OCTOBER 2017


John W. McArthur is a senior fellow in the Global
Economy and Development program at the Brookings
Institution.
Krista Rasmussen is a research analyst in the Global
Economy and Development program at the Brookings
Institution.
Acknowledgements:
The Brookings Institution is a nonprofit organization devoted to independent research and policy solutions. Its mis-
sion is to conduct high-quality, independent research and, based on that research, to provide innovative, practical
recommendations for policymakers and the public. The conclusions and recommendations of any Brookings pub-
lication are solely those of its author(s), and do not reflect the views of the Institution, its management, or its other
scholars.
Brookings recognizes that the value it provides is in its absolute commitment to quality, independence and impact.
Activities supported by its donors reflect this commitment and the analysis and recommendations are not deter-
mined or influenced by any donation. A full list of contributors to the Brookings Institution can be found in the Annual
Report at https://www.brookings.edu/about-us/annual-report/.
The authors thank Margaret Biggs, Kaysie Brown, George Ingram, Homi Kharas, Allison Loat, Lorenz Noe, Tony
Pipa, and Brina Seidel for invaluable comments on earlier drafts of this paper.

CONTENTS
Introduction . . . . . . . . . . . . . . . . . . . . . . . . . . . . . . . . . . . . . . . . . . . . . . . . . . . . . . . . . . . . . . . . . . . . . . . 1
I. Previous Studies . . . . . . . . . . . . . . . . . . . . . . . . . . . . . . . . . . . . . . . . . . . . . . . . . . . . . . . . . . . . . . . . . 4
II. Data and Methods . . . . . . . . . . . . . . . . . . . . . . . . . . . . . . . . . . . . . . . . . . . . . . . . . . . . . . . . . . . . . . . . 6Identifying assessable outcome targets . . . . . . . . . . . . . . . . . . . . . . . . . . . . . . . . . . . . . . . . . . . . . . 6Identifying indicators and data sources . . . . . . . . . . . . . . . . . . . . . . . . . . . . . . . . . . . . . . . . . . . . . . . 7Assessing status . . . . . . . . . . . . . . . . . . . . . . . . . . . . . . . . . . . . . . . . . . . . . . . . . . . . . . . . . . . . . . . . 9
III. Results . . . . . . . . . . . . . . . . . . . . . . . . . . . . . . . . . . . . . . . . . . . . . . . . . . . . . . . . . . . . . . . . . . . . . . . 10National . . . . . . . . . . . . . . . . . . . . . . . . . . . . . . . . . . . . . . . . . . . . . . . . . . . . . . . . . . . . . . . . . . . . . . 10Provinces and Territories . . . . . . . . . . . . . . . . . . . . . . . . . . . . . . . . . . . . . . . . . . . . . . . . . . . . . . . . . 20Cities . . . . . . . . . . . . . . . . . . . . . . . . . . . . . . . . . . . . . . . . . . . . . . . . . . . . . . . . . . . . . . . . . . . . . . . . 24Demographic disaggregation: by indigenous status, immigration status,
and people living with a disability . . . . . . . . . . . . . . . . . . . . . . . . . . . . . . . . . . . . . . . . . . . . . . . 27
IV. Strategies to Date . . . . . . . . . . . . . . . . . . . . . . . . . . . . . . . . . . . . . . . . . . . . . . . . . . . . . . . . . . . . . . 29National . . . . . . . . . . . . . . . . . . . . . . . . . . . . . . . . . . . . . . . . . . . . . . . . . . . . . . . . . . . . . . . . . . . . . . 29Provincial . . . . . . . . . . . . . . . . . . . . . . . . . . . . . . . . . . . . . . . . . . . . . . . . . . . . . . . . . . . . . . . . . . . . . 29Cities . . . . . . . . . . . . . . . . . . . . . . . . . . . . . . . . . . . . . . . . . . . . . . . . . . . . . . . . . . . . . . . . . . . . . . . . 32
V. Synthesis and Conclusion . . . . . . . . . . . . . . . . . . . . . . . . . . . . . . . . . . . . . . . . . . . . . . . . . . . . . . . . 32
References . . . . . . . . . . . . . . . . . . . . . . . . . . . . . . . . . . . . . . . . . . . . . . . . . . . . . . . . . . . . . . . . . . . . . . 37
Appendixes . . . . . . . . . . . . . . . . . . . . . . . . . . . . . . . . . . . . . . . . . . . . . . . . . . . . . . . . . . . . . . . . . . . . . . 43
FIGURES
Figure 1: Logic tree for identifying assessable domestic SDG targets in Canada . . . . . . . . . . . . . . . . . 6Figure 2. Seventy-eight of 169 SDG targets describe potentially assessable
outcomes for Canada . . . . . . . . . . . . . . . . . . . . . . . . . . . . . . . . . . . . . . . . . . . . . . . . . . . . . . . 7Figure 3. Logic tree for identifying data sources . . . . . . . . . . . . . . . . . . . . . . . . . . . . . . . . . . . . . . . . . . . 8
TABLES:
Table 1: Assessment of Canada’s status on domestic SDG targets . . . . . . . . . . . . . . . . . . . . . . . . . . 11Table 2: Summary of Canada’s status on domestic SDG indicators . . . . . . . . . . . . . . . . . . . . . . . . . . 19Table 3. Provinces and territories - status assessment on select SDG targets . . . . . . . . . . . . . . . . . . 21Table 4. Provinces and territories - status assessment on select SDG health targets . . . . . . . . . . . . 23Table 5. Gender disaggregation - status assessment of select SDG targets
by province and territory . . . . . . . . . . . . . . . . . . . . . . . . . . . . . . . . . . . . . . . . . . . . . . . . . . . . . 25Table 6. Municipalities - status assessment across select SDG targets . . . . . . . . . . . . . . . . . . . . . . . 26Table 7. Indigenous people - status assessment on select SDG targets . . . . . . . . . . . . . . . . . . . . . . . 28Table 8. Provincial strategies potentially relevant to SDGs . . . . . . . . . . . . . . . . . . . . . . . . . . . . . . . . . 30Table 9. Municipal strategies potentially relevant to SDGs . . . . . . . . . . . . . . . . . . . . . . . . . . . . . . . . . 31Appendix 1. Classification of SDG outcome targets . . . . . . . . . . . . . . . . . . . . . . . . . . . . . . . . . . . . . . 43Appendix 2. Trajectory assessment for Canada on domestic SDG targets . . . . . . . . . . . . . . . . . . . . . 49

WHO AND WHAT GETS LEFT BEHIND? 1
WHO AND WHAT GETS LEFT BEHIND? ASSESSING CANADA’S DOMESTIC STATUS ON THE SUSTAINABLE DEVELOPMENT GOALS
John W McArthur
Krista Rasmussen
INTRODUCTION
One of the most important aspects of the
Sustainable Development Goals (SDGs), af-
firmed by leaders of all 193 United Nations member
states in September 2015, is that they apply to coun-
tries at all income levels. This contrasts with the prede-
cessor Millennium Development Goals (MDGs), which
concentrated more on countries grappling with prob-
lems linked to extreme poverty. While the 17 SDGs
(see Box 1) include many MDG successor targets
focused on an absolute global standard of eliminating
the most extreme forms of poverty and deprivation,
they also include objectives for each society to tackle
domestically, relative to its own baseline. For example,
all countries agreed to cut their national poverty rate by
half by 2030 and to cut their non-communicable dis-
ease mortality rate by a third by the same year. These
are in addition to targets for common global challenges
like fighting climate change and protecting 10 percent
of maritime areas by 2020.
Like the MDGs, the SDGs aim to shift trajectories
where business-as-usual is not satisfactory (McArthur
and Rasmussen 2016, 2017), including in highly
advanced economies like Canada. To that end, this
paper draws from existing data sources to present a
baseline assessment of Canada’s current domestic
status toward achieving the SDGs. To our knowledge,
it is the first study to present a detailed national and
subnational assessment of SDG status within a G-7
economy. It aims to serve as a reference point that can
inform policy dialogues in Canada and other advanced
economies, and thereby follows the U.N.’s formal SDG
architecture of goals, targets, and indicators as much
as practical. This “by the book” approach helps to gen-
erate a logical framework for translating the full list of
SDG targets into a subset of quantitatively assessable
outcome targets.
Our approach gives particular attention to the SDG phi-
losophy of “no one left behind.” When focusing only on
Canada’s average national outcomes, it can be easy
to forget that each percentage point of the population
represents approximately 360,000 people. Even 97
percent population coverage on an issue might first
look like success, but it still implies a 3 percent short-
fall, equivalent to more than a million Canadians. For
SDG targets that commit to a desired outcome for “all”
people or “universal” coverage, we therefore interpret

2 GLOBAL ECONOMY AND DEVELOPMENT PROGRAM
this literally as 100 percent of the population. We sup-
plement the national assessment with an examination
of key indicators across Canada’s 10 provinces and
three territories, in addition to a subset of five major
municipalities. We further assess some indicators
across various dimensions of disaggregation, includ-
ing gender, indigenous status, immigration status, and
disability status.
Our methodology identifies a total of 78 SDG targets
that are outcome-focused, relevant to high-income
countries, and quantitatively assessable. This includes
targets where the official U.N. language entails at least
some quantified wording and targets for which we are
able to establish proxy benchmarks. However, not all
targets have data available. Drawing from diverse data
sources, we are able to assess Canada’s national sta-
tus on 61 targets by evaluating 73 underlying indicators.
The results underscore the relevance of the SDGs to
Canada’s existing domestic challenges. We find that
the country is “on track” for 17 indicators, “needs accel-
eration” on 12 indicators, and “needs a breakthrough”
on 26 indicators. Canada even appears to have been
moving backward recently on 18 indicators, such as
food insecurity, children overweight, adolescent nu-
meracy, access to safe drinking water, access to af-
fordable housing, share of electricity consumption in
renewables, and reported crimes against females. At a
sub-national level, we find considerable variation in tra-
jectories across provinces, territories, municipalities,
and demographic disaggregates.
Overall, we find that Canada is not yet fully on track for
any of Goals 1 through 16. But this does not imply the
goals are unachievable. In many cases, the absolute
gap to a benchmark is small, prompting forward-look-
ing questions about which groups and issues require
the most targeted attention.
Our results should be interpreted with a degree of
caution. Conducting a synthesized assessment across
disparate SDG targets requires a variety of judgment
calls. Some U.N. target language requires interpreta-
tion. Alternative proxy targets could be developed to
align with different logics. Some official U.N. indicators
have data available but are not highly relevant to the
corresponding target’s core aims, and require sub-
stitute indicators to be identified. Some data sources
have only limited time-series available to inform a for-
ward-looking trajectory analysis. For all such issues,
refinements to our approach may well be possible as
new data become available and as Canada further
specifies its ambitions across its levels of government.
In the meantime, our results draw attention to the fron-
tier economic, social and environmental challenges
embedded in Canada’s pursuit of the SDGs.
The remainder of the paper is presented in five sec-
tions. Section I describes previous studies that are
relevant for Canada’s domestic SDG assessment.
Section II presents an overview of our methodology.
Some readers may want to jump straight to Section
III to read the core results. Section IV briefly reviews
some SDG-relevant national, provincial, and municipal
strategies already published. Section V then presents
a synthesis discussion and conclusion.

WHO AND WHAT GETS LEFT BEHIND? 3
Box 1: The Sustainable Development Goals
Goal 1. End poverty in all its forms everywhere
Goal 2. End hunger, achieve food security and improved nutrition and promote sustainable agriculture
Goal 3. Ensure healthy lives and promote well-being for all at all ages
Goal 4. Ensure inclusive and equitable quality education and promote lifelong learning opportunities for all
Goal 5. Achieve gender equality and empower all women and girls
Goal 6. Ensure availability and sustainable management of water and sanitation for all
Goal 7. Ensure access to affordable, reliable, sustainable and modern energy for all
Goal 8. Promote sustained, inclusive and sustainable economic growth, full and productive employment and decent work for all
Goal 9. Build resilient infrastructure, promote inclusive and sustainable industrialization and foster innovation
Goal 10. Reduce inequality within and among countries
Goal 11. Make cities and human settlements inclusive, safe, resilient and sustainable
Goal 12. Ensure sustainable consumption and production patterns
Goal 13. Take urgent action to combat climate change and its impacts
Goal 14. Conserve and sustainably use the oceans, seas and marine resources for sustainable development
Goal 15. Protect, restore and promote sustainable use of terrestrial ecosystems, sustainably manage forests, combat desertification, and halt and reverse land degradation and halt biodiversity loss
Goal 16. Promote peaceful and inclusive societies for sustainable development, provide access to justice for all and build effective, accountable and inclusive institutions at all levels
Goal 17. Strengthen the means of implementation and revitalize the global partnership for sustainable development

4 GLOBAL ECONOMY AND DEVELOPMENT PROGRAM
I. PREVIOUS STUDIES
Our deep dive SDG assessment of a single coun-
try builds on previous SDG benchmarking ex-
ercises. The Organization for Economic Cooperation
and Development (2017d), for example, focuses on
domestic challenges within advanced economies and
assesses the distance each country needs to travel to
achieve each of 98 SDG targets by 2030.1 To fill in the
blanks for targets not specifically quantified in SDG
target language, the authors either adopt targets from
other international agreements or set the relevant stan-
dard as the 90th percentile among OECD countries as
of 2010. This approach finds that, in aggregate, OECD
countries are closest to meeting 2030 targets on
health, water, and energy and furthest away on gender
equality. Canada is included in the OECD averages but
not individually reported because the country did not
join the study as a voluntary participant.
The Sustainable Development Solutions Network
(SDSN, Sachs et al. 2017) presents two assessments
of each country’s current SDG status. The first is a
“dashboard,” which evaluates 157 countries based on
99 indicators deemed to align with the goals. For each
indicator, the authors set global thresholds as bench-
marks. Not all thresholds align precisely with SDG
targets and many are set at a slightly lower standard
than the literal SDG wording. For example, countries
are considered to have achieved the SDG for universal
access to water if they have at least 98 percent cover-
age. In that context, Canada is deemed already to be
successful on 63 of 95 indicators.
The SDSN’s second assessment is a synthesis SDG
index. It calculates countries’ positions on each com-
ponent measure relative either to the formal SDG
target, to another threshold, or—in the case of targets
set as proportional change relative to national starting
points—to the average of the top five performing coun-
tries. Thus, the best possible index score for access
to drinking water is 100 percent, since many countries
have already achieved that, while the best possible in-
dex score for the target to reduce non-communicable
disease mortality by one-third is set at 9.3 deaths per
100,000 people, the current average of the top five
countries. Overall, Canada ranks 17th on the global
index and is deemed to be 78 percent of the way to
achieving the “optimal” SDG outcome.
At a sub-national level, multiple studies benchmark
U.S. cities on measures relevant to the SDGs.
Prakash et al. (2017) identifies 49 indicators to assess
SDG starting positions of the 100 largest American
metropolitan areas. Greene and Meixell of the Urban
Institute (2017) examine comparable metropolitan
areas to identify which SDG targets are relevant and
measurable. They find that 103 targets are relevant
to U.S. cities and 68 are measurable using publicly
available data. They also highlight data gaps in goals
that are particularly pertinent to cities, including on wa-
ter, consumption, climate, and justice. At the level of
individual cities, the USA-Sustainable Cities Initiative
(2016) identifies indicators that align with both local
priorities and SDG targets in Baltimore, Maryland.
Many of the most detailed national SDG analyses have
been conducted through Voluntary National Reviews
(VNR), whereby countries present their own approach
to the SDGs at the U.N.’s annual high-level political
forum (HLPF) on sustainable development. A total of
65 countries presented at the first two HLPFs, in 2016
and 2017. Canada has recently committed to present
at the HLPF in 2018.
Among advanced economies, Germany’s 2016 VNR
provides an important reference point for Canada, in
light of both countries’ federal structures of government.

WHO AND WHAT GETS LEFT BEHIND? 5
The German review describes an aim of integrating at
least one indicator-based objective per SDG into its
National Sustainability Strategy, but does not pres-
ent an initial domestic benchmarking. In that regard,
Finland’s 2016 VNR provides a useful example. It
maps the suitability and availability of all SDG indica-
tors and finds that less than half have national data
available. Sweden’s 2017 VNR meanwhile finds that,
of 120 indicators deemed relevant and with available
data, the country has already met targets for 49 indica-
tors, while noting that many of the targets require more
precise ambitions in order to enable future follow-up.
For Canada, we are not aware of any previous compre-
hensive national SDG assessments, although a num-
ber of efforts provide important insights. At a national
policy level, the federal ministry of Environment and
Climate Change Canada (ECCC) published, in 2016,
its Federal Sustainable Development Strategy 2016-
2019, which benchmarks many environment-related
dimensions of the SDGs (see Section V for further
discussion). As an independent research assessment
during the lead-up to the formal U.N. adoption of the
SDG framework, Kindornay et al. (2015) examined
seven candidate goals to assess Canadian data avail-
ability and quality. That study found particularly pro-
nounced gaps on measures related to governance.
From the perspective of civil society, the British
Columbia Council for International Cooperation
(BCCIC 2017) compiled recent indicator levels and
expert interview results to assess Canada’s status on
the seven SDGs prioritized at the U.N. HLPF in 2017. It
finds that Canada has stark regional and demographic
inequalities across goals and prominent challenges in
ensuring no one is left behind. The same organization
(BCCIC 2016b) also examined more than 2,000 civil
society organizations in British Columbia to map where
and how they are implementing the SDGs. Such as-
sessments provide an indication of the breadth of early
interest on both data and process issues for the SDGs,
both inside and outside of Canada. They all serve as
complementary resources to the benchmarking exer-
cise presented in this paper.

6 GLOBAL ECONOMY AND DEVELOPMENT PROGRAM
II. DATA AND METHODS
Our methodology prioritizes the U.N.’s
formal framework of targets, indica-
tors, and data. For the Canadian national
assessment this entails three basic steps.
First, we identify which SDG targets to
assess. We do this by identifying targets
that are outcome-focused, conceptually
relevant to Canada, and adequately quan-
tified and measureable to be “assessable”
through either the formal SDG framework or
a reasonable proxy measure. Second, we
identify data sources for the assessable tar-
gets, starting with the U.N. SDG statistical
database as the default and supplementing
with other sources where needed. Third, we
classify each indicator’s trajectory relative
to the SDG objective. The core elements
of these three steps are described below.
Further details are available in the online
supplement.
Identifying assessable outcome targetsFigure 1 outlines the sequence of ques-
tions we implement to identify assessable,
country-level outcome targets. We start by
filtering out targets that are not outcome-fo-
cused at the country level. This includes all
“lettered” targets that focus on means of im-
plementation; all targets under Goal 17; and
13 “numbered” targets that either focus on means of im-
plementation or are not pertinent to advanced economy
outcomes.2 We classify targets as outcome-focused if
we can identify any component clause that articulates
a desired outcome, which inevitably entails a degree
of subjectivity in some instances. The appendix and
online supplement provide further details on our classi-
fications for all targets.
We next separate the outcome-focused targets into
two groups: those that are both quantified and measur-
able—meaning they include either an explicit numerical
Q4: Can aproxy target beestablished?
169 SDG targets
Q2: Is targetquantified andmeasurable?
Not assessed (75)
Set proxy target
Assess whether on or off track (78) Not able to assess (16)
yes (94)
yes (37)
no (75)
no (57)
yes (5) no (52)
yes (36) no (16)
Q1: Is target outcome-focused at
country level?
Q3: DoesCanada have
national, quantifiedtarget?
Figure 1. Logic tree for identifying assessable domestic SDG targets in Canada

WHO AND WHAT GETS LEFT BEHIND? 7
target or an absolute verbal target with a clearly identi-
fiable outcome—and those that are not. This distinction
guides whether we can assess progress against the
objectives as written in the SDG framework or if we
need to set a proxy target. For the targets that the U.N.
framework does not formally quantify, we adopt an ex-
pansive approach to benchmarking. In five cases, we
identify an existing Canadian national target to serve
as a substitute. In other cases where target language
can be reasonably translated into a measurable ob-
jective, we typically set a proxy target of cutting the
relevant problem by half by 2030.3 This results in 78
quantitatively assessable outcome targets. Figure 2
shows the spread of assessable targets across the
17 separate SDGs. The general categorization of
37 quantified SDG targets, 41 proxy targets, and 91
other forms of targets (here not assessed) would apply
broadly across advanced economies.4
Identifying indicators and data sourcesFigure 3 outlines our approach to identifying data
sources. According to the formal SDG framework, our
78 assessable targets can so far be evaluated through
128 official indicators.5 We primarily use the U.N. SDG
Indicator Global Database as the default data source
and draw from other sources where needed. We
generally draw from information published as of May
2017.6
At the time of analysis, the U.N. database contained in-
formation for 57 of our 78 assessable targets. Of those,
only 20 targets had enough observations to conduct
a recent status assessment for Canada.7 For cases
where the U.N. database information is either not avail-
able or not analytically appropriate, we make use of two
dozen alternative sources and, in particular, Statistics
Canada’s online data sets (see online supplement for
0
2
4
6
8
10
12
14
16
18
20
Num
ber o
f tar
gets
Quantified SDG target Canadian national targetProxy target Not assessed
1 2 3 4 5 6 7 8 9 10 11 12 13 14 15 16 17Sustainable Development Goal
Figure 2. Seventy-eight of 169 SDG targets describe potentially assessable outcomes for Canada

8 GLOBAL ECONOMY AND DEVELOPMENT PROGRAM
details). As a guiding principle, we
aim to identify at least one indica-
tor with data for each assessable
target, although some targets re-
quire multiple indicators to assess
multiple imbedded outcomes. For
example, for SDG 3.4 on non-com-
municable disease (NCD) mortality,
we use distinct indicators to assess
cancer mortality, cardiovascular
diseases, and suicide, in addition
to a multi-NCD synthesis measure.
This approach allows us to conduct
a national assessment of 61 targets
using 73 indicators.
As mentioned in the introduction,
the SDGs have two conceptually
distinct types of targets: absolute
global standards (e.g., end extreme
poverty and hunger; reduce child
mortality to no more than 25 deaths
per 1,000 live births in every coun-
try) and relative national measures
(i.e., cut domestic poverty by half;
reduce non-communicable disease
mortality by one-third). In that re-
gard, of the 37 quantified targets, 29
set an absolute standard and 25 of
these have data for Canada.
Q4: Can datafrom another source be
assessed for Canada?
78 assessable targets
Q2: Does UNdatabase haveobservations for
Canada?
Use another source (41)
Use UNdata (20)
yes (57)
yes (40)
no (21)
no (17)
yes (20) no (20)
Define asmissing (17)
yes (41) no (17)
Q1: Does UN-SDG Global
Database have any data for target?
Q3: Can UNdatabase be assessed
for recent trend or indicator ceiling?
Figure 3. Logic tree for identifying data sources

WHO AND WHAT GETS LEFT BEHIND? 9
Assessing statusThe final step is to classify each indicator based on its
most recent trajectory. To do so, we extrapolate the
indicator’s recent trends, assuming progress maintains
a business-as-usual trajectory, out to the SDG dead-
line—usually 2030, although for some targets 2020 or
2025.8 Next, the trajectory value is compared with the
value required for Canada to meet the respective tar-
get or proxy target.9 Then, each indicator is assessed
as falling under one of four categories:
I. On track: meaning already achieved or on track for
target achievement.
II. Acceleration needed: meaning Canada is cur-
rently on course to cover more than 50 percent but
less than 100 percent of its starting distance to the
target.
III. Breakthrough needed: meaning Canada is on
course to cover between 0-50 percent of its starting
distance to the target.
IV. Moving backward: meaning the most recent avail-
able trend is negative.
For the subnational assessment, we apply a more
limited version of this methodology to provinces and
territories. We also present a number of indicators dis-
aggregated by gender, indigenous status, immigrant
status, and people with disabilities. Few indicators
are available for consistent analysis across all forms
of disaggregation. The online supplement presents a
“crosswalk” describing links between indicators used
at the national and disaggregated levels.
Caveats Our benchmarking approach has some inherent
tradeoffs. First, our logic aligns with the SDG ambition
to “leave no one behind,” so the approach draws atten-
tion to shortfalls, however small, in reaching universal
coverage targets, rather than celebrating proximity to
universal coverage. For example, if access to some
basic service is on course to climb from 99.4 percent
in 2015 to 99.5 percent by 2030, then it is deemed
a source of concern with a “breakthrough needed,”
rather than an achievement, since less than half the
remaining distance to the finish line of 100 percent
would be covered. If access to the same basic service
had declined from 99.6 to 99.5 percent coverage in re-
cent years, the target falls under the most problematic
category of “moving backwards,” instead of something
like “still close.”
Second, we extrapolate trajectories on a linear basis
for indicators not focused on mortality or economic
growth. As a result, recent fast-moving trends might
overlook forthcoming “last mile” challenges en route to
universal coverage and thereby overestimate current
trajectories for 2030. Third, targets anchored in relative
domestic benchmarks risk placing a negative light on
indicators making large gains in absolute terms but
modest gains in proportional terms. To illustrate figura-
tively, if one indicator starts the SDG period 100 kilo-
meters from its target and only covers 40 kilometers in
15 years, then this covers less than half the distance
required and would be categorized under “break-
through needed.” Meanwhile, another indicator that
starts the period 10 kilometers away from its target and
is on course to cover only 6 kilometers, for a 60 percent
gain, is categorized more positively as “needs acceler-
ation.” So all assessments should be interpreted with
such logical tradeoffs in mind.

10 GLOBAL ECONOMY AND DEVELOPMENT PROGRAM
III. RESULTS
This section first presents results at the national
level, then a cross-section of indicators reviewed
across provinces and territories. Select indicators are
then disaggregated by some key demographic group-
ings.
NationalTable 1 presents an assessment for each of the 61 tar-
gets we are able to evaluate, using 73 indicators. This
table can be read as an accompaniment to the goal-
by-goal discussion below. Numerical values for each
indicator are available in the Appendix. A summary
table of national results is then presented at the end of
the section, on page 19.
POVERTYThere is no single answer to
how Canada is doing on pov-
erty. The country has already achieved SDG target
1.1, to eliminate the worst forms of dollar-a-day-type
extreme global poverty, but there has likely been stag-
nation on target 1.2, to cut domestic poverty by half
by 2030. Canada does not have an official domestic
poverty measure, but instead uses a blend of mea-
sures to define low-income status through a mix of
perspectives.
Here we report on two measures that focus on rele-
vant absolute standards. One is the low-income cut-
off (LICO), which measures thresholds below which
families likely devote a disproportionately large share
of income on necessities of food, shelter, and cloth-
ing. The other is the market basket measure (MBM),
which reflects the cost of a specific basket of goods
and services for a basic standard of living. According
to Statistic Canada, this allows for more detailed geo-
graphic refinements than LICO, based on variations in
local price levels.
Looking at trends, the share of the national population
living below the LICO fell slightly from 10.8 percent in
2005 to 9.2 percent in 2015. Extrapolating a consistent
trajectory out to 2030 covers slightly more than half
the distance to a benchmark of 4.6 percent, implying
acceleration is required. The MBM showed a smaller
decline from 12.3 percent to 12.1 percent over the
same period (StatCan 2017e), suggesting the need for
a breakthrough in rates of progress on that measure.
More positively, Canada has already achieved the tar-
get to implement social protection systems for all, and
to achieve substantial coverage of vulnerable people.
According to the U.N. database, Canada covers 100
percent of its poor and 99 percent of its vulnerable
through social protection systems (U.N.-Stat 2017).
Meanwhile, Canada’s mortality rate from natural di-
sasters was zero from 2014 to 2016, suggesting it is
on track for a proxy target regarding resiliency of the
poor to climate-related extreme events (Centre for
Research on Epidemiology of Disasters 2017).
HUNGER & FOOD SYSTEMSCanada appears to be moving in the
wrong direction on measures of food
insecurity, obesity, and sustainable agriculture. Rather
than ending hunger, the country is moving backwards
on the share of the population with moderate and severe
food insecurity, which increased slightly from 7.1 percent
in 2008 to 7.8 percent in 2012 (StatCan 2012). (More re-
cent data are clearly required for a better assessment.)
Regarding the target of ending malnutrition, childhood
obesity is also increasing. The share of children ages 2 to
4 who exceed the overweight cutoffs established by the

WHO AND WHAT GETS LEFT BEHIND? 11
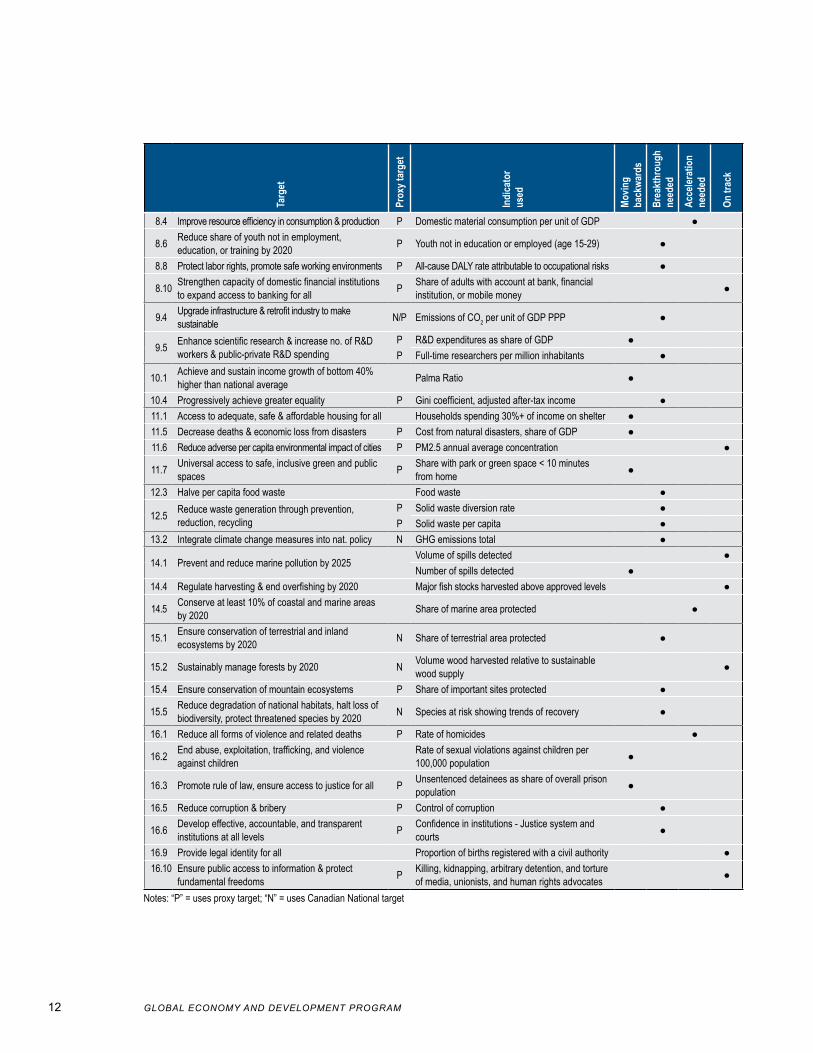
Table 1. Assessment of Canada’s status on domestic SDG targets
Targ
et
Prox
y tar
get
Indi
cato
r us
ed
Movin
g ba
ckwa
rds
Brea
kthr
ough
ne
eded
Acce
lerat
ion
need
ed
On tr
ack
1.1 End extreme poverty Share in extreme poverty ●
1.2 Reduce national poverty by 50%Share in low income - low income cut-offs ●Share in low income - market basket measure ●
1.3 Implement social protection for all Share of poor covered by social protection ●1.5 Build resiliency of poor to climate-events P Mortality rate from disasters ●2.1 End hunger/food insecurity Moderate + severe food insecurity ●2.2 End malnutrition Children overweight, aged 2-4 ●2.4 Ensure sustainable food production systems P Nutrient balance - nitrogen, kg/ha ●3.1 Maternal mortality < 70 per 100,000 births Maternal mortality ratio ●
3.2 Child and newborn mortality (< 25 & < 12 per 1,000 births) Neonatal mortality rate ●
3.3 End AIDS/TB/Malaria epidemics TB incidence rate ●
3.4 Reduce premature mortality from non-communicable diseases (NCDs) by 1/3
Mortality rate attributed to NCDs ●Cancer mortality rate ●Major cardiovascular disease mortality rate ●Suicide mortality rate ●
3.5 Strengthen prevention/treatment of substance abuse P Annual alcohol per capita consumption ●3.6 Halve traffic deaths by 2020 Mortality rate due to road injuries ●3.7 Universal access to sexual & reproductive services Women with family planning needs satisfied ●3.8 Universal health coverage (UHC) Population with coverage of 7 UHC tracer interventions ●3.9 Reduce deaths due to pollution & chemicals P Mortality rate from household/ambient air pollution ●4.1 Ensure all complete primary/secondary education Upper-secondary graduation rate ●4.2 Universal access to early childhood education Early childhood education net enrollment ●
4.5 Eliminate gender disparities in educationGender differences in mean reading PISA scores ●Gender differences in mean math PISA scores ●
4.6 Achieve literacy and numeracyLiteracy: 2+ on PISA in 15-year olds ●Numeracy: 2+ on PISA in 15-year olds ●
5.1 End discrimination against all women and girls Gender wage gap in full-time employees ●
5.2 Eliminate violence against women and girlsWomen experiencing intimate partner violence ●Female victims of police-reported violent crime ●
5.3 Eliminate harmful practices such as child, early and forced marriage and female genital mutilation Share of 15-17 year old females who are married ●
5.4 Recognize and value unpaid care and domestic work P Gender disparity in hours of unpaid work ●5.5 Ensure women’s full participation in leadership P Share of seats held by women in national parliament ●6.1 Universal access to safe drinking water Access to improved water ●6.2 Access to adequate and equitable sanitation for all Access to sanitation facilities ●
6.3 Improve water quality and halve untreated wastewaterWastewater treated ●
P Freshwater sites rated good or excellent ●6.4 Increase water-use efficiency P Annual freshwater withdrawals ●7.1 Universal access to modern energy services Access to electricity ●
7.2 Increase share of renewable energyP Renewable electricity consumption ●
N Electricity generated from renewable & non-emitting sources ●
7.3 Double global rate of improvement in energy efficiency Energy intensity level of primary energy ●
continued
12 GLOBAL ECONOMY AND DEVELOPMENT PROGRAM
Targ
et
Prox
y tar
get
Indi
cato
r us
ed
Movin
g ba
ckwa
rds
Brea
kthr
ough
ne
eded
Acce
lerat
ion
need
ed
On tr
ack
8.4 Improve resource efficiency in consumption & production P Domestic material consumption per unit of GDP ●
8.6 Reduce share of youth not in employment, education, or training by 2020 P Youth not in education or employed (age 15-29) ●
8.8 Protect labor rights, promote safe working environments P All-cause DALY rate attributable to occupational risks ●
8.10 Strengthen capacity of domestic financial institutions to expand access to banking for all P Share of adults with account at bank, financial
institution, or mobile money ●
9.4 Upgrade infrastructure & retrofit industry to make sustainable N/P Emissions of CO2 per unit of GDP PPP ●
9.5 Enhance scientific research & increase no. of R&D workers & public-private R&D spending
P R&D expenditures as share of GDP ●P Full-time researchers per million inhabitants ●
10.1 Achieve and sustain income growth of bottom 40% higher than national average Palma Ratio ●
10.4 Progressively achieve greater equality P Gini coefficient, adjusted after-tax income ●11.1 Access to adequate, safe & affordable housing for all Households spending 30%+ of income on shelter ●11.5 Decrease deaths & economic loss from disasters P Cost from natural disasters, share of GDP ●11.6 Reduce adverse per capita environmental impact of cities P PM2.5 annual average concentration ●
11.7 Universal access to safe, inclusive green and public spaces P Share with park or green space < 10 minutes
from home ●
12.3 Halve per capita food waste Food waste ●
12.5 Reduce waste generation through prevention, reduction, recycling
P Solid waste diversion rate ●P Solid waste per capita ●
13.2 Integrate climate change measures into nat. policy N GHG emissions total ●
14.1 Prevent and reduce marine pollution by 2025Volume of spills detected ●Number of spills detected ●
14.4 Regulate harvesting & end overfishing by 2020 Major fish stocks harvested above approved levels ●
14.5 Conserve at least 10% of coastal and marine areas by 2020 Share of marine area protected ●
15.1 Ensure conservation of terrestrial and inland ecosystems by 2020 N Share of terrestrial area protected ●
15.2 Sustainably manage forests by 2020 N Volume wood harvested relative to sustainable wood supply ●
15.4 Ensure conservation of mountain ecosystems P Share of important sites protected ●
15.5 Reduce degradation of national habitats, halt loss of biodiversity, protect threatened species by 2020 N Species at risk showing trends of recovery ●
16.1 Reduce all forms of violence and related deaths P Rate of homicides ●
16.2 End abuse, exploitation, trafficking, and violence against children
Rate of sexual violations against children per 100,000 population ●
16.3 Promote rule of law, ensure access to justice for all P Unsentenced detainees as share of overall prison population ●
16.5 Reduce corruption & bribery P Control of corruption ●
16.6 Develop effective, accountable, and transparent institutions at all levels P Confidence in institutions - Justice system and
courts ●
16.9 Provide legal identity for all Proportion of births registered with a civil authority ●16.10 Ensure public access to information & protect
fundamental freedoms P Killing, kidnapping, arbitrary detention, and torture of media, unionists, and human rights advocates ●
Notes: “P” = uses proxy target; “N” = uses Canadian National target

WHO AND WHAT GETS LEFT BEHIND? 13
International Obesity Task Force increased from 38 to 42
percent between 2000 and 2015 (Lim et al. 2016).
It is difficult to identify a single Canadian measure per-
taining to the target for sustainable food production
systems. As a proxy measure, Canada’s soil nutrient
balance has a surplus of nitrogen, indicating a potential
pollution risk. Levels of nitrogen balance increased from
23.6 kilograms per hectare in 2004 to 29.8 in 2014 (OECD
2017e), moving away from the ideal value of zero.
GOOD HEALTH AND WELL-BEINGCanada has achieved long-term suc-
cess relative to global health stan-
dards, but accelerated progress is still required for the
country to meet all the relevant SDG targets. The country
surpassed the child mortality SDG standard of 25 deaths
per 1,000 live births way back in 1967 and was far ahead
of the maternal mortality target of 70 deaths per 100,000
live births as of 1990—the first year for which the World
Bank (2017) reports data.10 Less positively, Canada has
shown slow recent progress toward the infectious dis-
eases target to end the AIDS and tuberculosis (TB) (and
malaria) epidemics, as evidenced by a limited decline in
TB incidence rates, from 5.7 cases per 100,000 people in
2004, down to 5.2 cases in 2014.
Looking at non-communicable disease (NCD) mortality
rates, Canada has seen an overall decline in recent
years, from 297 deaths per 100,000 in 2000 to 224 per
100,000 in 2015, but needs accelerated progress to
meet the target of achieving a one-third reduction by
2030. Trajectories across individual NCDs are mixed.
The cardiovascular disease mortality rate, for exam-
ple, is on track for a one-third reduction by 2030, while
cancer mortality is declining but needs acceleration
to achieve the same amount of progress (StatCan
2017b). Likewise, suicide mortality rates will require
further acceleration to drop by one-third by 2030
(U.N.-Stat 2017). On a related front, opioids present a
growing challenge. As a proxy measure for substance
abuse and mental health, alcohol consumption per
capita increased slightly from 2005 to 2015, and is
hence moving in the wrong direction (Ibid.).
For the target on universal health coverage, we report
the share of people who receive seven key tracer inter-
ventions (Lim et al. 2016). Under a business-as-usual
trajectory, Canada improves on this indicator from 91.5
percent coverage in 2015 to 98.4 percent coverage in
2030, implying that only slightly faster progress is re-
quired in order to achieve complete coverage. Similarly,
access to family planning will also fall just short of univer-
sal coverage by 2030 if current trends continue (Ibid.).
The health target with the earliest deadline is to halve
motor vehicle deaths by 2020. Canada is currently only
on track to achieve a 25 percent reduction compared to
2013, and hence needs acceleration (U.N.-Stat 2017).
Regarding the target to reduce deaths due to pollution
and chemicals, progress is ongoing but acceleration is
still needed in order to achieve a proxy benchmark of
cutting 2015 mortality rates by half by 2030.
QUALITY EDUCATIONCanada is performing well on educa-
tional access and average learning
outcomes but faces important challenges on providing
essential skills to a significant segment of the popula-
tion. The country reported an 89 percent upper sec-
ondary graduation rate as of 2013 (OECD 2017b) and
will reach the 2030 target of 100 percent if recent rates
of progress continue. Compared to other advanced
economies, Canada ranks consistently near the top on
average test scores. The country is on track for girls to
achieve gender parity in average math scores on the

14 GLOBAL ECONOMY AND DEVELOPMENT PROGRAM
test administered by the Programme for International
Student Assessment (PISA), although boys trail by a no-
table margin on average reading scores (OECD 2017c).
Amid the successes, a considerable share of Canadian
students are being left behind on proficiency in basic
skills. The SDG target on literacy and numeracy aims
for all youth to achieve at least functional proficiency.
The proportion of students lacking adequate reading
proficiency, informed by the share of 15-year olds who
score at level 2 or above on PISA, has remained stuck
at around 11 percent since 2009. For basic numeracy,
the same number has increased from 11 percent in 2006
to 14 percent in 2015 (OECD 2016b). In other words, at
least 1 in 10 young people appears to lack basic literacy
and numeracy. If these ratios are scaled to the entire
population, they would imply that around 3.8 million to
5.2 million Canadians face fundamental skill gaps for the
modern economy and society.
GENDER EQUALITYSeveral gender equality metrics are
improving in Canada but much faster
progress is needed. Starting with the target to elimi-
nate violence against women, dramatic improvement is
clearly required. Police reported violent crime against
women increased between 2008 and 2011, the only
recent years we were able to identify with crime statis-
tics by gender (Vaillancourt 2010, Canadian Centre for
Justice Statistics 2013). Gains have also been slow on
reducing the share of women who report having ever
experienced intimate partner violence, barely down from
an estimated 16.9 percent in 2000 to an estimated 16.4
percent in 2015 (Lim et al. 2016).
Among economic indicators, the gender wage gap in
full-time employment shows another need for a break-
through in order to achieve the target of ending discrimi-
nation against women and girls. The gap has fallen only
gradually from 21.3 percent in 2005 to 18.6 percent in
2015, far off track from reaching parity by 2030 (OECD
2017a).11 Progress is also stuck on the target to rec-
ognize and value unpaid care and domestic work, for
which we use a proxy target of achieving gender parity
in hours spent. Between 2005 and 2010, females in-
creased the number of estimated hours spent on unpaid
care and domestic work from 15.8 to 16.2 hours per
week, while males increased from 10.0 to 10.4 hours
per week, resulting in no change in gender disparity
(U.N.-Stat 2017).
Looking at other measures of gender inequality, Canada
lags in ensuring women’s full participation in political
leadership. In late 2015, a new federal government ap-
pointed half of its Cabinet members as women, but the
share of seats in parliament held by women only grew
from 21 percent in 2006 to 26 percent in 2016 (U.N.-Stat
2017). A breakthrough is required to reach parity in pub-
lic office. A breakthrough is also required to achieve the
target of ending child marriage. In 2015, 0.04 percent of
girls aged 15-17 were married, equivalent to around 1 in
2800 (StatCan 2016b). In absolute terms, this is equiv-
alent to more than 200 girls—arguably a small number,
but not yet on track for zero by 2030. Section III includes
a more detailed gender-disaggregation of indicators
across goals.
CLEAN WATER AND SANITATIONRemarkably, Canada still struggles to
achieve universal coverage for drinking
water and sanitation, one of the absolute global stan-
dards embedded in the SDGs. The share of the popu-
lation with access declined from 99.4 percent in 2000
to 98.4 percent in 2015 (WHO and UNICEF 2017). On
sanitation, access has remained stuck around 99.8
percent for more than a decade (U.N.-Stat 2017).

WHO AND WHAT GETS LEFT BEHIND? 15
These figures translate to over 570,000 people without
proper access to water and 70,000 without access to
sanitation.
Canada’s freshwater resources also appear to need
better management. The country is moving in the
wrong direction on target 6.3 to halve untreated waste-
water, as the treated share declined from 87 percent
in 2004 to 84 percent in 2009 (OECD 2017g). (More
recent data, once again, would clearly enable better
analysis.) For the aspect of the same target to im-
prove water quality, only 40 percent of freshwater sites
were rated as being of good or excellent quality in
2011, up only from 34 percent in 2004 (ECCC 2015a).
Accelerated progress is required to achieve the proxy
target of 70 percent by 2030. Assessing the target on
substantially increasing water-use efficiency, Canada’s
annual freshwater withdrawals remain low as a share
of total water resources, which is positive, but addi-
tional progress toward greater efficiency has been
slow (WDI 2017).12
AFFORDABLE AND CLEAN ENERGYCanada reports universal access to
electricity, thus meeting the target for
modern energy services, but it still needs major accel-
eration in terms of efficiency and the share of energy
generated by renewables. The target to double the rate
of improvement in energy efficiency requires accelera-
tion by definition. Applying that standard to the level of
primary energy intensity in the economy implies dou-
bling the annual rate of improvement from 0.18 to 0.36
megajoules per unit of gross domestic product per year
(U.N.-Stat 2017).
For the proxy target to cut the share of non-renewable
energy by half, we consider measures of both energy
generation and consumption. The share of electricity
generated from renewable and non-emitting sources
(including nuclear) was 75 percent in 2005 and 80
percent in 2014, suggesting only some acceleration
is required in order to meet the Federal Sustainable
Development Strategy target of 90 percent generated
by 2030 (ECCC 2016a, US EIA 2017). For total final
electricity consumption, the share of renewables hov-
ered around 21 percent from 2005 to 2012 and thereby
requires a breakthrough (U.N.-Stat 2017).
DECENT WORK AND ECONOMIC GROWTHProgress on decent work and economic
growth has been mixed, if generally moving in a positive
direction. The four assessable targets with data speak to
a wide diversity of issues that we evaluate through proxy
benchmarks. In a positive light, nearly all Canadian
adults, 99.6 percent, report having a bank account (U.N.-
Stat 2017). Meanwhile, accelerated progress is needed
on general resource efficiency, measured against the
proxy target to halve domestic material consumption per
unit of GDP. This indicator declined from 0.70 kg per unit
of GDP in 2005 to 0.62 kg in 2010 (Ibid.).
Among labor-related measures, a persistent challenge
is reflected in the SDG target related to the share of
youth aged 15 to 29 who are unemployed and not in
education. This indicator remained stuck at around
13 percent between 2005 and 2015 (OECD 2017h),
implying a breakthrough is needed to achieve a proxy
target of cutting the share by half. On workplace safety,
the all-cause disability-adjusted life-year (DALY) rate
attributable to occupational risks fell only slightly from
499 per 100,000 in 2000 to 473 per 100,000 in 2015.
This indicator also requires a breakthrough to achieve
the proxy benchmark of a 50 percent reduction by
2030 (Lim et al. 2016).

16 GLOBAL ECONOMY AND DEVELOPMENT PROGRAM
INDUSTRY, INNOVATION, AND INFRASTRUCTUREThe official SDG 9 targets are not ideal
for assessing performance in an ad-
vanced economy. However, among the two assessable
targets, the evidence suggests dramatic improvement
is needed. Target 9.4 aims to “upgrade infrastructure
and retrofit industries to make them sustainable, with
increased resource-use efficiency and greater adoption
of clean and environmentally sound technologies and
industrial processes.” As a proxy benchmark, we calcu-
late trajectories for emissions of CO2 per unit of GDP and
compare this to what is required to meet Canada’s 2030
emissions targets. In 2014, Canada released 0.37 kg of
CO2 equivalent per unit of GDP, down only from 0.42 kg in
2005 (U.N.-Stat 2017). This points to the need for a break-
through if Canada is to reach its implied target of 0.19 kg
per unit of GDP by 2030.
Two indicators suggest progress is mixed on the target
for “substantially increasing” the number of research
and development (R&D) workers and expenditures,
which we assess through a proxy target of 50 percent
increase by 2030. The number of full-time research-
ers per million inhabitants grew from 3,900 in 2003 to
4,519 in 2013, but a breakthrough is still required to
achieve a target of 6,779 by 2030. Meanwhile, R&D
expenditure as a share of GDP fell from 2.0 percent in
2004 to 1.6 percent in 2014 (U.N.-Stat 2017).13 It is not
clear that Canada yet has the science and innovation
structures in place to guide its long-term sustainable
development success.
REDUCED INEQUALITIESAs a general rule, indicators and de-
sired outcomes for inequality are all
subject to debate, and hence challenging to assess
against common standards. Nonetheless, Canada’s
inequality indicators have not changed much over the
past decade. We interpret target 10.4, to “progressively
achieve greater equality,” as requiring a 0.001 annual
decline in the adjusted after-tax Gini coefficient, add-
ing up to a 0.015 decline by 2030. Between 2005 and
2015, this Gini coefficient declined from 0.317 to 0.314,
so it requires a breakthrough to meet the proxy target
(StatCan 2017d).
For target 10.1, sustaining income growth of the bottom
40 percent at a rate higher than the national average,
we consider two measures. There is some evidence
that incomes for the bottom 40 percent grew at a faster
annual rate than for the total population from 2004 to
2010 (2.14 percent versus 1.93 percent), but more
recent trend data are not available, so we do not cate-
gorize this indicator’s trajectory. Meanwhile the Palma
Ratio, defined as the richest 10 percent of the popu-
lation’s share of national income divided by the share
held by the poorest 40 percent, increased slightly from
1.19 in 2006 to 1.21 in 2013 and is therefore moving in
the wrong direction (OECD 2017f).
SUSTAINABLE CITIES AND COMMUNITIESThe country-level SDG 11 targets
are not extremely helpful for assessing the specific
challenges in Canada’s cities. A more relevant munici-
pal-level assessment is presented in Section III below.
Nonetheless, targets under this goal do provide some
important insights into the nature of Canada’s urban
challenge. Target 11.1 calls for safe and affordable
housing for all. In 2006 and 2011, more than a quarter
of households spent 30 percent or more of their income
on shelter expenses, a benchmark for high cost of living
(StatCan 2013a), with the estimated percentage even
increasing slightly.14 On the risk management front,
Target 11.5 aims to reduce the economic loss from

WHO AND WHAT GETS LEFT BEHIND? 17
disasters. Canada’s estimated total cost from natural
disasters as a share of GDP, much of which is concen-
trated in cities, increased from a three-year average
of 0.02 percent over 2003-2005 to 0.10 percent over
2013-2015 (Public Safety Canada 2017).15
Canada’s cities enjoy reasonably good environmen-
tal health conditions. The 2014 average annual air
concentration of “particulate matter 2.5”—the concen-
tration of tiny air particles capable of causing severe
health damage—was 7.7 micrograms per cubic meter.
This represented a slight increase compared to 2004-
2006 averages but is still below Canada’s ambient
quality threshold of 10 micrograms and puts Canada
on track for target 11.6 to “reduce the adverse per cap-
ita environmental impact of cities, including by paying
special attention to air quality” (ECCC 2016b). But on
target 11.7 to provide universal access to safe, inclu-
sive green and public spaces, the share of Canadians
who had a park or green space less than 10 minutes
from home declined slightly from 86 percent in 2011 to
85 percent in 2013 (StatCan 2017c), highlighting the
need for a change in direction.
RESPONSIBLE CONSUMPTION AND PRODUCTIONCanada would benefit from better
data for tracking progress on Goal 12. Target 12.3
commits to halving per capita food waste at the retail
and consumer level while reducing food losses along
the production and supply chains.16 According to one
estimate, 40 percent of food produced in Canada is
wasted (Gooch et al. 2010), but we were not able to
identify official time series data. In the absence of infor-
mation suggesting that a major reduction is underway
toward only 20 percent food waste by 2030, we err on
the side of drawing attention to the issue by highlight-
ing the target as needing a breakthrough.
For the target to “substantially reduce waste gener-
ation,” we implement a proxy benchmark of halving
the problem by 2030. Solid waste per capita declined
only 10 percent between 2004 and 2014, from 790 to
706 kilograms, suggesting a breakthrough is required
(StatCan 2016e). Another relevant indicator is “solid
waste diversion rates,” including recycling. This mea-
sure improved only slightly from around 22 percent in
2002 to 25 percent in 2012 (ECCC 2016d), far off track
from a proxy target of 63 percent by 2030.
CLIMATE ACTIONWe only assess one indicator for
Goal 13, which shows that Canada
requires a breakthrough rate of progress to reach its
greenhouse gas (GHG) emissions target by 2030.
Canada has a national commitment to reduce total
emissions by 30 percent, from 738 megatons (Mt) in
2005 to 523 Mt in 2030. However, emissions declined
just 2 percent overall from 2005 to 2015 (ECCC 2017b),
not nearly fast enough to achieve the target. Even after
accounting for the prospective implementation of na-
tional carbon price floors, Bataille and Sawyer (2016)
found that, as of November 2016, GHG emissions are
on course to decline only to around 676 Mt by 2030.
Note that we do not assess the SDG climate adaptation
targets here, due to their lack of measurability within
countries.
LIFE BELOW WATERCanada has achieved mixed suc-
cess so far in managing its ocean
and marine resources. On target 14.5 to conserve at
least 10 percent of coastal and marine areas by 2020,
Canada registered 3.4 percent of marine areas pro-
tected as of August 2017 (Parks Canada 2017, ECCC
2016c). This is a large jump from only 0.9 percent

18 GLOBAL ECONOMY AND DEVELOPMENT PROGRAM
protected in 2015, and the government has explic-
itly committed to reach 10 percent by 2020 (ECCC
2016a). However, accelerated progress is still required
to achieve the benchmark (ECCC 2016c). For the tar-
get to regulate harvesting and achieve zero overfishing
by 2020, the share of major fish stocks reported to be
harvested above approved levels declined from 10.3
percent in 2011 to 4.4 percent in 2015 (ECCC 2017c),
which is on track for reaching the goal.
Target 14.1 aims to “prevent and significantly reduce
marine pollution of all kinds” by 2025. We interpret “pre-
vent all kinds” to mean eliminating marine pollution and
use the volume and number of oil spills as an indicator
available for Canada. Government data suggest a high
degree of year-to-year variability on these measures,
but the volume of detected ocean spills was nearly
50 percent lower in 2013-2014 than in 2009-2010, at
4,453 liters compared to 8,110 liters (ECCC 2015b). If
that declining trajectory continues unchanged, it leads
to zero spills by 2025. However, the number of de-
tected spills per year was nearly twice as high in 2013-
2014 compared to 2009-2010, suggesting backward
movement. It is not clear if reported changes are due
to improved detection or to the occurrence of smaller
and more frequent spills.
LIFE ON LANDCanada has made progress on sus-
tainable forestry but needs break-
throughs on protecting land area and ecosystems. For
target 15.2 to sustainably manage forests, Canada has
already achieved its national goal to ensure the ratio
of wood harvested relative to sustainable wood supply
is less than one by 2020 (Natural Resources Canada,
2016). This compares to target 15.1 for conserving ter-
restrial ecosystems, where the government has com-
mitted to achieve 17 percent protected area by 2020,
but still needs a breakthrough rate of progress to do
so, since protected land area only expanded from 8.4
percent in 2005 to 10.6 percent in 2015 (ECCC 2016c).
For the SDG target to halt the loss of biodiversity and,
by 2020, prevent the extinction of threatened species,
Canada has a similar national target to protect species
at risk. As of 2016, only 35 percent of Canada’s spe-
cies classified as at risk showed trends of recovering
(ECCC 2017d). Further, a larger share of species at
risk are experiencing worsening trends compared to
the share experiencing improving trends, suggesting
a breakthrough is required to achieve 100 percent by
2020 (ECCC 2017a). For the narrower SDG target of
conserving mountain ecosystems by 2030, we set a
proxy benchmark of achieving 100 percent “coverage
by protected areas of important sites for mountain
biodiversity.” Canada’s value on this indicator has re-
mained stagnant at 12 percent since 2000, implying
the need for a breakthrough (U.N.-Stat 2017).
PEACE, JUSTICE, AND STRONG INSTITUTIONSCanada is often considered a global
model of strong public institutions, but Goal 16 draws
attention to the need for accelerated progress in a num-
ber of key areas. On the positive side, the country has
already achieved target 16.9 to provide legal identity
for all. It has also achieved success on target 16.10, to
“ensure public access to information and protect funda-
mental freedoms,” as measured by a zero score on the
official U.N. indicator tracking cases of killing, kidnap-
ping, arbitrarily detaining and torturing journalists, media
personnel, trade unionists, and human rights advocates.
Canada has also made progress in reducing its homicide
rate by 20 percent between 2005 and 2015, although ac-
celeration is needed to achieve a proxy target of cutting
the rate by another 50 percent by 2030 (U.N.-Stat 2017).

WHO AND WHAT GETS LEFT BEHIND? 19
At the same time, Canada lags on other key elements
of Goal 16. For target 16.2 to end abuse and violence
against children, the country has been moving backward,
with police-reported sexual violations against children and
youth increasing from 10.8 cases per 100,000 population
in 2010 to 12.6 per 100,000 in 2015. This could be due to
either an increase in incidence or an increase in reporting.
On target 16.3 to ensure equal access to justice for all, the
number of unsentenced detainees as a share of the over-
all prison population increased from 29 percent in 2005 to
35 percent in 2014, moving in the wrong direction from the
proxy benchmark to cut in half by 2030.
For target 16.5, to reduce corruption and bribery
substantially, we adopt a proxy target of cutting mea-
sured corruption by half. According to the Worldwide
Governance Indicators project, Canada’s scores on
control of corruption were materially unchanged over
the period 2005 to 2015 (Kaufmann and Kraay 2016).
Perhaps most worryingly for Canadian policymakers,
the indicator for target 16.6— “effective, accountable
and transparent institutions at all levels”—draws atten-
tion to fragility in citizen support. Statistics Canada re-
ported that, in 2013, only an estimated 57 percent of the
population had “some” or a “great deal of” confidence
in the justice system and courts (Cotter 2015). We were
not able to identify a time series for this exact indicator,
but a comparable 2003 national survey reported 57
percent had a “great deal” or “quite a lot” of confidence
in the justice system (Roberts 2004). We therefore clas-
sify this indicator as requiring a breakthrough.
NATIONAL SUMMARYTable 2 provides a goal-by-goal synthesis of the above
assessment. Each dot represents one of the 73 indi-
Table 2. Summary of Canada’s status on domestic SDG indicators
Sustainable Development GoalMoving
backwardsBreakthrough
neededAcceleration
needed On track1 Poverty ● ● ● ● ●2 Hunger & food systems ● ● ●3 Good health & well-being ● ● ● ● ● ● ● ● ● ● ● ●4 Quality Education ● ● ● ● ● ●5 Gender equality ● ● ● ● ● ●6 Clean water & sanitation ● ● ● ● ●7 Affordable & clean energy ● ● ● ●8 Decent work & economic growth ● ● ● ●9 Industry, innovation & infrastructure ● ● ●
10 Reduced inequalities ● ●11 Sustainable cities & communities ● ● ● ●12 Responsible consumption & production ● ● ●13 Climate action ●14 Life below water ● ● ● ●15 Life on land ● ● ● ●16 Peace, justice & strong institutions ● ● ● ● ● ● ●
18 26 12 17

20 GLOBAL ECONOMY AND DEVELOPMENT PROGRAM
cators examined. In total, Canada is on track for 17
indicators; requires acceleration on 12; needs a clear
breakthrough on progress on 26; and requires a rever-
sal of negative trends on 18.17 These results suggest
that while Canada has achieved success on many
fronts, better rates of progress are still required on
many issues.
Provinces and TerritoriesNational-level assessments can mask substantial
sub-national variation. To that end, Tables 3 and
4 present a variety of key indicators for Canada’s
10 provinces and three territories. For each indica-
tor, most recent available values are shown as of
mid-2017.18 Where possible, a trend assessment is
presented below the indicator, reflecting “on” or “off”
track status for 2030. For inequality, a “+” or “-“ symbol
simply notes whether the 2004-2014 trend was improv-
ing or worsening. Coefficients of variation (similar to
confidence intervals) are reflected in superscripts where
available.
For each indicator in Tables 3 and 4, the province with
the best recent level is highlighted in a shaded box and
the province with the most problematic level is high-
lighted in a white box. This draws attention to the fact
that different provinces tend to lead and lag on each
goal. On many indicators, the territories face larger chal-
lenges than the provinces, so instances are also high-
lighted when the most problematic territorial indicator
rates worse than the lagging provincial indicator, as is
commonly the case for Nunavut, or when the best terri-
torial indicator rates better than the top province—such
as Yukon on GHG emissions. The three territories are
unique in that each has a population of less than 50,000
people and a large population share identifying as indig-
enous—23 percent in Yukon, 52 percent in Northwest
Territories, and 86 percent in Nunavut, as of 2011.
Looking at indicators relevant to Goal 1, the LICO
measure suggests that Alberta, Newfoundland and
Labrador, and Saskatchewan are all on track to halve
poverty by 2030. Alternatively, using the market bas-
ket measure, no provinces are on track. Interestingly,
Alberta also had the highest Gini inequality coefficient
in 2014, at 0.319, while Prince Edward Island regis-
tered the lowest value at 0.275. Six provinces were
already below the national proxy target Gini value of
0.299 described earlier.
On food insecurity, all provinces and territories were
off-track, as of 2012, from eliminating the problem by
2030. Noting that we only extrapolate from the 2008
to 2012 trend, most provinces and territories appear
stuck or moving in the wrong direction. What differs is
the level of food insecurity. Among the provinces, Nova
Scotia had 1.4 times the national food insecurity rate,
at 10.8 percent of the population. Nunavut meanwhile
had an extraordinary 40 percent of its population suf-
fering from food insecurity in 2012.
For basic learning outcomes linked to Goal 4, there
is modest inter-provincial variation. On the 2012
Programme for the International Assessment of Adult
Competencies (PIAAC) tests for literacy and numer-
acy, respectively, a score of 2 or more suggests a basic
level of proficiency. 19 Prince Edward Island rates high-
est on literacy and Quebec rates highest on numeracy.
Newfoundland and Labrador rate lowest on the same
two metrics, with numeracy a particular challenge.
Both the Northwest Territories and Nunavut face even
bigger learning challenges. In Nunavut, less than half
of adults are deemed to have basic proficiency in liter-
acy and numeracy, according to PIAAC.
On Goal 13 for climate change, if we presume each
province and territory needs to make a similar 30 per-
cent reduction in its per capita GHGs by 2030, com-

W
HO
AN
D W
HA
T G
ET
S LE
FT
BE
HIN
D?
21
Table 3. Provinces and territories - status assessment on select SDG targets Go
al
SDG
2030
targ
et
Natio
nal
Albe
rta
Briti
sh C
olum
bia
Mani
toba
New
Brun
swick
Newf
ound
land
& La
brad
or
Nova
Sco
tia
Onta
rio
Prin
ce E
dwar
d Isl
and
Queb
ec
Sask
atch
ewan
North
west
Te
rrito
ries
Nuna
vut
Yuko
n
1
Low-income, 2015 Cut by 1/2
9.2%‡ 6.1%‡ ‡ 11.7%‡ 10.0%‡ 7.4%‡ ‡ 6.0%‡ ‡ 7.3%‡ ‡ 9.3%‡ 6.3%‡‡ ‡ 10.1%‡ 5.8%‡ ‡
Low income cut-offs after tax, % of population off on off off off on off off off off onLow-income, 2015 Cut by
1/212.1%‡ 8.2%‡ ‡ 14.8%‡ 12.0%‡ 13.7%‡ 12.1%‡ 13.8%‡ 12.9%‡ 14.0%‡ ‡ 10.9%‡ 10.7%‡ ‡
Market basket measure, % of population off off off off off off off off off off off
2 Food insecurity, 2012Moderate + severe, % of population aged 12+
0% 7.8%‡ 7.9%‡ 7.6%‡ 7.3%‡ ‡ 8.9%‡ 6.9%‡ ‡ 10.8%‡ 7.7%‡ 10.1%‡ ‡ 7.5%‡ 7.4%‡ ‡ 14.2%‡ ‡ 40.0%1,‡ 9.8%‡ ‡
off off off off off off off off off off off off off off
4
Literacy, 20122
Age 16-65, % scoring 2+ on PIAAC100% 84% 85% 83% 84% 82% 79% 84% 85% 86% 81% 83% 69% 44% 84%
Numeracy, 20122
Age 16-65, % scoring 2+ on PIAAC100% 77% 78% 78% 78% 72% 68% 75% 78% 78% 79% 76% 59% 33% 75%
5 Female victims of violence, 2011 Police-reported violent crime, per 100,000 people aged 15+
0 1,207 1,459 1,301 2,191 1,376 1,330 1,262 928 1,096 1,036 2,681 11,193 15,453 4,609off off off off off off off off off off off off off off
10 Gini coefficient, 2014Adjusted after-tax income
0.311 0.319 0.308 0.297 0.277 0.293 0.291 0.316 0.275 0.281 0.307(+) (-) (+) (+) (+) (+) (+) (+) (-) (+) (+)
13 Greenhouse gas emissions per capita, 20153
Tonnes12.74 20.5 64.5 12.8 15.8 18.6 19.4 17.1 11.9 12.1 9.6 65.2 31.5 16.2 8.0
off off off off on off on on on off off on off on
15 Terrestrial area protected, 2015Share of total land area
17%5 11% 13% 15% 11% 5% 7% 10% 11% 3% 10% 9% 9% 10% 12%off off off off off off off off off off off off off off
16 Public confidence in justice system & courts, 2013 % of population aged 15+
57% 56% 51% 51% 62% 56% 57% 64% 58% 51% 58%
Population (thousands), 2016 36,286 4,253 4,752 1,318 757 530 950 13,983 149 8,326 1,151 45 37 38
Where listed by StatCan: ‡ coefficient of variation (CV) < 8%; ‡ ‡ CV between 8% and 16%; ‡‡ ‡ CV between 16% and 33.3%
Notes: 1 Ten largest communities in Nunavut. 2 See online supplement for standard errors. 3 On and off track calculation based on total GHG emissions. 4 Canada’s nationally determined contribution. 5 Federal Sustainable Development Strategy target
Source by goal: 1a, b = CANSIM 206-0041; 2 = CANSIM 105-0547; 4a, b = StatCan (2013b); 5 = CCJS (2013), Vaillancourt (2010); 10 = CANSIM 206-0033; 13 = ECCC (2017b); 15 = ECCC (2016c); 16 = Cotter (2015); population = CANSIM 051-0001
best recent value, provincesmost problematic recent value, provinces
best recent value, territory outperforms provincemost problematic, territory lags province
“on” = on track for SDG, “off” = off track for SDG (where data permits)(+) = recent trend is improving, (-) = recent trend is moving in the wrong direction
Legend

22 GLOBAL ECONOMY AND DEVELOPMENT PROGRAM
pared to 2005 levels, then six provinces and territories
are on-track to do so, even if Canada as a whole is
not.20 Importantly, the two provinces with the highest
level of per capita emissions in 2015, Saskatchewan
and Alberta, also had increasing emissions—in both
absolute and per capita terms.
On Goal 15 for land-based ecosystems, no provinces
are currently on track to reach the national bench-
mark of 17 percent of terrestrial area protected by
2020. British Columbia had the highest share of land
protected in 2015, at 15.3 percent, and on current tra-
jectory gets closest to the target. At the other end of
the spectrum, New Brunswick, Prince Edward Island,
Saskatchewan, and Newfoundland and Labrador all
had less than 10 percent of area protected. For its
part, Quebec increased its protected area at more than
twice the average national rate from 2005 to 2015.
Nunavut saw a slight decline over the same period.
Linked to SDG 16, public confidence in the justice
system and courts shows modest variation between
provinces. Ontario has the highest level of estimated
public support, with 64 percent expressing a great deal
or some confidence in the justice system. In British
Columbia, Manitoba and Quebec, only 51 percent con-
veyed similar confidence. On a relevant measure of
female victims of violence, Ontario also has the lowest
value reported while Saskatchewan has the highest
among the provinces. The situation is notably worse in
the three territories, where rates of reported violence
against women are starkly higher.
A variety of SDG-relevant health indicators have data
available for provinces and territories, as shown in
Table 4. Notably, all provinces and territories are on
track to reduce their major cardiovascular disease
mortality rate by one-third by 2030, even though there
is considerable variation in starting points. Conversely,
only the Northwest Territories is on track to achieve
one-third reduction in cancer mortality.
The reduction in the TB incidence rate at the national
level masks complex regional trends. On current tra-
jectory, New Brunswick and Nova Scotia will both elim-
inate TB incidence by 2030,21 but four provinces saw
their incidence rates increase between 2005 and 2015:
Alberta, Manitoba, Newfoundland and Labrador, and
Prince Edward Island. All three territories saw a reduc-
tion between 2005 and 2015, but their incidence rates
are still considerably higher than the national average.
The mortality rate from motor vehicle accidents is
declining in all provinces except for Prince Edward
Island, although none are on track to achieve the SDG
target of cutting mortality by half by 2020. Ontario has
the lowest mortality rates and Saskatchewan has the
highest.
On measures of health access, we do not have sub-na-
tional data on access to key tracer interventions, as
reported nationally in Table 2, but we are able to assess
two measures of access to key health services. One is
the share of the population reporting having a regular
medical doctor. No province or territory is on track to
achieve 100 percent coverage by 2030, and regional
variations as of 2014 are stark. New Brunswick reports
the highest value on this indicator, at 93 percent, while
Nunavut reports only 17 percent. Interestingly, Quebec
has the lowest doctor indicator value among provinces,
at 75 percent, while still registering the lowest cardio-
vascular mortality rate, providing a clear reminder of the
complex pathways between health inputs and outcomes.
A second sub-national measure of access to health
services is the share of people reporting unmet or
partially unmet mental health care needs. Across prov-
inces, this tracks fairly closely to the national average

W
HO
AN
D W
HA
T G
ET
S LE
FT
BE
HIN
D?
23
Table 4. Provinces and territories - status assessment on select SDG health targets
Goal
SDG
2030
targ
et
Natio
nal
Albe
rta
Briti
sh
Colu
mbi
a
Mani
toba
New
Brun
swick
Newf
ound
land
& La
brad
or
Nova
Sco
tia
Onta
rio
Prin
ce E
dwar
d Isl
and
Queb
ec
Sask
atch
ewan
North
west
Te
rrito
ries
Nuna
vut
Yuko
n
3
Cancer - malignant neoplasms mortality rate, 2013Age-standardized, per 100,000 people
Cut by 1/3
206 193 191 213 215 250 234 197 226 223 206 231 468 281off off off off off off off off off off off on off off
Major cardiovascular disease mortality rate, 2013Age-standardized, per 100,000 people
Cut by 1/3
184 219 181 218 201 258 215 178 222 162 219 227 255 202on on on on on on on on on on on on on on
Tuberculosis incidence rate, 2015New & re-treatment, per 100,000 people
End epidemic1
4.6 5.0 5.6 12.2 0.8 6.3 0.6 4.3 2.0 3.0 6.1 11.3 119.2 8.0off off off off on off on off off off off off off off
Motor vehicle accident mortality rate, 2013Age-standardized, per 100,000 people
Cut by 1/2
6.2 9.4 5.7 7.6 7.6 6.5 8.4 4.8 11.7 5.6 12.0 8.1 16.2 8.0off off off off off off off off off off off off off off
Perceived mental health care needs, 20122
Unmet or partially unmet needs, % of population aged 15+100% 5.8% 5.0% 7.2% 6.6% 4.4% 4.6% 7.3% 6.3% 6.1% 4.5% 6.0%
Has regular medical doctor, 20143
% of population aged 12+100% 85% 80% 85% 84% 93% 89% 90% 92% 89% 75% 80% 42% 17% 74%
off off off off off off off off off off off off off offPopulation (thousands), 2016 36,286 4,253 4,752 1,318 757 530 950 13,983 149 8,326 1,151 45 37 38
Notes: 1 We define “end the epidemic” as an incidence rate of less than 1 per 100,000. 2 This is a sum of two means; see online supplement for underlying coefficients of variation. 3 See online supplement for 95% confidence intervals. Source by goal: 3a, b, d = CANSIM 102-0553; 3c = Gallant, et. al (2017); 3e = CANSIM 105-1101; 3f = CANSIM 105-0502; population = CANSIM 051-0001
best recent value, provincesmost problematic recent value, provinces
most problematic, territory lags province
“on” = on track for SDG, “off” = off track for SDG (where data permits)
Legend

24 GLOBAL ECONOMY AND DEVELOPMENT PROGRAM
of 5.8 percent of the total population. However, when
considering only those people with a self-identified
need for mental health care, the share with unmet
needs at the national level rises to over 30 percent,
and is as high as 40 percent in Saskatchewan.
Canada’s statistical systems are strong enough to
disaggregate many provincial-level indicators further
by gender, as shown in Table 5. In the first row, the
LICO measure of low-income status suggests little sta-
tistically distinguishable difference between genders,
noting that several provinces have higher bands of
uncertainty around the estimated values. But the table
also suggests that Canadian females generally experi-
ence higher rates of food insecurity than males across
the country. The difference between female and male
food insecurity ranges from less than 1 percentage
point in Quebec to a disparity of 8.9 percentage points
in Prince Edward Island. Basic proficiency in literacy is
roughly equal between genders, but the figures sug-
gest that approximately 700,000 more adult females
than males are being left behind without basic numer-
acy skills, at 3.1 million compared to 2.4 million.22
On health indicators, Canadian males often lag behind
females. The gender difference is greatest in major
cardiovascular disease. In the Northwest Territories,
mortality from cardiovascular disease is more than
twice as high in males as in females. Nova Scotia has
the greatest discrepancy among the provinces, with
males having 1.8 times higher cardiovascular mor-
tality than females. Motor vehicle mortality rates are
also gender differentiated, with all provinces having at
least double the mortality among males compared to
females, although females have higher mortality rates
in Northwest Territories and Nunavut.
Police-reported violence against females show con-
siderable differences across regions, again noting that
this could be due both to variation in rates of violence
and in rates of reporting. Ontario, the most populous
province, recorded rates 23 percent below the national
average, while Saskatchewan’s rate was more than
twice the average. Reported rates in the territories are
higher than in the provinces. Nunavut’s rate is highest,
at 12.8 times the national average; it also has the high-
est rates of reported violence against males, at 8,650
male victims per 100,000 people.
CitiesTable 6 presents a selection of indicators for five major
metropolitan areas. This includes eight indicators re-
ported at the corresponding provincial level in Tables
3 and 4. Municipalities tend to have similar values to
their respective provinces, although there are some
variations. Montreal and Toronto both record higher
food insecurity than their respective provincial aver-
ages, although the difference is only statistically sig-
nificant for Montreal.23 As a health service indicator,
Montreal also registered 64 percent of the population
with a regular medical doctor, compared to a 75 per-
cent provincial average.
Some of the largest discrepancies between city and pro-
vincial data are for police-reported violent crime against
females. Calgary, Vancouver, and Winnipeg report lower
rates than do Alberta, British Columbia and Manitoba,
respectively. This potentially suggests that the issue
is worse in rural than urban areas in those provinces.
Interestingly, each of the five cities also reports higher
confidence in the justice system and courts than their
provincial averages, suggesting a discrepancy between
urban and rural views on public institutions.
Table 6 also includes two indicators directly pertinent
to SDG 11 on sustainable cities. One is the share of
workers commuting by public transit, bicycle, or walk-

25
Table 5. Gender disaggregation - status assessment of select SDG targets by province and territory
Goal
SDG
2030
targ
et
Natio
nal
Albe
rta
Briti
sh
Colu
mbi
a
Mani
toba
New
Brun
swick
Newf
ound
land
& La
brad
or
Nova
Sco
tia
Onta
rio
Prin
ce E
dwar
d Isl
and
Queb
ec
Sask
atch
ewan
North
west
Te
rrito
ries
Nuna
vut
Yuko
n
1 Low-income, 2015Low income cut-offs after tax, % of population
Cut by 1/2
FemaleMale
9.3%‡
9.1%‡5.7%‡‡ ‡
6.5%‡‡11.3%‡‡
12.0%‡10.0%‡
9.9%‡‡6.9%‡‡
8.0%‡‡7.3%‡‡
4.7%‡‡ ‡7.9%‡‡
6.7%‡‡9.5%‡
9.1%‡6.2%‡‡ ‡
6.4%‡‡ ‡10.2%‡‡
10.0% ‡‡6.4%‡‡
5.2%‡‡
2 Food insecurity, 2012Moderate + severe, % of population aged 12+ 0% Female
Male8.6%‡
6.9%‡8.8%‡‡
6.9%‡‡8.9%‡
6.2%‡7.8%‡‡
6.7%‡‡9.6%‡‡
8.3%‡‡6.9%‡‡
6.9%‡‡12.4%‡‡
9.1%‡‡8.5%‡
6.8%‡14.5%‡‡
5.6%‡‡ ‡7.9%‡
7.2%‡8.3%‡‡
6.5%‡‡15.5%‡‡
12.9%‡‡ ‡43.8%1,‡‡
36.4%1,‡‡10.3%‡‡
9.3%‡‡ ‡
3
Cancer mortality rate, 2013Malignant neoplasms, age-standardized, per 100,000 people
Cut by 1/3
FemaleMale
177246
166230
165224
187252
187257
223288
199285
169237
170304
193270
179244
195262
452515
228360
Major cardiovascular disease mortality rate, 2013Age-standardized, per 100,000 people
Cut by 1/3
FemaleMale
147230
176271
147221
168276
160251
210313
159290
142224
175290
133199
171279
139334
199288
149253
Tuberculosis incidence rate, 2015New & re-treatment, per 100,000 people
End epidemic2
FemaleMale
4.24.9
4.95.1
5.95.2
13.211.2
0.31.3
4.97.7
0.21.1
3.94.8
4.00.0
2.53.5
6.25.9
9.313.3
56.0178.5
5.410.5
Motor vehicle accident mortality rate, 2013Age-standardized, per 100,000 people
Cut by 1/2
FemaleMale
3.78.7
5.913.0
3.67.8
4.710.4
3.611.4
2.410.7
3.713.2
2.86.9
7.615.8
3.67.6
7.116.9
11.44.2
18.913.4
6.110.1
Perceived mental health care needs, 20123
Unmet or partially unmet needs, % of population aged 15+
FemaleMale
7.1%4.4%
6.5%3.7%
9.4%4.9%
9.8%n.d.
5.2%n.d.
5.0%n.d.
9.6%4.9%
7.3%5.1%
7.1%n.d.
5.2%3.7%
8.5%n.d.
Has regular medical doctor, 20144
% of population aged 12+100% Female
Male88%81%
84%76%
88%82%
89%79%
95%91%
93%85%
92%87%
94%90%
92%87%
81%69%
86%75%
48%37%
15%18%
76%72%
4
Literacy, 20125
Age 16-65, % of population scoring 2+ on PIAAC100% Female
Male82%83%
Numeracy, 20125
Age 16-65, % of population scoring 2+ on PIAAC100% Female
Male74%80%
5Victims of violence, 2011Police-reported violent crime, per 100,000 people aged 15+
0 FemaleMale
1,207 1,151
1,459 1,301
1,301 1,410
2,191 1,783
1,376 1,272
1,330 1,237
1,262 1,324
928 881
1,096 961
1,036 1,049
2,681 2,127
11,193 7,261
15,453 8,650
4,609 4,042
16Public confidence in justice system and courts, 2013% of population aged 15+
FemaleMale
59%56%
Population (thousands), 2016 FemaleMale
18,29117,996
2,0952,158
2,3952,357
662656
383374
269261
484465
7,1116,872
7672
4,1874,139
570580
2223
1819
1819
Where listed by StatCan: ‡ coefficient of variation (CV) < 8%; ‡‡ CV between 8% and 16%; ‡‡ ‡ CV between 16% and 33.3%
Notes: “n.d.” indicates data not available; 1 Ten largest communities in Nunavut. 2 We define “end the epidemic” as an incidence rate of less than 1 per 100,000. 3 This is a sum of two means, see online supplement for underlying coefficients of variation. 4 See online supplement for 95% confidence intervals. 5 See online supplement for standard errors. Source by goal: 1a = CANSIM 206-0041; 2 = CANSIM 105-0547; 3a, b, d = CANSIM 102-0553; 3c = Gallant, et. al (2017); 3e = CANSIM 105-1101; 3f = CANSIM 105-0502; 4a, b = StatCan (2013b); 5 = CCJS (2013); 16 = Cotter (2015); population = CANSIM 051-0001.

26 GLOBAL ECONOMY AND DEVELOPMENT PROGRAM
Table 6. Municipalities - status assessment across select SDG targets Go
al
SDG
targ
et
Natio
nal
Calg
ary,
AB
Mont
real,
QC
Toro
nto,
ON
Vanc
ouve
r, BC
Win
nipe
g, M
B
1
Low-income, 2015Low income cut-offs after tax, % of population
Cut by 1/2
9.2%‡ 8.3%‡‡ ‡ 14.1%‡‡ 11.8%‡ 14.0%‡‡ 13.3%‡
off off off off off off
Low-income, 2015Market basket measure, % of population
Cut by 1/2
12.1%‡ 9.8%‡‡ ‡ 13.4%‡‡ 16.2%‡ 16.4%‡‡ 13.2%‡
off off off off off off
2 Food insecurity, 2012Moderate + severe, % of population aged 12+
0% 7.8%‡ 7.5%‡‡ 10.7%‡‡ 9.5%‡‡ 6.7%‡‡ ‡ 6.6%‡‡
off n.d. off off on n.d.
3
Cancer - malignant neoplasms mortality rate, 2010-12 avg.Age-standardized, per 100,000 people
Cut by 1/3
211 173 223 176 168 224
off off off off off off
Circulatory diseases mortality rate, 2010-12 avg.Age-standardized, per 100,000 people
Cut by 1/3
193 200 175 158 156 229on on on on on on
Has regular medical doctor, 20141
% of population aged 12+100% 85% 82% 64% 89% 81% 85%
off off off off off n.d.
5 Female victims of violence, 2011Police-reported violent crime, per 100,000 people
0 1,207 843 1,053 911 1,106 1,436off off off off off off
11
Workers traveling by public transit, bike, or walking, 2011% of workers
19% 22% 29% 29% 28% 21%
(+) (-) (+) (+) (+) (+)
Park or green space close to home, 2013Less than 10 minutes, % of population
100% 85% 88% 91% 85% 87% 88%
off off off off off off
16 Public confidence in justice system and courts, 2013% of population aged 15+
57% 62% 54% 68% 55% 52%
Where listed by StatCan: ‡coefficient of variation (CV) < 8%; ‡‡CV between 8% and 16%; ‡‡ ‡CV between 16% and 33.3%
Notes: “n.d.” indicates data not available. 1 See Appendix for 95% confidence intervals.
Source by goal: 1a, b = CANSIM 206-0041; 2 = CANSIM 105-0547, 2013 health boundaries; 3a, b = CANSIM 102-4313, 2015 health boundaries; 3c = CANSIM 105-0502, 2013 health boundaries; 5 = CCJS (2013), Vaillancourt (2008); 11a = NHS (2011); 11b = CANSIM 153-0148; 16 = Cotter (2015)
best recent value “on” = on track for SDG, “off” = off track for SDG (where data permits)(+) = recent trend is improving, (-) = recent trend is moving in the wrong direction
Legend

WHO AND WHAT GETS LEFT BEHIND? 27
ing. The national average as of 2011 was 19 percent,
and all five cities recorded a higher share that year.
Montreal and Toronto were both at 29 percent, with
a growing trend, and only Calgary was on a declining
trend. The other urban indicator, which links directly to
SDG target 11.7, is the share of people living within 10
minutes of a green space. All five cities registered 85
percent or more of their populations satisfying this cri-
terion as of 2013, although none were on track to reach
100 percent by 2030.
Demographic disaggregation: by indigenous status, immigration status, and people living with a disabilityConsideration of Canada’s 1.4 million indigenous peo-
ple—including First Nations, Métis, and Inuit—draws
attention to many of the country’s most glaring inequi-
ties. Although relevant disaggregation is not available
for many of the indicators listed in the preceding tables,
Table 7 nonetheless presents a small sample of rele-
vant indicators by indigenous status. As of 2010, the
indigenous child poverty rate was a distressing 38 per-
cent, more than double the rate in the non-indigenous
population. Remarkably, the corresponding estimate
among on-reserve First Nations communities was
much higher the same year, at 60 percent (Macdonald
and Wilson, 2016).24
Basic needs indicators further underscore the dispari-
ties. Food insecurity among indigenous peoples is more
than twice the national average. Educational challenges
are pronounced, with indigenous populations trailing
non-indigenous populations by nearly 8 percentage
points on literacy and more than 13 percentage points
on numeracy. Although not reported in Table 7, a lack
of access to safe drinking water has drawn regular
national attention. As of end-July 2017, there were at
least 102 long-term drinking water advisories—mean-
ing advisories in place more than a year—among 101
First Nations communities not located among the three
territories, British Columbia First Nations, or Saskatoon
Tribal Council (Health Canada, 2017). The figures pro-
vide important context for the national shortfall on ac-
cess to drinking water described earlier.
Returning to Table 7, indigenous populations tend to
face greater health challenges than national aver-
ages. TB incidence rates among First Nations groups
are three times higher than the national average, and
among Inuit groups are more than 35 times higher than
average. Indigenous people have notably lower re-
ported regular access to a medical doctor, compared to
non-indigenous people. Importantly, disease-specific
mortality data are not readily available for indigenous
populations, so we are not able to report those.
The data suggest that female indigenous people face
particular challenges. For example, female food insecu-
rity rates are higher than for males, at 20.0 percent com-
pared to 15.9 percent. Indigenous women also report
nearly three times the rate of violence than do non-indig-
enous women. 25 Such indicators are particularly notable
in the context of only 43 percent of indigenous people
having confidence in the justice system and courts.
Foreign-born populations can also be tracked on some
indicators, reflecting an important issue for a country
in which immigration plays such a strong role. Food
insecurity is greater among foreign-born than domesti-
cally-born populations, but only among immigrants who
have lived in Canada for less than five years (StatCan
2012). Health outcomes are a challenge too. The rate
of TB incidence and retreatment was more than nine
times higher among the foreign-born population than the
Canadian-born population in 2015 (Gallant et al. 2017).

28 GLOBAL ECONOMY AND DEVELOPMENT PROGRAM
PISA test results indicate that average science scores
are comparable among immigrant students and those
born in Canada (OECD 2016b). But adult immigrant
populations have lower average literacy and numer-
acy scores than Canadian-born populations. This dif-
ference persists even when considering “established
immigrants” who have been in Canada for more than
10 years (StatCan 2013b). More than a quarter of that
population lacks basic proficiency on literacy skills,
twice as high a share as among Canadian-born adults.
Meanwhile 33 percent of established immigrants have
been estimated to lack basic proficiency in numeracy
skills, compared to 19 percent among Canadian-born
individuals (StatCan 2013b).
Interestingly, foreign-born populations reported higher
confidence in the justice system and courts than
Canadian-born populations. Seventy-nine percent of
those who immigrated since 2000 had some or a great
deal of confidence, as did 69 percent who immigrated
before 2000. This compares to just 54 percent among
non-immigrants (Cotter 2015).
Disability status represents another important dimen-
sion for fulfilling the SDG vision of no one left behind. As
of 2012, 3.8 million Canadians, nearly 14 percent of the
adult population, reported being limited in their daily ac-
tivities due to a disability (StatCan 2013e).26 While the
employment rate was 74 percent among those aged 15
Table 7. Indigenous people - status assessment on select SDG targets
GoalSDG 2030
target National Indigenous Non-Indigenous
1 Child poverty, 2010% of children aged 0 to 17 Cut by 1/2 18% 38% 17%
2 Food insecurity, 2012Moderate + severe, % of population aged 12+
0% 7.8% 18.0%1
3
Tuberculosis incidence rate, 2015New & re-treatment, per 100,000 people
End epidemic6 4.6
15.1 First Nations166.2 Inuit2.2 Métis
0.62
Has regular medical doctor, 2014, Indigenous data from 20123
% of population aged 12+100% 85% 76%4
4
Literacy, 20125
Age 16-65, % of population scoring 2+ on PIAAC100% 84% 76% 84%
Numeracy, 20125
Age 16-65, % of population scoring 2+ on PIAAC100% 77% 65% 78%
5
Females who experienced violent victimization, 2014Self-reported violent victimization incidents, per 1,000 people aged 15+
0 220‡‡ ‡ 81
Males who experienced violent victimization, 2014Self-reported violent victimization incidents, per 1,000 people aged 15+
0 110‡‡ ‡ 66
16Public confidence in justice system and courts, 2013% of population aged 15+ 57% 43% 58%
Where listed by StatCan: ‡coefficient of variation (CV) < 8%; ‡‡CV between 8% and 16%; ‡‡ ‡CV between 16% and 33.3%
Notes: 1 Sum of those with “low food security” and “very low food security;” differs from national metric of “moderate and severe food insecurity.” 2 Canadian born non-Indigenous. 3 See Appendix for 95% confidence intervals. 4 Percent of population aged 6+. 5 See Appendix for standard errors. 6 We define “end the epidemic” as an incidence rate of less than 1 per 100,000.
Source by goal: 1 = Macdonald & Wilson (2015); 2 = CANSIM 105-0547, 577-0009; 3a = Gallant, et. al (2017); 3b = CANSIM 105-0502, 577-0003; 4a, b = StatCan (2013b); 5a, b = Boyce (2014); 16 = Cotter (2015)

WHO AND WHAT GETS LEFT BEHIND? 29
to 64 without any disability, the corresponding rate was
36 percent for those with mobility disabilities, 46 per-
cent for pain-related disability, 39 percent for flexibility
disabilities, 48 percent for hearing disabilities, and 38
percent for seeing disabilities. Educational challenges
are also present among youth. Young people age 15-24
with pain-related disabilities were 1.8 times more likely
not to have completed high school than were coun-
terparts without a disability. A more comprehensive
assessment would need to collect disaggregated data
across SDG-relevant indicators.
IV. STRATEGIES TO DATE
The final substantive contribution of this paper is briefly
to consider the links between Canada’s existing do-
mestic policy strategies and the SDGs. As mentioned
earlier, the federal government has not yet presented a
Voluntary National Review to the U.N. or articulated an
overarching SDG strategy. Nor, to our knowledge, has
a provincial, territorial, or municipal government yet pre-
sented a full SDG strategy. However, a variety of relevant
cross-sectoral policy documents have been presented at
the federal, provincial, and municipal levels.
NationalAt the national level, the Federal Sustainable
Development Strategy (FSDS) “outlines federal lead-
ership on climate change and the environment-related
2030 Sustainable Development Goals” for the Ministry
of Environment and Climate Change Canada over
the period 2016-2019 (ECCC 2016a). The document
includes 13 goals and 26 medium-term environmen-
tal sustainability targets that cover a variety of time
horizons, and presents itself as a living document that
will be updated regularly. To our knowledge, no other
existing federal strategy has so far formally articulated
an approach to other dimensions of the SDGs.
Some FSDS targets, such as those on climate change
and marine protected areas, directly align with SDG
targets. At least four FSDS objectives are more ambi-
tious than the corresponding SDG target. For example,
the FSDS goal on clean drinking water aims to resolve
all long-term drinking water advisories affecting First
Nations by 2021, well before the 2030 SDG deadline.
FSDS targets on renewable energy, protected land
area, and sustainable forests include quantifiable out-
come language not present in the SDGs. Meanwhile,
several FSDS targets are similarly vague to the SDGs
in describing aims, as is the case on sustainable
agriculture. The other FSDS targets touch on many of
the same issue areas as the SDGs but are not sys-
tematically aligned, either focusing on a narrower sub-
topic or specifying a particular Canadian geography.
ProvincialWe identified at least six provincial strategies published
between 2007 and 2016 that cover topics relevant to the
SDGs, although none specifically mentions the SDGs.
As shown in Table 8, most of these strategies focus on a
near-term horizon out to 2019, 2020, or 2021 and each
tackles a subset of SDG-relevant topics. Most address,
in some fashion, issues of economic development, em-
ployment, and education. On the environmental side,
they generally address air and water quality, solid waste,
and greenhouse gas emissions. Some lack an explicit
ambition of identifying groups being left behind. New
Brunswick’s strategy stands out in this regard, describ-
ing the need to close a wellness gap and disaggregating
health indicators by geography, gender, age, indigenous
identity, and income level.

30 G
LOB
AL E
CO
NO
MY
AN
D D
EV
ELO
PM
EN
T P
RO
GR
AM
Table 8. Provincial strategies potentially relevant to SDGs
Province
Year pub-
lished Name
Sets tar-
gets?Time
horizon Priority areasAlberta 2016 2016-19 Government of Alberta
strategic planYes 2019 Diversified economy that creates jobs and opportunities for all Albertans; Demonstrated
leadership on climate change; Education and training to enable Albertans to succeed in the global economy; Safe and inclusive communities that embrace fairness and equality of opportunity; Sustainable and accessible health care services and social supports
Manitoba 2009 Provincial sustainability report No ongoing Natural Environment (biodiversity and habitat, fish, forests, air, water, climate change); Economy (economic performance, agricultural sustainability, mining, energy efficiency and conservation, consumption and waste management, employment, education); Social well-being (demographics, equity and rights, community and culture, governance, health, justice)
New Brunswick 2014 New Brunswick's wellness strategy 2014-2021
No 2021 Seven dimensions of wellness: Physical; Social; Spiritual; Occupational; Environmental; Emotional; Mental/Intellectual
Newfoundland & Labrador
2016 The way forward: A vision for sustainability and growth in Newfoundland and Labrador
Some 2025 A more efficient public sector; A stronger economic foundation; Better services; Better outcomes
Nova Scotia 2007 Nova Scotia 2020 vision Some 2020 Ecosystem protection; Air emissions; Renewable energy; Water quality; Contaminated sites; Solid waste; Sustainable purchasing; Energy-efficient buildings
Quebec 2015 Stratégie gouvernementale de développement durable 2015-2020
No 2020 Renforcer la gouvernance du développement durable dans l’administration publique; Développer une économie prospère d’une façon durable – verte et responsible; Gérer les ressources naturelles de façon responsable et respectueuse de la biodiversité; Favoriser l’inclusion sociale et réduire les inégalités sociales et économiques; Améliorer par la prévention la santé de la population; Assurer l’aménagement durable du territoire et soutenir le dynamisme des collectivités; Soutenir la mobilité durable; Favoriser la production et l’utilisation d’énergies renouvelables et l’efficacité énergétique en vue de réduire les émissions de gaz à effet de serre

W
HO
AN
D W
HA
T G
ET
S LE
FT
BE
HIN
D?
31
Table 9. Municipal strategies potentially relevant to SDGs Major
municipalitiesYear
Published NameSets
targets?Time
horizon Priority areas Calgary, AB 2012 2020 Sustainability
directionYes 2020 Community well-being; Prosperous economy; Sustainable environment; Smart growth and
mobility choice; Financial capacity; Sustainable corporation
Montreal, QC 2016 Sustainable Montreal 2016-2020
Yes 2020 Low-carbon Montreal: reduce GHG by 80% by 2050; Equitable Montreal: Improve access to services and facilities, fight inequality and promote inclusiveness; Exemplary Montreal: Adopt exemplary sustainable development practices
Toronto, ON 2012 Strategic actions for 2013-2018
Yes 2018 City building; Economic vitality; Environmental sustainability; Social development; Good governance; Fiscal sustainability
Vancouver, BC 2015 A healthy city for all Yes 2025 A good start; A home for everyone; Feeding ourselves well; Healthy human services; Making ends meet and working well; Being and feeling safe and included; Cultivating connections; Active living and getting outside; Lifelong learning; Expressing ourselves; Environments to thrive in; Collaborative leadership for a healthy city for all
2012 Greenest city 2020 action plan
Yes 2020 Green economy; Climate leadership; Green buildings; Green transportation; Zero waste; Access to nature; Lighter footprint; Clean water; Clean air; Local food
Winnipeg, MB 2011 OurWinnipeg Not yet 2035 Sustainable water and waste; Complete communities; Sustainable transportation; Sustainable Winnipeg

32 GLOBAL ECONOMY AND DEVELOPMENT PROGRAM
CitiesTable 9 reviews municipal strategies for the same five
major Canadian cities included in Table 6. These city
strategies tend to have better defined targets then their
provincial counterparts. They cover a variety of time
horizons, ranging from 2018 for Toronto to 2035 for
Winnipeg. As with the provinces, these municipal strat-
egies vary in their level of ambition, and none of the
five align fully with the SDGs. Many of the strategies’
targets inherently relate to Goal 11 on sustainable cit-
ies and communities, including access to green space
or parks, affordable housing, and sense of community.
Many tackle issues of inequality and economic oppor-
tunities. Topics related to Goal 9 on industry, innova-
tion, and infrastructure are common, particularly with
respect to public transportation and building efficiency.
V. SYNTHESIS AND CONCLUSION
This paper presents a framework for assessing
Canada’s status on the SDGs. It aims to adhere
as much as practical to the formal U.N. targets, indi-
cators, and database, while also drawing extensively
from other sources, especially for sub-national assess-
ments. Our methodology sorts the 169 SDG targets
based on which ones are outcome-focused, quantified,
and measurable within advanced economies. This
produces a mix of 37 directly quantified targets and
41 proxy targets that could be assessable across all
advanced economies. Of these, we identify adequate
data to assess Canada on 61 targets using 73 indica-
tors.
Overall, the results underscore the relevance of the
SDG framework to Canada’s domestic context. On
the positive side, the results show Canada’s success
on many issues. For instance, Canada has surpassed
absolute global standards for extreme income poverty,
child mortality, and maternal mortality, while achieving
universal access to crucial services like social protec-
tion, legal identity, and modern energy. Canada also
enjoys some of the best average educational out-
comes in the world. At the same time, the results also
suggest that Canada is not yet wholly on-track for any
of the first 16 SDGs. For each goal, faster progress is
needed on at least one indicator.
To stress, our findings should not be interpreted as pre-
dictions, nor as a suggestion that Canada is unable to
meet any of the goals. Instead, the results mainly draw
attention to the people and issues that are currently be-
ing left behind amid Canada’s pursuit of economic, so-
cial, and environmental progress. The country is on-track
for 17 indicators; requires acceleration on 12; needs a
clear breakthrough on 26; and requires a reversal of
negative trends on 18. On many indicators, the absolute
distance to the SDG benchmark remains small, but tar-
geted efforts are needed to cover a “last mile.”
Among its challenges, Canada’s limited gains on mea-
sures of low-income status suggest a breakthrough is
needed to fulfill the SDG target to cut domestic income
poverty by half by 2030. Measures of income inequality
have also been stagnant while affordability of housing
presents a persistent challenge. Meanwhile, indicators
of food insecurity and malnutrition have been moving
in the wrong direction. Remarkably, access to drinking
water has recently declined too, leaving an estimated
570,000 people without reliable access, a large share
of whom are indigenous people.
The SDG targets help illuminate Canada’s educational
challenge as the world economy enters a period of ac-
celerated automation. The country scores well on mea-
sures of access, but a large share of the population is
being left behind in terms of basic skills for literacy and

WHO AND WHAT GETS LEFT BEHIND? 33
numeracy. Well over 3 million adult Canadians might
lack crucial literacy skills while more than 5 million
might lack core numeracy skills. These numbers raise
pivotal questions of how Canadians can best be sup-
ported to develop relevant skill sets at all stages of life.
The range of issues encompassed in SDG 3 draw
attention to Canada’s relative trajectories for health
and well-being. Mortality from non-communicable
diseases is declining, although needs to accelerate in
most cases in order to achieve a one-third reduction
by 2030. Faster progress is also needed to cut traffic
deaths by half by 2020. The country is nearly but not
quite on track to achieve universal coverage of seven
key health interventions by 2030, and in a similar
situation for universal access to reproductive health
services. More substantial accelerations are required
on suicide mortality and infectious diseases like TB.
Substance abuse appears to be moving in the wrong
direction.
Canada’s outlook on environmental issues is mixed.
The federal government has established, and made
concrete steps toward meeting, SDG-consistent tar-
gets for protecting land and marine areas by 2020, al-
though considerably faster progress is still needed on
both fronts. The country seems to be on course to end
overfishing and keep forest harvests within sustainable
levels, but a breakthrough is required to halt the loss
of biodiversity. On climate change, Canada requires
breakthrough rates of progress to meet its 2030 emis-
sions targets, again despite recent policy advances.
Relevant indicators show the need to increase energy
efficiency and the share of renewables in energy con-
sumption and production.
Goal 16 for peace, justice, and strong institutions
reveals a surprising blend of results. Many aspects
of Canada’s public institutions are strong, but only
57 percent of the population has clear confidence
in the justice system and courts. Indicators are also
moving in the wrong direction for reported sexual vi-
olations against children and unsentenced detainees
as a share of the prison population. Future research
focused on Canada’s own Goal 16 challenge would
clearly be valuable.
Our assessment draws attention to how much prog-
ress is still needed for Canada to achieve gender
equality. National breakthroughs are needed on the
wage gap, gender disparity in unpaid work, violence
against women, early marriage, and representation in
parliament. Gender disaggregation across provinces
and territories suggest that more women than men are
food insecure. Women also appear to have more fre-
quently unmet mental health needs.
Exploring SDG-relevant indicators across Canadian
geographies shows that different provinces tend to
lead and lag on each target for which subnational data
are available. Similarly, an assessment of five major
cities shows considerable variation, sometimes draw-
ing attention to differences with rural areas. We are
also able to evaluate a select number of indicators dis-
aggregated by immigrant status and disability status,
highlighting differences in educational outcomes and
employment challenges.
There is troubling consistency in the challenges faced
by Canada’s three territories, particularly Nunavut,
where a large majority of the population is comprised of
indigenous people. More broadly, we are able to identify
a handful of indicators that capture deep overall dispar-
ities faced by Canada’s indigenous people, including
for poverty, food insecurity, access to medical care, re-
ported violence, and faith in public institutions. Current
data availability limits further disaggregation across
issue areas, pointing to the need for better information.

34 GLOBAL ECONOMY AND DEVELOPMENT PROGRAM
Canada’s recent national, provincial, and municipal
sustainability strategies mostly focus on time horizons
out to around 2020, but few of them so far have any
systematic alignment with the SDGs. As each city,
province, and federal actor updates its strategies mov-
ing forward, they will be able to set targets, suitably lo-
calized, to align with Canada’s commitments under the
SDGs. In the meantime, it will be crucial to establish
baseline measures, as soon as possible, for tracking
future progress.
This study yields procedural insights too. The pro-
cess of pulling together disparate data sources into
a systematic national and sub-national assessment
highlights the value of a multi-dimensional societal
scorecard that can be benchmarked against medi-
um-term objectives. The extensive amount of work
required to identify relevant targets, indicators, and
data sources also draws attention to the need for poli-
cymakers in both the U.N. system and the Government
of Canada to continue developing SDG databases and
benchmarks that will more easily inform relevant policy
debates and processes. Analysts would benefit from a
one-stop-shop to assess progress across issues, ge-
ographies, and demographic groups. Citizens and re-
searchers alike require straightforward data resources
to assess who is being left behind, and which issues
are lagging.
On a number of SDG issues, we are not able to assess
status, either because the relevant target is not clearly
defined or because of gaps in the data. For example,
the SDG targets on industry and infrastructure are not
ideal for assessing performance in an advanced econ-
omy, nor are many of the targets on decent work and
economic growth. Advanced economies like Canada
might want to set their own targets in these realms.
There are also important data gaps on issues of sus-
tainable transport, water resource management, and
lifelong learning.
This empirical assessment of Canada’s domestic SDG
status can inform forward-looking policy debates on
how best to change trajectories. Future research will
be able to present more refined assessments as un-
derlying data sources keep improving and government
actors establish domestic targets that provide greater
clarity where formal SDG language is ambiguous.
Researchers will also surely spot opportunities for bet-
ter technical methods of benchmarking. In the mean-
time, this paper helps to translate the SDGs from U.N.
framework to country-level diagnostic tool. In so doing,
it aims to specify the people and issues that require
faster progress. Amid Canada’s many extraordinary
achievements, the SDGs can help inform a broad so-
cietal effort to ensure no person or issue is left behind.

WHO AND WHAT GETS LEFT BEHIND? 35
ENDNOTES
1. OECD (2016a) also presents a multi-tier filtering logic for the SDG targets, ultimately focusing on 20 that are outcome-oriented, easy to quantify, and align with development cooperation priorities.
2. The official SDG framework distinguishes between outcome targets (numbered 1.1, 1.2, and so forth) and means of implementation targets (lettered 1.a, 1.b, and so forth), although a handful of numbered targets actually focus on means of implementation.
3. Exceptions to this process are listed in Appendix 1. For example, for targets under Goal 5 on gen-der equality, we use gender parity as a proxy for equality.
4. The 41 proxy targets include five Canadian nation-al targets.
5. This indicator count is as of mid-2017 and does not include the large number of sub-indicators that could potentially be used to track progress across disaggregated population groups. Official UN pro-cesses will likely continue to update the indicator architecture over time.
6. Exceptions include, for example, national low-in-come status and maritime area protected, which were updated with information available as of Au-gust 2017.
7. Gaps are particularly noteworthy for the 10 as-sessable targets with 2020 deadlines. Canada has observations for seven of these.
8. We calculate proportional rates of progress for in-dicators relating to mortality or economic growth and percentage point (absolute) rates of progress for all other indicators. See McArthur and Rasmus-sen (2017) for details.
9. This follows the extrapolation methodology used in McArthur and Rasmussen, 2016. For four indi-cators, data are only available for one period: 1.3 on social protection, 12.3 on food waste, 15.5 on biodiversity and 16.6 on trust in public institutions.
10. In 1990, Canada had a reported maternal mortality ratio of 7 deaths per 100,000 live births, compared
to the SDG standard of 70 deaths per 100,000 live births.
11. We use gender wage-gap instead of the official SDG indicator because the official indicator mea-sures a process – whether legal frameworks are in place to promote non-discrimination – rather than an outcome.
12. It is unclear whether Canada’s low rate of water withdrawal arises from abundant freshwater avail-ability or low water use. We rank Canada as re-quiring a “breakthrough” due to its slow progress on improving water-use efficiency: on current tra-jectory, it will cover just 30 percent of the distance to the proxy target. However, its low withdrawal rate may already qualify it for being on-track.
13. Because the end target of “substantially increasing the number of research and development workers” is unclear, our proxy target is set as increase the number of researchers by 50%. Canada requires a breakthrough because it covers less than half the distance to this proxy target.
14. Target 11.1 includes three characteristics of ac-cess to housing: adequate, safe, and affordable. Our data only addresses affordability.
15. Targets 1.5, 11.5 and 13.1 include the same of-ficial indicators. To avoid repetition, we examine economic loss due to natural disasters.
16. The formal target is halve global food waste, a pro-portionate standard we apply directly to Canada.
17. Of the 25 global absolute targets assessed, at least some acceleration is required on 15.
18. Most indicators are reported as available in May 2017. Low-income indicators are updated with data released in August 2017.
19. For literacy, basic proficiency implies the ability to at least make low-level inferences and paraphrase. For numeracy, it implies the ability to complete two or more processes involving calculations with whole numbers and common decimals and inter-preting simple tables and graphs. Note that we use adult PIAAC scores for sub-national education in-dicators, rather than the school-aged PISA scores

36 GLOBAL ECONOMY AND DEVELOPMENT PROGRAM
as in the national assessment, because PIAAC allows for more extensive disaggregation analysis.
20. As a basic way to benchmark progress on green-house gas emissions, we apply the national target of reducing emissions to 30 percent of 2005 levels by 2030 to each province and territory.
21. We define “eliminate” as an incidence rate of less than 1 per 100,000.
22. In 2012, Canada had approximately 12 million males and 11.9 million females aged 16-65. From Table 5, 80 percent of males with minimum nu-meracy skills implies 2.4 million without; 74 per-cent of females with corresponding skills implies 3.1 million without. Note that these numbers are of a similar general magnitude, although not directly comparable, to the PISA-informed national calcu-lations discussed earlier under Goal 4.
23. The share of the population with food insecurity in Montreal is 10.7 percent (95 percent confidence
interval of 8.7 - 12.7) and Quebec is 7.5 percent (6.8 - 8.2). In Toronto it is 9.5 percent (7.8 - 11.2) and Ontario is 7.7 percent (7.1 - 8.2).
24. At the time of writing, we were unable to find household poverty rates disaggregated by Indig-enous status.
25. The measure of violence against woman is self-re-ported which differs from the police-reported met-ric used at the provincial level.
26. This includes 11 percent of adults with either a pain, mobility, or flexibility disability; 3.9 percent with mental/psychological disabilities; 3.5 percent with dexterity disabilities; 3.2 percent with hearing disabilities; and 2.7 percent with seeing disabili-ties. The original national survey was conducted in 2012, and is in the process of being updated in 2017.

WHO AND WHAT GETS LEFT BEHIND? 37
REFERENCES
Bataille, Chris and Dave Sawyer. 2016. Canadian
carbon pricing pathways, the economic and
emission outcomes of leading policies. Deep
Decarbonization Pathways Canada.
Boyce, Jillian. 2016. Victimization of Aboriginal people
in Canada, 2014. Canadian Centre for Justice
Statistics. Statistics Canada catalogue no. 85-
002-X.
BC Council for International Cooperation (BCCIC).
2016a. Keeping track: Measuring progress to-
ward the UN Sustainable Development Goals.
Vancouver, British Columbia: BCCIC.
———. 2016b. The Invisible Mosaic: BC and the
Sustainable Development Goals. Vancouver,
British Columbia: BCCIC.
———. 2017. Where Canada Stands, A Sustainable
Development Goals Progress Report. Vancouver,
British Columbia: BCCIC.
Canadian Centre for Justice Statistics (CCJS). 2013.
Measuring violence against women: Statistical
trends. Canadian Centre for Justice Statistics.
Statistics Canada catalogue no. 85-002-X.
Centre for Research on the Epidemiology of Disasters.
2017. “Emergency Events Database (EM-DAT).”
Brussels, Belgium: Universite Catholique de
Louvain. http://www.emdat.be/ (accessed: May
8, 2017).
Cotter, Adam. 2015. “Public confidence in Canadian
institution.” Statistics Canada catalogue no. 89-
652-x2015007. Spotlight on Canadians: Results
from the General Social Survey. Ottawa, Ontario:
Statistics Canada.
Environment and Climate Change Canada (ECCC).
2015a. “Canadian Environmental Sustainability
Indicators: Freshwater quality in Canadian
Rivers.” Gat ineau, Quebec: Environment
and Climate Change Canada. https://www.
ec.gc.ca/indicateurs-indicators/default.as-
p?lang=En&n=68DE8F72-1 (accessed: May 8,
2017).
———. 2015b. “Canadian Environmental Sustainability
Indicators: Number of marine pollution spills
from identified vessels.” Gatineau, Quebec:
Environment and Climate Change Canada.
https://www.ec.gc.ca/indicateurs-indicators/de-
fault.asp?lang=en&n=8D7B3A02-1 (accessed:
May 8, 2017).
———. 2016a. Achieving a sustainable future: A
Federal Sustainable Development Strategy
for Canada 2016-2019. Gatineau, Quebec:
Environment and Climate Change Canada.
———. 2016b. “Canadian Environmental Sustainability
Indicators: Air Quality.” Gatineau, Quebec:
Environment and Climate Change Canada.
https://www.ec.gc.ca/indicateurs-indicators/de-
fault.asp?lang=en&n=029BB000-1 (accessed:
May 8, 2017).
———. 2016c. “Canadian Environmental Sustainability
Indicators: Canada’s protected areas.” Gatineau,
Quebec: Environment and Climate Change
Canada. https://www.ec.gc.ca/indicateurs-indica-
tors/default.asp?lang=en&n=478A1D3D-1 (ac-
cessed: May 8, 2017).

38 GLOBAL ECONOMY AND DEVELOPMENT PROGRAM
———. 2016d. “Canadian Environmental Sustainability
Indicators: Solid waste disposal and diver-
sion.” Gatineau, Quebec: Environment and
C l i m a t e C h a n g e C a n a d a . h t t p s : / / w w w.
ec.gc.ca/indicateurs-indicators/default.as-
p?lang=en&n=D2EA2E21-1 (accessed: May 8,
2017).
———. 2017a. “Canadian Environmental Sustainability
Indicators: Changes in wildlife species disappear-
ance risks.” Gatineau, Quebec: Environment and
Climate Change Canada. https://www.ec.gc.ca/
indicateurs-indicators/default.asp?lang=en&n=C-
48CCBC7-1 (accessed: September 11, 2017).
———. 2017b. “Canadian Environmental Sustainability
Indicators: Greenhouse gas emissions.” Gatineau,
Quebec: Environment and Climate Change
Canada. https://www.ec.gc.ca/indicateurs-indi-
cators/default.asp?lang=en&n=FBF8455E-1 (ac-
cessed: May 8, 2017).
———. 2017c. “Canadian Environmental Sustainability
Indicators: Sustainable fish harvest.” Gatineau,
Quebec: Environment and Climate Change
Canada. https://www.ec.gc.ca/indicateurs-indi-
cators/default.asp?lang=en&n=893AB9F4-1 (ac-
cessed: May 8, 2017).
———. 2 0 1 7 d . “ C a n a d i a n E n v i r o n m e n t a l
Sustainability Indicators: Species at risk popu-
lation trends.” Gatineau, Quebec: Environment
and Climate Change Canada. https://www.
ec.gc.ca/indicateurs-indicators/default.as-
p?lang=en&n=79579EFA-1 (accessed: August
31, 2017).
Gallant, V., V. Duvvuri, and M. McGuire. 2017.
“Tuberculosis in Canada – Summary 2015.” Centre for
Communicable Diseases and Infection Control, Public
Health Agency of Canada Report. 43(3): 77-82.
Gooch, Martin, Abdel Felfel, and Nicole Marenick.
2010. Food waste in Canada: Opportunities to
increase the competitiveness of Canada’s agri-
food sector, while simultaneously improving the
environment. Oakville, Ontario: Value Chain
Management International Inc.
Government of Finland. 2016. National report on
the implementation of the 2030 Agenda for
Sustainable Development – Finland. Helsinki:
Prime Minister’s Office.
Government of Germany. 2016. Report of the German
Federal Government to the High-Level Political
Forum on Sustainable Development 2016. Berlin:
The Federal Government.
Government of Sweden. 2017. Sweden and the 2030
agenda – Report to the UN High Political Forum
2017 on Sustainable Development. Stockholm:
Government of Sweden.
Greene, Solomon and Brady Meixell. 2017. Hacking
the Sustainable Development Goals, Can US cit-
ies measure up? Washington, DC: Urban Institute.
Health Canada. 2017. “Drinking water advisories: First
Nations south of 60.” Ottawa, Ontario: Health
Canada. https://www.canada.ca/en/health-canada/
topics/health-environment/water-quality-health/
drinking-water/advisories-first-nations-south-60.
html (accessed: September 8, 2017).
Kaufmann, Daniel and Aart Kraay. 2016. “The
Worldwide Governance Indicators, 2016 Update.”
Washington, DC: The World Bank Group.

WHO AND WHAT GETS LEFT BEHIND? 39
http://info.worldbank.org/governance/wgi/index.
aspx#home (accessed: September 11, 2017).
Kindornay, Shannon, Andrew Sharpe, Purbita
Sengupta, Elham Sirag, Evan Capeluck. 2015.
Canada 2030: An agenda for sustainable de-
velopment. The Normal Paterson School of
International Affairs (NPSIA) and Centre for the
Study of Living Standards (CSLS).
Lim, Stephen S., et. al. 2016. “Measuring the health-re-
lated Sustainable Development Goals in 188
countries: a baseline analysis from the Global
Burden of Disease Study 2015.” The Lancet.
388(10053): 1813-1850.
Macdonald, David and Daniel Wilson. 2016. Shameful
Neglect: Indigenous child poverty in Canada.
Canadian Centre for Policy Alternatives. Ottawa,
Ontario: CCPA.
McArthur, John W. and Krista Rasmussen. 2016. “How
close to zero? Assessing the world’s extreme pov-
erty-related trajectories for 2030.” Global Views
No. 6. Washington, DC: The Brookings Institution.
———. 2017. “Change of pace: Accelerations and
advances during the Millennium Development
Goal era.” Brookings Global Economy and
Development Working Paper No. 98. Washington,
DC: The Brookings Institution.
Mulligan, Leah, Marsha Axford, and Andre Solecki.
2016. Homicide in Canada, 2015. Statistics
Canada catalogue no. 85-002-X.
National Household Survey (NHS). 2011. Commuting
to work. Statistics Canada catalogue no. 99-012-
2011003. Ottawa, Ontario: Statistics Canada.
Natural Resources Canada. 2016. “Volume har-
vested relative to the sustainable wood supply
(indicator)”. Ottawa, Ontario: Natural Resources
Canada. http://www.nrcan.gc.ca/forests/report/
harvesting/16550 (accessed: May 8, 2017).
Organisat ion for Economic Cooperat ion and
Development (OECD). 2016a. “An SDG-based
results framework for development co-operation.”
The Development Assistance Committee. Paris,
France: OECD Publishing.
———.. 2016b. PISA 2015 Results (Volume I):
Excellence and Equity in Education. Paris,
France: OECD Publishing.
———. 2017a. “Gender wage gap (indicator)”. Paris,
France: OECD. https://data.oecd.org/earnwage/
gender-wage-gap.htm (accessed: May 8, 2017).
———. 2017b. “Graduation rate (indicator)”. Paris,
France: OECD. https://data.oecd.org/eduatt/grad-
uation-rate.htm (accessed: May 8, 2017).
———. 2017c. “Mathematics and reading perfor-
mance, PISA (indicator)”. Paris, France: OECD.
https://data.oecd.org/pisa/mathematics-perfor-
mance-pisa.htm (accessed: September, 10 2017).
———. 2017d. Measuring distance to the SDG targets:
An assessment of where OECD countries stand.
Paris, France: OECD Publishing.
———. 2017e. “Nutrient balance (indicator)”. Paris,
France: OECD. https://data.oecd.org/agrland/nu-
trient-balance.htm (accessed: May 8, 2017).
———. 2017f. “OECD.Stat: Income Distribution and
Poverty”. Paris, France: OECD. https://stats.oecd.

40 GLOBAL ECONOMY AND DEVELOPMENT PROGRAM
org/Index.aspx?DataSetCode=IDD (accessed:
May 8, 2017).
———. 2017g. “Waste water treatment (indicator).
Paris, France: OECD. https://data.oecd.org/water/
waste-water-treatment.htm (accessed: May 8,
2017).
———. 2017h. “Youth not in employment, education
or training – NEET (indicator)”. Paris, France:
OECD. https://data.oecd.org/youthinac/youth-not-
in-employment-education-or-training-neet.htm
(accessed: May 8, 2017).
Prakash, Mihir, Katerina Teksoz, Jessica Espey, Jeffrey
Sachs, Michael Shank, and Guido Schmidt-Traub.
2017. The U.S. Cities Sustainable Development
Goals Index 2017, Achieving a Sustainable Urban
America. New York: Sustainable Development
Solutions Network (SDSN).
Parks Canada. 2017. “Tallurutiup Imanga/Lancaster
Sounds in High Arctic to be Canada’s largest
protected area.” https://www.canada.ca/en/
parks-canada/news/2017/08/tallurutiup_imanga-
lancastersoundinhigharctictobecanadaslargestpr.
html (accessed: September 8, 2017).
Public Safety Canada. 2017. “Canadian Disaster
Database”. Ottawa, Ontario: Public Safety
Canada. https://www.publicsafety.gc.ca/cnt/rsrcs/
cndn-dsstr-dtbs/index-en.aspx (accessed: June
2, 2017).
Roberts, Julian V. 2004. Public confidence in criminal
justice: A review of recent trends 2004-05. Report
for Public Safety and Emergency Preparedness
Canada. Ottawa, Ontario: Public Safety Canada.
Sachs, J., G. Schmidt-Traub, C. Kroll, D. Durand-
Delacre, and K. Teksoz. 2017. SDG Index and
Dashboards Report 2017. New York: Bertelsmann
Stiftung and Sustainable Development Solutions
Network (SDSN).
Statistics Canada (StatCan). 2010. Healthy people,
health places. Statistics Canada catalogue no.
82-229-X. Ottawa, Ontario: Statistics Canada.
http://www5.statcan.gc.ca/olc-cel/olc.action?ob-
jId=82-229-X&objType=2&lang=en&limit=0 (ac-
cessed: August 14, 2017).
———. 2012. “Household food insecurity in Canada
in 2007-2008: Key statistics and graphics.”
Analytical document using Canadian Community
Health Survey, 2007/2008. Ottawa, Ontario:
Statistics Canada.
———. 2013a. “Homeownership and shelter costs in
Canada.” Statistics Canada catalogue no. 99-014-
X2011002. Analytical document using National
Household Survey, 2011. Ottawa, Ontario:
Statistics Canada. http://www12.statcan.gc.ca/
nhs-enm/2011/as-sa/99-014-x/99-014-x2011002-
eng.cfm (accessed: May 8, 2017).
———. 2013b. Skills in Canada: First results from the
Programme for the International Assessment of
Adult Competencies (PIAAC). Statistics Canada
catalogue no. 89-555-X. Ottawa, Ontario:
Statistics Canada.
———. 2013c. “Table 105-0547 - Household food
insecurity, by age group and sex, Canada, prov-
inces, territories, health regions (2013 boundar-
ies) and peer groups, occasional (number unless
otherwise noted)”, CANSIM (database). Statistics
Canada, Canadian Community Health Survey

WHO AND WHAT GETS LEFT BEHIND? 41
(CCHS). Ottawa, Ontario. (accessed: May 8,
2017).
———. 2013d. “Table 105-1101 - Mental health profile,
by age group and sex, Canada and provinces,
occasional (number unless otherwise noted)”,
CANSIM (database). (accessed: May 8, 2017).
———. 2013e. Disability in Canada: Initial findings
from the Canadian Survey on disability. Statistics
Canada catalogue no. 89-654-X no. 002. Ottawa,
Ontario: Statistics Canada.
———. 2015a. “Table 577-0003 – Access to and use
of health care services, by Aboriginal identity, age
group, sex, and number of persons in household,
population aged 6 years and over, Canada, prov-
inces and territories, occasional”, CANSIM (data-
base). (accessed: May 8, 2017).
———. 2015b. “Table 577-0009 – Food security by
Aboriginal identity, age group, sex, and number
of persons in household, population aged 6 years
and over, Canada, provinces and territories, oc-
casional”, CANSIM (database). (accessed: May
8, 2017).
———. 2016a. “Table 051-0001 - Estimates of popu-
lation, by age group and sex for July 1, Canada,
provinces and territories, annual (person unless
otherwise noted)”, CANSIM (database). Ottawa,
Ontario. (accessed: May 8, 2017).
———. 2016b. “Table 051-0042 - Estimates of popula-
tion, by marital status or legal marital status, age
and sex for July 1, Canada, provinces and terri-
tories, annual (persons)”, CANSIM (database).
Ottawa, Ontario. (accessed: May 8, 2017).
———. 2016c. “Table 102-4313 – Mortality and poten-
tial years of life lost, by selected causes of death
and sex, three-year average, Canada, provinces,
territories, health regions and peer groups, occa-
sional (number unless otherwise noted)”, CANSIM
(database). (accessed: May 8, 2017).
———. 2016d. “Table 105-0502 – Health indicator pro-
file, two year period estimates, by age group and
sex, Canada, provinces, territories, health regions
(2013 boundaries) and peer groups”, CANSIM
(database). (accessed: May 8, 2017).
———. 2016e. “Table 153-0041 - Disposal of waste, by
source, Canada, provinces and territories, every
2 years (tonnes)”, CANSIM (database). Statistics
Canada, Environment, Energy and Transportation
Stat ist ics Divis ion. Ottawa, Ontar io. (ac-
cessed: May 8, 2017).
———. 2017a. “Table 053-0001 - Estimates of births,
deaths and marriages, Canada, provinces and ter-
ritories, quarterly (number)”, CANSIM (database).
Ottawa, Ontario. (accessed: May 8, 2017).
———. 2017b. “Table 102-0553 - Deaths and mortality
rate (age standardization using 2011 population),
by selected grouped causes and sex, Canada,
provinces and territories, annual”, CANSIM (data-
base). Statistics Canada, Canadian Vital Statistics,
Birth and Death Databases and Appendix II of the
publication “Mortality Summary List of Causes”
Catalogue no. 84F0209XIE. Ottawa, Ontario. (ac-
cessed: May 8, 2017).
———. 2017c. “Table 153-0148 - Households and the
environment survey, parks and green spaces,
Canada, provinces and census metropolitan ar-
eas (CMA), every 2 years (percent)”, CANSIM

42 GLOBAL ECONOMY AND DEVELOPMENT PROGRAM
(database). Statistics Canada, Environment,
Energy and Transportation Statistics Division.
Ottawa, Ontario. (accessed: May 8, 2017).
———. 2017d. “Table 206-0033 – Gini coefficients
of adjusted market, total and after-tax income,
Canada and provinces, annual”, CANSIM (da-
tabase). Statistics Canada, Income Statistics
Division. Ottawa, Ontario. (accessed: May 8, 2017).
———. 2017e. “Table 206-0041 - Low income statistics
by age, sex and economic family type, Canada,
provinces and selected census metropolitan areas
(CMAs), annual”, CANSIM (database). Statistics
Canada, Income Statistics Division. Ottawa,
Ontario. (accessed: May 8, 2017)
———. 2017f. “Table 252-0051 - Incident-based crime
statistics, by detailed violations, annual (number
unless otherwise noted)”, CANSIM (database).
Ottawa, Ontario. (accessed: May 8, 2017).
———. 2017g. “Table 282-0002 – Labour force sur-
vey estimates (LFS), by sex and detailed age
group, annual (person unless otherwise noted)”,
CANSIM (database). Ottawa, Ontario. (accessed:
May 8, 2017).
UNESCO Institute for Statistics. 2017. “Sustainable
Development Goal 4 Indicators: Adjusted net en-
rolment rate, one year before the official primary
entry age.” Montreal, Quebec: UNESCO Institute
for Statistics. http://uis.unesco.org/indicator/sdg4-
sdg_4-target4_2-target4_2_2 (accessed: May 8,
2017).
UNICEF Canada. 2016. UNICEF Report Card 13:
Canadian companion, fairness for children.
Toronto, Ontario: UNICEF Canada.
United States Energy Information Administration
(EIA). 2017. “International energy statistics: Total
electricity net generation.” Washington, DC: US
Department of Energy. https://www.eia.gov/beta/
international/data/browser/#/?pa=0000000000
0000000000000000000fvu&c=0000001&ct=0
&tl_id=2-A&vs=INTL.2-12-CAN-BKWH.A&cy=201
4&vo=0&v=H&start=2005&end=2015 (accessed:
September 11, 2017).
United Nations Statistics Division (UN-Stat). 2017.
“SDG Indicators Global Database.” New York:
United Nations Statistics Division. https://unstats.
un.org/sdgs/indicators/database/ (accessed: May
8, 2017).
USA Sustainable Cities Initiative. 2016. Baltimore’s
Sustainable Future: Localizing the UN Sustainable
Development Goals, strategies and indicators.
New York: Sustainable Development Solutions
Network (SDSN).
Vaillancourt, Roxan. 2010. Gender differences in
police-reported violent crime in Canada, 2008.
Canadian Centre for Justice Statistics. Statistics
Canada catalogue no. 85F0033M, no. 24.
WHO and UNICEF. 2017. Progress on drinking water,
sanitation and hygiene: 2017 update and SDG
baselines. Geneva: WHO and UNICEF.
World Bank. 2017. “World Development Indicators:
Annual freshwater withdrawals, total (% of internal
resources).” http://data.worldbank.org/indicator/
ER.H2O.FWTL.ZS (accessed: May 8, 2017).
World Data Lab. 2017. “World Poverty Clock.” http://
worldpoverty.io/ (accessed: September 1, 2017).

WHO AND WHAT GETS LEFT BEHIND? 43
Appendix 1: Classification of SDG outcome targets
A. 37 targets quantified and measurable as written
1.1 By 2030, eradicate extreme poverty for all people everywhere, currently measured as people living on less than $1.25 a day
1.2 By 2030, reduce at least by half the proportion of men, women and children of all ages living in poverty in all its dimensions according to national definitions
1.3 Implement nationally appropriate social protection systems and measures for all, including floors, and by 2030 achieve substantial coverage of the poor and the vulnerable
1.4 By 2030, ensure that all men and women, in particular the poor and the vulnerable, have equal rights to economic resources, as well as access to basic services, ownership and control over land and other forms of property, inheritance, natural resources, appropriate new technology and financial services, including microfinance
2.1 By 2030, end hunger and ensure access by all people, in particular the poor and people in vulnerable situations, including infants, to safe, nutritious and sufficient food all year round
2.2 By 2030, end all forms of malnutrition, including achieving, by 2025, the internationally agreed targets on stunting and wasting in children under 5 years of age, and address the nutritional needs of adolescent girls, pregnant and lactating women and older persons
2.3 By 2030, double the agricultural productivity and incomes of small-scale food producers, in particular women, indigenous peoples, family farmers, pastoralists and fishers, including through secure and equal access to land, other productive resources and inputs, knowledge, financial services, markets and opportunities for value addition and non-farm employment
3.1 By 2030, reduce the global maternal mortality ratio to less than 70 per 100,000 live births
3.2 By 2030, end preventable deaths of newborns and children under 5 years of age, with all countries aiming to reduce neonatal mortality to at least as low as 12 per 1,000 live births and under-5 mortality to at least as low as 25 per 1,000 live births
3.3 By 2030, end the epidemics of AIDS, tuberculosis, malaria and neglected tropical diseases and combat hepatitis, water-borne diseases and other communicable diseases
3.4 By 2030, reduce by one third premature mortality from non-communicable diseases through prevention and treatment and promote mental health and well-being
3.6 By 2020, halve the number of global deaths and injuries from road traffic accidents
3.7 By 2030, ensure universal access to sexual and reproductive health-care services, including for family planning, information and education, and the integration of reproductive health into national strategies and programmes
3.8 Achieve universal health coverage, including financial risk protection, access to quality essential health-care services and access to safe, effective, quality and affordable essential medicines and vaccines for all
4.1 By 2030, ensure that all girls and boys complete free, equitable and quality primary and secondary education leading to relevant and effective learning outcomes
4.2 By 2030, ensure that all girls and boys have access to quality early childhood development, care and pre-primary education so that they are ready for primary education
4.5 By 2030, eliminate gender disparities in education and ensure equal access to all levels of education and vocational training for the vulnerable, including persons with disabilities, indigenous peoples and children in vulnerable situations
4.6 By 2030, ensure that all youth and a substantial proportion of adults, both men and women, achieve literacy and numeracy
5.1 End all forms of discrimination against all women and girls everywhere
APPENDIX 1: CLASSIFICATION OF SDG OUTCOME TARGETS

44 GLOBAL ECONOMY AND DEVELOPMENT PROGRAM
A. 37 targets quantified and measurable as written (cont.)
5.2 Eliminate all forms of violence against all women and girls in the public and private spheres, including trafficking and sexual and other types of exploitation
5.3 Eliminate all harmful practices, such as child, early and forced marriage and female genital mutilation
5.6 Ensure universal access to sexual and reproductive health and reproductive rights as agreed in accordance with the Programme of Action of the International Conference on Population and Development and the Beijing Platform for Action and the outcome documents of their review conferences
6.1 By 2030, achieve universal and equitable access to safe and affordable drinking water for all
6.2 By 2030, achieve access to adequate and equitable sanitation and hygiene for all and end open defecation, paying special attention to the needs of women and girls and those in vulnerable situations
6.3 By 2030, improve water quality by reducing pollution, eliminating dumping and minimizing release of hazardous chemicals and materials, halving the proportion of untreated wastewater and substantially increasing recycling and safe reuse globally
7.1 By 2030, ensure universal access to affordable, reliable and modern energy services
7.3 By 2030, double the global rate of improvement in energy efficiency
8.7 Take immediate and effective measures to eradicate forced labour, end modern slavery and human trafficking and secure the prohibition and elimination of the worst forms of child labour, including recruitment and use of child soldiers, and by 2025 end child labour in all its forms
10.1 By 2030, progressively achieve and sustain income growth of the bottom 40 per cent of the population at a rate higher than the national average
11.1 By 2030, ensure access for all to adequate, safe and affordable housing and basic services and upgrade slums
12.3 By 2030, halve per capita global food waste at the retail and consumer levels and reduce food losses along production and supply chains, including post-harvest losses
14.1 By 2025, prevent and significantly reduce marine pollution of all kinds, in particular from land-based activities, including marine debris and nutrient pollution
14.4 By 2020, effectively regulate harvesting and end overfishing, illegal, unreported and unregulated fishing and destructive fishing practices and implement science-based management plans, in order to restore fish stocks in the shortest time feasible, at least to levels that can produce maximum sustainable yield as determined by their biological characteristics
14.5 By 2020, conserve at least 10 per cent of coastal and marine areas, consistent with national and international law and based on the best available scientific information
15.7 Take urgent action to end poaching and trafficking of protected species of flora and fauna and address both demand and supply of illegal wildlife products
16.2 End abuse, exploitation, trafficking and all forms of violence against and torture of children
16.9 By 2030, provide legal identity for all, including birth registration

WHO AND WHAT GETS LEFT BEHIND? 45
B. 41 targets assessable through proxy benchmarks, including national targets
1.5 By 2030, build the resilience of the poor and those in vulnerable situations and reduce their exposure and vulnerability to climate-related extreme events and other economic, social and environmental shocks and disasters
2.4 By 2030, ensure sustainable food production systems and implement resilient agricultural practices that increase productivity and production, that help maintain ecosystems, that strengthen capacity for adaptation to climate change, extreme weather, drought, flooding and other disasters and that progressively improve land and soil quality
2.5 By 2020, maintain the genetic diversity of seeds, cultivated plants and farmed and domesticated animals and their related wild species, including through soundly managed and diversified seed and plant banks at the national, regional and international levels, and promote access to and fair and equitable sharing of benefits arising from the utilization of genetic resources and associated traditional knowledge, as internationally agreed
3.5 Strengthen the prevention and treatment of substance abuse, including narcotic drug abuse and harmful use of alcohol
3.9 By 2030, substantially reduce the number of deaths and illnesses from hazardous chemicals and air, water and soil pollution and contamination
4.3 By 2030, ensure equal access for all women and men to affordable and quality technical, vocational and tertiary education, including university
4.4 By 2030, substantially increase the number of youth and adults who have relevant skills, including technical and vocational skills, for employment, decent jobs and entrepreneurship
5.4 Recognize and value unpaid care and domestic work through the provision of public services, infrastructure and social protection policies and the promotion of shared responsibility within the household and the family as nationally appropriate
5.5 Ensure women’s full and effective participation and equal opportunities for leadership at all levels of decision-making in political, economic and public life
6.4 By 2030, substantially increase water-use efficiency across all sectors and ensure sustainable withdrawals and supply of freshwater to address water scarcity and substantially reduce the number of people suffering from water scarcity
6.6 By 2020, protect and restore water-related ecosystems, including mountains, forests, wetlands, rivers, aquifers and lakes
7.2 By 2030, increase substantially the share of renewable energy in the global energy mix
8.3 Promote development-oriented policies that support productive activities, decent job creation, entrepreneurship, creativity and innovation, and encourage the formalization and growth of micro-, small- and medium-sized enterprises, including through access to financial services
8.4 Improve progressively, through 2030, global resource efficiency in consumption and production and endeavour to decouple economic growth from environmental degradation, in accordance with the 10-Year Framework of Programmes on Sustainable Consumption and Production, with developed countries taking the lead
8.6 By 2020, substantially reduce the proportion of youth not in employment, education or training
8.8 Protect labour rights and promote safe and secure working environments for all workers, including migrant workers, in particular women migrants, and those in precarious employment
8.10 Strengthen the capacity of domestic financial institutions to encourage and expand access to banking, insurance and financial services for all
9.4 By 2030, upgrade infrastructure and retrofit industries to make them sustainable, with increased resource-use efficiency and greater adoption of clean and environmentally sound technologies and industrial processes, with all countries taking action in accordance with their respective capabilities
9.5 Enhance scientific research, upgrade the technological capabilities of industrial sectors in all countries, in particular developing countries, including, by 2030, encouraging innovation and substantially increasing the number of research and development workers per 1 million people and public and private research and development spending

46 GLOBAL ECONOMY AND DEVELOPMENT PROGRAM
B. 41 targets assessable through proxy benchmarks, including national targets (cont.)
10.3 Ensure equal opportunity and reduce inequalities of outcome, including by eliminating discriminatory laws, policies and practices and promoting appropriate legislation, policies and action in this regard
10.4 Adopt policies, especially fiscal, wage and social protection policies, and progressively achieve greater equality
11.2 By 2030, provide access to safe, affordable, accessible and sustainable transport systems for all, improving road safety, notably by expanding public transport, with special attention to the needs of those in vulnerable situations, women, children, persons with disabilities and older persons
11.5 By 2030, significantly reduce the number of deaths and the number of people affected and substantially decrease the direct economic losses relative to global gross domestic product caused by disasters, including water-related disasters, with a focus on protecting the poor and people in vulnerable situations
11.6 By 2030, reduce the adverse per capita environmental impact of cities, including by paying special attention to air quality and municipal and other waste management
11.7 By 2030, provide universal access to safe, inclusive and accessible, green and public spaces, in particular for women and children, older persons and persons with disabilities
12.4 By 2020, achieve the environmentally sound management of chemicals and all wastes throughout their life cycle, in accordance with agreed international frameworks, and significantly reduce their release to air, water and soil in order to minimize their adverse impacts on human health and the environment
12.5 By 2030, substantially reduce waste generation through prevention, reduction, recycling and reuse
13.2 Integrate climate change measures into national policies, strategies and planning
14.3 Minimize and address the impacts of ocean acidification, including through enhanced scientific cooperation at all levels
15.1 By 2020, ensure the conservation, restoration and sustainable use of terrestrial and inland freshwater ecosystems and their services, in particular forests, wetlands, mountains and drylands, in line with obligations under international agreements
15.2 By 2020, promote the implementation of sustainable management of all types of forests, halt deforestation, restore degraded forests and substantially increase afforestation and reforestation globally
15.3 By 2030, combat desertification, restore degraded land and soil, including land affected by desertification, drought and floods, and strive to achieve a land degradation-neutral world
15.4 By 2030, ensure the conservation of mountain ecosystems, including their biodiversity, in order to enhance their capacity to provide benefits that are essential for sustainable development
15.5 Take urgent and significant action to reduce the degradation of natural habitats, halt the loss of biodiversity and, by 2020, protect and prevent the extinction of threatened species
16.1 Significantly reduce all forms of violence and related death rates everywhere
16.3 Promote the rule of law at the national and international levels and ensure equal access to justice for all
16.4 By 2030, significantly reduce illicit financial and arms flows, strengthen the recovery and return of stolen assets and combat all forms of organized crime
16.5 Substantially reduce corruption and bribery in all their forms
16.6 Develop effective, accountable and transparent institutions at all levels
16.7 Ensure responsive, inclusive, participatory and representative decision-making at all levels
16.10 Ensure public access to information and protect fundamental freedoms, in accordance with national legislation and international agreements

WHO AND WHAT GETS LEFT BEHIND? 47
C. 29 targets not assessed: either not outcome-focused at country level or proxy cannot be established
4.7 By 2030, ensure that all learners acquire the knowledge and skills needed to promote sustainable development, including, among others, through education for sustainable development and sustainable lifestyles, human rights, gender equality, promotion of a culture of peace and non-violence, global citizenship and appreciation of cultural diversity and of culture’s contribution to sustainable development
6.5 By 2030, implement integrated water resources management at all levels, including through transboundary cooperation as appropriate
8.1 Sustain per capita economic growth in accordance with national circumstances and, in particular, at least 7 per cent gross domestic product growth per annum in the least developed countries
8.2 Achieve higher levels of economic productivity through diversification, technological upgrading and innovation, including through a focus on high-value added and labour-intensive sectors
8.5 By 2030, achieve full and productive employment and decent work for all women and men, including for young people and persons with disabilities, and equal pay for work of equal value
8.9 By 2030, devise and implement policies to promote sustainable tourism that creates jobs and promotes local culture and products
9.1 Develop quality, reliable, sustainable and resilient infrastructure, including regional and trans-border infrastructure, to support economic development and human well-being, with a focus on affordable and equitable access for all
9.2 Promote inclusive and sustainable industrialization and, by 2030, significantly raise industry’s share of employment and gross domestic product, in line with national circumstances, and double its share in least developed countries
9.3 Increase the access of small-scale industrial and other enterprises, in particular in developing countries, to financial services, including affordable credit, and their integration into value chains and markets
10.2 By 2030, empower and promote the social, economic and political inclusion of all, irrespective of age, sex, disability, race, ethnicity, origin, religion or economic or other status
10.5 Improve the regulation and monitoring of global financial markets and institutions and strengthen the implementation of such regulations
10.6 Ensure enhanced representation and voice for developing countries in decision-making in global international economic and financial institutions in order to deliver more effective, credible, accountable and legitimate institutions
10.7 Facilitate orderly, safe, regular and responsible migration and mobility of people, including through the implementation of planned and well-managed migration policies
11.3 By 2030, enhance inclusive and sustainable urbanization and capacity for participatory, integrated and sustainable human settlement planning and management in all countries
11.4 Strengthen efforts to protect and safeguard the world’s cultural and natural heritage
12.1 Implement the 10-Year Framework of Programmes on Sustainable Consumption and Production Patterns, all countries taking action, with developed countries taking the lead, taking into account the development and capabilities of developing countries
12.2 By 2030, achieve the sustainable management and efficient use of natural resources
12.6 Encourage companies, especially large and transnational companies, to adopt sustainable practices and to integrate sustainability information into their reporting cycle
12.7 Promote public procurement practices that are sustainable, in accordance with national policies and priorities
12.8 By 2030, ensure that people everywhere have the relevant information and awareness for sustainable development and lifestyles in harmony with nature
13.1 Strengthen resilience and adaptive capacity to climate-related hazards and natural disasters in all countries
13.3 Improve education, awareness-raising and human and institutional capacity on climate change mitigation, adaptation, impact reduction and early warning

48 GLOBAL ECONOMY AND DEVELOPMENT PROGRAM
C. 29 targets not assessed: either not outcome-focused at country level or proxy cannot be established (cont.)
14.2 By 2020, sustainably manage and protect marine and coastal ecosystems to avoid significant adverse impacts, including by strengthening their resilience, and take action for their restoration in order to achieve healthy and productive oceans
14.6 By 2020, prohibit certain forms of fisheries subsidies which contribute to overcapacity and overfishing, eliminate subsidies that contribute to illegal, unreported and unregulated fishing and refrain from introducing new such subsidies, recognizing that appropriate and effective special and differential treatment for developing and least developed countries should be an integral part of the World Trade Organization fisheries subsidies negotiation
14.7 By 2030, increase the economic benefits to small island developing States and least developed countries from the sustainable use of marine resources, including through sustainable management of fisheries, aquaculture and tourism
15.6 Promote fair and equitable sharing of the benefits arising from the utilization of genetic resources and promote appropriate access to such resources, as internationally agreed
15.8 By 2020, introduce measures to prevent the introduction and significantly reduce the impact of invasive alien species on land and water ecosystems and control or eradicate the priority species
15.9 By 2020, integrate ecosystem and biodiversity values into national and local planning, development processes, poverty reduction strategies and accounts
16.8 Broaden and strengthen the participation of developing countries in the institutions of global governance

W
HO
AN
D W
HA
T G
ET
S LE
FT
BE
HIN
D?
49
Appendix 2: Trajectory assessment for Canada on domestic SDG targets
Indicator Value Year Value YearCurrent
trajectory Target
Implied share of distance to target covered Category Notes
1.1 End extreme poverty Poverty headcount ratio at $1.90 a day (2011 PPP) 0% 2015 0% 100% On track
Low income cut-offs after tax, 1992 base 10.8% 2005 9.2% 2015 6.8% 4.6% 52% Acceleration needed
Low income share - market basket measure, 2011 base 12.3% 2005 12.1% 2015 11.8% 6.1% 5% Breakthrough needed
1.3 Implement social protection for allProportion of poor population covered by social protection floors/systems
100% 2016 100% On track
1.5 Build resiliency of poor to climate-events Mortality rate from disasters, per 100,000 0.003 2006 0.000 2016 0 0 100% On track Proxy target
2.1 End hunger/food insecurity Moderate + Severe food insecurity 7.1% 2008 7.8% 2012 11.0% 0% -ve Moving backwards
2.2 End malnutrition Children overweight, aged 2-4 (%) 38.4% 2000 42.3% 2015 46.2% 0% -ve Moving backwards
2.4 Ensure sustainable food production systemsNutrient balance - nitrogen, kg/ha (positive indicates risk of polluting, negative indicates declining soil fertility)
23.6 2004 29.8 2014 39.7 0 -ve Moving backwards Proxy target
3.1 Maternal mortality < 70 per 100,000 births Maternal mortality ratio per 100,000 live births 9 2005 7 2015 5 70 100% On track
3.2Child and newborn mortality (< 25 & < 12 per 1,000 births)
Neonatal mortality rate per 1,000 live births 4 2005 3 2015 2 12 100% On track
3.3 End AIDS/TB/Malaria epidemics TB incidence per 100,000 5.7 2004 5.2 2014 4.5 1.0 17% Breakthrough needed Interpret "end epidemic" as incidence of 1 per 100,000
Mortality rate attributed to cardiovascular disease, cancer, diabetes or chronic respiratory disease (aged 30-70, per 100,000)
297 2000 224 2015 169 148 72% Acceleration needed
Cancer, malignant neoplasms, age-standardized mortality rate per 100,000
238 2003 206 2013 161 136 64% Acceleration needed
Major cardiovascular disease, age-standardized mortality rate per 100,000
275 2003 184 2013 93 121 100% On track
Suicide mortality rate per 100,000 12.1 2000 11.4 2012 10.5 7.5 23% Breakthrough needed
3.5Strengthen prevention/treatment of substance abuse
Alcohol per capita consumption within year (liters of pure alcohol)
9.8 2005 10.3 2015 11.1 5.2 -ve Moving backwards Proxy target
3.6 Halve traffic deaths by 2020 Death rate due to road injuries per 100,000 9.1 2003 6.0 2013 4.53.0
(2020)51% Acceleration needed
3.7 Universal access to sexual & reproductive services Women with family planning needs satisfied 91.8% 2000 95.2% 2015 98.6% 100% 70% Acceleration needed
3.8 Universal health coverage (UHC) Coverage of 7 UHC tracer interventions (%) 84.7% 2000 91.5% 2015 98.4% 100% 81% Acceleration needed
3.9 Reduce deaths due to pollution & chemicalsMortality rate from household/ambient air pollution (per 100,000)
19.7 2000 12.9 2015 8.5 6.5 69% Acceleration needed Proxy target
4.1 Ensure all complete primary/secondary education Upper-secondary graduation rate 80% 2005 89% 2013 100% 100% 100% On track
4.2 Universal access to early childhood educationAdjusted net enrolment rate, one year before official primary entry age
86% 2000 97% 2013 100% 100% 100% On track
Gender differences in mean reading PISA scores -32 2006 -26 2015 -16 0 38% Breakthrough needed Boys trail
Gender differences in mean math PISA scores 14 2006 9 2015 1 0 93% On track
Girls trail. 2030 value within measurement error (Canada nat. avg. 527 in 2015)
Initial year Most recent year 2030
SDG target (simplified language)
3.4Reduce premature mortality from non-communicable diseases (NCDs) by 1/3
4.5 Eliminate gender disparities in education
1.2 Reduce national poverty by 50%
APPENDIX 2: TRAJECTORY ASSESSMENT FOR CANADA ON DOMESTIC SDG TARGETS

50 G
LOB
AL E
CO
NO
MY
AN
D D
EV
ELO
PM
EN
T P
RO
GR
AM
Appendix 2 (cont.)
Indicator Value Year Value YearCurrent
trajectory Target
Implied share of distance to target covered Category Notes
Initial year Most recent year 2030
SDG target (simplified language)
Literacy: 2+ on PISA in 15-year olds 89.7% 2009 89.3% 2015 88.3% 100% -ve Moving backwards
Numeracy: 2+ on PISA in 15-year olds 89.2% 2006 85.6% 2015 79.6% 100% -ve Moving backwards
5.1 End discrimination against all women/girls Gender wage gap in full-time employees 21.3 2005 18.6 2015 14.7 0 21% Breakthrough needed
Women experiencing intimate partner violence 16.9% 2000 16.4% 2015 16.0% 0 3% Breakthrough needed
Police-reported victims of violent crime, females per 100,000 population
1155 2008 1207 2011 1536 0 -ve Moving backwards
5.3Eliminate harmful practices such as child, early and forced marriage and female genital mutilation
Share of 15-17 year old females who are married 0.041% 2005 0.036% 2015 0.027% 0 21% Breakthrough needed
5.4Recognize and value unpaid care and domestic work
Disparity in hours spent on unpaid domestic work by gender (female - male)
5.8 2005 5.8 2010 5.8 0 0% Breakthrough needed Proxy target
5.5 Ensure women's full participation in leadership % seats held by women in national parliaments 21% 2006 26% 2016 33% 50% 31% Breakthrough needed Proxy target
6.1 Universal access to safe drinking water Access to improved water 99.4% 2000 98.4% 2015 97.4% 100% -ve Moving backwards
6.2Access to adequate and equitable sanitation for all
Access to sanitation facilities 99.8% 2005 99.8% 2015 99.9% 100% 17% Breakthrough needed
Waste water treatment (%) 87% 2004 84% 2009 72% 92% -ve Moving backwards
% freshwater sites rated good or excellent 34% 2004 40% 2011 56% 70% 54% Acceleration needed Proxy target
6.4 Increase water-use efficiencyAnnual freshwater withdrawals, total (% of internal resources)
1.45% 2007 1.36% 2014 1.16% 0.68% 30% Breakthrough needed Proxy target
7.1 Universal access to modern energy services Access to electricity 100% 2000 100% 2012 100% 100% 100% On track
Renewable electricity consumption (% of total final consumption)
21.2% 2007 20.6% 2012 18.4% 60% -ve Moving backwards Proxy target
Electricity generated from renewable and non-emitting sources
75% 2005 80% 2014 89% 90% 89% Acceleration needed Canadian national target
7.3Double global rate of improvement in energy efficiency
Energy intensity level of primary energy (megajoules per USD constant 2011 PPP GDP)
8.2 2007 7.3 2012 4.1 0.9 50% Breakthrough needed
8.4Improve resource efficiency in consumption & production; decouple economic growth from environmental degradation
Domestic material consumption (kg) per unit of GDP 0.70 2005 0.62 2010 0.38 0.31 77% Acceleration needed Proxy target
8.6Reduce share of youth not in employment, education, or training by 2020
Youth population not in education or employed (15-29)
12.7%2003-05
avg.13.0%
2013-15avg.
13.2%6.5%
(2020)0% Breakthrough needed
Proxy target. Remains stagnant amid year-to-year volatility
8.8Protect labor rights, promote safe working environments
All-cause DALY rate attributable to occupational risks per 100,000
499 2000 473 2015 447 236 11% Breakthrough needed Proxy target
8.10Strengthen capacity of domestic financial institutions to expand access to banking for all
Share of adults with account at bank, financial institution, or mobile money
97.7% 2011 99.6% 2014 100% 100% 100% On track Proxy target
9.4Upgrade infrastructure & retrofit industry to make sustainable
Emissions of CO2 per unit of GDP PPP 0.42 2005 0.37 2014 0.30 0.19 39% Breakthrough needed
Proxy/National target. Assume: 1) GDP growth trajectory of 2005-2014 continues to 2030; 2) Canada reduces CO2 emissions by 30% compared to 2005
Increase share of renewable energy
4.6 Achieve literacy and numeracy
5.2 Eliminate violence against women/girls
6.3Improve water quality and halve untreated wastewater
7.2

W
HO
AN
D W
HA
T G
ET
S LE
FT
BE
HIN
D?
51
Appendix 2 (cont.)
Indicator Value Year Value YearCurrent
trajectory Target
Implied share of distance to target covered Category Notes
Initial year Most recent year 2030
SDG target (simplified language)
R&D expenditures as share of GDP 2.0% 2004 1.6% 2014 1.0% 2.4% -ve Moving backwards Proxy target set for 50% increase in R&D
Researchers (in full-time equivalent) per million inhabitants
3900 2003 4519 2013 5571 6779 47% Breakthrough needed Proxy target set for 50% more researchers
Palma Ratio - share of income received by 10% with the highest disposable income divided by share received by the 40% with the lowest
1.19 2006 1.21 2013 1.26 -ve Moving backwards
Growth rates of household expenditure or income per capita among the bottom 40 per cent of the population
2.14 2010Average annual growth rate from 2004-2010
Growth rates of household expenditure or income per capita
1.93 2010Average annual growth rate from 2004-2010
10.4 Progressively achieve greater equality Gini coefficient, adjusted after-tax income 0.317 2005 0.314 2015 0.310 0.299 30% Breakthrough needed Proxy target
11.1Access to adequate, safe & affordable housing for all
% Households spending 30%+ of income on shelter 24.8% 2006 25.2% 2011 26.7% 0 -ve Moving backwards
11.5 Decrease deaths & economic loss from disastersEstimated total cost from natural disasters as share of GDP LCU
0.02%2003-05
avg.0.10%
2013-15avg.
0.21% 0.05% -ve Moving backwards Proxy target
11.6Reduce adverse per capita environmental impact of cities
PM2.5 annual average concentration 6.5 2004 7.7 2014 9.6 <10.0 100% On track
Proxy target. Maintain levels below Canada's national standard for safe levels
11.7Universal access to safe, inclusive green and public spaces
% had park or green space < 10 minutes from home 86% 2011 85% 2013 77% 100% -ve Moving backwards Proxy target
12.3 Halve per capita food wasteFood waste - difference between food produced and consumed
40% 2010 20% Breakthrough needed No evidence identified of rapid decline
Solid waste not diverted rate (all sources) 78% 2002 75% 2012 68% 37% 17% Breakthrough needed Proxy target
Solid waste per capita (kg) 790 2004 706 2014 572 353 38% Breakthrough needed Proxy target
13.2Integrate climate change measures into nat. policy
GHG emissions total (Mt) 738 2005 722 2015 676 523 23% Breakthrough needed Canadian national target
Volume of spills detected (litres) 8110 2010 4453 2014 00
(2025)100% On track
Extrapolates two data points in highly variable annual data
Number of spills detected 109 2010 214 2014 5030
(2025)-ve Moving backwards
Extrapolates two data points in highly variable annual data
14.4 Regulate harvesting & end overfishing by 2020 % Major fish stocks harvested above approved levels 10.3% 2011 4.4% 2015 0%0%
(2020)100% On track
14.5Conserve at least 10% of coastal and marine areas by 2020
Share of marine area protected 0.9% 2015 3.4% 2017 7.2%10%
(2020)69% Acceleration needed
Trajectory calculated using 2015-2017 rate to capture recent policy commitments. 2015 used as baseline for share of distance covered.
15.1Ensure conservation of terrestrial and inland ecosystems by 2020
Share of terrestrial area protected 8.4% 2005 10.6% 2015 11.7%17%
(2020)17% Breakthrough needed Canadian national target
15.2 Sustainably manage forests by 2020Volume wood harvested relative to sustainable wood supply
83% 2004 65% 2014 54%<100% (2020)
100% On track Canadian national target
15.4 Ensure conservation of mountain ecosystemsCoverage by protected areas of important sites for mountain biodiversity
12% 2005 12% 2016 12% 100% 0% Breakthrough needed Proxy target
14.1 Prevent and reduce marine pollution by 2025
9.5Enhance scientific research & increase no. of R&D workers & public-private R&D spending
10.1Achieve and sustain income growth of bottom 40% higher than nat. avg.
12.5Reduce waste generation through prevention, reduction, recycling

52 G
LOB
AL E
CO
NO
MY
AN
D D
EV
ELO
PM
EN
T P
RO
GR
AM
Appendix 2 (cont.)
Indicator Value Year Value YearCurrent
trajectory Target
Implied share of distance to target covered Category Notes
Initial year Most recent year 2030
SDG target (simplified language)
15.5Reduce degradation of national habitats, halt loss of biodiversity, protect threatened species by 2020
Population trends of species at risk showing trends of recovery
35% 2016100% (2020)
Breakthrough needed
Canadian national target. More species doing worse than better compared to 10 yrs. prior
16.1 Reduce all forms of violence and related deaths Rate of homicide per 100,000 population 2.1 2005 1.7 2015 1.1 0.8 68% Acceleration needed Proxy target
16.2End abuse, exploitation, trafficking, and violence against children
Rate of sexual violations against children per 100,000 population (police reported)
10.8 2010 12.6 2015 18.1 0 -ve Moving backwards
16.3Promote rule of law, ensure access to justice for all
Unsentenced detainees as share of overall prison population
29% 2005 35% 2014 46% 18% -ve Moving backwards Proxy target
16.5 Reduce corruption & bribery Control of corruption 1.86 2005 1.85 2015 1.84 2.18 0% Breakthrough needed Proxy target. Remains stagnant amid year-to-year variance
16.6Develop effective, accountable, and transparent institutions at all levels
Confidence in institutions - Justice system and courts (great deal or some)
57% 2003 57% 2013 57% 79% 0% Breakthrough needed
Proxy target. Slight difference in GSS survey question: 2003 asks "a great deal" or "quite a lot" of confidence in "justice system"; 2013 asks "a great deal or some confidence" in "justice system and courts"
16.9 Provide legal identity for all Proportion of births registered with a civil authority 100% 2015 100% 100% 100% On track
16.10Ensure public access to information & protect fundamental freedoms
Number of cases of killing, kidnapping, enforced disappearance, arbitrary detention and torture of journalists, associated media personnel, trade unionists and human rights advocates in last 12 months
0 2010 0 2015 0 0 100% On track Proxy target
TOTAL INDICATORS: On track 17Acceleration needed 12
Breakthrough needed 26Moving backwards 18

The views expressed in this working paper do not necessarily
reflect the official position of Brookings, its board or the advisory
council members.

1775 Massachusetts Avenue, NW Washington, DC 20036 202-797-6000 www.brookings.edu/global