
WHITE PAPER - Xena Networks · WHITE PAPER “Latency and jitter are classic benchmarking...
17
WHITE PAPER Xena Networks – Global Price/Performance Leaders in Gigabit Ethernet Testing – www.xenanetworks.com WHITE PAPER “Latency and jitter are classic benchmarking indicators for administrators when evaluating network performance.” OVERVIEW Latency and jitter are two key measurement parameters when evaluating and benchmarking the performance of a network, system or device. Different applications have different requirements on traffic latency and jitter. For example, voice over IP (VoIP) services are sensitive to latency and jitter, while data transfer is more tolerant to delay and jitter. As key metrics of Quality of Service (QoS) validation, latency and jitter are often considered the basic benchmarking indicators by network administrators, operators, and engineers. However, for benchmarking different network devices, the definition of latency and jitter can vary according to the RFC standard. This White Paper clarifies the terms used in time measurement, e.g. latency, jitter, inter-frame gap, latency resolution, speed mismatch, latency over time, and distribution. It also presents how Xena interprets and implements time measurements and how to test latency. (Users can also find detailed guidelines and examples of time measurement using Xena test equipment in the application note “Measuring Frame Delay Variation”.) Latency & Jitter In Networking Performance Evaluation
Transcript of WHITE PAPER - Xena Networks · WHITE PAPER “Latency and jitter are classic benchmarking...

WH
ITE
PAPE
R
Xena Networks – Global Price/Performance Leaders in Gigabit Ethernet Testing – www.xenanetworks.com
WHITE PAPER
“Latency and jitter
are classic
benchmarking
indicators for
administrators when
evaluating network
performance.”
OVERVIEW
Latency and jitter are two key measurement parameters when evaluating and benchmarking the performance of a network, system or device. Different applications have different requirements on traffic latency and jitter. For example, voice over IP (VoIP) services are sensitive to latency and jitter, while data transfer is more tolerant to delay and jitter. As key metrics of Quality of Service (QoS) validation, latency and jitter are often considered the basic benchmarking indicators by network administrators, operators, and engineers. However, for benchmarking different network devices, the definition of latency and jitter can vary according to the RFC standard.
This White Paper clarifies the terms used in time measurement, e.g. latency, jitter, inter-frame gap, latency resolution, speed mismatch, latency over time, and distribution. It also presents how Xena interprets and implements time measurements and how to test latency. (Users can also find detailed guidelines and examples of time measurement using Xena test equipment in the application note “Measuring Frame Delay Variation”.)
Latency & Jitter In Networking Performance Evaluation

WH
ITE
PAPE
R
Xena Networks – Global Price/Performance Leaders in Gigabit Ethernet Testing – www.xenanetworks.com
Latency and Jitter in Networking Performance Evaluation
Contents
OVERVIEW ........................................................................................................................................ 1
Introduction.................................................................................................................................. 3
Latency ......................................................................................................................................... 3
Last-to-First Latency Measurement for Store-and-Forward Devices ....................................... 3
First-to-First Latency Measurement for Cut-Through Devices ................................................ 4
Last-to-Last Latency Measurement for Layer 3 Packet ............................................................ 5
First-to-Last Latency Measurement of Frame Insertion Time ................................................. 6
Jitter ............................................................................................................................................. 7
Xena Jitter Measurement......................................................................................................... 8
MEF 10 Compliance ................................................................................................................. 8
IFG Histogram and Jitter Analysis ............................................................................................ 9
Latency and Jitter Over Time ...................................................................................................... 10
Latency and Jitter Distribution and Histograms ......................................................................... 12
Latency Measurement Resolution ............................................................................................. 13
Speed Mismatch ......................................................................................................................... 13
Accurate Latency Measurement ................................................................................................ 13
Conclusion ...................................................................................................................................... 17

WH
ITE
PAPE
R
Xena Networks – Global Price/Performance Leaders in Gigabit Ethernet Testing – www.xenanetworks.com
Introduction What are Latency and Jitter?
Latency and jitter are two key measurement parameters when evaluating and benchmarking the performance of a network, system or device. Different applications have different requirements on traffic latency and jitter. For example, voice over IP (VoIP) services are sensitive to latency and jitter, while data transfer is more tolerant to delay and jitter. As key metrics of Quality of Service (QoS) validation, latency and jitter are often considered the basic benchmarking indicators by network administrators, operators, and engineers. However, for benchmarking different network devices, the definition of latency and jitter can vary according to the RFC standard. Thus, it is important to clarify the terms first and then carry on the in-depth understanding of how latency and jitter affect network performances.
Latency Some applications are sensitive to network latency, e.g. VoIP and videoconferencing. When measuring latency, one should eliminate the effect of the data rate. The measurement should only reflect the actual latency within the device. In order to generate accuracy, measurements should be taken for a range of packet sizes without changing the device configuration. RFC 1242 (Benchmarking Terminology for Network Interconnection Devices) provides two different definitions of latency depending on the type of the device under test (DUT) or system under test (SUT), store-and-forward device or cut-through device.
The following sections will describe two methods of measuring latencies based on RFC 1242 for different types of devices, which are:
• Last-to-First for store-and-forward devices (e.g. common switches)
• First-to-First for cut-through devices (e.g. cut-through switches)
and one method from RFC 4689:
• Last-to-Last for Layer 3 devices (e.g. routers)
and one method commonly used for tester verification:
• First-to-Last for tester verification
Last-to-First Latency Measurement for Store-and-Forward Devices
Store-and-forward devices, as the name indicates, first cache the entire packet from the input port and then process and forward it to the correct output port based decisions. This kind of device is common to see in the network, e.g. a router, and common switches. For store-and-forward devices, latency is defined as the time interval starting when the last bit of the input frame reaches the input port and ending when the first bit of the output frame is seen on the

WH
ITE
PAPE
R
Xena Networks – Global Price/Performance Leaders in Gigabit Ethernet Testing – www.xenanetworks.com
output port. In other words, the store-and-forward latency is a last-to-first (LTF) also known as last-in, first-out (LIFO) measurement as shown in Figure 1, because the timer starts when the DUT has received the last bit of the packet and stops when the DUT begins to transmit the packet.
First-to-First Latency Measurement for Cut-Through Devices
Cut-through devices, in contrast to store-and-forward devices, begins to transmit a packet before it is fully received. These devices are known as “cut-through” devices, e.g. a cut-through switch. For such cut-through devices, latency is defined as the time interval starting when the end of the first bit of the input frame reaches the input port and ending when the start of the first bit of the output frame is seen on the output port. In other words, cut-through latency is a first-to-first (FTF) measurement, also known as first-in, first-out (FIFO), as shown in Figure 2, where both the starting and ending measurement points are at the beginning of the packet on the ingress and egress sides of the DUT.
packet packet
DUT/SUTingress egress
t0 t1
Figure 1. Last-to-First (LTF) Latency for Store-and-Forward devices
packet packet
DUT/SUTingress egress
t0 t1
Figure 2. First-to-First (FTF) Latency for Cut-through devices

WH
ITE
PAPE
R
Xena Networks – Global Price/Performance Leaders in Gigabit Ethernet Testing – www.xenanetworks.com
Regardless of which latency definition is used in practice, it is recommended in RFC 2544 (Benchmarking Methodology for Network Interconnect Devices) that latency be measured at the throughput rate.
Last-to-Last Latency Measurement for Layer 3 Packet
In addition to the two latency measurement definition above, RFC 4689 (Terminology for Benchmarking Network-layer Traffic Control Mechanisms) defines a last-to-last (LTL) measurement, also known as last-in, last-out (LILO), which is called forwarding delay, instead of latency. Forwarding delay is defined as the time interval starting when the last bit of the input IP packet is offered to the input port of the DUT/SUT and ending when the last bit of the output IP packet is received from the output port of the DUT/SUT.
As shown in Figure 3, the forwarding delay is the time interval between two instants of time, the moment the packet is fully received and the moment the packet is completely transmitted. The LTL method closely simulates the way a network-layer device processes an IP packet. IP packets are only passed up and down the protocol stackc after they are completely received.
Furthermore, the LTL method has an additive property, which the LTF method in RFC 1242 lacks. The sum of each forwarding delay equal the whole forwarding delay. For example shown in Figure 4, the sum of forwarding delay of DUT A, B, and C equal the forwarding delay of the whole chain of DUTs.
packet packet
DUT/SUTingress egress
t0 t1
Figure 3. Last-to-Last Forwarding Delay (RFC 4689)

WH
ITE
PAPE
R
Xena Networks – Global Price/Performance Leaders in Gigabit Ethernet Testing – www.xenanetworks.com
First-to-Last Latency Measurement of Frame Insertion Time
The last in the permutation, not defined in any RFC, is the first-to-last (FTL) latency measurement, or first-in, last-out (FILO). This latency is as the time interval starting when the first bit of the input packet is offered to the input port of the DUT/SUT and ending when the last bit of the output packet is received from the output port of the DUT/SUT, as shown in Figure 5.
This method is useful when verifying a test instrument is correctly calibrated by measuring the frame insertion time (FIT). FIT is the time required to place a frame on the medium and in theory the Ethernet frame insertion time measurements should match with the equation below:
𝑇𝑇 =𝐿𝐿𝑅𝑅
where 𝑇𝑇 is the frame insertion time (second), 𝐿𝐿 is the length of frame (bit), and 𝑅𝑅 is the medium rate (bps). Thus, the frame insertion time of a minimum Ethernet frame that is 64-byte on a 1G Ethernet link is calculated:
packet packet
DUT/SUT Cingress egress
tC0 tC1
packet packet
DUT/SUT Bingress egress
tB0 tB1
packet packet
DUT/SUT Aingress egress
tA0 tA1
t0 t1
t1 – t0 = (tA1 – tA0) + (tB1 – tB0) + (tC1 – tC0)
Figure 4. Additive Property of Last-to-Last Forwarding Delay (RFC 4689)
packet packet
DUT/SUTingress egress
t0 t1
Figure 5. First-to-Last Latency

WH
ITE
PAPE
R
Xena Networks – Global Price/Performance Leaders in Gigabit Ethernet Testing – www.xenanetworks.com
𝑇𝑇 =512 𝑏𝑏𝑏𝑏𝑏𝑏𝑏𝑏109𝑏𝑏𝑏𝑏𝑏𝑏
= 512 𝑛𝑛𝑏𝑏
The FTL latency for 64-byte frames on 1G Ethernet link thus has a minimum value of 512 ns because it is the time required by the frames to traverse the medium.
When measuring latency, it is important to configure the correct methods according to different purposes in order to achieve optimal precision and accuracy. Precision and accuracy are two different things when it comes to measurement. Precision, sometimes resolution, refers to a measurement’s variation around some reference point, or the minimum value it can measure. Accuracy is the correctness of a measurement. For example, a clock that varies 1 nanosecond per year but is off by 10 hours is extremely precise but not accurate.
The following table shows a summary of the four different latency measurement methods:
Table 1. Summary of four different latency measurement methods
Method Also Known As Standard Type of DUT
Last-to-First LIFO RFC 1242 Store-and-forward devices, e.g. routers and common switches
First-to-First FIFO RFC 1242 Cut-through devices, e.g. cut-through switches
Last-to-Last LILO RFC 4689 Layer 3 devices, e.g. routers
First-to-Last FILO For tester verification by measuring frame insertion time/interval
Jitter Packet jitter, as known as packet delay variation, is another important metric to monitor and measure. In a streaming network (VoIP or video streaming), packets are sent in a continuous stream with the packets spaced evenly apart. Due to network congestion, improper queuing or configuration errors, this steady stream can become lumpy, or the delay between each packet can vary instead of remaining constant. Large jitter can have negative impact of a service because it causes packets to be received out of the range of a buffer. RFC 4689 defines jitter as the absolute value of the difference between the Forwarding Delay of two consecutive received packets belonging to the same stream, also expressed as:
|𝐷𝐷𝑖𝑖+1 − 𝐷𝐷𝑖𝑖| (RFC 4689)
where 𝐷𝐷 is forwarding delay and 𝑏𝑏 is the order in which packets were received.

WH
ITE
PAPE
R
Xena Networks – Global Price/Performance Leaders in Gigabit Ethernet Testing – www.xenanetworks.com
Xena Jitter Measurement
The term jitter (packet delay variation ) used by Xena not only includes the definition in RFC 4689 (last-to-last latency variation), but also other types of latency measurements as mentioned previously. Thus, jitter calculated by Xena can be expressed mathematically as below:
𝐽𝐽𝑏𝑏𝑏𝑏𝑏𝑏𝐽𝐽𝐽𝐽𝑖𝑖 = |𝐿𝐿𝑖𝑖+1 − 𝐿𝐿𝑖𝑖| (Xena)
where 𝐿𝐿 is latency value based on user selection (first-to-first, last-to-last, first-to-last, last-to-first) and 𝑏𝑏 is the order in which packets were received. There are two timestamps worth mentioning when it comes to how jitter measurement is implemented. These two important timestamps are are:
• 𝑇𝑇𝑇𝑇, Timestamp of the transmitted packet (when the packet is going out of the egress port)
• 𝑅𝑅𝑇𝑇, Timestamp of the received packet (when the packet is going into the ingress port)
For the four different latency measurements, i.e. first-to-first, last-to-last, first-to-last, last-to-first, Xena calculate the timestamps accordingly. For example in a first-to-first measurement, 𝑇𝑇𝑇𝑇 is the time when the first bit of the packet leaves the output port, and 𝑅𝑅𝑇𝑇 is the time when the first bit of the packet enters the input port. Since jitter is always calculated based on two packets, the definition can be expressed with the timestamps as below:
𝑱𝑱𝑱𝑱𝑱𝑱𝑱𝑱𝑱𝑱𝑱𝑱𝑱𝑱 = |(𝑹𝑹𝑹𝑹𝑱𝑱+𝟏𝟏 − 𝑻𝑻𝑹𝑹𝑱𝑱+𝟏𝟏) − (𝑹𝑹𝑹𝑹𝑱𝑱 − 𝑻𝑻𝑹𝑹𝑱𝑱)| = |(𝑻𝑻𝑹𝑹𝑱𝑱+𝟏𝟏 − 𝑻𝑻𝑹𝑹𝑱𝑱)− (𝑹𝑹𝑹𝑹𝑱𝑱+𝟏𝟏 − 𝑹𝑹𝑹𝑹𝑱𝑱)| (Xena)
where 𝑏𝑏 is the order in which packets were received.
MEF 10 Compliance
Real-time jitter measurement at high resolution requires specialized hardware that accurately processes in real time at line rates, e.g. 1, 2.5, 10, 25, 40, 100 Gbps, and measures jitter with 8ns accuracy.
The Metro Ethernet Forum (MEF) released the MEF 10 specification in 2004, defining how to measure frame delay variation (FDV), or jitter. The flow chart below in Figure 6 illustrates how MEF 10 speciation is implemented accordingly in Xena testers, running at line rates up to 100 Gbps.

WH
ITE
PAPE
R
Xena Networks – Global Price/Performance Leaders in Gigabit Ethernet Testing – www.xenanetworks.com
The main advantages of MEF 10 real time frame jitter measurement is that the packets can be sent with any uniform or bursty traffic pattern. Furthermore, this method compensates for the lost and out-of-sequence packets and it provides real-time jitter (FDV) statistics reflecting dynamic changes in traffic or device parameters.
Another advantage of real-time jitter measurement is that jitter data can be included in an over-time analysis (charting and logging) and in a histogram graph to analyze with distribution graphs.
IFG Histogram and Jitter Analysis
Ethernet devices must allow a minimum idle period between transmissions of Ethernet packets known as the interframe gap (IFG). A brief recovery time between packets allows devices to prepare for reception of the next packet. An IFG histogram shows the distribution of the every IFG value and therefore it can be used to generate an indirect view of jitter. This requires that the packets are transmitted with a fixed and known IFG value, and only the IFG of the received packets should be measured and displayed in a histogram. Ideally, if the DUT/SUT does not introduce jitter, all the received IFG values should be the same and the histogram will only have value on one interval. But in many cases, the DUT/SUT will introduce jitter to the traffic and therefore there will be difference in the IFG between the received packets.
Start
Frame arrives?
First in stream?
In sequence?
Calculate Jitteri = |(Txi+1 – Txi) – (Rxi+1 - Rxi)|
Update min, max, and avg jitter statistics
No
Yes
Yes
No
Figure 6. MEF 10 frame delay variation (jitter) measurement implementation

WH
ITE
PAPE
R
Xena Networks – Global Price/Performance Leaders in Gigabit Ethernet Testing – www.xenanetworks.com
Since the received IFG histogram shows the distribution of all the received IFG values, it is possible to determine the approximate maximum, minimum and average jitter by analyzing the received IFG histogram.
This method however cannot provide an accurate view of jitter due to its limitations. The primary limitation is that packets must be sent at equal intervals, which restricts the jitter measurement to uniform traffic patter only. It is also impossible to measure jitter on varying rate (bursty) traffic patterns.
The IFG histogram will show how many packets were received in each IFG bucket, but cannot produce any detailed analysis such as a jitter histogram or how the jitter occurred over time, since all that can be determined from the received IFG histogram are the maximum, minimum and average jitter.
An important flaw of using IFG histogram method to analyze jitter is that a packet loss will corrupt the jitter results. This is because the packets before and after the lost packet will corrupt the maximum jitter value that can be deducted from the IFG histogram, because these packets will indicate an erroneously high jitter value due to the dropped packet. Similar, when packet arrive out-of-order, this will also corrupt the jitter results, which can be deducted from the received IFG histogram.
Latency and Jitter Over Time Typically, for a test equipment, latency of every single frame received is measured over an extended duration, and results are summarized into minimum, average, and maximum latency and jitter values. By doing this, the humongous quantity of data can be reduced and the values can be used for comparisons with other DUTs or as benchmarks. However, due to the data reduction, some information is lost, i.e. how latency changes over time.
Under many circumstances, it is critical to understand when increased latency or jitter occurs. When testing the QoS, congestion may cause buffers to overflow in the beginning of the test for few milliseconds. In other situations, a minor speed mismatch between two interfaces may cause buffers to fill over time, resulting in increased latency. Bursts of traffic can also introduce latency and jitter increase. Thus, for these reasons, it is useful to monitor latency and jitter over time.
packet packet packet
DUT/SUTingress egress
IFG IFG
packet packet packetIFG IFG
IFG histogram IFG histogram
Figure 7. Interframe gap histogram and jitter analysis

WH
ITE
PAPE
R
Xena Networks – Global Price/Performance Leaders in Gigabit Ethernet Testing – www.xenanetworks.com
Xena provides many ways of tracking changes in latency and jitter. One way is short-term summary, where average, minimum and maximum latency or jitter is calculated every second and displayed in real time over the test duration, as shown in the example in Figure 8.
Figure 8. Latency and jitter – 1 sec average over time
Another way is Xena test payload for frame level inspection. Xena can generate frame with proprietary test payload of either normal or micro length. The test payload is embedded in every frame transmitted with fields including timestamp, sequence number, test ID, etc. Xena offers a

WH
ITE
PAPE
R
Xena Networks – Global Price/Performance Leaders in Gigabit Ethernet Testing – www.xenanetworks.com
plug-in for Wireshark, the open-source protocol analyzer, to decode the test payload fields and display timing information for every frame. It is thus possible to detect the smallest changes in latency and jitter over the test duration by examining the capture frames.
Latency and Jitter Distribution and Histograms To measure latency and jitter on a per frame level or with data reduction, i.e. average, minimum, and maximum, are important, but it is also important to know how the measurements change over other parameters because it gives information about how the DUT behaves under different circumstances. Using histograms is a common way of collecting such knowledge for in-depth analysis.
A histogram is a graphical representation of the distribution of numerical data. It is an estimate of the probability distribution of a continuous variable. To construct a histogram, all values are divided into a series of intervals. Intervals are adjacent and equal size. The number of cases in each interval is thus drawn in a rectangle shown as the example in Figure 9.
Figure 9. Latency and jitter histogram

WH
ITE
PAPE
R
Xena Networks – Global Price/Performance Leaders in Gigabit Ethernet Testing – www.xenanetworks.com
Latency Measurement Resolution Latency measurement resolution, or timestamp resolution, is a key concept for any time-based measurement. It refers to the precision of the test equipment.
Xena test modules have a latency measurement resolution of ±8 ns, which corresponds to the propagation latency of a 40-meter optical fiber. This means that, for example, the actual latency of 1000 ns may be anywhere in the range of 1008 to 992 ns.
Speed Mismatch Interfaces operating at different speeds can cause congestion, which can affect the latency measurement. For instance, if a 10G Ethernet interface offers traffic to a Gigabit Ethernet interface at any rate above 10% of the line rate, the egress buffer will overflow and frame loss will occur. The latency measured in such a situation will not correctly reflect the desire latency measurement, but a buffer capacity.
Thus, it is important to consider whether traffic congestion will occur when designing a latency or jitter test for a mixed-speed environment. If congestion occurs, the result analysis should then consider the effect of the DUT’s buffers on the measurement.
Accurate Latency Measurement Measuring low-latency switch fabric accurately requires that the measurement equipment provide high accuracy, sufficient resolution, low jitter, and high reliability. It is also important that the correct test methodology be used so that no congestion or backpressure is created, which affects the overall latency measurement.
Before performing the latency measurement, calibrations should be carried out to the test ports in order to verify that the test setup is homogenous. To calibrate a test port, set the loop-back on and generate traffic for collecting statistics.
In addition to the port inherent latency, propagation latency should also be measured. Due to the refractive index n of the fiber medium, where n>1, the speed v at which light propagates through transparent materials is slower than the speed of light in vacuum c (v = c/n). It is rather easy to measure propagation delay using Xena testers. A back-to-back connection between two test ports using last-to-last mode can quickly determine the latency of the fiber. By calibrating the ports based on the measured propagation delay, overall latency can be adjusted to account for the fix delay, and it is ready to proceed with accurate latency measurement.
Test
por
tTest port
Figure 10. Calibrating test ports in local loop-back mode.

WH
ITE
PAPE
R
Xena Networks – Global Price/Performance Leaders in Gigabit Ethernet Testing – www.xenanetworks.com
The switch fabric should be tested with a full mesh topology in order to thoroughly examine its forwarding capability. Figure 12 shows the full mesh topology of a 4-port switch fabric for the test. The number of links increases as L = N(N-1)/2.
A major challenge when measuring latency of low-latency switches is to ensure that packet transmission at the test ports is synchronized so that no queuing or congestion inside the switch occurs to affect latency measurement. Ideally, when the test ports are synchronized and the output port of the switch is not oversubscribed, no congestion will occur as shown in Figure 13 and the latency is accurately measured.
Test
por
tTest port
Figure 11. Measuring propagation delay with back-to-back connection
1 2 3 4
1
2
3
4
Figure 12. Physical and logical a four-port full mesh topology

WH
ITE
PAPE
R
Xena Networks – Global Price/Performance Leaders in Gigabit Ethernet Testing – www.xenanetworks.com
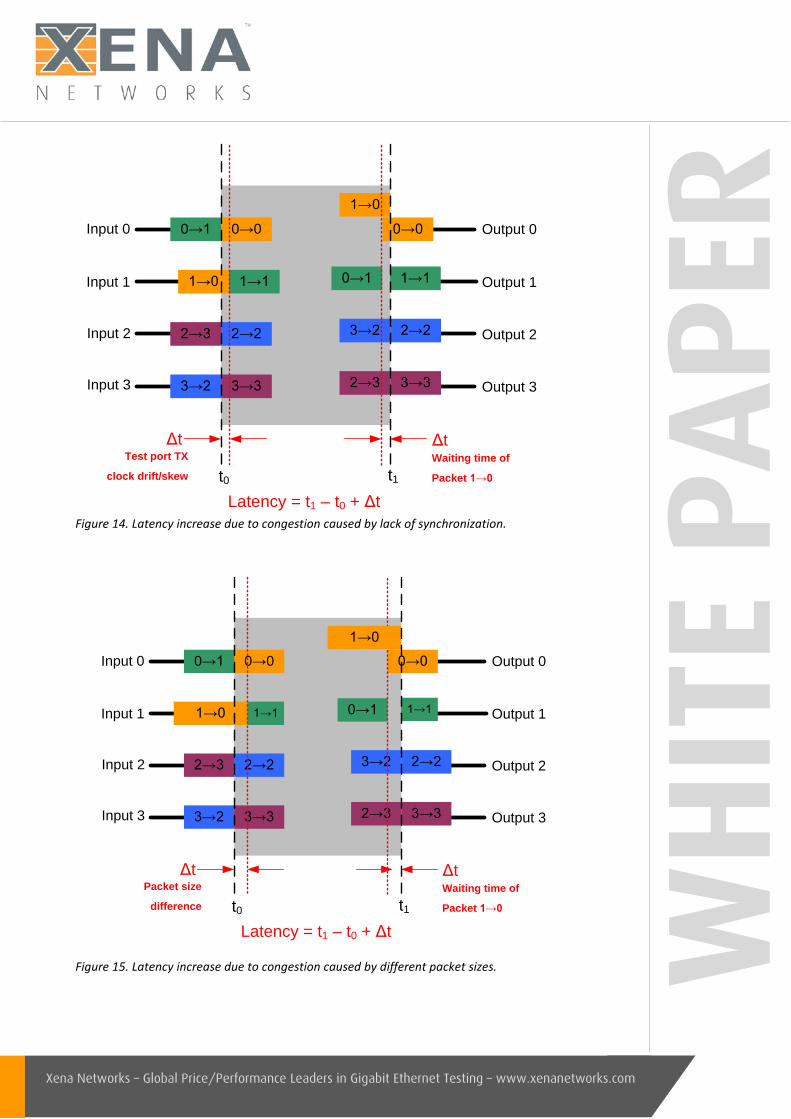
However, if the transmission clocks are not properly synchronized or drifted over time, internal congestion will occur and packets will be buffered at the output port, which will increase the measured latency. For example in Figure 14, packets arriving at port 0 and 1 are not properly synchronized and congestion occurs at the output port 0. Packet 1→0 has to wait in the output queue until packet 0→0 is finished forwarding. This extra amount of waiting time in the queue will be added to the actual forwarding latency. Thus, the transmission ports must be able to operate at stable and synchronized transmit clocks as well as allow PPM adjustments.
In addition, varying packet sizes can also cause a short period of output port congestion. This will also skew the latency measurement results. For example in Figure 15, the size of packet 1→1 is smaller than packet 0→1. This will result in that packet 1→0 arrives at the output port 0 before packet 0→0 is completely forwarded. As a result, packet 1→0 has to wait in the queue until its turn to transmit. This extra amount of latency will be added to the latency measurement. However, switches must be tested with mixed packet sizes in order to simulate real network traffic with a repeatable pattern and sequence. The test should run at the line rate and makes sure that no packet is dropped.
0→00→1
1→11→0
0→01→0
1→10→1
Input 0
Input 1
Output 0
Output 1
2→22→3 2→23→2 Output 2
3→33→2 3→32→3 Output 3
Input 2
Input 3
t0 t1Latency = t1 – t0
Figure 13. Latency is accurately measured when test ports are synchronized without output oversubscription.
WH
ITE
PAPE
R
Xena Networks – Global Price/Performance Leaders in Gigabit Ethernet Testing – www.xenanetworks.com
0→00→1
1→11→0
0→0
1→0
1→10→1
Input 0
Input 1
Output 0
Output 1
2→22→3 2→23→2 Output 2
3→33→2 3→32→3 Output 3
Input 2
Input 3
t0 t1Latency = t1 – t0 + Δt
ΔtTest port TX
clock drift/skew
ΔtWaiting time of
Packet 1→0
0→00→1
1→11→0
0→0
0→1
Input 0
Input 1
Output 0
Output 1
2→22→3 2→23→2 Output 2
3→33→2 3→32→3 Output 3
Input 2
Input 3
t0 t1Latency = t1 – t0 + Δt
ΔtPacket size
difference
ΔtWaiting time of
Packet 1→0
1→1
1→0
Figure 14. Latency increase due to congestion caused by lack of synchronization.
Figure 15. Latency increase due to congestion caused by different packet sizes.

WH
ITE
PAPE
R
Xena Networks – Global Price/Performance Leaders in Gigabit Ethernet Testing – www.xenanetworks.com
CONCLUSION Latency and jitter are two key measurement parameters when evaluating and benchmarking the performance of a network, system or device. Different applications have different requirements on traffic latency and jitter. This white paper clarifies some of the terms used in time measurement, e.g. latency, jitter, inter-frame gap, latency resolution, speed mismatch, latency over time, and distribution. It also presents how Xena interprets and implements time measurements. Low-latency switches should be tested with both fixed and mixed packet sizes in order to obtain accurate latency measurement as well as real-life performance results.
How to apply latency testing is included in the application note of Latency and Jitter in Networking Performance Evaluation, where users can find detailed guidelines and examples of time measurement using Xena test equipment.


![WEG 36008 - Hercules & Xena RPG [Box Set] - GM Screen](https://static.fdocuments.in/doc/165x107/54698a56b4af9fe0338b4cb2/weg-36008-hercules-xena-rpg-box-set-gm-screen.jpg)