White Paper on International Economy and Trade
36
White Paper on International Economy and Trade June 2021 Trade Policy Bureau Ministry of Economy, Trade and Industry 1
Transcript of White Paper on International Economy and Trade

White Paper on International Economy and Trade
June 2021Trade Policy Bureau
Ministry of Economy, Trade and Industry
1

The longest continuing annual METI white paper. This white paper is the 73rd publication. Submitted to the Cabinet every year.
Status
To contribute to the formation of trade strategies through the analysis of international economic trends and foreign policies that affect trade, and to provide the public with the ideas that form the basis of trade policy and directions.
Purpose
2
What is the White Paper on International Economy and Trade?

3
The summary of the White Paper on International Economy and Trade
Global trend surrounding trade Global trend 1: Expansion of government’s economic roles Global trend 2: Strengthening economic security Global Trend 3:Sustainability considerations in economic activities Global trend 4:Digitalization of Business Activity
Building resilient supply chains
Although China has a great share in global supply chain, the production sites have been diversified in other Asian countries.
Digital technology is necessary to manage complicated supply chains.
Meeting sustainable and inclusive growth needs
Japanese companies need to understand the needs of sustainable growth in Asia and work together to solve social issues to create new business opportunities.
Taking Measures toward Building a Trusted Global Value Chain
Rule making and utilization in WTO, EPA
Creating norms in fora such as OECD and APEC
Creating a value chain that leverages Japan's strengths in the public and private sectorsJapan’s outstanding direct investment
(Asia)
0
20
40
60 American jobs plan, American families…EU budget
(% of nominal GDP)
to be added
Counter-COVID-19 economic measures
02468
101214
2005
2006
2007
2008
2009
2010
2011
2012
2013
2014
2015
2016
2017
2018
2019
(%) China
ThailandIndiaIndonesia
Vietnam
Climate change opportunities areincreasingly embraced among CEOs
0
20
40
602010 2020
(%)
Broadening regional integration
4
Table ofContents
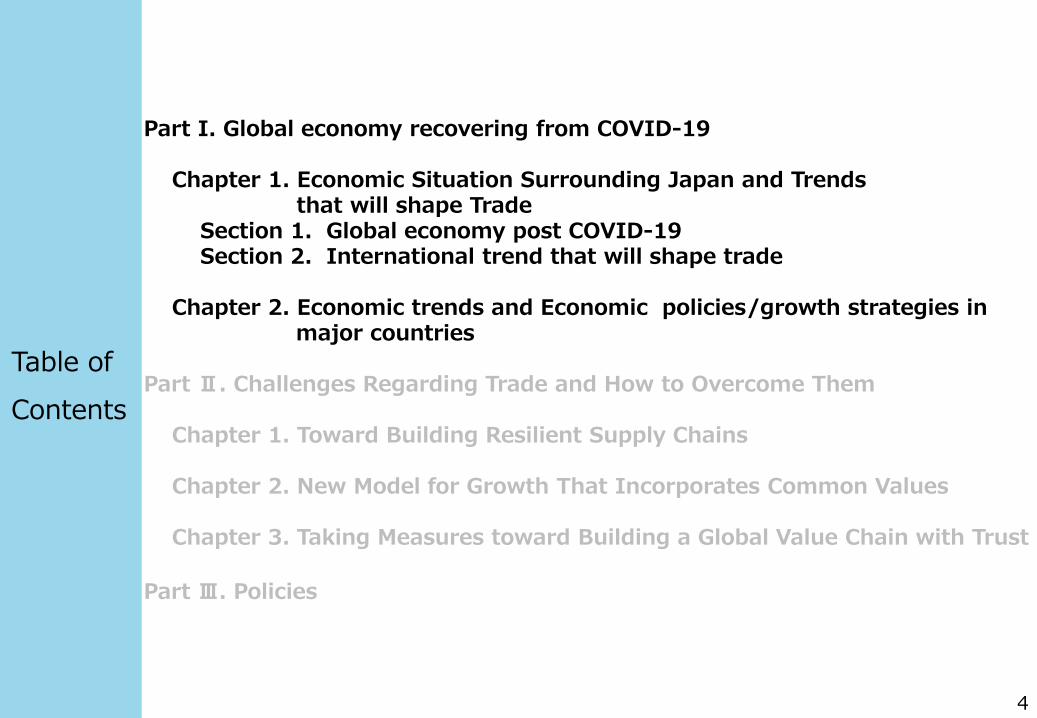
Part I. Global economy recovering from COVID-19
Chapter 1. Economic Situation Surrounding Japan and Trendsthat will shape Trade
Section 1. Global economy post COVID-19Section 2. International trend that will shape trade
Chapter 2. Economic trends and Economic policies/growth strategies inmajor countries
Part Ⅱ. Challenges Regarding Trade and How to Overcome Them
Chapter 1. Toward Building Resilient Supply Chains
Chapter 2. New Model for Growth That Incorporates Common Values
Chapter 3. Taking Measures toward Building a Global Value Chain with Trust
Part Ⅲ. Policies

5
Global economy shows divergent recovery
Note 1: Figures for 2020 are actual results; figures for 2021 are IMF projections.Note 2: The figures in parentheses to the right of the projected figures for 2021 are the range of revisions from the previous January 2021 edition.Source: Compiled from IMF World Economic Outlook April 2021.
Real GDP Growth Rate Forecast by IMF PMIs for developed and emerging economies(%) 2020 2021 (%) 2020 2021
World -3.3 6.0 (0.5)
AdvancedEconomies -4.7 5.1 (0.8) Emerging and developing countries -2.2 6.7 (0.4)
US -3.5 6.4 (1.3) Emerging and developing countries in Asia -1.0 8.6 (0.3)
Germany -4.9 3.6 (0.1) China 2.3 8.4 (0.3)
France -8.2 5.8 (0.3) India -8.0 12.5 (1.0)
Italy -8.9 4.2 (1.2) Emerging and developing countries in Europe -2.0 4.4 (0.4)
Spain -11.0 6.4 (0.5) Russia -3.1 3.8 (0.8)
Japan -4.8 3.3 (0.2)Emerging and developing countries in South America and the Caribbean
-7.0 4.6 (0.5)
UK -9.9 5.3 (0.8) Brazil -4.1 3.7 (0.1)
Canada -5.4 5.0 (1.4) Emerging and developing countries in the Middle East and Central Asia -2.9 3.7 (0.7)
Other developed countries -2.1 4.4 (0.8) Sub-Saharan Africa -1.9 3.4 (0.2)
Note: A PMI above 50 indicates that a larger percentage of respondents answered that "the economy has expanded compared to the previous month.Source: Compiled from IHS Markit.
The real GDP growth rate of the world economy in 2021 is forecasted to be 6.0%, recovering from the decline in 2020. The U.S. (6.4%), which implemented large-scale economic stimulus measures, and China (8.4%), which maintained a positive growth rate in 2020, will lead the global economic recovery, while Africa and Latin America are expected to see a sluggish recovery.
By industry, the manufacturing industry in developed countries recovered quickly due to the return of demand for durable consumer goods (automobiles and home appliances) as a result of economic measures and the spread of remote-work, while the recovery of the face-to-face service industry will be sluggish, and the situation will continue to depend on the infection situation and the rollout and effectiveness of vaccines.
20
30
40
50
60
1 2 3 4 5 6 7 8 9 10 11 12 1 2 3 4
2020 2021
Manufacturing in developed countriesManufacturing in Emerging countriesService sector in developed countriesService sector in Emerging countries

6
Global trade volume will recover despite restrictive policies COVID-19 related trade restrictions in medical sector remain
though supply bottlenecks have eased for some items like face masks. More than 70 countries imposed export curbs on medical sector in 2020. More than 50 countries still maintain those curbs according to the most recent data.
However, recovery in global trade volume in 2021 will more than compensate for the decline in 2020.
No. of countries imposing medical sector export curbs
Note: Data as of May 2021.Source: Global Trade Alert “21st Century Tracking of Pandemic-Era Trade and Investment Policies in Food and Medical Products”.
Global trade volume outlook
Note 1: Forecast as of March 2021.Note 2: Average of exports and imports growth.Note 3: Numbers for 2021 and 2022 are forecasts.Source: WTO.
01020304050607080
Jan-
20Fe
b-20
Mar
-20
Apr-
20M
ay-2
0Ju
n-20
Jul-2
0Au
g-20
Sep-
20O
ct-2
0N
ov-2
0D
ec-2
0Ja
n-21
Feb-
21M
ar-2
1Ap
r-21
(Number of countries)
-6-4-202468
10
2015
2016
2017
2018
2019
2020
2021
2022
(Year-on-year: %)

7
COVID-19 and stay-at-home items supported trade in 2020
Global trade value declined in 2020. However, trade share of medical supplies sharply increased and that of stay-at-home items slightly increased, supporting global trade value in 2020.
US-China trade value increased on year-on-year basis. China’s exports of COVID-19 related items to the US also increased.
China’s exports to the US
Note: Major contributors (both positive and negative) to 2020 exports growth on 2-digit HS codes.Source: Global Trade Atlas.
Global exports value and shares of medical supplies and stay-at-home items
Note 1: Medical supplies include medical equipment, medicine, antiseptics, wet tissues, face masks etc.Note 2: Stay-at-home items include microphones, headphones, earphones, PC monitors, PC projectors, PCs, Videogame consoles etc.Source: WTO, UN Comtrade.
1415161718192021
01234567
2016 2017 2018 2019 2020Share of medical suppliesShare of stay-at-home itemsGlobal exports value (RHS)
(USD trillion)(%)
-40
-20
0
20
40
60
80
Q1 Q2 Q3 Q4 Q1 Q2 Q3 Q4 Q1 Q2 Q3 Q4 Q1
2018 2019 2020 2021
Textile articles MachineryElectrical machinery PlasticsToys FurnitureMiscellaneous chemical products Leather articlesFootwear ClothesOthers Total
(Year-on-year: %)
Textile articles including masks
Machinery including personal computers

8
US economy on the recovery While the US real GDP under the COVID-19 pandemic declined faster
and deeper than during the global financial crisis, the pace of recovery was faster thanks to large-scale and swift economic measures including cash distribution and financial support measures.
There have been increasing numbers of business applicationshighly likely to turn into payroll businesses, showing entrepreneurship is adapting to the social changes caused by COVID-19.
US real GDP (Global financial crisis vs COVID-19)
Source: BEA, FRB.
Business applications highly likely to turn into businesses with payroll
US Commercial and industrial loan growth
Note 1: Numbers for 2005-2019 are monthly averages.Note 2: Numbers are based on the “High-propensity Business Applications”.Source: Census Bureau.
-30-20-10
010203040
2009
2010
2011
2012
2013
2014
2015
2016
2017
2018
2019
2020
2021
(Year-on-year: %)
15.015.215.415.615.816.0
Q1 Q2 Q3 Q4 Q1 Q2 Q3 Q4 Q1 Q2 Q3 Q4
2008 2009 2010
(Annualized: USD trillion)
4 Quarters-3.9%
10 Quarters
17.017.518.018.519.019.5
Q1 Q2 Q3 Q4 Q1 Q2 Q3 Q4 Q1
2019 2020 2021
2 Quarters-10.1%
5 Quarters(Annualized: USD trillion)
020406080
100120140160180200
1 2 3 4 5 6 7 8 9 10 11 12 1 2 3 4
2020 2021
(Thousand)
2006
2005
2007
2008
2009
2010
2011
2012
2013
2014
2015
2016
2017
2018
2019

China’s economic recovery to pre-COVID level and its structural problems
-10
-5
0
5
10
15
20
Q1 Q2 Q3 Q4 Q1 Q2 Q3 Q4 Q1
2019 2020 2021
China is the only major country which succeeded in achieving positive economic growth in 2020. China fell into negative growth in the first quarter, but returned to positive growth in the second quarter and maintained such growth afterwards.
According to UN estimates, the working population has already reduced and the total population is also projected to start declining after 2030. As the calculated fertility rate is lower than the assumption in the UN medium variant case, the future population is likely to fluctuate between the medium variant and low variant case of UN estimates.
Real GDP growth of China (Y/Y)
Source : National Bureau of Statistics (NBS) of China, CEIC database.
Fertility rates by UN estimates and NSB of China
(%)
Final consumption
Real GDP growth
Gross capital formation
Net export
2018Real
2020-2025Assumption
2050-2055Assumption
2095-2100Assumption
Calculated, based on NBS data 1.54UN Estimates / Medium variant 1.70 1.75 1.77UN Estimates / Low variant 1.45 1.25 1.27Source : UN, "World Population Prospects 2019"
NBS, "China population and employment statistics yearbook", CEIC database.
0
5
10
15
20
2020
2025
2030
2035
2040
2045
2050
2055
2060
2065
2070
2075
2080
2085
2090
2095
2100
Total population(medium)
Total population (low)
Working population(medium)Working population (low)
Population estimates(UN “World Population Prospects 2019”)
(100 million people)
9

Eurozone
Germany
Spain
FranceItaly
0
5
10
15
20
25
30
10
Current European economic measures Europe has implemented fiscal stimulus measures with an emphasis on employment retention to
avoid a significant rise in the unemployment rate. Based on the experience of the European debt crisis, the EU approved a moratorium of the application of fiscal discipline requirement to encourage flexible fiscal measures by member states, establishing the EU Recovery and Resilience Facility.
The Facility includes the EU’s key industrial policies on green and digital transitions, which have been reinforced. With the recent policy shift to Electric Vehicles, the efforts to procure lithium-ion batteries from Europe is being promoted. While China’s share of the German lithium-ion battery market remains high, procurement rate from the region is increasing.
(%)Industrial policy and economic measures
EU
Updating the 2020Industrial Strategy
In addition to the existing ① Raw materials ② Batteries, and ③ Hydrogen, industrial alliances in strategic fields such as ④Processors and semiconductor technologies, ⑤ Industrial data, edge and cloud ⑥ Space launchers, and ⑦ Zero emission aviation,are supported.
Recovery and Resilience
Facility(€672.5 billion )
① Green transition,② Digital transformation,③Smart, sustainable, and inclusive growth and employment,④ Regional and social cohesion,⑤Health and resilience,⑥ Policies for the next generation (for children and youth) including education and skill improvement
Unemployment rate(%) European Battery Alliance (EBA)October2017
The EBA was established by interested business partners with the support of the European Commission and member states, aiming to reduce dependence on Asia etc. and aimed to create a competitive battery industry throughout the battery value chain. Japanese and US companies also participate.
May 2018
The European Commission announced a comprehensive action plan for the promotion of the EV battery industry.
PolandAustria
France
Netherlands
China
Japan
Rep. of Korea
Malaysia
Hong KongUSOthers
Poland
Hungary
NetherlandsAustriaCzechSlovak
Finland
China
Rep. of Korea
JapanOthers
German import partners for lithium-ion batteries CY2012 CY2020
Source:Eurostat
Source: Global Trade Atlas

11
Global trend 1: Expansion of government’s economic roles
Economic measures to counter COVID-19 actively focused on severely damaged industries and workers.
The measures also include structural measures to accelerate on-going support for creating a digital and green society, in search of qualitative improvement in the function of governments.
Counter-COVID-19 economic measures
Note 1: Based on IMF calculation as of 17 March 2021, and information on US and EU are added.Note 2: Numbers for China are based on employment and financial measures and do not include the latest 5-year plan.Source: IMF, Committee For a Responsible Budget.
Major employment measures Major industrial measures
Supplemental unemployment benefits (US)
Measures to maintain employment. Support for reduced work/business hours (EU)
Accelerated payment of unemployment benefits. Tax deduction and reduced social security contribution (China)
Increased employmentsubsidy. Support for finding employment (Japan)
Support for manufacturing R&D. Tax incentives for clean energy (US)
Facilitating transition to renewable energy use. Public investment in digital infrastructure (EU)
Facilitating green infrastructure and practical use of digital technology (China)
Establishment of green innovation fund. Facilitating digitization (Japan)
Source: IMF, and media reports.
Major employment and industrial measures
0
10
20
30
40
50
60
US
Japa
n
UK
Germ
any
Fran
ce EU
Chin
a
Indi
a
Russ
ia
Braz
il
EU budgetAmerican jobs plan, American families planEquity, loan, guaranteeAdditional expenditure, foregone revenue
(% of nominal GDP)

12
Global trend 2: Strengthening economic security US government will support establishing resilient, diverse, and secure
supply chains especially for semi-conductors. EU released a renewed strategy to reduce dependency on specific
countries and promote intra-production of critical goods including batteries and semi-conductors through bottom-up analysis.
EU Updating the 2020 Industrial Strategy
• Submission of risk reviews and policy recommendations as to the supply chains of semi-conductors, high-capacity batteries, critical minerals, pharmaceuticals and active pharmaceutical ingredients, etc. Evaluate possible avenues for international engagement with allies and partners and the necessity of amending related laws.
Executive Order on America’s Supply Chains (Feb 2021)
• Deepen cooperation in research and technology development in life sciences and biotechnology, AI, quantum information sciences, and civil space.
• Advance secure and open 5G networks.• Partner on sensitive supply chains, including
semi-conductors, promoting and protecting critical technologies.
Japan-US summit (Apr 2021)
Dealing with the EU’s strategic dependencies:• In-depth analysis on raw materials, batteries,
active pharmaceutical ingredients, hydrogen, semiconductors and cloud & edge technologies.
• Support industrial alliances on processors & semiconductors, industrial data・edge & cloud, space launchers, and zero emission aviation in addition to other existing alliances on raw materials, batteries, and hydrogen.
• Flexible application of exemptions to the subsidy rules for important projects (next generation cloud, hydrogen, low carbon emission industries, pharmaceuticals, semiconductors).
• Bottom-up analysis of 137 items (6% of EU’s goods imports) found the EU is highly dependent. 34 products are more vulnerable given low potential for diversification and substitution for intra production.

13
Global Trend 3:Sustainability considerations in economic activities Throughout the 2000s, there have been growing international movements in policy-
making and capital markets that are encouraging companies to consider human rights, the environment, and other sustainability issues.
From risk management and business opportunities perspectives, integrating sustainability considerations into corporate management is needed.
Domestic and international trends related to sustainabilitySustainable Development Goals Revision of the
Charter of Corporate Behavior(Japan Business Federation)(Delivering on the SDGs through the Realization of Society 5.0)
Guiding Principles on Business and Human Rights(UN)
Launch of Japan’s National Action Plan on Business and Human rights
Stewardship Code• Institutional investors should clearly specify how
they take sustainability into consideration in their policy, consistent with their strategies.
Corporate Governance code• promoting diversity among senior management by
appointing females and non-Japanese.• enhance the quality and quantity of climate-
related disclosure based on TCFD recommendations or equivalent international frameworks at Prime Market listed companies.
SDGs
Paris AgreementPledge to achieve carbon neutrality by 2050(125 countries and 1 region including Japan)
Environment human rights
ESG
GPIF• Promote ESG investment by adopting ESG indices.
UN Principles for Responsible Investment(PRI)(Recommendations for ESG Consideration by Institutional Investors)Task Force on Climate-related Financial Disclosures(TCFD)
0
500
1,000
1,500
2,000
2,500
3,000
3,500
0
20
40
60
80
100
120
2007
2010
2013
2016
2019
2020
Assets undermanagement
Number of Signatories(right axis)
(US$ trillion) (number)
Growth of the PRI Initiative
Note :PRI

90
110
130
150
170
190
210
230
1 2 3 4 5 6 7 8 9 10 11 12 1 2 3 4 5 6 7 8 9 10 11 12 1 2 3
2019 2020 2021
United States China Japan United Kingdom
(Jan.2019=100)
14
Global trend 4:Digitalization of Business Activity Under the COVID-19 pandemic, the need to balance preventing the spread of
infection with maintaining economic activity has led to extensive use of digital business tools.
To maximize the benefit of international trade, it is necessary to create social infrastructure and adopt a new business model that suits a digital society.
No. of Zoom meetings
Note :US and UK values are seasonally adjusted. Japan and China values are not seasonally adjusted. Only US data is quarterly data. Source:METI Japan, United states of Census Bureau, National Bureau of Statistics of China, Statistics Korea, UK Office for National Statistics, CEIC.
0
20
40
60
80
100
120
140
(million)
0
500
1000
1500
2000
2500
3000
3500
(billion, annualized)
Source:Microsoft, zoom video communications HP.
Daily active users of Microsoft Teams
Sales in e-commerce in some countries(index)
15
Table ofContents
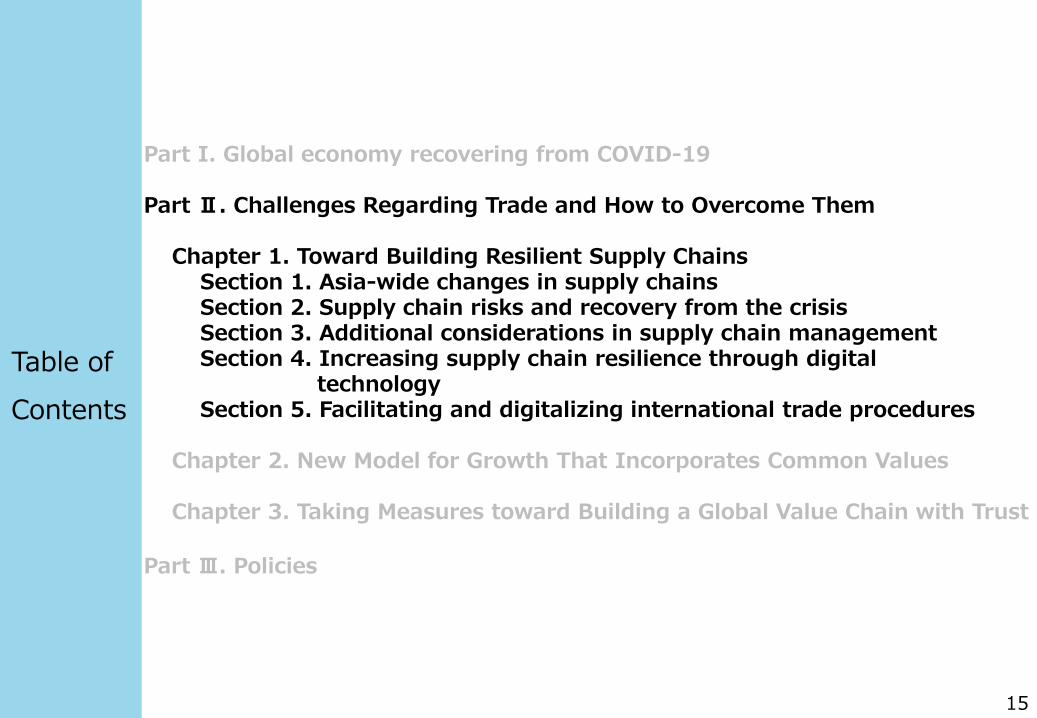
Part I. Global economy recovering from COVID-19
Part Ⅱ. Challenges Regarding Trade and How to Overcome Them
Chapter 1. Toward Building Resilient Supply ChainsSection 1. Asia-wide changes in supply chainsSection 2. Supply chain risks and recovery from the crisisSection 3. Additional considerations in supply chain managementSection 4. Increasing supply chain resilience through digital
technologySection 5. Facilitating and digitalizing international trade procedures
Chapter 2. New Model for Growth That Incorporates Common Values
Chapter 3. Taking Measures toward Building a Global Value Chain with Trust
Part Ⅲ. Policies
16
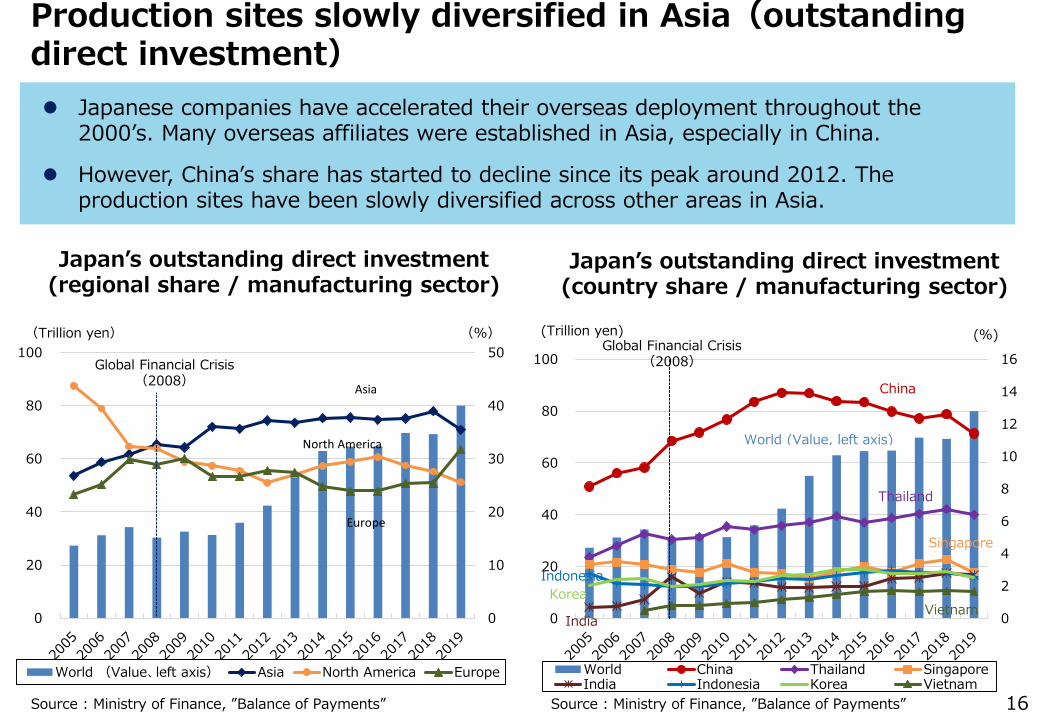
Japanese companies have accelerated their overseas deployment throughout the 2000’s. Many overseas affiliates were established in Asia, especially in China.
However, China’s share has started to decline since its peak around 2012. The production sites have been slowly diversified across other areas in Asia.
Japan’s outstanding direct investment (regional share / manufacturing sector)
Source : Ministry of Finance, ”Balance of Payments”
Production sites slowly diversified in Asia(outstanding direct investment)
Japan’s outstanding direct investment (country share / manufacturing sector)
0
10
20
30
40
50
0
20
40
60
80
100
World (Value、left axis) Asia North America Europe
(Trillion yen) (%)
Asia
Europe
North America
Global Financial Crisis(2008)
0
2
4
6
8
10
12
14
16
0
20
40
60
80
100
World China Thailand SingaporeIndia Indonesia Korea Vietnam
(Trillion yen) (%)Global Financial Crisis
(2008)
World (Value, left axis)
China
Thailand
Singapore
India
IndonesiaKorea
Vietnam
Source : Ministry of Finance, ”Balance of Payments”

0
200
400
600
800
0
2
4
6
8
10
12
2001
2002
2003
2004
2005
2006
2007
2008
2009
2010
2011
2012
2013
2014
2015
2016
2017
2018
Total (left axis) Indonesia VietnamMalaysia Taiwan KoreaPhilippines India SingaporeMexico
Indonesia
India
Vietnam
Global Financial Crisis
(2008)
Philippines
Taiwan
Malaysia
Korea
Singapore
0
1
2
3
4
5
0
2
4
6
8
10
12
2001
2002
2003
2004
2005
2006
2007
2008
2009
2010
2011
2012
2013
2014
2015
2016
2017
2018
Total (left axis) China Thailand US
China
Thailand
US
Global Financial Crisis(2008)
17
The number of Japan’s manufacturing affiliates by country
(US, China and Thailand)(Others)
Source : METI, “Basic Survey on Overseas Business Activities”
World total(left axis)
Production sites slowly diversified in Asia(number of overseas affiliates)
(thousand companies)
(thousand companies)
(companies)(thousand companies)
World total(left axis)
Mexico
In recent years, the number of new establishments in China hit a ceiling due to various increasing costs (e.g. wages), whilst economic development has increased its attractiveness as a market.
Instead, the diversification of risk, called “China+1” is evident, with the increasing number of Japan’s affiliates located in other areas of Asia, including Thailand, Indonesia and Vietnam.

0
10
20
30
40
50
0
50
100
150
200
250
300
1994
1996
1998
2000
2002
2004
2006
2008
2010
2012
2014
2016
2018
2020
Total China USVietnam Germany Korea
(billion yen) (%)
0
10
20
30
40
50
0
20
40
60
80
100
1994
1996
1998
2000
2002
2004
2006
2008
2010
2012
2014
2016
2018
2020
Total China USKorea Vietnam Indonesia
(billion yen) (%)
0
10
20
30
40
0
200
400
600
800
1,000
1,200
1994
1996
1998
2000
2002
2004
2006
2008
2010
2012
2014
2016
2018
2020
Total China ThailandGermany Vietnem Korea
(billion yen) (%)
Import share from China hit a ceiling for some machinery-parts China’s share of Japanese imports hit a ceiling for some major machinery-parts, with
shares of Thailand, Indonesia and Vietnam increasing instead of China, although China still comprises a large share for some items.
There seem to be some signs of diversifying procurement sources together with location of production sites.
Major import partners for Japan
Global Financial Crisis(2008)
Auto parts BearingsGlobal Financial Crisis
(2008)
Cock and valvesGlobal Financial Crisis
(2008)
18

19
Supply chain risks and recovery from past disasters
Recovery from the Great East Japan Earthquake
Early recovery was possible because many past shocks were transient and intensive recovery efforts were made, even when the damage caused by a natural disaster was significant. In such cases, inter-company cooperation worked effectively.
With increasing size and diversity of supply chain risks, risk management methods need to change.
Time to recovery
Within one month, more than 60% of production bases were restored.
Only three months for the IIP (Index of Industrial Production) in Tohoku to recover from 60% of the decline, a relatively short recovery.
Supply chain impacts
【Negative effects】The impact will spread to companies
outside the disaster areas through supply chain networks.
【Positive effects】Early business resumption can be
achieved with the business partners' support.
Easy to do business with alternative suppliers.
Triggers of supply chain disruptions
Note: Survey period: (upper right)April - December 2011. (Lower right) February to March 2020. Percentage of "serious risk" and "moderate risk" combinedSource:(upper right)World Economic Forum (2012) ”New Models for Addressing Supply Chain and Transport Risk”
(Lower right)Gartner (2020) ”How Supply Chains are Responding to the Impact of Coronavirus”
2011 results
2020 results
Sources of concern for companies
0 20 40 60 80 100
1st Sudden demand shocks
1st Conflict and political unrest
1st Natural disasters
Econ
om
icris
k
Geop
oli
tical
risk
Envi
ron
men
tal
risk
(%)
0 20 40 60 80 100
1st shortage of critical raw materials/components
1st Tariffs and Trade war/uncertainty
1st Epidemics/Pandemics(e.g.coronavirus)
Econ
om
icris
k
Geop
oli
tical
risk
Envi
ronm
ent
al r
isk
(%)
20
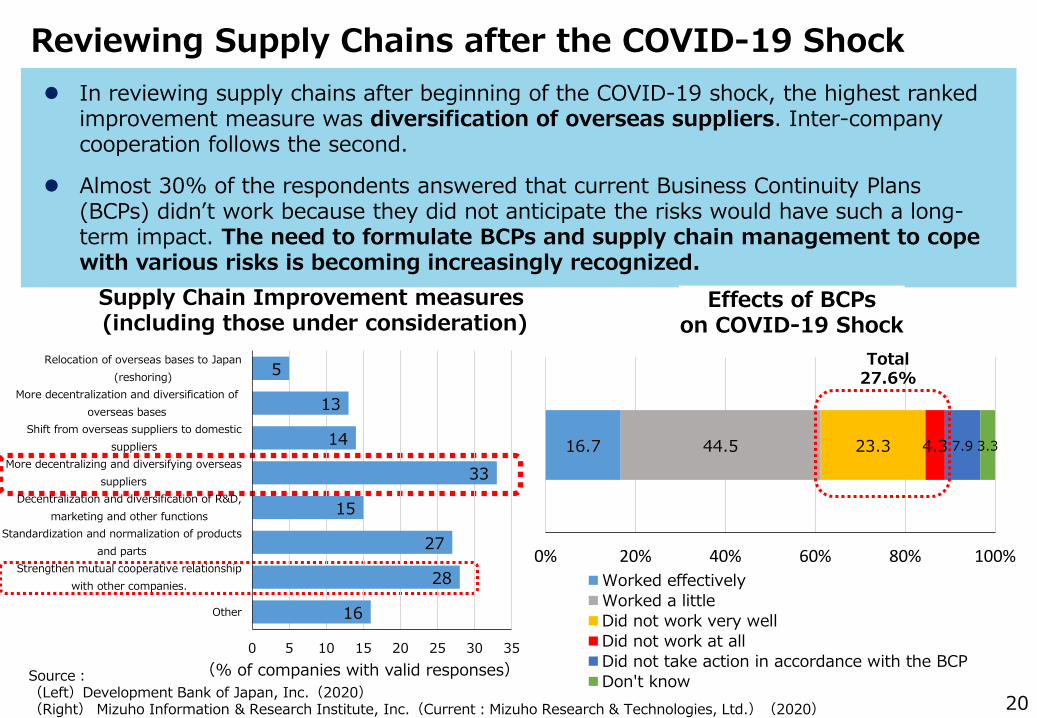
Reviewing Supply Chains after the COVID-19 Shock
Source:(Left)Development Bank of Japan, Inc.(2020)(Right) Mizuho Information & Research Institute, Inc.(Current:Mizuho Research & Technologies, Ltd.)(2020)
In reviewing supply chains after beginning of the COVID-19 shock, the highest ranked improvement measure was diversification of overseas suppliers. Inter-company cooperation follows the second.
Almost 30% of the respondents answered that current Business Continuity Plans (BCPs) didn’t work because they did not anticipate the risks would have such a long-term impact. The need to formulate BCPs and supply chain management to cope with various risks is becoming increasingly recognized.
Effects of BCPson COVID-19 Shock
Supply Chain Improvement measures(including those under consideration)
16
28
27
15
33
14
13
5
0 5 10 15 20 25 30 35
Other
Strengthen mutual cooperative relationshipwith other companies.
Standardization and normalization of productsand parts
Decentralization and diversification of R&D,marketing and other functions
More decentralizing and diversifying overseassuppliers
Shift from overseas suppliers to domesticsuppliers
More decentralization and diversification ofoverseas bases
Relocation of overseas bases to Japan(reshoring)
(% of companies with valid responses)
16.7 44.5 23.3 4.3 7.9 3.3
0% 20% 40% 60% 80% 100%Worked effectivelyWorked a littleDid not work very wellDid not work at allDid not take action in accordance with the BCPDon't know
Total 27.6%

21
Additional considerations for managing supply chains The factors that need to be considered in supply chain management are
becoming increasingly complicated and sophisticated.
More Japanese companies are committed to CO² emission reduction targets. There are increasing chances for companies to become legally obligated to comply with some kind of human rights laws. In addition, there are export and procurement regulations for economic security reasons, as well as human rights.
Number of companies committing to SBT
(Japan)Legislative jurisdictions requiring
human rights considerations
Note: SBT (Science Based Targets) is greenhouse gas reduction targets that are consistent with the levels required by the Paris Agreement. Source:SBT, sales data based on Refinitiv(as of May 2021)
23%
EnactingCountry/
GovernmentLegislation
State of California California Transparency in Supply Chains Act
USThe Dodd-Frank Wall Street Reform and Consumer Protection Act
UK Modern Slavery Act 2015
France Duty of Care Law
Netherland Child Labour Due Diligence Law
Australia Modern Slavery Act 2018
Germany Supply Chain Law
Sales of companies committing to SBT
share oftotal listed companies
(Japan)
0
20
40
60
80
100
120
140
~2018.3 ~2021.3
approved
committing
22
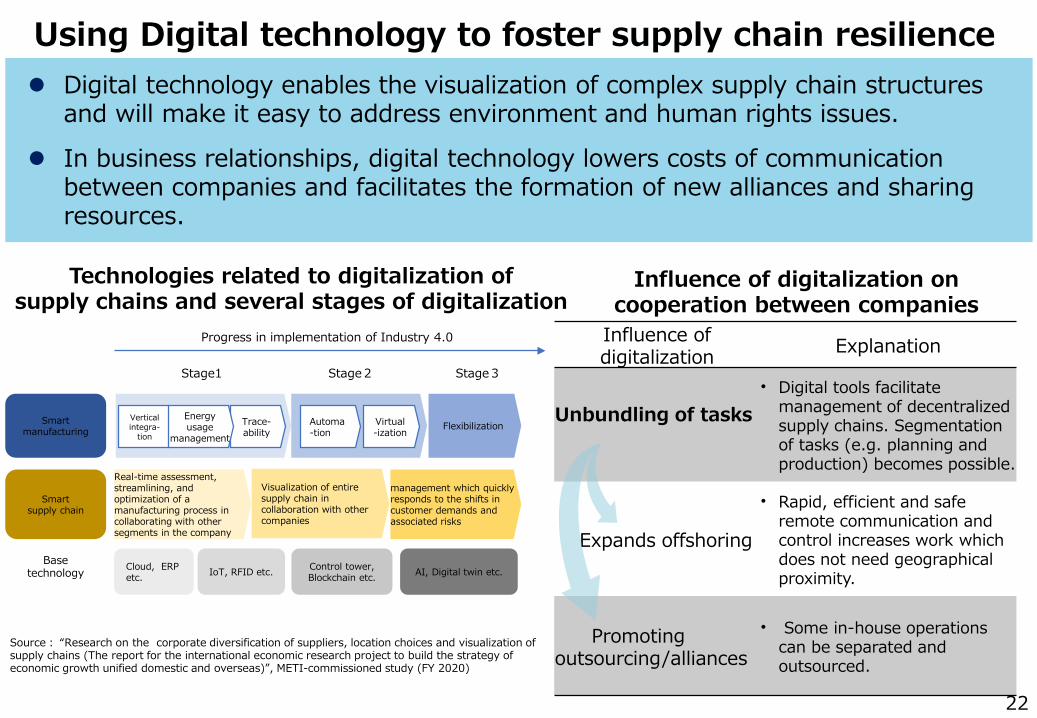
Using Digital technology to foster supply chain resilience
Source: “Research on the corporate diversification of suppliers, location choices and visualization of supply chains (The report for the international economic research project to build the strategy of economic growth unified domestic and overseas)”, METI-commissioned study (FY 2020)
Technologies related to digitalization of supply chains and several stages of digitalization
Trace-ability
Progress in implementation of Industry 4.0
Flexibilization
Real-time assessment, streamlining, and optimization of a manufacturing process in collaborating with other segments in the company
Visualization of entiresupply chain in collaboration with other companies
management which quickly responds to the shifts in customer demands and associated risks
Cloud, ERP etc. IoT, RFID etc. Control tower,
Blockchain etc. AI, Digital twin etc.
Vertical integra-
tion
Energyusage
managementAutoma-tion
Virtual -ization
Stage1 Stage2 Stage3
Smartmanufacturing
Smartsupply chain
Basetechnology
Digital technology enables the visualization of complex supply chain structures and will make it easy to address environment and human rights issues.
In business relationships, digital technology lowers costs of communication between companies and facilitates the formation of new alliances and sharing resources.
Influence of digitalization on cooperation between companies
Influence of digitalization Explanation
Unbundling of tasks• Digital tools facilitate
management of decentralized supply chains. Segmentation of tasks (e.g. planning and production) becomes possible.
Expands offshoring
• Rapid, efficient and safe remote communication and control increases work which does not need geographical proximity.
Promoting outsourcing/alliances
• Some in-house operations can be separated and outsourced.

Issues for realizing supply chain digitalization Companies should have clear ideas about what information to share with
other companies and take cyber security measures. Deploying IT-skilled persons in the right places has become more and more essential.
To ensure smooth and safe information sharing between companies, commitment to rules to ensure free flow of data and due process of government access are also important. Under the common value of “trust” in the digital age, the framework to materialize the global data governance system is needed.
Values underlying the data policy
23
Emphasize national security and order
as “trust”
Free, open and transparent data flow (Japan, US and
Europe)
・Data Free Flow with Trust・Protection of privacy・Respect for human rights
Prefer data localizationand control by the
government
Distribution of IT-skilled personsbetween IT companies and non-IT companies
Source:Information-technology Promotion Agency Japan, White paper on IT human resources 2017, 2020.
72.0
34.6
44.0
46.1
38.6
46.6
28
65.4
56
53.9
61.4
53.4
0% 20% 40% 60% 80% 100%
Japan
United States
Canada
United Kingdom
Germany
France
IT company Non-IT company

24
Facilitation and digitalization of trade procedures
Global efforts to facilitate and digitalize trade procedures complement companies’ supply chain management using digital technology.
Under the WTO and Economic Partnership Agreements, efforts have been made to improve the transparency of customs clearance procedures. Recently, Trade Facilitation Platforms have emerged worldwide. These contribute to building a resilient supply chain which also contributes to sustainability and inclusiveness.
Source:NTT DATA Corporation
Determinants of GVC participationin ASEAN countries through imports Trade Waltz: How it works
Note: The figure shows significant standardized coefficients from a gravity regression. The higher the figure, the higher the incentive for the factor to increase imports. Since only significant figures are listed, figure for firm output (large firms) is not listed.
Source:OECD Trade Policy Papers No.231
0 0.1 0.2 0.3 0.4 0.5
Foreign demand
Quality of domestic customs
Firm output
Contiguity
Common language
Internet use
SMEs
Large firms
Insurer
Regulator
Customs CarrierCargo
Carrier
Importer Regulator
Customs
Exporter
Import Bank
Export Bank
Blockchain(Distributed Ledger)share and utilize electronic data

25
Table ofContents
Part I. Global economy recovering from COVID-19
Part Ⅱ. Challenges Regarding Trade and How to Overcome Them
Chapter 1. Toward Building Resilient Supply Chains
Chapter 2. New Model for Growth That Incorporates Common ValuesSection 1. Growing expectations regarding corporate behavior toward
a sustainable and inclusive future societySection 2. Meeting sustainable and inclusive growth needsSection 3. Toward corporate behavior that creates sustainable value
Chapter 3. Taking Measures toward Building a Global Value Chain with Trust
Part Ⅲ. Policies

0 10 20 30
Sexual harassmentIncome inequality/distribution of wealth
Crime/personal safetyHealth care/disease prevention
UnemploymentClimate change/protecting the environment
0 10 20 30
Income inequallity/distribution of wealthHealth care/disease prevation
Crime/personal safetySexual harassment
UnemploymentClimate change/protecting the environment
Societal concerns of Millennials and Generation Z
Note:4 Major sectors that have large numbers of respondents to the survey.Source:JBIC Survey “Report on Overseas Business Operations by Japanese
Manufacturing Companies”
Incentives for addressing SDGs issues (By sector : Manufacturing)
Generation Z
Rising demand for corporate behaviors that shape future society with sustainability and inclusiveness
Note1:Millennials included in the study were born between January 1983 and December 1994.The survey was conducted in 43 countries including Japan, the U.S., European countries.
Note2:Generation Z respondents were born between January 1995 and December 2003.The survey was conducted in 20 countries including Japan, the U.S., European countries.
Note3:The survey was conducted for both generations between November 21, 2019 and January 8,2020.
Source:Deloitte “Global Millennial Survey 2020”
Millennials
As the influence of the future oriented value “Sustainability” has been increasing, it has become more important for corporations to contribute to values above and beyond their short-term economic returns. Expressing their contributions to such values is now considered as a measure which establishes a competitive advantage.
Addressing issues related to the SDGs has positive effects on the corporations’ activities such as enhancement of capturing consumer demand and recruitment.
0 20 40 60 80
MachineryElectric,ElectronicsChemicalsMotor vehicles
(%)
26

27
Promote efforts to contribute to sustainability in capital markets In the last decade, CEOs are seeing climate change as a business opportunity.
In Japan, the share of sustainable investments in asset management companies is increasing. In addition to environmental considerations, efforts to address various social issues are also being increasingly valued by capital markets.
Proportion of sustainable investing relative to total managed assets
(2016→2018)
Source: PwC’s 23rd Annual Global CEO Survey
TotalSustainable Investment
Balance
About 310trillion yen
Percentage of Total Asse24%
Total assets
About1,274 trillion yen
Assets under management in institutions that managesustainable investments
About 600trillion yen
Percentage of Total Assets47%
Note:The total amount under management is the sum of the amounts managed by all the investment institutions in Japan.Source:The total amount under management is based on the Bank of Japan's Flow of Funds Statistics. The amount of sustainable investment and the total amount managed by 47 institutions are from the Sustainable Investment Survey 2020.
0
10
20
30
40
50
60
Europe UnitedStates
Japan
2016 2018(%)
0
5
10
15
20
25
30
35
40
45
50
Glob
al
Chin
a
Fran
ce
Braz
il
Ital
y
Japa
n
Germ
any
UK
Cana
da
Indi
a
US
2010 2020(%)
Climate change opportunities areincreasingly embraced
among CEOsSustainable investment
in japan(2020)
Source:2018 Global Sustainable investment Review

28
Investing in intangible assets that contribute to sustainability With digitalization, the source of value creation of corporations has shifted from
tangible to intangible assets. Evaluation of intangible assets has a significant impact on stock prices. In terms of PBR, the valuation of Japanese companies is not as high as that of European and American peers. This could be an indication of a lack of investment in intangible assets by Japanese companies.
For Japanese companies, it is becoming increasingly important to invest in wide range of intangible assets, such as R&D, human resources, and relational capital such as trust and networks with domestic and overseas business partners.
Investment in intellectual property and other assets
% of real gross fixed formation
Software, Database(Acquired from IT investment)
Intellectual Property(Copyrights, Licenses, etc.)
Knowledge leading to new production(R&D)
Human capital(Knowledge,Skills and competencies ,etc.)
Relational capital(Cooperation and networks,Brand value, etc.)
Structure capital(Organization culture, etc.)
Intangible Assets
Stock market considers intangible assets in investment decisions
43%36%
11%12% 20%16%
42%
27%
24%19%
30%25%
15%
37%
65%69%50%
59%
0%
20%
40%
60%
80%
100%
2012 2020 2012 2020 2012 2020
Japan(TOPIX500)
US(S&P500)
Europe(STOXX600)
below 1 1~2 above 2
Note:Share price divided by net assets per share.Source:Refinitiv
(P/B ratio)
0
5
10
15
20
25
30
35
2005
2006
2007
2008
2009
2010
2011
2012
2013
2014
2015
2016
2017
2018
2019
2020
Japan US Eurozone(%)
Note:Gross fixed capital formation is investment to create tangible and intangible assets combined, including capital investment, public investment, and housing investment.source:BEA, Cabinet office Government of Japan, Eurostat, ECB

0100200300400500600700
2000
2001
2002
2003
2004
2005
2006
2007
2008
2009
2010
2011
2012
2013
2014
2015
2016
2017
2018
2019
2020
Royalities and licensing fees Direct investment flow
(2000=100)
0
100
200
300
400
500
2000
2001
2002
2003
2004
2005
2006
2007
2008
2009
2010
2011
2012
2013
2014
2015
2016
2017
2018
2019
Royalities and licensing fees Direct investment flow
(2000=100)
29
Difference in Business Models Global capital flows show that overseas payments for intangible assets, such
as royalties, has been growing rapidly while direct investment flows have grown gradually. It suggests that overseas activities are conducted in non-equity modes and payments for intangible assets are made between arms length companies.
In contrast, Japanese direct investment flows and the receipt of payments for intangible assets has been growing in tandem. It suggests Japanese earnings relating to intangibles is based on capital ties. Pursuing new business methods, such as alliances with local companies, may expand opportunities.
Differences in business models suggested by trends in direct investment / royalties etc.World Japan
Source : UNCTAD (World), Bank of Japan (Japan)

The number of doctors per population is low. Health disparities are expanding between areas. The spread of COVID-19 infection has not been halted in some countries.With the lifestyles changes that accompany economic developments, people with chronic diseases are increasing in Malaysia etc., while Thailand and similar countries will face the challenge of an aging society in the future.
Number of medical doctors (per 10,000 population)
05
1015202530
(number)
Proportion of populations that have access to at least basic hand-washing facility is: Cambodia (U:88%,R:60%), Indonesia (U:72%,R:55%), India (U:80%,R:49%). Huge gaps remain between urban and rural areas. *U: Urban, R:Rural.
Economic gaps between the Bangkok capital region withindustry accumulation and the rural agricultural areashave deepened. Economic downturn due to the Covid-19pandemic may accelerate the trends (GDP per capita ofthe capital area is six times as large as in rural areas)250 million people (80% of the total population) live onabout 2,900 yen a month (lower band of the povertyline). The gap between the top-10% wealthy populationand others is expanding at the fastest pace in East Asia.(World Bank)
Disparities in urban and rural economies(Thailand, Indonesia)
Many ASEAN member countries have achieved consistent economic development, while struggling with a widening urban–rural divide. Social infrastructure construction projects have not caught up with rapid urbanization in the ASEAN countries. Lack of material and human capital is the challenge.
Social agenda associated with economic development in Asia
Disparities among the ASEAN members(Cambodia, Laos, Myanmar)
Less developed ASEAN countries “CLM” are stilldependent on the primary sector. Main actors are smallfarmers. To lift them out of poverty, efforts are needed toimprove productivity and open up new markets.
Disparities in medical access
Disparities in access to water infrastructure(Cambodia, Indonesia, India)
(人)
Source : WHO30

0 1 2 3 4
Food and Agriculture
Health and Well-Being
Energy and Materials
Cities
Exploring new market opportunities for Japanese companies
(trillion $)
Developing Economies
Source:Better Business Better World 2017(Report for the World Economic Forum 2017)
Health and Well-being:healthcare services and products, remote medical care
Energy and Materials :expansion of regenerated energy,bio-based materials applied to circular economy
Cities:electrified vehicles, co2 capture, affordable home ownershipFood and Agriculture:reduction of food loss, services for healthy
diet
Market size of Four economic systems in 2030
Market opportunities in 2030
0
1,000
2,000
3,000
4,000
5,000
6,000
2015 2019 2020
(100 million $)
Source:Financial Services Agency of Japan, Japan Securities Dealers, Environmental Finance.
SDGs Bond Issuance (World)
Developed Economies
The SDGs bring new market opportunities by boosting demands driven by new values. Both advanced and emerging economies have great potential. SDGs bonds are becoming as attractive as other bonds for investors. This provides companies with a wider range of funding options.
Achieving the SDGs could open up US$ 12 trillion of market opportunities by 2030*. Japanese companies are expected to make significant contributions to the SDGs achievements where cross border cooperation with local firms and municipal governments is imperative.
*Business and Sustainable Development Commission “BETTER BUSINESS BETTER WORLD ”
31

32
Cooperation to contribute to sustainability
Source:IIRC
Circular structure in business activities Strategic promotion of SDGs by Japanese companiesExternal Environment
Finance, technology,
human esources, etc.
Productsand
Service
Local economic growth(securing jobs, etc.)
Reduce disparities
Enhance Quality of life
Improve Productivity
governance
Example of external economy
Direct contribution Indirect contributionApproaches that promote
contributions to sustainability(individual / public and
private)
SuRaLa Net
Local price F/S and demonstration
with JICA and METIsupport
Nishihara
Inter-municipal relations the development of local
human resources andcreating a mechanism forgathering information
demonstration by JICA
DAIKIN
support for introduction of energy saving standards
Reduction of initial burden
Educationservice
Creating jobs Reduce disparities
Fosteringindustry
Wastereduction
Environmentawareness
Energy efficiencyRenewable energy
EnergySaving,Recycle
Low-warming Refrigerant, etc.
DiseasePrevention
improveproductivity
Source: Mizuho Research & Technologies, Ltd
Input Businessactivities output outcome
With the growing awareness of sustainability issues, a cyclical structure is becoming more apparent in which business activities that are conscious of the external environment, such as those which improve the quality of life and protect the environment, also benefit corporate performance.
There is an increasing need for public-private partnerships to solve social issues by creating shared awareness of social issues, developing human resources and formulating rules.
Circular Society
UrbanInfrastructure
Creating jobs

33
Table ofContents
Part I. Global economy recovering from COVID-19
Part Ⅱ. Challenges Regarding Trade and How to Overcome Them
Chapter 1. Toward Building Resilient Supply Chains
Chapter 2. New Model for Growth That Incorporates Common Values
Chapter 3. Taking Measures toward Building a Global Value Chain with Trust
Part Ⅲ. Policies
Chapter 1. Rule-based International Trade System
Chapter 2. Country Economic Strategies

34
Necessity of building a global value chain with "trust” In the midst of geo-economic shifts, global value chains management is becoming more
complex due to increasing influential factors, such as “promotion" and “protection“ measures from the perspective of economic security and necessary responses to the growing challenges for common values (environment, human rights, etc.). A major strategic issue for corporate management and policy making is to establish a "trustworthy" value chain by examining the entire value chain using digital technology and data.
New challenges for upgrading the value chain
Avoid concentration of production sites
Preparing for Natural Disasters(BCP)
New Challenges
Traditional issues
Utilization of digital technology and data
Establishing a "trustworthy" value chain
Examining and visualizing the entire value chain
Green Human rights
Digital
Strengthening the “Promotion" and
“Protection" in light economic security
Growing concern for Environmental
protection/climate change
Growing expectations for human rights considerations
(Human rights DD etc.)

Call for upgrading the "free trade" system In the midst of geo-economic shifts, it is necessary to upgrade the nature of "free trade" in order to
maintain and develop a liberal and open economic and social system.
The Economic Theory of "Comparative Advantage
(Enhancing export competitiveness)
Globalization and “the age when companies choose countries”.
Achieving a sustainable and fair economic community
Export-DrivenIndustrial model
Building a multi-layered supply chain across
borders
【Traditional Framework】 【The Globalization Model】 【New international demands.】
Building a "trustworthy" value chain based on• Reducing disparities, benefiting working
citizens• Addressing economic security issues• Demand for containment of unfair trade• Digital economy• Increasing concern for common values
(environment, human rights, etc.)
Reduction or elimination of trade
barriers (tariffs, etc.) to achieve
"efficiency" (liberalization)
Built-in norms for• Sustainability• Fairness• Social Justice
35
Improving the business environment of investee
companies for multinational companies
PhilosophyBusiness
International standards

36
Creating an economic order that supports the "upgrading" of the free trade system and creating a value chain that leverages Japan's strengths
In order to realize further sophistication of the global value chain by taking advantage of the "strengths" of Japanese companies, it is necessary to form an economic order that responds to various current issues and strategic cooperation between the public and private sectors.
Underdeveloped international rulesto cope with the digitalization of economic activities
(1) Rule making and utilization in WTO
<Issues to be resolved>
(2) Bilateral/regional rule making and utilization in EPA
(3) Creating norms in fora such as OECD and APEC
(4) Creating a value chain that leverages Japan's strengths in the public and private sectors
Risk of “my country first" and protectionist trade restrictions becoming widespread
・Restrictions on exports of vaccines, etc.・Increase in tariffs to protect domestic industry・Remaining tariff/non-tariff measures that hinder the broad use of environmental goods
Damage to the level playing fieldby market-distorting measures taken by foreign
governments and companies
・Industrial subsidies and state-owned enterprises that lead to overproduction・Forced technology transfer, dumping by foreign companies・Failure to take effective climate change measures
・Strengthen disciplines against nations that seek to enclose data・Reduce inequalities between digital companies and traditional companies
<Actions>
Creating Economic Order
Strategic collaboration in the public and private sectors


![White Paper on International Economy and Trade …White Paper on International Economy and Trade 2019 [Outline] July 2019 Trade Policy Bureau Ministry of Economy, Trade and Industry1](https://static.fdocuments.in/doc/165x107/5e9cc27f2dba9e66db7ea99a/white-paper-on-international-economy-and-trade-white-paper-on-international-economy.jpg)