White Paper - harperintl.com · off-gas mole fractions at the given temperature from cumulative...
12
By Dr. T.S. Lee, Process Technology Engineer, CFD Dr. Peter Witting, Senior Process Technology Engineer ABSTRACT The global demands for the CFRP (Carbon Fiber Reinforced Plastic) among composite materials would be expected to in- crease in weight sensitive products due to its superior mechanical properties per its weight. The majority of the industrial carbon fiber is now produced from synthetic precursor polymer such as polyacrylonitrile (PAN). The synthetic precursor un- dergoes two different thermo-chemical processes, namely stabilization and carbonization, to convert into the final product – carbon fiber. The characteristics for these two thermos-chemical processes are quite unique and different from each other. Stabilization process is relatively slow and exothermic and requires controlled heat dissipation to avoid thermal runaway. The carbonization process is rapid and involving a large fiber mass transfer into the gaseous phase with endothermic reactions. While many chemical kinetics studies have been published for the stabilization process, little published research work has focused on the carbonization chemical kinetics in spite of the major mass loss during the carbonization process. As part of our ongoing work to develop a detailed model of the carbonization process we have improved our previous 2-zone fiber model with lumped kinetics releasing pseudo-pure-off-gas by applying the temperature dependent volatile concentration from published literature. Fiber conversion predictions over the fiber travel direction are obtained from the model. A parametric study was conducted on the linear density change of the fiber over the heated length with different temperature and sur- rounding conditions. 1. INTRODUCTION In spite of disadvantages of the manufacturing process, the global demands for the CFRP (Carbon Fiber Reinforced Plastic) among composite materials would be expected to increase based on many independent sources [1,2]. Practically carbon fiber and CFRP share the advantage and disadvantage because almost all carbon fiber produced would be converted into carbon fiber reinforced plastic. The high cost of the carbon composites makes many industries impeded to adapt carbon composites in their products. Therefore, it is of necessity for cost effective high volume carbon fiber manufacturing. This work focuses on the extending and improving the kinetic carbonization model previously developed [3]. The kinetic model focused on the fiber mass loss with temperature and the energy requirements to drive this reaction. This reaction model along with furnace temperature profiles, residence times, and heat transfer models are used to predict the mass loss within the furnace system. This also predicts the generation of off-gas from the carbonization process. The changes in the off-gas composition as a function of the conversion were not considered. The model presented here extends the model to include predictions of the various species of gasses produced at different fiber temperatures and converges. 2. MATHEMATICAL MODELS We have developed a continuous model for carbonization process for stabilized PAN including mass loss rate as a lumped kinetic model using pseudo-pure off-gas and two-zone model for fiber [3]. In the previous model, the off-gas released from the fiber during the carbonization process had been assumed as an ideal gas mixture with fixed concentration of each con- stituent. In this study, we have improved our previous model by adapting more realistic instantaneous off-gas compositions rather than fixed concentration off-gas. 2.1 Chemical Composition of the Off-Gas Of the several published works addressing the off-gas concentrations as a function of either fiber retention time or tempera- ture [4 ~ 6], we have selected the recent work done by Pham et al. [7] which was based off the work published by Fiedler et al. [8]. Fiedler and coworkers oxidized acrylonitrile homopolymer fibers under air environment for 5 hr at 250°C followed by pyrolysis in helium up to 1000°C. Both solid residues and gaseous byproducts (off-gas), of the pyrolysis are graphically giv- en in the paper. In the recent published work by Pham, this graphical data were converted into mathematical expressions by polynomial curve fitting. The authors have provided all the cumulative emission rates for 8 off-gas constituents in Eqs (27)- (34) in their publication. Instead of applying these mathematical expressions into our model directly, we evaluated the White Paper: Advances in a Lumped Kinetic Model for Carbonization for Carbon Fiber Manufacturing Page 1
-
Upload
vuongtuong -
Category
Documents
-
view
215 -
download
0
Transcript of White Paper - harperintl.com · off-gas mole fractions at the given temperature from cumulative...

By Dr. T.S. Lee, Process Technology Engineer, CFD
Dr. Peter Witting, Senior Process Technology Engineer
ABSTRACT The global demands for the CFRP (Carbon Fiber Reinforced Plastic) among composite materials would be expected to in-crease in weight sensitive products due to its superior mechanical properties per its weight. The majority of the industrial carbon fiber is now produced from synthetic precursor polymer such as polyacrylonitrile (PAN). The synthetic precursor un-dergoes two different thermo-chemical processes, namely stabilization and carbonization, to convert into the final product – carbon fiber. The characteristics for these two thermos-chemical processes are quite unique and different from each other. Stabilization process is relatively slow and exothermic and requires controlled heat dissipation to avoid thermal runaway. The carbonization process is rapid and involving a large fiber mass transfer into the gaseous phase with endothermic reactions. While many chemical kinetics studies have been published for the stabilization process, little published research work has focused on the carbonization chemical kinetics in spite of the major mass loss during the carbonization process. As part of our ongoing work to develop a detailed model of the carbonization process we have improved our previous 2-zone fiber model with lumped kinetics releasing pseudo-pure-off-gas by applying the temperature dependent volatile concentration from published literature. Fiber conversion predictions over the fiber travel direction are obtained from the model. A parametric study was conducted on the linear density change of the fiber over the heated length with different temperature and sur-rounding conditions. 1. INTRODUCTION In spite of disadvantages of the manufacturing process, the global demands for the CFRP (Carbon Fiber Reinforced Plastic) among composite materials would be expected to increase based on many independent sources [1,2]. Practically carbon fiber and CFRP share the advantage and disadvantage because almost all carbon fiber produced would be converted into carbon fiber reinforced plastic. The high cost of the carbon composites makes many industries impeded to adapt carbon composites in their products. Therefore, it is of necessity for cost effective high volume carbon fiber manufacturing. This work focuses on the extending and improving the kinetic carbonization model previously developed [3]. The kinetic model focused on the fiber mass loss with temperature and the energy requirements to drive this reaction. This reaction model along with furnace temperature profiles, residence times, and heat transfer models are used to predict the mass loss within the furnace system. This also predicts the generation of off-gas from the carbonization process. The changes in the off-gas composition as a function of the conversion were not considered. The model presented here extends the model to include predictions of the various species of gasses produced at different fiber temperatures and converges. 2. MATHEMATICAL MODELS We have developed a continuous model for carbonization process for stabilized PAN including mass loss rate as a lumped kinetic model using pseudo-pure off-gas and two-zone model for fiber [3]. In the previous model, the off-gas released from the fiber during the carbonization process had been assumed as an ideal gas mixture with fixed concentration of each con-stituent. In this study, we have improved our previous model by adapting more realistic instantaneous off-gas compositions rather than fixed concentration off-gas. 2.1 Chemical Composition of the Off-Gas Of the several published works addressing the off-gas concentrations as a function of either fiber retention time or tempera-ture [4 ~ 6], we have selected the recent work done by Pham et al. [7] which was based off the work published by Fiedler et al. [8]. Fiedler and coworkers oxidized acrylonitrile homopolymer fibers under air environment for 5 hr at 250°C followed by pyrolysis in helium up to 1000°C. Both solid residues and gaseous byproducts (off-gas), of the pyrolysis are graphically giv-en in the paper. In the recent published work by Pham, this graphical data were converted into mathematical expressions by polynomial curve fitting. The authors have provided all the cumulative emission rates for 8 off-gas constituents in Eqs (27)-(34) in their publication. Instead of applying these mathematical expressions into our model directly, we evaluated the
White Paper: Advances in a Lumped Kinetic Model for
Carbonization for Carbon Fiber Manufacturing
Page 1
off-gas mole fractions at the given temperature from cumulative emission rates and adapted these mole fractions as a func-tion of temperature. This formulation is convenient because the volatile release rate in our model depends on not only the temperature of the fiber but also the mass of volatiles inside the fiber. The relationship between cumulative mass / molar emission rates and molar release rate is given below,
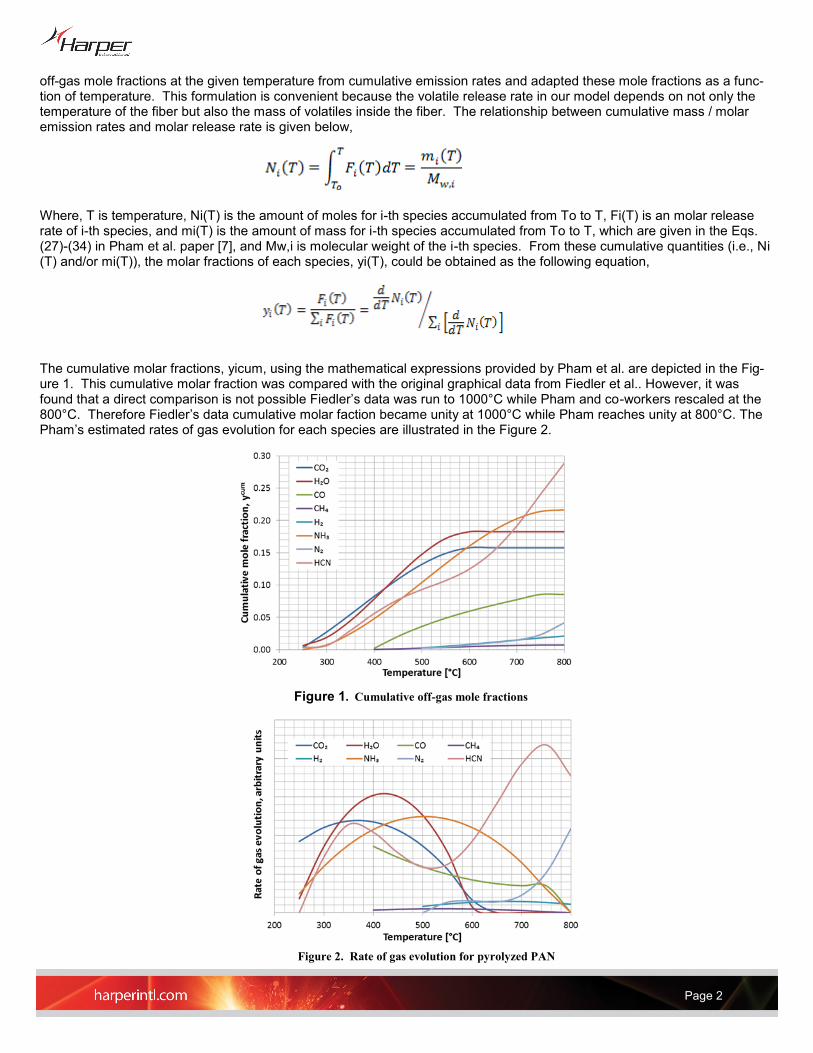
Where, T is temperature, Ni(T) is the amount of moles for i-th species accumulated from To to T, Fi(T) is an molar release rate of i-th species, and mi(T) is the amount of mass for i-th species accumulated from To to T, which are given in the Eqs. (27)-(34) in Pham et al. paper [7], and Mw,i is molecular weight of the i-th species. From these cumulative quantities (i.e., Ni(T) and/or mi(T)), the molar fractions of each species, yi(T), could be obtained as the following equation, The cumulative molar fractions, yicum, using the mathematical expressions provided by Pham et al. are depicted in the Fig-ure 1. This cumulative molar fraction was compared with the original graphical data from Fiedler et al.. However, it was found that a direct comparison is not possible Fiedler’s data was run to 1000°C while Pham and co-workers rescaled at the 800°C. Therefore Fiedler’s data cumulative molar faction became unity at 1000°C while Pham reaches unity at 800°C. The Pham’s estimated rates of gas evolution for each species are illustrated in the Figure 2.
Page 2
Figure 1. Cumulative off-gas mole fractions
Figure 2. Rate of gas evolution for pyrolyzed PAN

The predicted evolution rates (Figure 2) of each gaseous species are a smooth function at within the valid ranges. However eacpolynomial curve fitting. Both mass and molar fractions as a function of temperature are obtained by using Eq. (2) and illustrated h start from a non-zero value at the lower range. This step change on the onset of off-gassing is an imperfection of the in Figure 3. It is also noticeable that the results of the non-continuity of the polynomial fitting in the Figure 3 show up as step changes in the onset of the released gas molar fraction. An example of this is illustrated by the discontinuity of the CO molar fraction around 400°C.
In order to get accurate endothermic reaction energy for the carbonization process, it is of importance to compute the enthal-py of the volatiles with accuracy. The critical temperature and pressure along with its reduced temperature and pressure (@ 1bar and 300°C) were evaluated for all off-gas constituents. From these calculations, it verifies the reasonable assumption that the off-gas is in an ideal gas state inside the LT furnace [9]. The Shomate equation was used to calculate the specific enthalpy of the off-gas at any given temperature and all the Shomate parameters for each chemical component are taken from the NIST Database [10]. 2.2 Mass Loss Rate during Carbonization Process The carbonization process to produce carbon fiber from synthetic precursor polymer is chemically similar to pyrolysis or ther-mal degradation of a polymer. The actual process is very complex and not fully understood. The controlled oxidation pro-cess converts the PAN’s linear structure into a ring structure. During carbonization, side-group elimination releases all other groups except carbon-carbon bonds. We had developed a single step lumped kinetic model for carbonization of stabilized precursor by fitting TGA data available in the literature [11]. Among many possible kinetic expressions for degradation of a polymer, the previously selected simple power law expression (both 1st order and 2nd order) yielded good agreement with the experimental work. The residual fiber mass fraction to its initial mass is illustrated in the Figure 4 with 2 experimental data sets: 1. the original data used for fitting (Modified from Xu et al.) and 2. additional data from Fiedler et al.. As you see in the figure, both independent experimental data shows quite similar trends, but the amount of the released volatile is always larger in the Fiedler’s fiber case at any given temperature. The volumetric mass loss rate for the fiber is given below, where V is volume of specimen in a closed system, A is pre-exponent factor, EA is activation energy, and R is gas constant.
Page 3
Figure 2. Rate of gas evolution for pyrolyzed PAN
Figure 3. Instantaneous off-gas compositions. (A) molar fractions, and (B) mass fractions

2.3 2-Zone Model for Fiber Unlike gaseous phase, the physical properties of the fiber are more complex since they are dependent on not only tempera-ture but also conversion. Furthermore, carbonization might be a continuous series of chemical reactions rather than clearly distinct single process. A 2-discretized-zone model has been developed for the sake of simplicity and an illustrative concep-tual depiction of this model is given in Figure 5.
In this 2-zone model, the physical property at any extent of carbonization is expressed using two pure states of fibers: stabi-lized PAN fiber (white region in Fig. 5) and carbonized fiber (black region in Fig. 5) and its mathematical expression is given as follow
where a is conversion defined below in equation 5. Yi is mass fraction of i-th component, φI and φS are any specific physical properties for intermediate fiber and stabilized PAN fiber, respectively.
Page 4
Figure 4. Residual fiber mass fraction during carbonization: experimental data and fitting
Figure 5. Schematics of discretized 2-zome model for carbonization process

Mass fraction and linear density, , are also changing during the carbonization process. The relationships of conversion to these properties
are given below.
where m is mass of fiber, subscript f denotes final state and subscript o denotes initial state.
Even though it is a simplified model, evaluation of physical properties using this model is still challenging since their properties at a ho-
mogeneous state are not fully known. It is assumed that the product fiber from the LT furnace is similar in composition to carbon fiber
since the mass loss from successor devices (HT furnace) is much lower. In addition carbon fiber composition is also assumed as solid
graphite in spite of impurity of the carbon fiber (maximum 5% of non-carbon atom usually N and small amount of H).
It is very challenging to evaluate the thermodynamic state for Stabilized PAN fiber. The oxidation extent might be a complex function of
the following factors, co-monomer, residence time, applied tension, heating rates, and temperature during the oxidation process. The
thermodynamic state might be non-identical due to different molecular structures. In the literature, to the best knowledge of this author,
no actual measurement data (heat of formation, specific heat and etc.) is available for stabilized PAN fiber. Standard enthalpy of for-
mation of stabilized PAN is taken from our previous work [9] as a successive evaluation from its monomer as it undergoes polymeriza-
tion and stabilization. And the specific heat of the stabilized PAN fiber is assumed as same as PAN fiber and taken from the literature
value [12].
2.4 Mass and Energy Balances
To investigate changes in fiber phase, the control volume is focused on conversion of the solid fiber.
where is fiber mass rate, z is fiver moving direction coordinate, m” is mass transfer flux from solid to gas, Lp is perimeter, Ac is cross-
sectional area, rm,loss is mass loss rate per volume.
The fiber temperature change along the length of the system can be obtained from taking appropriate energy balance. This results in the
ordinary differential equation presented in Equation 11. This equation shows the fiber energy balance with sensible heat effect, enthalpy
change for evolved gas, and heat transfer with surroundings.
where T is temperature of the fiber, is enthalpy change per unit mass of gaseous matter released,. qs is heat flux at the fiber surface, Lp
Page 5

is perimeter, and Cp denotes heat capacity of fiber. Mass and energy balances are closely linked to each other and thus they need to be solved simultaneously. 3. Results Numerical simulation of the process was conducted by solving the systems of non-linear ordinary differential equations given in equations (10) and (11) with kinetic expression (3). The fourth order RK method is applied with step size of 0.001 for di-mensionless length scale. All the physical properties and parameters which have been formulated to be dependent on either temperature or conversion are evaluated with the fourth order RK method. The same fitting kinetic parameters that were used from our previous work [3] were applied here. A baseline case was picked representing realistic operating conditions of a contemporary industrial scale system. The length of the carbonization furnace was assigned as 14 m with 7 equally divid-ed independent heating zones and a linear fiber process speed of 10 m/min. So, the fiber residence time is 1.4 min (84 sec). Our model has been developed as a longitudinal 1D (fiber moving direction) model. Both width and height of the furnace are arbitrary, and the cross-section could be any shape. However, all the geometrical and operational conditions were consid-ered as contemporary industrial carbon fiber manufacturing condition. 3.1 Baseline Result For the baseline case, the precursor fiber was picked as 24k filaments with 1.15 dTex. However, it needs to notify that the dTex is for fresh feedstock not an inlet condition for carbonization furnace which is oxidized within oxidation/stabilization ov-ens. It is reported that oxidized precursor could have either lighter or heavier linear density depending on many aspects such as co-monomers, additives, and operating conditions of oxidation oven. In this study, we assumed oxidation process involves slight linear density decrease (5% mass loss). With this condition the results of the baseline are depicted in Figure 6 ~ Figure 9.
Page 6
Figure 6. Fiber conversion over the fiber travel direction for baseline case

The conversion plot (Figure 6) of fiber has an inflection point: convex in the first half and concave in the later part. In our model, the volatile release rate is governed by both temperature and volatiles mass inside the fiber. As a consequence, the local volatile release rate seems to have several peaks (Figure 7) but in general it has a maximum point in the middle and begins to descend after the maximum point. From these inspections of conversion and local release rate, the carbonization process could be described as composed of 3 different sections: 1. Slow start section, 2. Actively converting section, and 3. Asymptotic approach section. In the slow start section, off-gas release rate is small due to the low temperature, even though there is a high content of volatiles in the fiber. On the other hand, the release rate is slow in the asymptotic approach section because of the low content of volatiles. The fiber temperature profile (Figure 8) shows almost linear increase with small vari-ation even when the heat source temperature boundary condition has step changes. The temperature of the fiber is deter-mined as a result of the local heat balance: 1. heat transfer from the heat source and 2. the endothermic heat of reaction as energy consumption as well as the sensible heat required. Since heat transfer is greater than heat of the reaction, the fiber temperature is always increasing except the last zone where the zone temperature decreases. These two balancing effects are depicted in Figure 9. In this local heat effect figure, the energy supply from heat transfer shows several peaks. In th is model, the main heat transfer mode is thermal radiation between the furnace muffle wall and fiber. As the fiber enters new zone, the temperature difference between the wall and fiber is at a maximum so it has the highest heat transfer rate. This is a bit unrealistic because temperature does not have step changes, but roll-off between the zones and a more gradual transi-tion. The resulting transferred energy is always greater than the consumption by endothermic reaction, and results in the fiber increasing in temperature. In this baseline case, heat transfer between the fiber and surrounding gas (mixture of sweep gas, nitrogen, and off-gas released from the fiber) is not considered.
Page 7
Figure 7. Normalized local volatile release rate
Figure 8. Fiber temperature (blue) and furnace temperature (red) along with length of the furnace

3.2 What-If Scenarios
3.2.1 Different filament count fiber tows The filament count in the fiber was varied to see how conversion and temperature are sensitive to number of filaments. Each conversion profiles are depicted in Figure 10 for 12k, 24k (baseline), and 50k fiber. Final conversion for lighter tow (12k) is higher, while heavy tow (50k) final conversion is less than the baseline case (24k). The final exit conversion window is 88% ~ 95%. The temperature profiles reveal similar trends with the baseline case but different slopes. Basically it requires more time to complete the reaction since more mass has been introduced. Normalized local off-gas release rates are provided in Figure 10 (C). The results appear very similar when normalized with feed rates, while cumulative off-gas flow rates illustrat-ed in Figure 10 (D) shows quite different off-gas flow rates for different fiber tow count. Consequently, more off-gas is need-ed to be vented from the furnace muffle in the case of the heavy tow operation. Non-effective removal of this off-gas could cause problems in operation of the furnace as well as non-uniform quality of the final product.
Page 8
Figure 9. Local heat effect on the fiber
Figure 10. Results for different filament count. (A) Conversions, (B) Temperature, (C) Local off-gas release rates, and (D)
Cumulative off-gas flow rates.

3.2.2 Hindered heat transfer Next ‘what if’ scenario is included heat transfer by surrounding gas. The surrounding gas, mixture of sweep gas and vola-tiles, is not included in this model. It might require a CFD simulation to fully understand flow pattern, flow dead-zone, and local heat transfer effect with regard to surrounding gas. In this simple what if scenario, we are going to assume simple hin-dered heat transfer due to the surrounding gas. The first case is the convective cooling, and we assumed gas temperature is always 100°C lower than the fiber temperature and 10 W/m²K of convective heat transfer coefficient between fiber and surrounding gas. With this condition, results are illustrated in Figure 11. Reviewing the fiber temperature and conversion, the effect of this scenario is a minor impact on each. Another ‘what if’ case is thermally opaque surrounding gas. The sweep gas, nitrogen usually, cannot absorb thermal radiation, while some of the constituents in off-gas can absorb thermal radiation and it could be considered as blockage of thermal radiation from wall to fiber. So we added 20% hindered thermal radiation case. As you seen in the Figure 11, all these conditions do not make a significant effect on fiber conversion. For the hin-dered heat transfer scenarios the exit conversion window is between 90% ~ 93%. If there is either serious flow field perturbation or thermal radiation irregularity along with the width of the furnace this could result in non-uniformities of conversion. This model does not address flow or thermal variations along the width of the fur-nace. To perform an analysis to considering width wide variations, this model would need to be incorporated within a 3D CFD analysis.
Figure 11. Results for different heat transfer cases. (A) Conversions, (B) Temperature, (C) Local off-gas release rates, and (D) Cumulative
off-gas flow rates.
Page 9

3.2..3 Unintentional power loss The last but not least ‘what if’ case is an unexpected power loss in a specific zone. It could be a heating element failure or something else but let’s assume the case with temperature of one zone is unexpectedly down. 2 cases are considered here: 1. Zone 3 temperature drops to 300°C, and 2. Zone 5 temperature drops to 300°C. The results are depicted in Figure 12. As you see in the temperature profiles, there is a negligible final exiting temperature difference even though huge tempera-ture deficit in the middle of zone comparing with the baseline case. On the other hand, there is non-negligible discrepancy found on the final conversions. Its final exit conversion window is 88% ~ 93%. From the Figure 12 (B), the fiber temperature is almost recovered at the next downstream zone from the problematic zone. Also in this zone, off-gas release shows a stiff increase to catch up the impeded conversion due to reduced temperature zone; nevertheless the retarded fiber conversion due to unintentional power loss could not catch up on the baseline conversion. It is not shown here but there is an increased power requirement in the downstream zone to compensate for the lower temperature zone.
Figure 12. Results for unintentional power down cases. (A) Conversions, (B) Temperature, (C) Local off-gas release rates, and (D) Cumulative off-gas flow rates.
4. CONCLUSIONS
We have developed a continuous model for carbonization process for stabilized PAN including mass loss rate as a lumped kinetic using temperature dependent off-gas and a two-zone model for fiber conversion. In this two-zone model for fiber, it was assumed that carbonization occurs from the outer region and penetrates into the center. Kinetic fitting was made from literature TGA data for carbonization of stabilized PAN fiber using the kinetic expressions from degradation of polymer. Many different expressions were applied but conventional 1
st order kinetic provided good agreement with experimental data
and was picked for the model. From the baseline result with realistic operating conditions, the results of the fiber conversion profile can be described in 3
Page 8

sections (slow, active, and asymptotic), while fiber temperature has a roughly linear response with small variations. We have conducted 3 different what-if scenarios: 1. Different filament counts (12k, 24k and 50k), 2. Possible hindered heat transfer due to off-gas, and 3. Unintentional power loss cases. The conversion results from the what-if cases were within a narrow range since the result of the baseline case at the end of the furnace system was in the asymptotic conversion region. This region is not that sensitive due to the low volatile mass faction. However, exit fiber conversion varies 7%, 3%, and 5%, re-spectively. Within our what-if study conditions, the sensitivity toward conversion from greatest to least is filament count, power loss and off-gas cooling effect. Because the final conversion is affected by the filament count (which results in a greater mass rate), the resulting fiber may have different properties while processed under the same operational conditions. The fiber cooling due to off-gas scenario resulted in the smallest change in the fiber conversion compared to the baseline case. The off-gas cooling affect was a bit arbitrary and was not based on the flow dynamics within the carbonization furnace system. Incorporating the mass flow rates, velocities, and locally derived heat transfer coefficients would better predict the impact of the off-gas and nitrogen cover gas. The last but not least scenar-io considered was the different operating temperature profile case due to unintentional power loss. This scenario concluded that the final conversion of the fiber would depend on the fiber temperature history even though the final fiber temperature may be nearly identical. This kind on analysis even with simplification would stimulate and encourage of development of kinetic expression with more data and improve design and performance of industrial furnace. Further works for in-depth analysis is required to look at interaction with fiber and gaseous phase, radial changes inside the fiber tow and variation along the width of the furnace which would affect the system uniformity.
Page 9

5. References
1. Holmes, M. “Global carbon fibre market remains on upward trend” Reinforced Plastics 58 (2014) 38-45 2. Das, S., Warren, J. West., D. and Schexnayder, S.M. “Global Carbon Fiber Composites Supply Chain Compet-itiveness Analysis” Technical Report ORNL/SR-2016/100 NREL/TP-6A50-66071 (2016) 3. Lee, T.-S., Witting, P. R. “Kinetic Model of Stabilized PAN Fiber Mass Loss During Carbonization” SAMPE 2017 Conference Proceeding 4. Morgan, P. Carbon Fibers and Their Composites. Boca Ration, FL: CRC Press, 2005 5. Chung, D. D. L. Carbon Fiber Composites. Boston, MA: Butterworth-Heinemann, 1994 6. Rahaman, M.S.A, Ismail, A.F., and Mustafa, A. “A review of heat treatment on polyacrylonitrile fiber” Polymer Degradation and Stability 92 (2007) 1421-1432 7. Pham, H. H., Lim, Y.-I., Cho, C.-H., and Bang, Y.-H. “Hydrodynamics of low temperature carbonization furnace for production of polyacrylonitrile (PAN)-based carbon fiber” Chemical engineering Research and Design 128 (2017) 192-204 8. Fiedler, A., Fitzer, E., Rozpłoch, F. “PAN Pyrolysis Studied by Gas- and ESR-Analyses” Carbon 11 (1973) 426-428 9. Lee, T.-S., Witting, P. “Computational fluid dynamics (CFD) analysis for off-gas mixing and ventilation inside carbonization furnace during PAN-based carbon fiber manufacturing” SAMPE 2016 Conference Proceeding 10. Linstrom, P.J. and Mallard, W.G., Eds., NIST Chemistry WebBook, NIST Standard Reference Database Number 69, National Institute of Standards and Technology, Gaithersburg MD, 20899, doi:10.18434/T4D303 11. Xu, B., Wu, F., Cao, G.-P., and Yang, Y.-S. “Effect of carbonization temperature on microstructure of PAN-based activated carbon fibers prepared by CO2 activation” New Carbon Materials 21 (2006) 1-5 12. Pyda, M. “Polyacrylonitrile (PAN) Heat Capacity, Enthalpy, Entropy, Gibbs Energy: Datasheet from “from "The Advanced THermal Analysis System (ATHAS) Databank – Polymer Thermodynamics" Release 2014 in SpringerMaterials” (http://materials.springer.com/polymerthermodynamics/docs/athas_0001), Springer-Verlag Berlin Heidelberg & Marek Pyda, 2014 6. Acknowledgments Our most sincere gratitude goes to Dr. Srdjan Simunovic (Distinguished Research Staff, Computer Science and Mathematics Division, Oak Ridge National Laboratory) for his fruitful advice during debugging the computer code to solve the system of ODEs.
Page 6