White-light generation using spatially-structured beams...
10
White-light generation using spatially-structured beams of femtosecond radiation N. Kaya, 1,* J. Strohaber, 1 A. A. Kolomenskii, 1 G. Kaya, 1 H. Schroeder, 2 and H. A. Schuessler, 1 1 Department of Physics, Texas A&M University, College Station, TX 77843-4242, USA 2 Max-Planck-Institut für Quantumoptik,Hans-Kopfermann-Strasse 1, DE-85748 Garching, Germany * [email protected] Abstract: We studied white-light generation in water using spatially- structured beams of femtosecond radiation. By changing the transverse spatial phase of an initial Gaussian beam with a 1D spatial light modulator to that of an Hermite-Gaussian (HG n,m ) mode, we were able to generate beams exhibiting phase discontinuities and steeper intensity gradients. When the spatial phase of an initial Gaussian beam (showing no significant white-light generation) was changed to that of a HG 01 , or HG 11 mode, significant amounts of white-light were produced. Because self-focusing is known to play an important role in white-light generation, the self-focusing lengths of the resulting transverse intensity profiles were used to qualitatively explain this production. Distributions of the laser intensity for beams having step-wise spatial phase variations were modeled using the Fresnel-Kirchhoff integral in the Fresnel approximation and found to be in good agreement with experiment. ©2012 Optical Society of America OCIS codes: (190.5530) Pulse propagation and temporal solitons; (320.7110) Ultrafast nonlinear optics; (190.5940) Self-action effects. References and links 1. R. R. Alfano and S. L. Shapiro, “Emission in the region 4000 to 7000 Å via four-photon coupling in glass,” Phys. Rev. Lett. 24(11), 584–587 (1970). 2. R. R. Alfano, The Supercontinuum Laser Source: Fundamentals with Updated References, 2nd ed. (Springer Science + Business Media, Inc., 2006). 3. N. Bloembergen, “The influence of electron plasma formation on superbroadening in light filaments,” Opt. Commun. 8(4), 285–288 (1973). 4. W. Lee Smith, P. Liu, and N. Bloembergen, “Superbroadening in H2O and D2O by self-focused picosecond pulses from a YAlG: Nd laser,” Phys. Rev. A 15(6), 2396–2403 (1977). 5. R. L. Fork, C. V. Shank, C. Hirlimann, R. Yen, and W. J. Tomlinson, “Femtosecond white-light continuum pulses,” Opt. Lett. 8(1), 1–3 (1983). 6. G. Yang and Y. R. Shen, “Spectral broadening of ultrashort pulses in a nonlinear medium,” Opt. Lett. 9(11), 510–512 (1984). 7. P. B. Corkum, C. Rolland, and T. Srinivasan-Rao, “Supercontinuum generation in gases,” Phys. Rev. Lett. 57(18), 2268–2271 (1986). 8. P. B. Corkum and C. Rolland, “Femtosecond continua produced in gases,” IEEE J. Quantum Electron. 25(12), 2634–2639 (1989). 9. F. A. Ilkov, L. Sh. Ilkova, and S. L. Chin, “Supercontinuum generation versus optical breakdown in CO(2) gas,” Opt. Lett. 18(9), 681–683 (1993). 10. V. François, F. A. Ilkov, and S. L. Chin, “Experimental study of the supercontinuum spectral width evolution in CO2 gas,” Opt. Commun. 99(3-4), 241–246 (1993). 11. G. S. He, G. C. Xu, Y. Cui, and P. N. Prasad, “Difference of spectral superbroadening behavior in Kerr-type and non-Kerr-type liquids pumped with ultrashort laser pulses,” Appl. Opt. 32(24), 4507–4512 (1993). 12. A. Brodeur, F. A. Ilkov, and S. L. Chin, “Beam filamentation and the white light continuum divergence,” Opt. Commun. 129(3-4), 193–198 (1996). 13. J. H. Glownia, J. Misewich, and P. P. Sorokin, “Ultrafast ultraviolet pump-probe apparatus,” J. Opt. Soc. Am. B 3(11), 1573–1579 (1986). #167058 - $15.00 USD Received 18 Apr 2012; revised 19 May 2012; accepted 19 May 2012; published 30 May 2012 (C) 2012 OSA 4 June 2012 / Vol. 20, No. 12 / OPTICS EXPRESS 13337
Transcript of White-light generation using spatially-structured beams...
White-light generation using spatially-structured
beams of femtosecond radiation
N. Kaya,1,*
J. Strohaber,1 A. A. Kolomenskii,
1 G. Kaya,
1 H. Schroeder,
2 and H. A.
Schuessler,1
1Department of Physics, Texas A&M University, College Station, TX 77843-4242, USA 2Max-Planck-Institut für Quantumoptik,Hans-Kopfermann-Strasse 1, DE-85748 Garching, Germany
Abstract: We studied white-light generation in water using spatially- structured beams of femtosecond radiation. By changing the transverse spatial phase of an initial Gaussian beam with a 1D spatial light modulator to that of an Hermite-Gaussian (HGn,m) mode, we were able to generate beams exhibiting phase discontinuities and steeper intensity gradients. When the spatial phase of an initial Gaussian beam (showing no significant white-light generation) was changed to that of a HG01, or HG11 mode, significant amounts of white-light were produced. Because self-focusing is known to play an important role in white-light generation, the self-focusing lengths of the resulting transverse intensity profiles were used to qualitatively explain this production. Distributions of the laser intensity for beams having step-wise spatial phase variations were modeled using the Fresnel-Kirchhoff integral in the Fresnel approximation and found to be in good agreement with experiment.
©2012 Optical Society of America
OCIS codes: (190.5530) Pulse propagation and temporal solitons; (320.7110) Ultrafast nonlinear optics; (190.5940) Self-action effects.
References and links
1. R. R. Alfano and S. L. Shapiro, “Emission in the region 4000 to 7000 Å via four-photon coupling in glass,” Phys. Rev. Lett. 24(11), 584–587 (1970).
2. R. R. Alfano, The Supercontinuum Laser Source: Fundamentals with Updated References, 2nd ed. (Springer Science + Business Media, Inc., 2006).
3. N. Bloembergen, “The influence of electron plasma formation on superbroadening in light filaments,” Opt. Commun. 8(4), 285–288 (1973).
4. W. Lee Smith, P. Liu, and N. Bloembergen, “Superbroadening in H2O and D2O by self-focused picosecond pulses from a YAlG: Nd laser,” Phys. Rev. A 15(6), 2396–2403 (1977).
5. R. L. Fork, C. V. Shank, C. Hirlimann, R. Yen, and W. J. Tomlinson, “Femtosecond white-light continuum pulses,” Opt. Lett. 8(1), 1–3 (1983).
6. G. Yang and Y. R. Shen, “Spectral broadening of ultrashort pulses in a nonlinear medium,” Opt. Lett. 9(11), 510–512 (1984).
7. P. B. Corkum, C. Rolland, and T. Srinivasan-Rao, “Supercontinuum generation in gases,” Phys. Rev. Lett. 57(18), 2268–2271 (1986).
8. P. B. Corkum and C. Rolland, “Femtosecond continua produced in gases,” IEEE J. Quantum Electron. 25(12), 2634–2639 (1989).
9. F. A. Ilkov, L. Sh. Ilkova, and S. L. Chin, “Supercontinuum generation versus optical breakdown in CO(2) gas,” Opt. Lett. 18(9), 681–683 (1993).
10. V. François, F. A. Ilkov, and S. L. Chin, “Experimental study of the supercontinuum spectral width evolution in CO2 gas,” Opt. Commun. 99(3-4), 241–246 (1993).
11. G. S. He, G. C. Xu, Y. Cui, and P. N. Prasad, “Difference of spectral superbroadening behavior in Kerr-type and non-Kerr-type liquids pumped with ultrashort laser pulses,” Appl. Opt. 32(24), 4507–4512 (1993).
12. A. Brodeur, F. A. Ilkov, and S. L. Chin, “Beam filamentation and the white light continuum divergence,” Opt. Commun. 129(3-4), 193–198 (1996).
13. J. H. Glownia, J. Misewich, and P. P. Sorokin, “Ultrafast ultraviolet pump-probe apparatus,” J. Opt. Soc. Am. B 3(11), 1573–1579 (1986).
#167058 - $15.00 USD Received 18 Apr 2012; revised 19 May 2012; accepted 19 May 2012; published 30 May 2012(C) 2012 OSA 4 June 2012 / Vol. 20, No. 12 / OPTICS EXPRESS 13337
14. S. Cussat-Blanc, A. Ivanov, D. Lupinski, and E. Freysz, “KTiOPO4, KTiOAsO4, and KNbO3 crystals for mid-infrared femtosecond optical parametric amplifiers: analysis and comparison,” Appl. Phys. B 70(S1), S247–S252 (2000).
15. T. Kobayashi and A. Shirakawa, “Tunable visible and near-infrared pulse generator in a 5 fs regime,” Appl. Phys. B 70(S1), S239–S246 (2000).
16. T. Kobayashi, T. Saito, and H. Ohtani, “Real-time spectroscopy of transition states in bacteriorhodopsin during retinal isomerization,” Nature 414(6863), 531–534 (2001).
17. P.-L. Hsiung, Y. Chen, T. H. Ko, J. G. Fujimoto, C. J. S. de Matos, S. V. Popov, J. R. Taylor, and V. P. Gapontsev, “Optical coherence tomography using a continuous-wave, high-power, Raman continuum light source,” Opt. Express 12(22), 5287–5295 (2004).
18. E. Hugonnot, M. Somekh, D. Villate, F. Salin, and E. Freysz, “Optical parametric chirped pulse amplification and spectral shaping of a continuum generated in a photonic band gap fiber,” Opt. Express 12(11), 2397–2403 (2004).
19. K. R. Wilson and V. V. Yakovlev, “Ultrafast rainbow: tunable ultrashort pulses from a solid-state kilohertz system,” J. Opt. Soc. Am. B 14(2), 444–448 (1997).
20. E. N. Glezer, Y. Siegal, L. Huang, and E. Mazur, “Laser-induced band-gap collapse in GaAs,” Phys. Rev. B Condens. Matter 51(11), 6959–6970 (1995).
21. M. Wittmann and A. Penzkofer, “Spectral superbroadening of femtosecond laser pulses,” Opt. Commun. 126(4-6), 308–317 (1996).
22. J. K. Ranka, R. W. Schirmer, and A. L. Gaeta, “Observation of Pulse Splitting in Nonlinear Dispersive Media,” Phys. Rev. Lett. 77(18), 3783–3786 (1996).
23. A. Brodeur and S. L. Chin, “Band-gap dependence of the ultrafast white light continuum,” Phys. Rev. Lett. 80(20), 4406–4409 (1998).
24. A. Brodeur and S. L. Chin, “Ultrafast white-light continuum generation and self-focusing in transparent condensed media,” J. Opt. Soc. Am. B 16(4), 637–650 (1999).
25. A. Couairon and A. Mysyrowicz, “Femtosecond �lamentation in transparent media,” Phys. Rep. 441(2-4), 47–189 (2007).
26. J. H. Marburger, “Self-focusing: theory,” Prog. Quantum Electron. 4, 35–110 (1975). 27. A. Dharmadhikari, F. Rajgara, D. Mathur, H. Schroeder, and J. Liu, “Efficient broadband emission from
condensed media irradiated by low-intensity, unfocused, ultrashort laser light,” Opt. Express 13(21), 8555–8564 (2005).
28. H. Schroeder, J. Liu, and S. Chin, “From random to controlled small-scale filamentation in water,” Opt. Express 12(20), 4768–4774 (2004).
29. L. Allen, M. W. Beijersbergen, R. J. C. Spreeuw, and J. P. Woerdman, “Orbital angular momentum of light and the transformation of Laguerre-Gaussian laser modes,” Phys. Rev. A 45(11), 8185–8189 (1992).
30. A. E. Siegman, Lasers (University Science Books, 1986), p. 645. 31. J. Strohaber, G. Kaya, N. Kaya, N. Hart, A. A. Kolomenskii, G. G. Paulus, and H. A. Schuessler, “In situ
tomography of femtosecond optical beams with a holographic knife-edge,” Opt. Express 19(15), 14321–14334 (2011).
32. J. Peatross and M. Ware, “Physics of Light and Optics,” 2011 edition, available at optics.byu.edu. 33. K. Cook, R. McGeorge, A. K. Kar, M. R. Taghizadeh, and R. A. Lamb, “Coherent array of white-light
continuum filaments produced by diffractive microlenses,” Appl. Phys. Lett. 86(2), 021105 (2005).
1. Introduction
An ultrashort pulse propagated through a transparent medium can be transformed into a white-light continuum which can extend from the ultraviolet to the infraredand, and this well-known phenomenon occurs in a wide variety of media [1–12]. The ultrafast white-light generation is useful for various applications such as femtosecond time-resolved spectroscopy, optical pulse compression for the generation of ultrashort pulses, or as a seed pulse for optical parametric amplifiers, and biomedical applications [2,13–20].
Self-phase modulation [5–7], self-steepening [21], and parametric four-photon mixing [6] are some of the mechanisms that have been invoked to explain the white-light generation. However, the primary process responsible for the phenomena of white-light generation is self-focusing, which causes the pulse to compress in space, resulting in a corresponding increase in the peak intensity [7]. When a threshold peak power for a white-light continuum wl
thP is just
above the input pulse power, the beam transformed into white-light continuum appears to the eye as a white spot. As the input peak power is increased to a few wl
thP , a colorful ring pattern
appears surrounding the central spot. The resulting beam appears to the eye as a white light disk surrounded by a distinct, concentric, rainbow-like pattern. Experiments have shown that
#167058 - $15.00 USD Received 18 Apr 2012; revised 19 May 2012; accepted 19 May 2012; published 30 May 2012(C) 2012 OSA 4 June 2012 / Vol. 20, No. 12 / OPTICS EXPRESS 13338

the threshold power wl
thP for white-light generation coincides with the calculated critical power
critP for self-focusing [4,7–10,22]. Experiments conducted by Brodeur and Chin [23,24] have confirmed that white-light generation is triggered by self-focusing. Comparison of the critical power for self-focusing
critP and for white-light continuum wl
thP in several media shows that
wl
crit thP P≃ [24]. Therefore, it should then be noted that
critP and wl
thP are essentially
equivalent. Studies of white-light generation in liquids, which typically have nonlinear contributions
to the refractive index about 103 times larger than that for gases, can reproduce many important features of the processes at much lower laser powers and on a much smaller scale under laboratory conditions [25]. According to Marburger’s formula [26], it holds for the critical power of self-focusing
20
0 2
3.778critP
n n
λπ
= (1)
where 0 800nmλ = , 0 1.33n = , and 16 22 2 10 /n cm W
−= × [23] for water, and one obtains
3.6crit
P MW= . Here, 0λ denotes the laser wavelength, 0n is the linear refractive index of the
medium, and 2n is its nonlinear coefficient. The self-focusing length of the beam with a spatial Gaussian distribution of intensity at the input of the medium [26] is given by:
( )
20 0
1 22
0
0.734
0.852 0.0219sf
crit
n aL
P P
π
λ=
− −
(2)
where P is the beam power and 0a is the radius of the beam profile at the 1/e level of
intensity. The self-focusing length,sf
L , varies as a function of the beam radius, 0a , and the
ratio of the peak power over the critical power for self-focusing, crit
P P . In the present paper we show that by changing the transverse spatial phase of an initial
Gaussian beam to that of an Hermite-Gaussian (HGn,m) mode, we were able to generate beams exhibiting phase discontinuities and steeper intensity gradients. The previous experiments emphasized that the locus of conical emission was controlled by local diffraction catastrophes produced by any kind of aperture [27,28]. In the present case the situation is much clearer. When the spatial phase of an initial Gaussian beam (showing no significant white-light generation) was changed to that of a HG01, or HG11 mode, significant amounts of white-light were produced. The self-focusing lengths determined by the peak powers and radii of the lobes in the resulting transverse intensity profiles were used to qualitatively explain this production, because self-focusing is known to play an important role in white-light generation. Distributions of the laser intensity for beams having step-wise spatial phase variations were modeled using the Huygens-Fresnel-Kirchhoff diffraction formulation in the Fresnel approximation and were found to be in good agreement with experiment.
2. Experimental procedure
In the experiment, an 800nm Ti:sapphire laser system (Spitfire, Spectra Physics) with a typical power of about 1W and pulse duration ~50fs was employed. From Eq. (2), for constant beam power the self-focusing distance is proportional to the square of the beam size so decreasing the beam size decreases the self-focusing distance. Therefore, to shorten the length for white-light formation we reduced the beam size by using an optical telescope. For generating taylored phase variations we used a Spatial Light Modulator (SLM), Jenoptik SLM-S 640/12, which is a liquid crystal modulator with 640 stripe-shaped pixels and 12 bit
#167058 - $15.00 USD Received 18 Apr 2012; revised 19 May 2012; accepted 19 May 2012; published 30 May 2012(C) 2012 OSA 4 June 2012 / Vol. 20, No. 12 / OPTICS EXPRESS 13339
resolution to change the transverse spatial phase of an initial Gaussian beam to that of an HGn,m mode. Its active area is 63.7 mm x 7 mm, and the transmission for a wavelength range (430nm-800nm) is >75%. In the following the formation and recording of the resulting transverse intensity profiles together with their analytical form are presented. Subsequently the experiments of white-light generation of these beams are described.
2.1 Experimental formation of HG beams
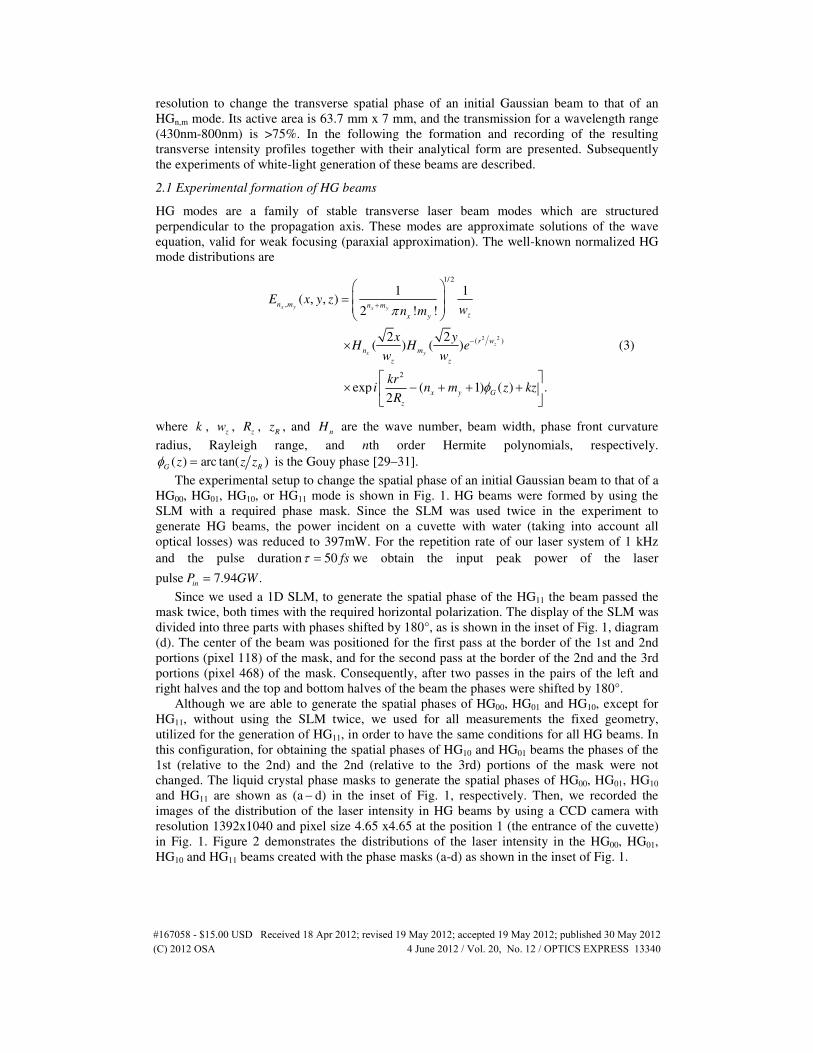
HG modes are a family of stable transverse laser beam modes which are structured perpendicular to the propagation axis. These modes are approximate solutions of the wave equation, valid for weak focusing (paraxial approximation). The well-known normalized HG mode distributions are
2 2
1/2
,
( )
2
1 1( , , )
2 ! !
2 2( ) ( )
exp ( 1) ( ) .2
x y x y
z
x y
n m n m
zx y
r w
n m
z z
x y G
z
E x y zwn m
x yH H e
w w
kri n m z kz
R
π
φ
+
−
=
×
× − + + +
(3)
where k , z
w , z
R , R
z , and n
H are the wave number, beam width, phase front curvature radius, Rayleigh range, and nth order Hermite polynomials, respectively.
( ) arc tan( )G R
z z zφ = is the Gouy phase [29–31]. The experimental setup to change the spatial phase of an initial Gaussian beam to that of a
HG00, HG01, HG10, or HG11 mode is shown in Fig. 1. HG beams were formed by using the SLM with a required phase mask. Since the SLM was used twice in the experiment to generate HG beams, the power incident on a cuvette with water (taking into account all optical losses) was reduced to 397mW. For the repetition rate of our laser system of 1 kHz and the pulse duration 50 fsτ = we obtain the input peak power of the laser
pulse 7.94 .in
P GW= Since we used a 1D SLM, to generate the spatial phase of the HG11 the beam passed the
mask twice, both times with the required horizontal polarization. The display of the SLM was divided into three parts with phases shifted by 180°, as is shown in the inset of Fig. 1, diagram (d). The center of the beam was positioned for the first pass at the border of the 1st and 2nd portions (pixel 118) of the mask, and for the second pass at the border of the 2nd and the 3rd portions (pixel 468) of the mask. Consequently, after two passes in the pairs of the left and right halves and the top and bottom halves of the beam the phases were shifted by 180°.
Although we are able to generate the spatial phases of HG00, HG01 and HG10, except for HG11, without using the SLM twice, we used for all measurements the fixed geometry, utilized for the generation of HG11, in order to have the same conditions for all HG beams. In this configuration, for obtaining the spatial phases of HG10 and HG01 beams the phases of the 1st (relative to the 2nd) and the 2nd (relative to the 3rd) portions of the mask were not changed. The liquid crystal phase masks to generate the spatial phases of HG00, HG01, HG10 and HG11 are shown as (a − d) in the inset of Fig. 1, respectively. Then, we recorded the images of the distribution of the laser intensity in HG beams by using a CCD camera with resolution 1392x1040 and pixel size 4.65 x4.65 at the position 1 (the entrance of the cuvette) in Fig. 1. Figure 2 demonstrates the distributions of the laser intensity in the HG00, HG01, HG10 and HG11 beams created with the phase masks (a-d) as shown in the inset of Fig. 1.
#167058 - $15.00 USD Received 18 Apr 2012; revised 19 May 2012; accepted 19 May 2012; published 30 May 2012(C) 2012 OSA 4 June 2012 / Vol. 20, No. 12 / OPTICS EXPRESS 13340
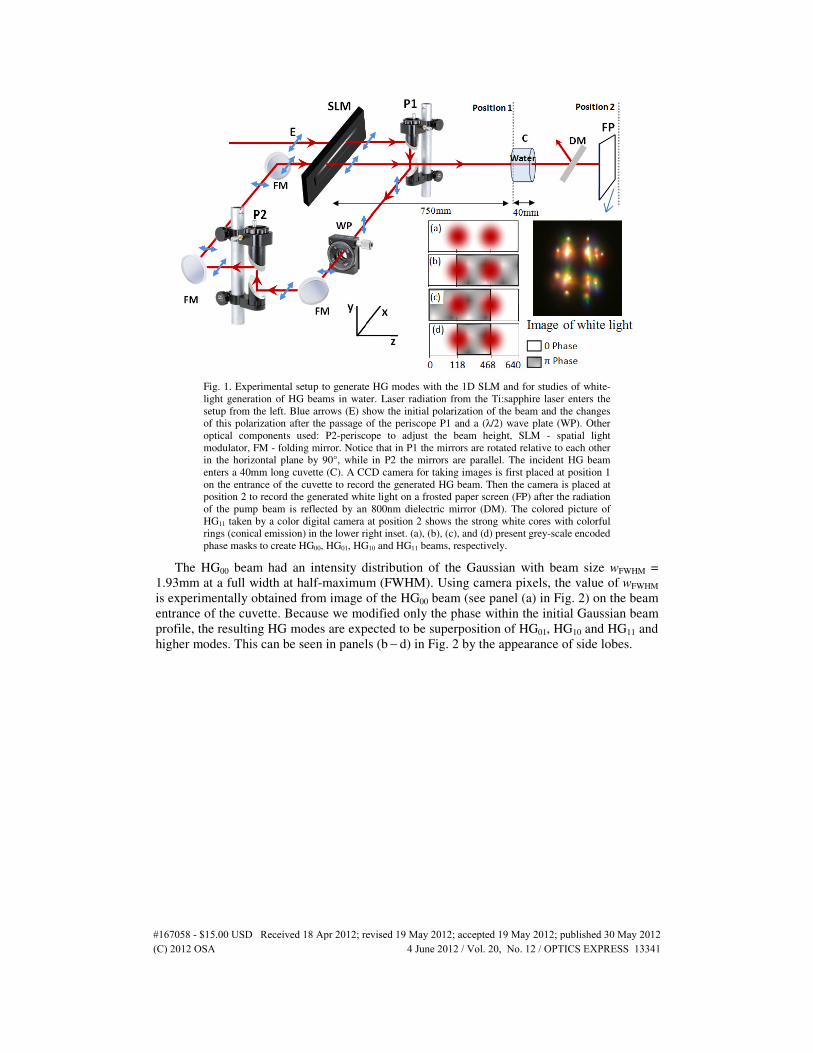
Fig. 1. Experimental setup to generate HG modes with the 1D SLM and for studies of white-light generation of HG beams in water. Laser radiation from the Ti:sapphire laser enters the setup from the left. Blue arrows (E) show the initial polarization of the beam and the changes of this polarization after the passage of the periscope P1 and a (λ/2) wave plate (WP). Other optical components used: P2-periscope to adjust the beam height, SLM - spatial light modulator, FM - folding mirror. Notice that in P1 the mirrors are rotated relative to each other in the horizontal plane by 90°, while in P2 the mirrors are parallel. The incident HG beam enters a 40mm long cuvette (C). A CCD camera for taking images is first placed at position 1 on the entrance of the cuvette to record the generated HG beam. Then the camera is placed at position 2 to record the generated white light on a frosted paper screen (FP) after the radiation of the pump beam is reflected by an 800nm dielectric mirror (DM). The colored picture of HG11 taken by a color digital camera at position 2 shows the strong white cores with colorful rings (conical emission) in the lower right inset. (a), (b), (c), and (d) present grey-scale encoded phase masks to create HG00, HG01, HG10 and HG11 beams, respectively.
The HG00 beam had an intensity distribution of the Gaussian with beam size wFWHM = 1.93mm at a full width at half-maximum (FWHM). Using camera pixels, the value of wFWHM is experimentally obtained from image of the HG00 beam (see panel (a) in Fig. 2) on the beam entrance of the cuvette. Because we modified only the phase within the initial Gaussian beam profile, the resulting HG modes are expected to be superposition of HG01, HG10 and HG11 and higher modes. This can be seen in panels (b − d) in Fig. 2 by the appearance of side lobes.
#167058 - $15.00 USD Received 18 Apr 2012; revised 19 May 2012; accepted 19 May 2012; published 30 May 2012(C) 2012 OSA 4 June 2012 / Vol. 20, No. 12 / OPTICS EXPRESS 13341

Fig. 2. The measured distributions of the laser intensity in the HG00, HG01, HG10 and HG11 beams. Each laser distribution has been peak normalized. HG beams in panels (a − d) are created with the phase masks (a − d) as shown in the inset of Fig. 1.
2.2 Calculations for HG modes: Apertures with phase changes
The analytical solutions of the distribution of the laser intensity in HG beams are obtained in the form of the diffraction integral by using the Fresnel approximation. In the Fresnel approximation [32], we have the expression
2 2
2 2( )
2 ( ) ( ' ')2( , , ) ( ', ', 0) ' '
ki x y
k kikd d i x y i xx yyd d
aperture
ie eE x y z d E x y z e e dx dy
dλ
+′ ′+ − +
= ≅ − =∫∫ (4)
where ( ', ', 0)E x y z = is the scalar amplitude of the initial beam at the position of the SLM,
2k π λ= is the wave number, λ is the wavelength of the beam, d is the distance in z direction after taking the changes of the phase on SLM. When we were generating the HG11 mode, there was a 20cm distance ( d∆ ) between the 1st and 2nd passes. Because the distance
d∆ was much smaller than the Rayleigh range ( 0d z∆ << ), we neglected the propagation of
the beam over the distance d∆ . The field before incidence on the SLM was assumed to
be2 2 2
0( )/0( ', ', 0) x y w
E x y z E e′ ′− += = with beam size, w0 ( 0 / 2 ln 2
FWHMw w= ). After the SLM,
taking into account changes of the phase imposed by the SLM mask ( ', ')x yϕ , we
obtain2 2 2
0( ) / ( , )0( ', ', 0) x y w i x yE x y z E e e ϕ′ ′ ′ ′− += = . Consequently, we have the expression
2 2 2 22 2
2
( )2 ( ) ( ' ') ( , )2
0( , , ) ' '.o
ki x y x y k kikd d i x y i xx yy
w i x yd die e
E x y z d E e e e e dx dyd
ϕ
λ
+ ′ ′+∞ ∞ − ′ ′+ − + ′ ′
−∞ −∞
= ≅ − ∫ ∫ (5)
Since for HG modes, where the neighboring modal lobes are out of phase byπ , we can
factorize the phase factor as ( )( )( ', ') yxi yi xi x ye e eϕϕϕ ′′= , the integrals over x and y coordinates are
independent. The expressions become completely defined after the phases for each HG mode are determined. As an example, the phases for HG11 mode for x and y directions were defined as
#167058 - $15.00 USD Received 18 Apr 2012; revised 19 May 2012; accepted 19 May 2012; published 30 May 2012(C) 2012 OSA 4 June 2012 / Vol. 20, No. 12 / OPTICS EXPRESS 13342
0 0 0
( ) and ( ) .0 0 0
x yx y
x y
πϕ ϕ
π
′ ′→ −∞ < < → −∞ < < ′ ′= = ′ ′→ < < ∞ → < < ∞
(6)
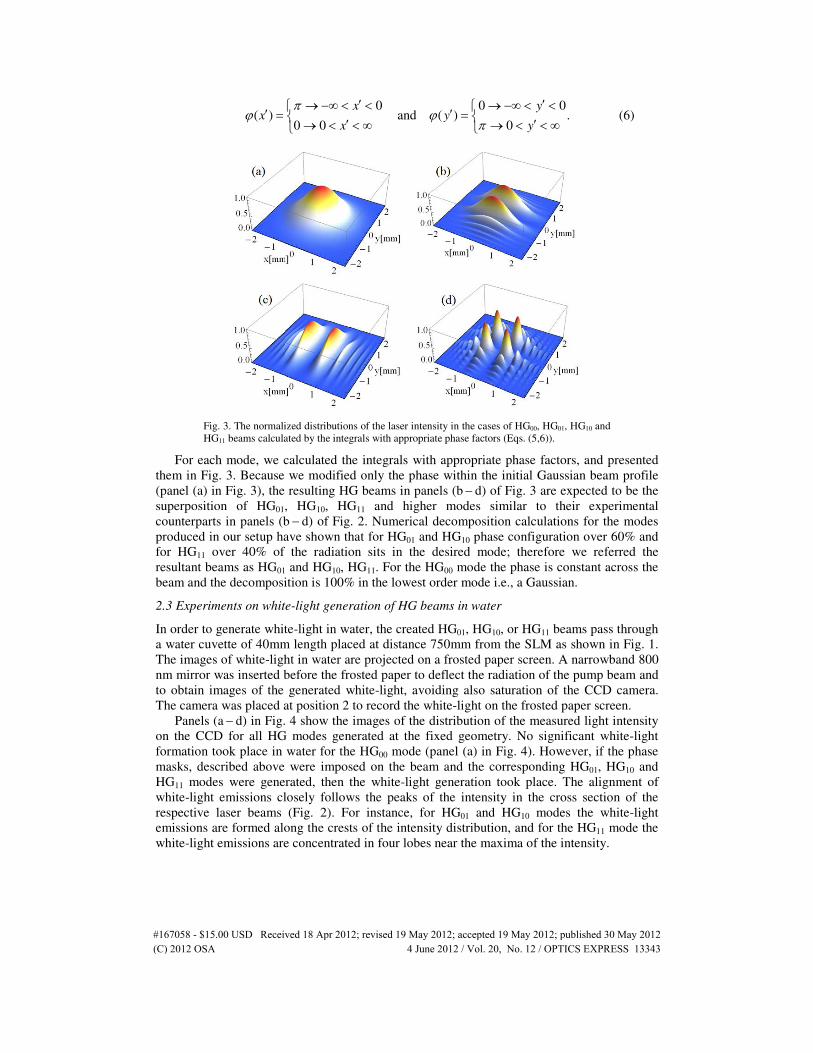
Fig. 3. The normalized distributions of the laser intensity in the cases of HG00, HG01, HG10 and HG11 beams calculated by the integrals with appropriate phase factors (Eqs. (5,6)).
For each mode, we calculated the integrals with appropriate phase factors, and presented them in Fig. 3. Because we modified only the phase within the initial Gaussian beam profile (panel (a) in Fig. 3), the resulting HG beams in panels (b − d) of Fig. 3 are expected to be the superposition of HG01, HG10, HG11 and higher modes similar to their experimental counterparts in panels (b − d) of Fig. 2. Numerical decomposition calculations for the modes produced in our setup have shown that for HG01 and HG10 phase configuration over 60% and for HG11 over 40% of the radiation sits in the desired mode; therefore we referred the resultant beams as HG01 and HG10, HG11. For the HG00 mode the phase is constant across the beam and the decomposition is 100% in the lowest order mode i.e., a Gaussian.
2.3 Experiments on white-light generation of HG beams in water
In order to generate white-light in water, the created HG01, HG10, or HG11 beams pass through a water cuvette of 40mm length placed at distance 750mm from the SLM as shown in Fig. 1. The images of white-light in water are projected on a frosted paper screen. A narrowband 800 nm mirror was inserted before the frosted paper to deflect the radiation of the pump beam and to obtain images of the generated white-light, avoiding also saturation of the CCD camera. The camera was placed at position 2 to record the white-light on the frosted paper screen.
Panels (a − d) in Fig. 4 show the images of the distribution of the measured light intensity on the CCD for all HG modes generated at the fixed geometry. No significant white-light formation took place in water for the HG00 mode (panel (a) in Fig. 4). However, if the phase masks, described above were imposed on the beam and the corresponding HG01, HG10 and HG11 modes were generated, then the white-light generation took place. The alignment of white-light emissions closely follows the peaks of the intensity in the cross section of the respective laser beams (Fig. 2). For instance, for HG01 and HG10 modes the white-light emissions are formed along the crests of the intensity distribution, and for the HG11 mode the white-light emissions are concentrated in four lobes near the maxima of the intensity.
#167058 - $15.00 USD Received 18 Apr 2012; revised 19 May 2012; accepted 19 May 2012; published 30 May 2012(C) 2012 OSA 4 June 2012 / Vol. 20, No. 12 / OPTICS EXPRESS 13343

Fig. 4. The measured white-light intensity distributions on the CCD for all HG modes generated at the fixed geometry. Intensities are normalized respect to max white-light generation peak in HG11.
3. Discussion
The generation of white-light that we observed can be justified in the following way. The resulting transverse intensity profiles of HG beams consist of several bright spots (intensity lobes), so we can assess strong white-light generation of the resulting HG beams by calculating the critical powers and self-focusing distances corresponding to these lobes. To trace these parameters for each of the observed lobes we presented each of the observed intensity distributions in top-view panels in Fig. 5.
The Gaussian beam (HG00) on the entrance of the cuvette has a beam radiusa
w = 1.16mm
at 1/e value of the peak intensity (see panel (a) in Fig. 5). The value of a
w is obtained from
the beam size wFWHM = 1.93mm at FWHM by using the relation / 2 ln 2a FWHM
w w= . For the HG11 beam configuration the strong white-light generations are concentrated in four central lobes near the maxima of the intensity. We assume that the intensity distribution of each lobe can be approximated by a Gaussian profile (see panel (d) in Fig. 5). We measured the radius
dw = 0.17
aw for one of the lobes of HG11 beam profile. For HG01 or HG10 beams the
white-light generations are produced along the crests in the intensity distribution (see panels (b and c) in Fig. 5). One of the crests of HG01 has beam sizes at 1/e levels of 1.16mm and 0.19 mm in x and y directions of the crest respectively. One can count 5 well pronounced and partially overlapped intensity distribution peaks along x direction and choose one of the intense lobes on the one of the crests of HG01 as a Gaussian shaped sub-beam with a radius
bw = 0.19mm. Similarly, for HG10 the chosen Gaussian lobe radius is
cw =
bw . Again, the
values of the beam radii refer to the 1/e levels of the lobes in the images. By using the radii and maximal intensities of the main lobes of HG01, HG10 and HG11 beams, we calculate the corresponding input powers 40.81 60.41a b d
int int intP P P= = and c b
int intP P≃ .
#167058 - $15.00 USD Received 18 Apr 2012; revised 19 May 2012; accepted 19 May 2012; published 30 May 2012(C) 2012 OSA 4 June 2012 / Vol. 20, No. 12 / OPTICS EXPRESS 13344
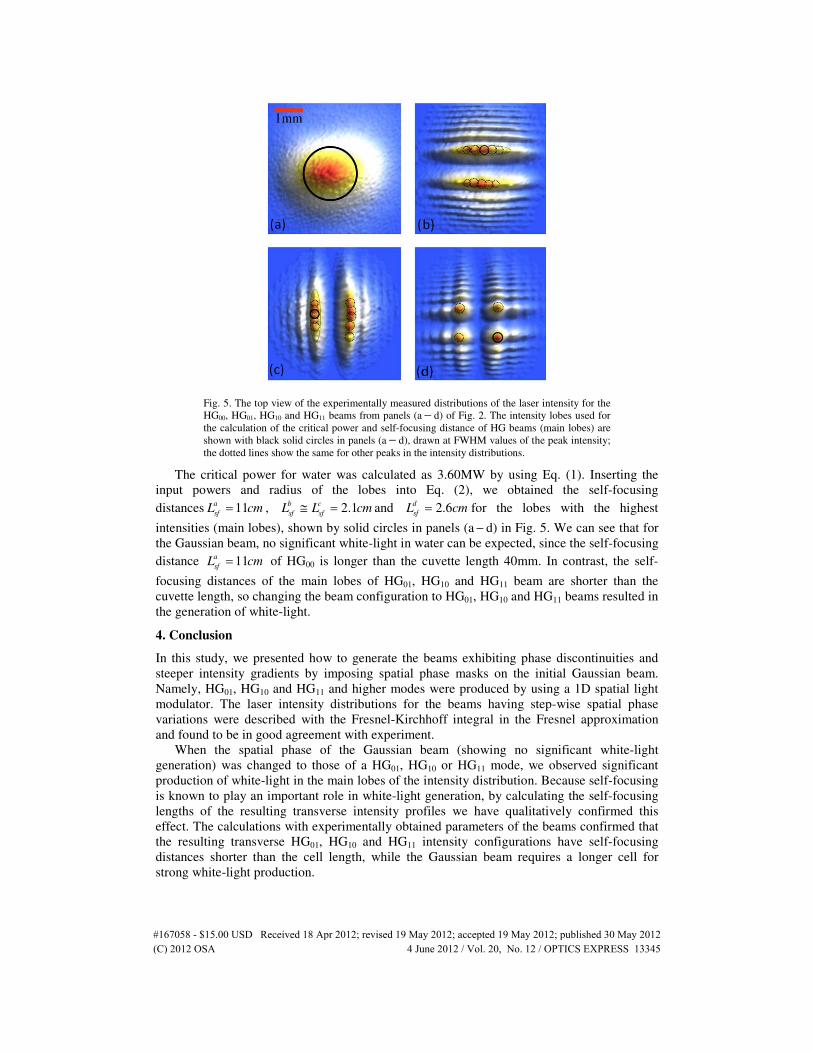
Fig. 5. The top view of the experimentally measured distributions of the laser intensity for the HG00, HG01, HG10 and HG11 beams from panels (a − d) of Fig. 2. The intensity lobes used for the calculation of the critical power and self-focusing distance of HG beams (main lobes) are shown with black solid circles in panels (a − d), drawn at FWHM values of the peak intensity; the dotted lines show the same for other peaks in the intensity distributions.
The critical power for water was calculated as 3.60MW by using Eq. (1). Inserting the input powers and radius of the lobes into Eq. (2), we obtained the self-focusing distances 11a
sfL cm= , 2.1b c
sf sfL L cm≅ = and 2.6d
sfL cm= for the lobes with the highest
intensities (main lobes), shown by solid circles in panels (a − d) in Fig. 5. We can see that for the Gaussian beam, no significant white-light in water can be expected, since the self-focusing distance 11a
sfL cm= of HG00 is longer than the cuvette length 40mm. In contrast, the self-
focusing distances of the main lobes of HG01, HG10 and HG11 beam are shorter than the cuvette length, so changing the beam configuration to HG01, HG10 and HG11 beams resulted in the generation of white-light.
4. Conclusion
In this study, we presented how to generate the beams exhibiting phase discontinuities and steeper intensity gradients by imposing spatial phase masks on the initial Gaussian beam. Namely, HG01, HG10 and HG11 and higher modes were produced by using a 1D spatial light modulator. The laser intensity distributions for the beams having step-wise spatial phase variations were described with the Fresnel-Kirchhoff integral in the Fresnel approximation and found to be in good agreement with experiment.
When the spatial phase of the Gaussian beam (showing no significant white-light generation) was changed to those of a HG01, HG10 or HG11 mode, we observed significant production of white-light in the main lobes of the intensity distribution. Because self-focusing is known to play an important role in white-light generation, by calculating the self-focusing lengths of the resulting transverse intensity profiles we have qualitatively confirmed this effect. The calculations with experimentally obtained parameters of the beams confirmed that the resulting transverse HG01, HG10 and HG11 intensity configurations have self-focusing distances shorter than the cell length, while the Gaussian beam requires a longer cell for strong white-light production.
#167058 - $15.00 USD Received 18 Apr 2012; revised 19 May 2012; accepted 19 May 2012; published 30 May 2012(C) 2012 OSA 4 June 2012 / Vol. 20, No. 12 / OPTICS EXPRESS 13345
There is only one beam on the output of the setup so the lobes “beams” in this beam are mutually coherent. Coherence of white light sources from single laser beam was studied and confirmed in [33]. The coherence of the white light radiation is an important aspect, and the beam lobes of coherent white-light radiation can be used for spectroscopy and pump-probe experiments. This aspect is the subject of our future studies.
Acknowledgments
This work was partially supported by the Robert A. Welch Foundation (grant No. A1546), the National Science Foundation (NSF) (grants Nos. 0722800 and 0555568), and the U.S. Army Research Office (grant No: W911NF-07-1-0475).
#167058 - $15.00 USD Received 18 Apr 2012; revised 19 May 2012; accepted 19 May 2012; published 30 May 2012(C) 2012 OSA 4 June 2012 / Vol. 20, No. 12 / OPTICS EXPRESS 13346