WHIRLPOOL CORPORATIONd18rn0p25nwr6d.cloudfront.net/CIK-0000106640/5108f98e-ce8d-4aa2-98e6-2... ·...
122
UNITED STATES SECURITIES AND EXCHANGE COMMISSION WASHINGTON, D.C. 20549 FORM 10-K (Mark One) x ANNUAL REPORT PURSUANT TO SECTION 13 OR 15(d) OF THE SECURITIES EXCHANGE ACT OF 1934 For the fiscal year ended December 31, 2018 OR o TRANSI TION REPORT PURSUANT TO SECTION 13 OR 15(d) OF THE SECURITIES EXCHANGE ACT OF 1934 For the transition period from _______ to _______ Commission file number 1-3932 WHIRLPOOL CORPORATION (Exact name of registrant as specified in its charter) Delaware 38-1490038 (State of Incorporation) (I.R.S. Employer Identification No.) 2000 North M-63, Benton Harbor, Michigan 49022-2692 (Address of principal executive offices) (Zip Code) Registrant's telephone number, including area code (269) 923-5000 Securities registered pursuant to Section 12(b) of the Act: Title of each class Name of each exchange on which registered Common stock, par value $1 per share Chicago Stock Exchange and New York Stock Exchange 0.625% Senior Notes due 2020 New York Stock Exchange Securities registered pursuant to Section 12(g) of the Act: NONE Indicate by check mark if the registrant is a well-known seasoned issuer, as defined in Rule 405 of the Securities Act. Yes ý No ¨ Indicate by check mark if the registrant is not required to file reports pursuant to Section 13 or Section 15(d) of the Exchange Act. Yes ¨ No ý Indicate by check mark whether the registrant (1) has filed all reports required to be filed by Section 13 or 15(d) of the Exchange Act during the preceding 12 months (or for such shorter period that the registrant was required to file such reports), and (2) has been subject to such filing requirements for the past 90 days. Yes ý No ¨ Indicate by check mark whether the registrant has submitted electronically every Interactive Data File required to be submitted pursuant to Rule 405 of Regulation S-T (§ 232.405 of this chapter) during the preceding 12 months (or for such shorter period that the registrant was required to submit such files). Yes ý No ¨ Indicate by check mark if disclosure of delinquent filers pursuant to Item 405 of Regulation S-K (§229.405 of this chapter) is not contained herein, and will not be contained, to the best of the registrant's knowledge, in definitive proxy or information statements incorporated by reference in Part III of this Form 10-K or any amendment to this Form 10-K. ý Indicate by check mark whether the registrant is a large accelerated filer, an accelerated filer, a non-accelerated filer, a smaller reporting company, or an emerging growth company. See the definitions of "large accelerated filer," "accelerated filer," "smaller reporting company," and "emerging growth company" in Rule 12b-2 of the Exchange Act. (Check one) Large accelerated filer ý Accelerated filer ¨ Non-accelerated filer ¨ (Do not check if a smaller reporting company) Smaller reporting company ¨ Emerging growth company ¨ If an emerging growth company, indicate by check mark if the registrant has elected not to use the extended transition period for complying with any new or revised financial accounting standards provided pursuant to Section 13(a) of the Exchange Act. o Indicate by check mark whether the registrant is a shell company (as defined in Rule 12b-2 of the Act). Yes ¨ No ý The aggregate market value of voting common stock of the registrant held by stockholders not including voting stock held by directors and executive officers of the registrant and certain employee plans of the registrant (the exclusion of such shares shall not be deemed an admission by the registrant that any such person is an affiliate of the registrant) at the close of business on June 29, 2018 (the last business day of the registrant's most recently completed second fiscal quarter) was $9,182,730,950 . On February 8, 2019 , the registrant had 63,569,688 shares of common stock outstanding. DOCUMENTS INCORPORATED BY REFERENCE Portions of the following documents are incorporated herein by reference into the Part of the Form 10-K indicated: Document Part of Form 10-K into which incorporated The registrant's proxy statement for the 2019 annual meeting of stockholders (the "Proxy Statement") Part III
Transcript of WHIRLPOOL CORPORATIONd18rn0p25nwr6d.cloudfront.net/CIK-0000106640/5108f98e-ce8d-4aa2-98e6-2... ·...
UNITED STATES SECURITIES AND EXCHANGE COMMISSIONWASHINGTON, D.C. 20549
FORM 10-K(Mark One)
x ANNUAL REPORT PURSUANT TO SECTION 13 OR 15(d) OF THE SECURITIES EXCHANGE ACT OF 1934For the fiscal year ended December 31, 2018
OR
o TRANSITION REPORT PURSUANT TO SECTION 13 OR 15(d) OF THE SECURITIES EXCHANGE ACT OF 1934
For the transition period from _______ to _______Commission file number 1-3932
WHIRLPOOL CORPORATION(Exact name of registrant as specified in its charter)
Delaware 38-1490038(State of Incorporation) (I.R.S. Employer Identification No.)
2000 North M-63, Benton Harbor, Michigan 49022-2692(Address of principal executive offices) (Zip Code)
Registrant's telephone number, including area code (269) 923-5000Securities registered pursuant to Section 12(b) of the Act:
Title of each class Name of each exchange on which registeredCommon stock, par value $1 per share Chicago Stock Exchange and New York Stock Exchange
0.625% Senior Notes due 2020 New York Stock ExchangeSecurities registered pursuant to Section 12(g) of the Act: NONE
Indicate by check mark if the registrant is a well-known seasoned issuer, as defined in Rule 405 of the Securities Act. Yes ý No ¨Indicate by check mark if the registrant is not required to file reports pursuant to Section 13 or Section 15(d) of the Exchange Act. Yes ¨ No ýIndicate by check mark whether the registrant (1) has filed all reports required to be filed by Section 13 or 15(d) of the Exchange Act duringthe preceding 12 months (or for such shorter period that the registrant was required to file such reports), and (2) has been subject to suchfiling requirements for the past 90 days. Yes ý No ¨Indicate by check mark whether the registrant has submitted electronically every Interactive Data File required to be submitted pursuant toRule 405 of Regulation S-T (§ 232.405 of this chapter) during the preceding 12 months (or for such shorter period that the registrantwas required to submit such files). Yes ý No ¨Indicate by check mark if disclosure of delinquent filers pursuant to Item 405 of Regulation S-K (§229.405 of this chapter) is not containedherein, and will not be contained, to the best of the registrant's knowledge, in definitive proxy or information statements incorporated byreference in Part III of this Form 10-K or any amendment to this Form 10-K. ý
Indicate by check mark whether the registrant is a large accelerated filer, an accelerated filer, a non-accelerated filer, a smaller reportingcompany, or an emerging growth company. See the definitions of "large accelerated filer," "accelerated filer," "smaller reporting company," and "emerginggrowth company" in Rule 12b-2 of the Exchange Act.(Check one) Large accelerated filer ý Accelerated filer ¨ Non-accelerated filer ¨ (Do not check if a smaller reporting company) Smaller reporting company ¨ Emerging growth company ¨If an emerging growth company, indicate by check mark if the registrant has elected not to use the extended transition period for complying with any new orrevised financial accounting standards provided pursuant to Section 13(a) of the Exchange Act. oIndicate by check mark whether the registrant is a shell company (as defined in Rule 12b-2 of the Act). Yes ¨ No ýThe aggregate market value of voting common stock of the registrant held by stockholders not including voting stock held by directors and executive officers ofthe registrant and certain employee plans of the registrant (the exclusion of such shares shall not be deemed an admission by the registrant that any suchperson is an affiliate of the registrant) at the close of business on June 29, 2018 (the last business day of the registrant's most recently completed second fiscalquarter) was $9,182,730,950 .On February 8, 2019 , the registrant had 63,569,688 shares of common stock outstanding.
DOCUMENTS INCORPORATED BY REFERENCEPortions of the following documents are incorporated herein by reference into the Part of the Form 10-K indicated:
Document Part of Form 10-K into which incorporatedThe registrant's proxy statement for the 2019 annual meeting of stockholders (the "Proxy Statement") Part III

WHIRLPOOL CORPORATION
ANNUAL REPORT ON FORM 10-KFor the fiscal year ended December 31, 2018
TABLE OF CONTENTS
PAGEPART I
Item 1. Business 3Item 1A. Risk Factors 9Item 1B. Unresolved Staff Comments 17Item 2. Properties 18Item 3. Legal Proceedings 18Item 4. Mine Safety Disclosures 18
PART II
Item 5. Market for Registrant's Common Equity, Related Stockholder Matters and Issuer Purchases of EquitySecurities
19
Item 6. Selected Financial Data 20Item 7. Management's Discussion and Analysis of Financial Condition and Results of Operations 22Item 7A. Quantitative and Qualitative Disclosures about Market Risk 43Item 8. Financial Statements and Supplementary Data 44Item 9. Changes in and Disagreements with Accountants on Accounting and Financial Disclosure 93Item 9A. Controls and Procedures 93Item 9B. Other Information 93
PART III Item 10. Directors, Executive Officers and Corporate Governance 94Item 11. Executive Compensation 94Item 12. Security Ownership of Certain Beneficial Owners and Management and Related Stockholder Matters 94Item 13. Certain Relationships and Related Transactions, and Director Independence 95Item 14. Principal Accounting Fees and Services 95
PART IV Item 15. Exhibits, Financial Statement Schedules 96Item 16. Form 10-K Summary 96
SIGNATURES 103
PART I
ITEM 1. BUSINESS
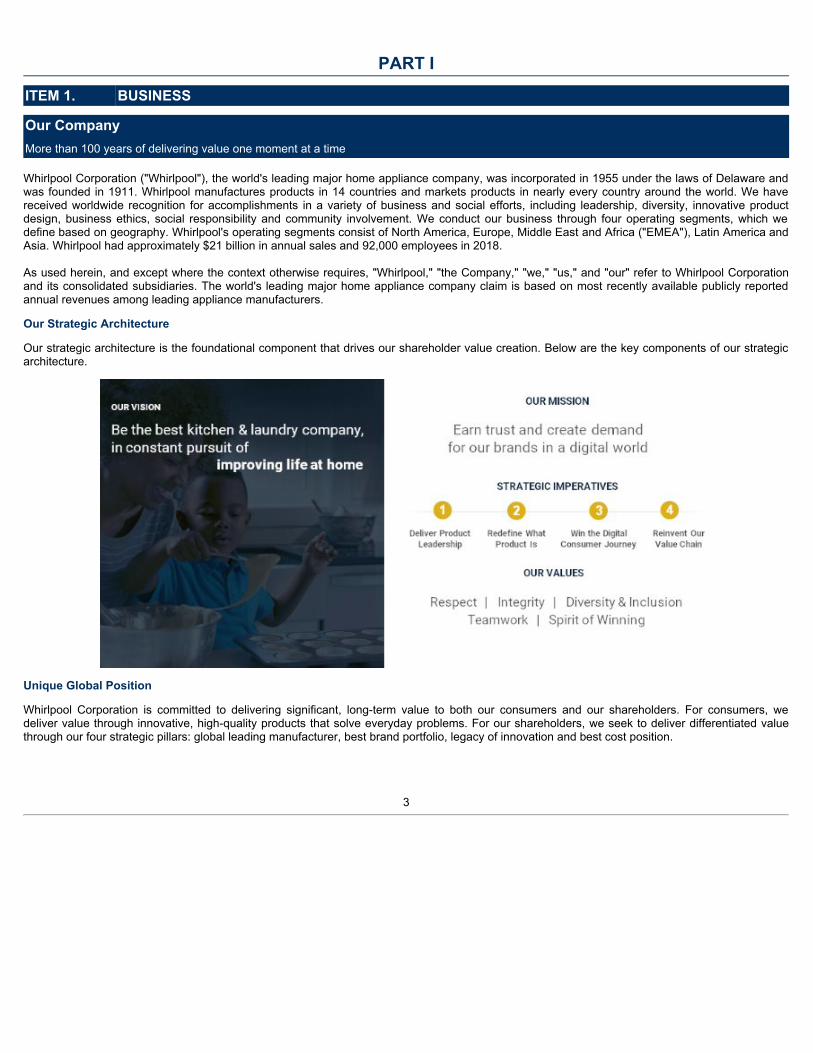
Our CompanyMore than 100 years of delivering value one moment at a time
Whirlpool Corporation ("Whirlpool"), the world's leading major home appliance company, was incorporated in 1955 under the laws of Delaware andwas founded in 1911. Whirlpool manufactures products in 14 countries and markets products in nearly every country around the world. We havereceived worldwide recognition for accomplishments in a variety of business and social efforts, including leadership, diversity, innovative productdesign, business ethics, social responsibility and community involvement. We conduct our business through four operating segments, which wedefine based on geography. Whirlpool's operating segments consist of North America, Europe, Middle East and Africa ("EMEA"), Latin America andAsia. Whirlpool had approximately $21 billion in annual sales and 92,000 employees in 2018.
As used herein, and except where the context otherwise requires, "Whirlpool," "the Company," "we," "us," and "our" refer to Whirlpool Corporationand its consolidated subsidiaries. The world's leading major home appliance company claim is based on most recently available publicly reportedannual revenues among leading appliance manufacturers.
Our Strategic Architecture
Our strategic architecture is the foundational component that drives our shareholder value creation. Below are the key components of our strategicarchitecture.
Unique Global Position
Whirlpool Corporation is committed to delivering significant, long-term value to both our consumers and our shareholders. For consumers, wedeliver value through innovative, high-quality products that solve everyday problems. For our shareholders, we seek to deliver differentiated valuethrough our four strategic pillars: global leading manufacturer, best brand portfolio, legacy of innovation and best cost position.
3
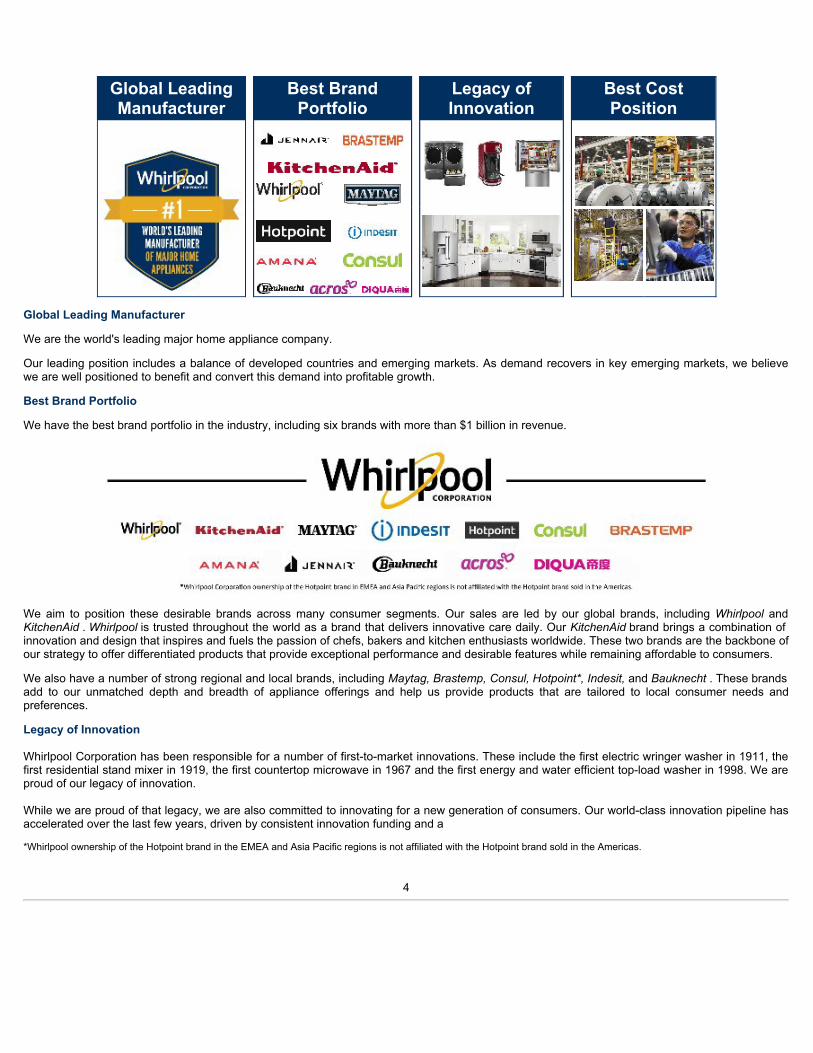
Global LeadingManufacturer
Best BrandPortfolio
Legacy ofInnovation
Best CostPosition
Global Leading Manufacturer
We are the world's leading major home appliance company.
Our leading position includes a balance of developed countries and emerging markets. As demand recovers in key emerging markets, we believewe are well positioned to benefit and convert this demand into profitable growth.
Best Brand Portfolio
We have the best brand portfolio in the industry, including six brands with more than $1 billion in revenue.
We aim to position these desirable brands across many consumer segments. Our sales are led by our global brands, including WhirlpoolandKitchenAid. Whirlpoolis trusted throughout the world as a brand that delivers innovative care daily. Our KitchenAidbrand brings a combination ofinnovation and design that inspires and fuels the passion of chefs, bakers and kitchen enthusiasts worldwide. These two brands are the backbone ofour strategy to offer differentiated products that provide exceptional performance and desirable features while remaining affordable to consumers.
We also have a number of strong regional and local brands, including Maytag,Brastemp,Consul,Hotpoint*,Indesit,and Bauknecht. These brandsadd to our unmatched depth and breadth of appliance offerings and help us provide products that are tailored to local consumer needs andpreferences.
Legacy of Innovation
Whirlpool Corporation has been responsible for a number of first-to-market innovations. These include the first electric wringer washer in 1911, thefirst residential stand mixer in 1919, the first countertop microwave in 1967 and the first energy and water efficient top-load washer in 1998. We areproud of our legacy of innovation.
While we are proud of that legacy, we are also committed to innovating for a new generation of consumers. Our world-class innovation pipeline hasaccelerated over the last few years, driven by consistent innovation funding and a
*Whirlpool ownership of the Hotpoint brand in the EMEA and Asia Pacific regions is not affiliated with the Hotpoint brand sold in the Americas.
4
passionate culture of employees focused on bringing new technologies to market. This year, we launched more than 100 new products throughoutthe world, and we are committed to further accelerating our pace of innovation.
As the shift to digital continues, consumers are beginning to desire connected appliances which fit seamlessly into the larger home ecosystem. Weare excited to bring new connected technologies to market, including scan-to-cook, voice control, and remote service diagnostics. Whetherdeveloped internally or with one of our many collaborators, we believe these digitally-enabled services will increasingly enhance the applianceexperience for our consumers.
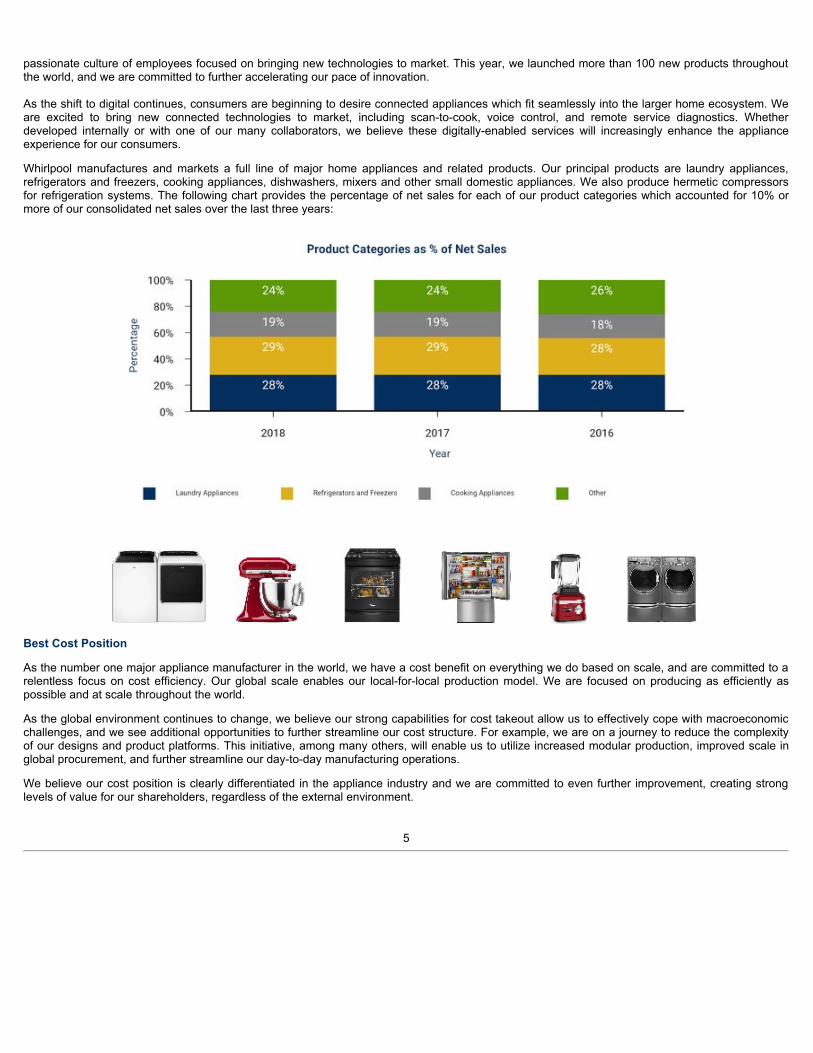
Whirlpool manufactures and markets a full line of major home appliances and related products. Our principal products are laundry appliances,refrigerators and freezers, cooking appliances, dishwashers, mixers and other small domestic appliances. We also produce hermetic compressorsfor refrigeration systems. The following chart provides the percentage of net sales for each of our product categories which accounted for 10% ormore of our consolidated net sales over the last three years:
Best Cost Position
As the number one major appliance manufacturer in the world, we have a cost benefit on everything we do based on scale, and are committed to arelentless focus on cost efficiency. Our global scale enables our local-for-local production model. We are focused on producing as efficiently aspossible and at scale throughout the world.
As the global environment continues to change, we believe our strong capabilities for cost takeout allow us to effectively cope with macroeconomicchallenges, and we see additional opportunities to further streamline our cost structure. For example, we are on a journey to reduce the complexityof our designs and product platforms. This initiative, among many others, will enable us to utilize increased modular production, improved scale inglobal procurement, and further streamline our day-to-day manufacturing operations.
We believe our cost position is clearly differentiated in the appliance industry and we are committed to even further improvement, creating stronglevels of value for our shareholders, regardless of the external environment.
5
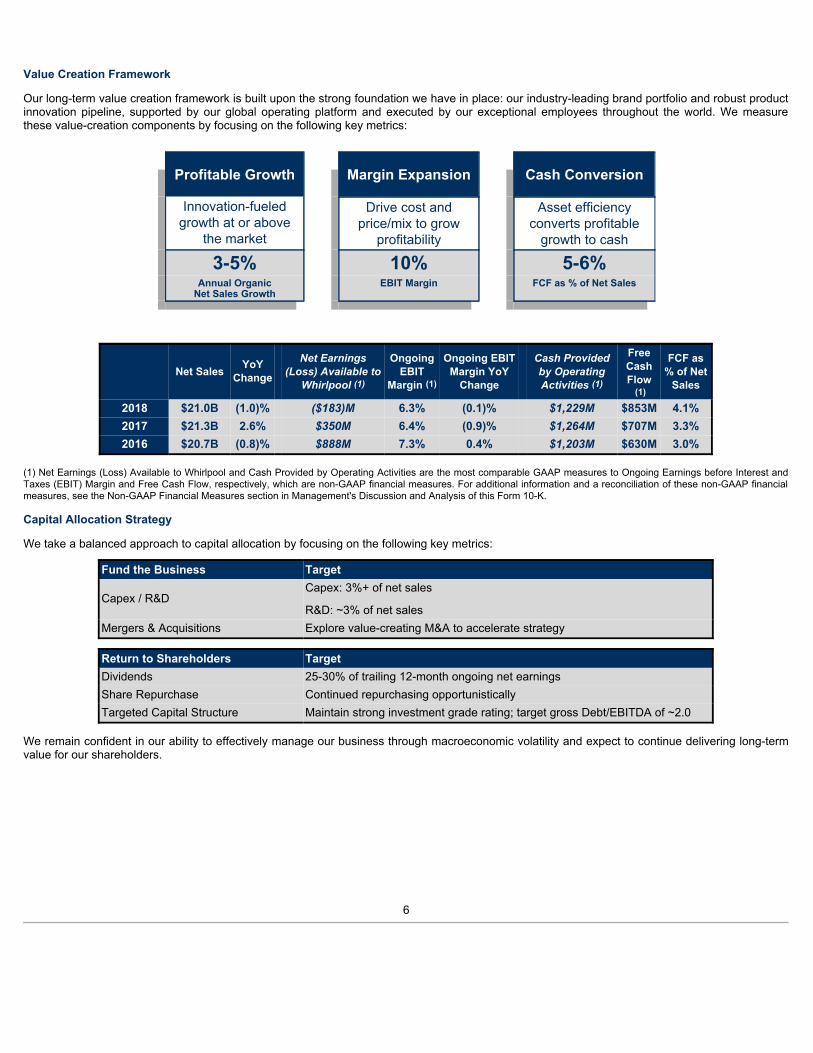
Value Creation Framework
Our long-term value creation framework is built upon the strong foundation we have in place: our industry-leading brand portfolio and robust productinnovation pipeline, supported by our global operating platform and executed by our exceptional employees throughout the world. We measurethese value-creation components by focusing on the following key metrics:
Profitable Growth
Margin Expansion
Cash Conversion
Innovation-fueledgrowth at or above
the market
Drive cost andprice/mix to grow
profitability
Asset efficiencyconverts profitable
growth to cash
3-5% 10% 5-6%
Annual OrganicNet Sales Growth
EBIT Margin
FCF as % of Net Sales
Net Sales YoY
Change
Net Earnings(Loss) Available to
Whirlpool (1)
OngoingEBIT
Margin (1)
Ongoing EBITMargin YoY
Change
Cash Providedby OperatingActivities (1)
FreeCashFlow
(1)
FCF as% of Net
Sales
2018 $21.0B (1.0)% ($183)M 6.3% (0.1)% $1,229M $853M 4.1%2017 $21.3B 2.6% $350M 6.4% (0.9)% $1,264M $707M 3.3%2016 $20.7B (0.8)% $888M 7.3% 0.4% $1,203M $630M 3.0%
(1) Net Earnings (Loss) Available to Whirlpool and Cash Provided by Operating Activities are the most comparable GAAP measures to Ongoing Earnings before Interest andTaxes (EBIT) Margin and Free Cash Flow, respectively, which are non-GAAP financial measures. For additional information and a reconciliation of these non-GAAP financialmeasures, see the Non-GAAP Financial Measures section in Management's Discussion and Analysis of this Form 10-K.
Capital Allocation Strategy
We take a balanced approach to capital allocation by focusing on the following key metrics:
Fund the Business Target
Capex / R&DCapex: 3%+ of net sales
R&D: ~3% of net salesMergers & Acquisitions Explore value-creating M&A to accelerate strategy
Return to Shareholders TargetDividends 25-30% of trailing 12-month ongoing net earningsShare Repurchase Continued repurchasing opportunisticallyTargeted Capital Structure Maintain strong investment grade rating; target gross Debt/EBITDA of ~2.0
We remain confident in our ability to effectively manage our business through macroeconomic volatility and expect to continue delivering long-termvalue for our shareholders.
6
•
•
•
•
•
•
•
•
•
•
•
•
•
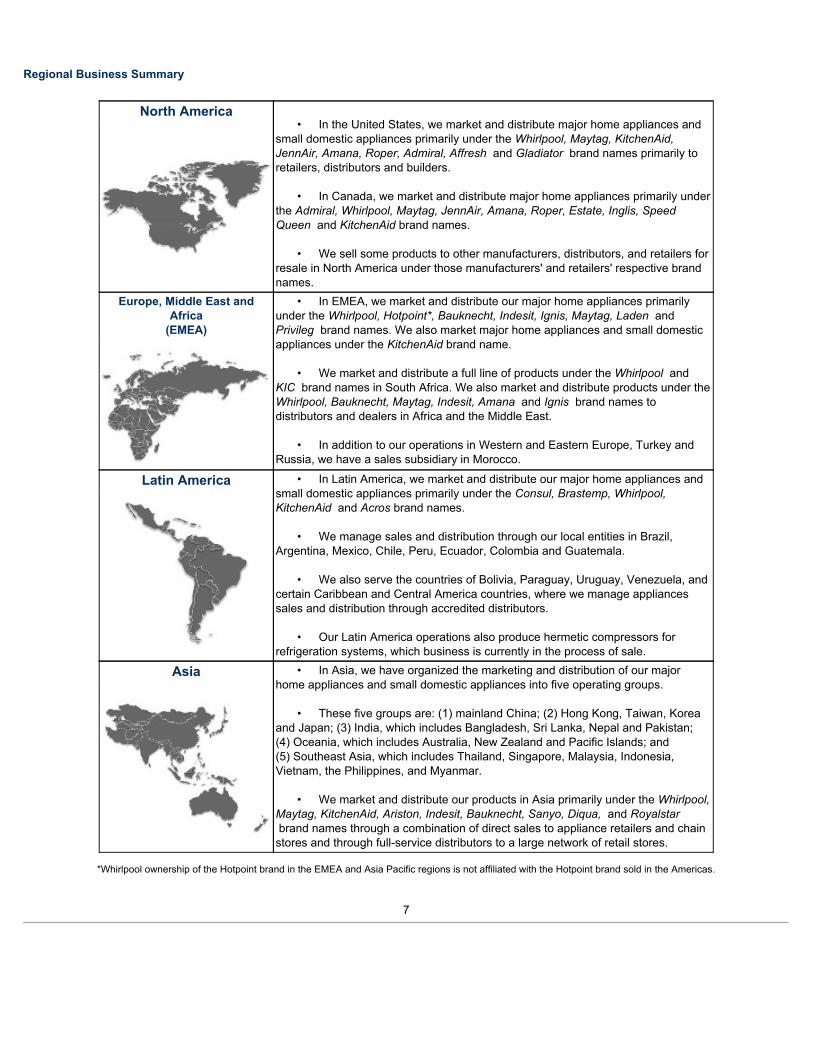
Regional Business Summary
North AmericaIn the United States, we market and distribute major home appliances and
small domestic appliances primarily under the Whirlpool,Maytag,KitchenAid,JennAir,Amana,Roper,Admiral,Affresh and Gladiator brand names primarily toretailers, distributors and builders.
In Canada, we market and distribute major home appliances primarily underthe Admiral,Whirlpool,Maytag,JennAir,Amana,Roper,Estate,Inglis,SpeedQueen and KitchenAidbrand names.
We sell some products to other manufacturers, distributors, and retailers forresale in North America under those manufacturers' and retailers' respective brandnames.
Europe, Middle East andAfrica
(EMEA)
In EMEA, we market and distribute our major home appliances primarilyunder the Whirlpool,Hotpoint*,Bauknecht,Indesit,Ignis,Maytag,Laden andPrivileg brand names. We also market major home appliances and small domesticappliances under the KitchenAidbrand name.
We market and distribute a full line of products under the Whirlpool andKIC brand names in South Africa. We also market and distribute products under theWhirlpool,Bauknecht,Maytag,Indesit,Amana and Ignis brand names todistributors and dealers in Africa and the Middle East.
In addition to our operations in Western and Eastern Europe, Turkey andRussia, we have a sales subsidiary in Morocco.
Latin America In Latin America, we market and distribute our major home appliances andsmall domestic appliances primarily under the Consul,Brastemp,Whirlpool, KitchenAid and Acrosbrand names.
We manage sales and distribution through our local entities in Brazil,Argentina, Mexico, Chile, Peru, Ecuador, Colombia and Guatemala.
We also serve the countries of Bolivia, Paraguay, Uruguay, Venezuela, andcertain Caribbean and Central America countries, where we manage appliancessales and distribution through accredited distributors.
Our Latin America operations also produce hermetic compressors forrefrigeration systems, which business is currently in the process of sale.
Asia In Asia, we have organized the marketing and distribution of our majorhome appliances and small domestic appliances into five operating groups.
These five groups are: (1) mainland China; (2) Hong Kong, Taiwan, Koreaand Japan; (3) India, which includes Bangladesh, Sri Lanka, Nepal and Pakistan;(4) Oceania, which includes Australia, New Zealand and Pacific Islands; and(5) Southeast Asia, which includes Thailand, Singapore, Malaysia, Indonesia,Vietnam, the Philippines, and Myanmar.
We market and distribute our products in Asia primarily under the Whirlpool,Maytag,KitchenAid,Ariston,Indesit,Bauknecht,Sanyo,Diqua, and Royalstar brand names through a combination of direct sales to appliance retailers and chainstores and through full-service distributors to a large network of retail stores.
*Whirlpool ownership of the Hotpoint brand in the EMEA and Asia Pacific regions is not affiliated with the Hotpoint brand sold in the Americas.
7
CompetitionCompetition in the major home appliance industry is intense, including competitors such as Arcelik, Bosch Siemens, Electrolux, Haier, Kenmore, LG,Mabe, Midea, Panasonic and Samsung, many of which are increasingly expanding beyond their existing manufacturing footprint. The competitiveenvironment includes the impact of a changing retail environment, including the shifting of consumer purchase practices towards e-commerce andother channels. Moreover, our customer base includes large, sophisticated trade customers who have many choices and demand competitiveproducts, services and prices. We believe that we can best compete in the current environment by focusing on introducing new and innovativeproducts, building strong brands, enhancing trade customer and consumer value with our product and service offerings, optimizing our regionalfootprint and trade distribution channels, increasing productivity, improving quality, lowering costs, and taking other efficiency-enhancing measures.
Raw Materials and Purchased Components
We are generally not dependent upon any one source for raw materials or purchased components essential to our business. In areas where a singlesupplier is used, alternative sources are generally available and can be developed within the normal manufacturing environment. Some supplydisruptions and unanticipated costs may be incurred in transitioning to a new supplier if a prior single supplier relationship was abruptly interruptedor terminated. In the event of a disruption, we believe that we will be able to qualify and use alternate materials, sometimes at premium costs, andthat such raw materials and components will be available in adequate quantities to meet forecasted production schedules.
Trademarks, Licenses and Patents
We consider the trademarks, copyrights, patents, and trade secrets we own, and the licenses we hold, in the aggregate, to be a valuable asset.Whirlpool is the owner of a number of trademarks in the United States and foreign countries. The m ost important trademarks to North America areWhirlpool, Maytag, JennAir, KitchenAid and Amana. T he most important trademarks to EMEA are Whirlpool, KitchenAid, Bauknecht, Indesit,Hotpoint*and Ignis.The most important trademarks to Latin America are Consul,Brastemp,Whirlpool,KitchenAidand Acros. The most importanttrademarks to Asia are Whirlpooland Royalstar(which is licensed to us). We receive royalties from licensing our trademarks to third parties tomanufacture, sell and service certain products bearing the Whirlpool, Maytag, KitchenAid, Amanaand Bauknechtbrand names. We continuallyapply for and obtain United States and foreign patents. The primary purpose in obtaining patents is to protect our designs, technologies andproducts.
Protection of the Environment
Our manufacturing facilities are subject to numerous laws and regulations designed to protect or enhance the environment, many of which requirefederal, state, or other governmental licenses and permits with regard to wastewater discharges, air emissions, and hazardous waste management.Our policy is to comply with all such laws and regulations. Where laws and regulations are less restrictive, we have established and are following ourown standards, consistent with our commitment to environmental responsibility.
We believe that we are in compliance, in all material respects, with presently applicable governmental provisions relating to environmental protectionin the countries in which we have manufacturing operations. Compliance with these environmental laws and regulations did not have a materialeffect on capital expenditures, earnings, or our competitive position during 2018 and is not expected to be material in 2019 .
The entire major home appliance industry, including Whirlpool, must contend with the adoption of stricter government energy and environmentalstandards. These standards have been and continue to be phased in over the past several years and include the general phase-out of ozone-depleting chemicals used in refrigeration, and energy and related standards for selected major appliances, regulatory restrictions on the materialscontent specified for use in our products by some jurisdictions and mandated recycling of our products at the end of their useful lives. Compliancewith these various standards, as they become effective, will require some product redesign. However, we believe, based on our understanding ofthe current state of proposed regulations, that we will be able to develop, manufacture, and market products that comply with these regulations.
Whirlpool participates in environmental assessments and cleanup at a number of locations globally. These include operating and non-operatingfacilities, previously owned properties and waste sites, including "Superfund" (under the Comprehensive Environmental Response, Compensationand Liability Act (CERCLA)) sites. However, based upon our
*Whirlpool ownership of the Hotpoint brand in the EMEA and Asia Pacific regions is not affiliated with the Hotpoint brand sold in the Americas.
8
evaluation of the facts and circumstances relating to these sites along with the evaluation of our technical consultants, we do not presently anticipateany material adverse effect on our financial statements arising out of the resolution of these matters or the resolution of any other knowngovernmental proceeding regarding environmental protection matters.
Other Information
For information about the challenges and risks associated with our foreign operations, see "Risk Factors" under Item 1A.
Whirlpool is a major supplier of laundry, refrigeration, cooking and dishwasher home appliances to Lowe's, a North American retailer. Net salesattributable to Lowe's in 2018, 2017 and 2016, were approximately 12%, 10% and 9%, respectively, of our consolidated net sales. For certain otherfinancial information concerning our business segments and foreign and domestic operations, see Note 15 to the Consolidated FinancialStatements.
For information on our global restructuring plans, and the impact of these plans on our operating segments, see Note 13 to the ConsolidatedFinancial Statements.
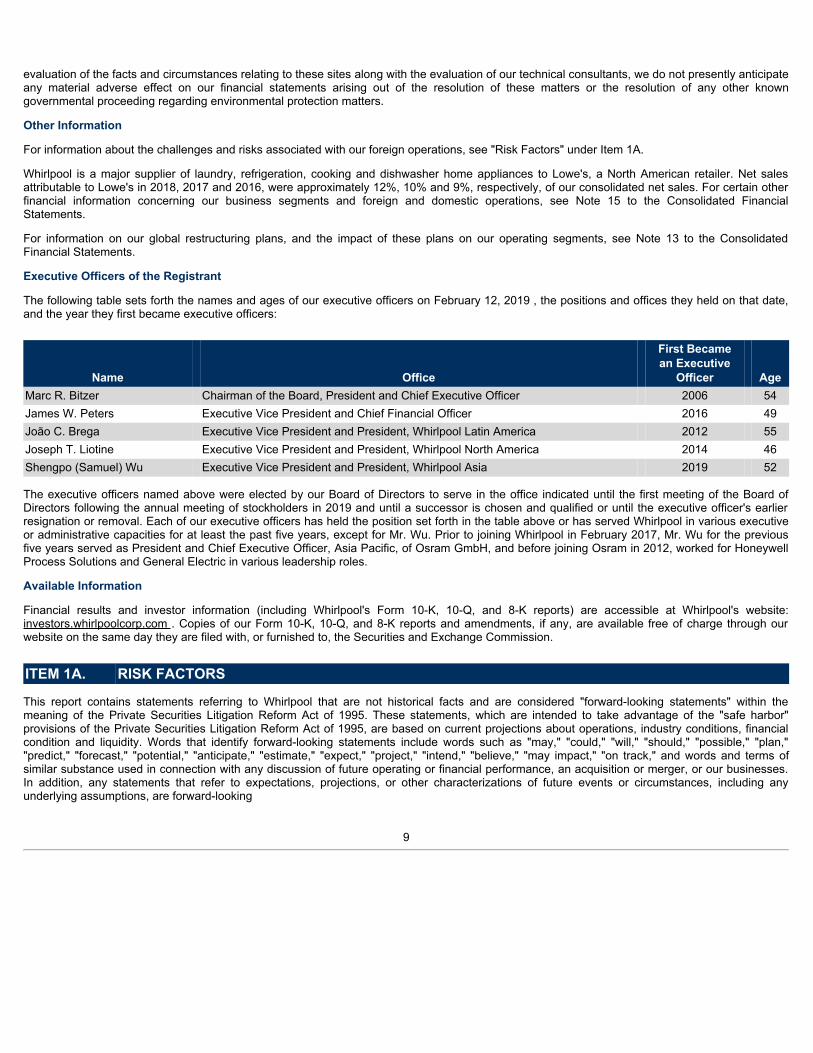
Executive Officers of the Registrant
The following table sets forth the names and ages of our executive officers on February 12, 2019 , the positions and offices they held on that date,and the year they first became executive officers:
Name Office
First Becamean Executive
Officer AgeMarc R. Bitzer Chairman of the Board, President and Chief Executive Officer 2006 54James W. Peters Executive Vice President and Chief Financial Officer 2016 49João C. Brega Executive Vice President and President, Whirlpool Latin America 2012 55Joseph T. Liotine Executive Vice President and President, Whirlpool North America 2014 46Shengpo (Samuel) Wu Executive Vice President and President, Whirlpool Asia 2019 52
The executive officers named above were elected by our Board of Directors to serve in the office indicated until the first meeting of the Board ofDirectors following the annual meeting of stockholders in 2019 and until a successor is chosen and qualified or until the executive officer's earlierresignation or removal. Each of our executive officers has held the position set forth in the table above or has served Whirlpool in various executiveor administrative capacities for at least the past five years, except for Mr. Wu. Prior to joining Whirlpool in February 2017, Mr. Wu for the previousfive years served as President and Chief Executive Officer, Asia Pacific, of Osram GmbH, and before joining Osram in 2012, worked for HoneywellProcess Solutions and General Electric in various leadership roles.
Available Information
Financial results and investor information (including Whirlpool's Form 10-K, 10-Q, and 8-K reports) are accessible at Whirlpool's website:investors.whirlpoolcorp.com . Copies of our Form 10-K, 10-Q, and 8-K reports and amendments, if any, are available free of charge through ourwebsite on the same day they are filed with, or furnished to, the Securities and Exchange Commission.
ITEM 1A. RISK FACTORS
This report contains statements referring to Whirlpool that are not historical facts and are considered "forward-looking statements" within themeaning of the Private Securities Litigation Reform Act of 1995. These statements, which are intended to take advantage of the "safe harbor"provisions of the Private Securities Litigation Reform Act of 1995, are based on current projections about operations, industry conditions, financialcondition and liquidity. Words that identify forward-looking statements include words such as "may," "could," "will," "should," "possible," "plan,""predict," "forecast," "potential," "anticipate," "estimate," "expect," "project," "intend," "believe," "may impact," "on track," and words and terms ofsimilar substance used in connection with any discussion of future operating or financial performance, an acquisition or merger, or our businesses.In addition, any statements that refer to expectations, projections, or other characterizations of future events or circumstances, including anyunderlying assumptions, are forward-looking
9
statements. Those statements are not guarantees and are subject to risks, uncertainties, and assumptions that are difficult to predict. Therefore,actual results could differ materially and adversely from these forward-looking statements.
We have listed below what we believe to be the most significant strategic, operational, financial, and legal and compliance risks relating to ourbusiness.
STRATEGIC RISKS
We face intense competition in the major home appliance industry and failure to successfully compete could negatively affect ourbusiness and financial performance.
Each of our operating segments operates in a highly competitive business environment and faces intense competition from a growing number ofcompetitors, many of which have strong consumer brand equity. Several of these competitors, such as those set forth in the Business section ofthis annual report, are large, well-established companies, many ranking among the Global Fortune 150, and have demonstrated a commitment toglobal success. We also face competition that may be able to quickly adapt to changing consumer preferences, particularly in the connectedappliance space. Moreover, our customer base includes large, sophisticated trade customers who have many choices and demand competitiveproducts, services and prices. Competition in the global appliance industry is based on a number of factors including selling price, product featuresand design, performance, innovation, reputation, energy efficiency, quality, cost, distribution, and financial incentives, such as promotional funds,sales incentives, volume rebates and terms. Many of our competitors are increasingly expanding beyond their existing manufacturing footprints.Our competitors, especially global competitors with low-cost sources of supply and/or highly protected home marketplaces outside the UnitedStates, have aggressively priced their products and/or introduced new products to increase market share and expand into new geographies. Manyof our competitors have established and may expand their presence in the rapidly changing retail environment, including the shifting of consumerpurchasing practices towards e-commerce and other channels. If we are unable to successfully compete in this highly competitive environment,our business and financial performance could be negatively affected.
The loss of, or substantial decline in, sales to any of our key trade customers, major buying groups, and builders could adversely affectour financial performance.
We sell to a sophisticated customer base of large trade customers, including Lowe's and other large domestic and international trade customers,that have significant leverage as buyers over their suppliers. Most of our products are not sold through long-term contracts, allowing tradecustomers to change volume among suppliers. As the trade customers continue to become larger, they may seek to use their position to improvetheir profitability by various means, including improved efficiency, lower pricing, and increased promotional programs. If we are unable to meettheir demand requirements, our volume growth and financial results could be negatively affected. The loss or substantial decline in volume ofsales to our key trade customers, major buying groups, builders, or any other trade customers to which we sell a significant amount of products,could adversely affect our financial performance. Additionally, the loss of market share or financial difficulties, including bankruptcy and financialrestructuring, by these trade customers could have a material adverse effect on our liquidity, financial position and results of operations.
Failure to maintain our reputation and brand image could negatively impact our business.
Our brands have worldwide recognition, and our success depends on our ability to maintain and enhance our brand image and reputation.Maintaining, promoting and growing our brands depends on our marketing efforts, including advertising and consumer campaigns, as well asproduct innovation. We could be adversely impacted if we fail to achieve any of these objectives or if, whether or not justified, the reputation orimage of our company or any of our brands is tarnished or receives negative publicity. In addition, adverse publicity about regulatory or legalaction against us, or product quality issues, could damage our reputation and brand image, undermine our customers' confidence in us andreduce long-term demand for our products, even if the regulatory or legal action is unfounded or not material to our operations.
10
In addition, our success in maintaining, extending and expanding our brand image depends on our ability to adapt to a rapidly changing mediaenvironment, including an ever-increasing reliance on social media and online dissemination of advertising campaigns. Inaccurate or negativeposts or comments about us on social networking and other websites that spread rapidly through such forums could seriously damage ourreputation and brand image. If we do not maintain, extend and expand our brand image, then our product sales, financial condition and results ofoperations could be materially and adversely affected.
An inability to effectively execute and manage our business objectives could adversely affect our financial performance.
The highly competitive nature of our industry requires that we effectively execute and manage our business objectives including our globaloperating platform initiative. Our global operating platform initiative aims to reduce costs, expand margins, drive productivity and qualityimprovements, accelerate our rate of innovation, generate free cash flow and drive shareholder value. An inability to effectively control costs anddrive productivity improvements could affect our profitability. In addition, an inability to provide high-quality, innovative products could adverselyaffect our ability to maintain or increase our sales, which could negatively affect our revenues and overall financial performance. Additionally, oursuccess is dependent on anticipating and appropriately reacting to changes in customer preferences, including the shifting of consumerpurchasing practices towards e-commerce and other channels, and on successful new product development, including in the connected appliancespace, and process development and product relaunches in response to such changes. Our future results and our ability to maintain or improveour competitive position will depend on our capacity to gauge the direction of our key product categories and geographic regions and upon ourability to successfully and timely identify, develop, manufacture, market, and sell new or improved products in these changing environments.
Our intellectual property rights are valuable, and any inability to protect them could reduce the value of our products, services andbrands.
We consider our intellectual property rights, including patents, trademarks, copyrights and trade secrets, and the licenses we hold, to be asignificant part and valuable aspect of our business. We attempt to protect our intellectual property rights through a combination of patent,trademark, copyright and trade secret laws, as well as licensing agreements and third party nondisclosure and assignment agreements. Ourfailure to obtain or adequately protect our trademarks, products, new features of our products, or our processes may diminish ourcompetitiveness.
We have applied for intellectual property protection in the United States and other jurisdictions with respect to certain innovations and newproducts, design patents, product features, and processes. We cannot be assured that the U.S. Patent and Trademark Office or any similarauthority in other jurisdictions will approve any of our patent applications. Additionally, the patents we own could be challenged or invalidated,others could design around our patents or the patents may not be of sufficient scope or strength to provide us with any meaningful protection orcommercial advantage. Further, the laws of certain foreign countries in which we do business, or contemplate doing business in the future, do notrecognize intellectual property rights or protect them to the same extent as United States law. As a result, these factors could weaken ourcompetitive advantage with respect to our products, services, and brands in foreign jurisdictions, which could adversely affect our financialperformance.
Moreover, while we do not believe that any of our products infringe on enforceable intellectual property rights of third parties, others may assertintellectual property rights that cover some of our technology, brands, products, or services. Any litigation regarding patents or other intellectualproperty could be costly and time-consuming and could divert the attention of our management and key personnel from our business operations.Claims of intellectual property infringement might also require us to enter into costly license agreements or modify our products or services. Wealso may be subject to significant damages, injunctions against development and sale of certain products or services, or limited in the use of ourbrands.
OPERATIONAL RISKS
We face risks associated with our acquisitions and other investments and risks associated with our increased presence in emergingmarkets.
From time to time, we make strategic acquisitions or divestitures, investments and participate in joint ventures. For example, we acquired Indesitand a majority interest in Hefei Sanyo in the fourth quarter of 2014, and we signed an agreement to sell our Embraco compressor business in2018. These transactions, and other transactions that we have entered into or which we may enter into in the future, can involve significantchallenges and risks, including
11
that the transaction does not advance our business strategy or fails to produce a satisfactory return on our investment. We may encounterdifficulties in integrating acquisitions with our operations, applying our internal control processes to these acquisitions, managing strategicinvestments, and in overseeing the operations, systems and controls of acquired companies. For example, in 2017, we recorded an adjustmentprimarily for trade promotion accruals by our China business, which has been and remains subject to investigation by the relevant Chinesegovernmental authorities. We took certain remedial actions to strengthen internal controls as a result of our review of the conduct and processesinvolved. Integrating acquisitions and carving out divestitures is often costly and may require significant attention from management. Furthermore,we may not realize the degree, or timing, of benefits we anticipate when we first enter into a transaction. While our evaluation of any potentialtransaction includes business, legal and financial due diligence with the goal of identifying and evaluating the material risks involved, our duediligence reviews may not identify all of the issues necessary to accurately estimate the cost and potential loss contingencies of a particulartransaction, including potential exposure to regulatory sanctions resulting from an acquisition target's previous activities or costs associated withany quality issues with an acquisition target's legacy products. In addition, liabilities may be retained by Whirlpool when closing a facility, divestingan entity or selling physical assets, and such liabilities may be material.
Our growth plans include efforts to increase revenue from emerging markets, including through acquisitions. Local business practices in thesecountries may not comply with U.S. laws, local laws or other laws applicable to us or our compliance policies, which non-compliant practices mayresult in increased liability risks. For example, we may incur unanticipated costs, expenses or other liabilities as a result of an acquisition target'sviolation of applicable laws, such as the U.S. Foreign Corrupt Practices Act (FCPA) or similar worldwide anti-bribery laws in non-U.S. jurisdictions.We may incur unanticipated costs or expenses, including post-closing asset impairment charges, expenses associated with eliminating duplicatefacilities, litigation, and other liabilities. In addition, our recent and future acquisitions may increase our exposure to other risks associated withoperating internationally, including foreign currency exchange rate fluctuations; political, legal and economic instability; inflation; changes in taxrates and tax laws; and work stoppages and labor relations.
Risks associated with our international operations may decrease our revenues and increase our costs.
For the year ended December 31 , 2018 , international operations represent approximately 49% of our net sales. We expect that internationalsales will continue to account for a significant percentage of our net sales. Accordingly, we face numerous risks associated with conductinginternational operations, any of which could negatively affect our financial performance. These risks include the following:
• Political, legal, and economic instability and uncertainty
• Foreign currency exchange rate fluctuations
• Changes in foreign tax rules, regulations and other requirements, such as changes in tax rates and statutory and judicial interpretations oftax laws
• Changes in diplomatic and trade relationships, including sanctions resulting from the current political situation in countries in which we dobusiness
• Inflation and/or deflation
• Changes in foreign country regulatory requirements, including data privacy laws.
• Various import/export restrictions and disruptions and the availability of required import/export licenses
• Imposition of tariffs and other trade barriers
• Managing widespread operations and enforcing internal policies and procedures such as compliance with U.S. and foreign anti-bribery, anti-corruption regulations and anti-money laundering, such as the FCPA, and antitrust laws
• Labor disputes and work stoppages at our operations and suppliers
• Government price controls
• The inability to collect accounts receivable
12
• Limitations on the repatriation or movement of earnings and cash
As a U.S. corporation, we are subject to the FCPA, which may place us at a competitive disadvantage to foreign companies that are not subject tosimilar regulations. Additionally, any determination that we have violated the FCPA or other anti-corruption laws could have a material adverseeffect on us.
Terrorist attacks, cyber events, armed conflicts, civil unrest, natural disasters, governmental actions and epidemics could affect our domestic andinternational sales, disrupt our supply chain, and impair our ability to produce and deliver our products. Such events could directly impact ourphysical facilities or those of our suppliers or customers.
We may be subject to information technology system failures, network disruptions, cybersecurity attacks and breaches in data security,which may materially adversely affect our operations, financial condition and operating results.
We depend on information technology to improve the effectiveness of our operations and to interface with our customers, consumers andemployees, as well as to maintain financial accuracy and efficiency. Our business processes and data sharing across functions, suppliers, andvendors is dependent on information technology integration. The failure of any systems, whether internal or third-party, during normal operation,system upgrades, implementations, or connections, could disrupt our operations by causing transaction errors, processing inefficiencies, delays orcancellation of customer orders, the loss of customers, impediments to the manufacture or shipment of products, other financial and businessdisruptions, or the loss of or damage to intellectual property and the personally identifiable data of consumers and employees.
In addition, we have outsourced certain information technology support services and administrative functions, such as system applicationmaintenance and benefit plan administration, to third-party service providers and may outsource other functions in the future to achieve costsavings and efficiencies. If these service providers do not perform effectively, we may not achieve the expected cost savings and may incuradditional costs to correct errors made by such service providers. Depending on the function involved, such errors may also lead to businessdisruption, processing inefficiencies or the loss of or damage to intellectual property and personally identifiable information through systemcompromise, or harm employee morale.
Our information systems, or those of our third-party service providers, could also be impacted by inappropriate or mistaken activity of parties intenton extracting or corrupting information or disrupting business processes. Such unauthorized access could disrupt our business and could result inthe loss of assets. Cybersecurity attacks are becoming more sophisticated and include malicious software, attempts to gain unauthorized accessto data, and other electronic security breaches that could lead to disruptions in critical systems, unauthorized release of confidential or otherwiseprotected information, and corruption of data. These events could impact our customers, consumers, employees, third-parties and reputation andlead to financial losses from remediation actions, loss of business or potential liability or an increase in expense, all of which may have a materialadverse effect on our business.
Product-related liability or product recall costs could adversely affect our business and financial performance.
We may be exposed to product-related liabilities, which in some instances may result in product redesigns, product recalls, or other correctiveaction. In addition, any claim, product recall or other corrective action that results in significant adverse publicity, particularly if those claims orrecalls cause customers to question the safety or reliability of our products, may negatively affect our business, financial condition, or results ofoperations. We maintain product liability insurance, but it may not be adequate to cover losses related to product liability claims brought againstus. Product liability insurance could become more expensive and difficult to maintain and may not be available on commercially reasonable terms,if at all. We may be involved in class action litigation for which we generally have not purchased insurance, and may be involved in certain otherproduct recalls or other litigations or events for which insurance products may have limitations.
13
We regularly engage in investigations of potential quality and safety issues as part of our ongoing effort to deliver quality products to ourcustomers. We are currently investigating certain potential quality and safety issues, and as appropriate, we undertake to effect repair orreplacement of appliances. Actual costs of these and any future issues depend upon several factors, including the number of consumers whorespond to a particular recall, repair and administrative costs, whether the cost of any corrective action is borne by us or the supplier, and, if borneby us, whether we will be successful in recovering our costs from the supplier. The actual costs incurred as a result of these issues and any futureissues could have a material adverse effect on our business, financial condition or results of operations.
The ability of suppliers to deliver parts, components and manufacturing equipment to our manufacturing facilities, and our ability tomanufacture without disruption, could affect our global business performance.
We use a wide range of materials and components in the global production of our products, which come from numerous suppliers around theworld. Because not all of our business arrangements provide for guaranteed supply and some key parts may be available only from a singlesupplier or a limited group of suppliers, we are subject to supply and pricing risk. In addition, certain proprietary component parts used in some ofour products are provided by single-source unaffiliated third-party suppliers. We would be unable to obtain these proprietary components for anindeterminate period of time if these single-source suppliers were to cease or interrupt production or otherwise fail to supply these components tous, which could adversely affect our product sales and operating results. Our operations and those of our suppliers are subject to disruption for avariety of reasons, including work stoppages, labor relations, intellectual property claims against suppliers, information technology failures, andhazards such as fire, earthquakes, flooding, or other natural disasters. Insurance for certain disruptions may not be available, affordable oradequate. Such disruption could interrupt our ability to manufacture certain products. Any significant disruption could negatively impact ourrevenue and/or earnings performance.
Our ability to attract, develop and retain executives and other qualified employees is crucial to our results of operations and futuregrowth.
We depend upon the continued services and performance of our key executives, senior management and skilled personnel, particularlyprofessionals with experience in our business and operations and the home appliance industry. We cannot be sure that any of these individualswill continue to be employed by us. In the case of talent losses, significant time is required to hire, develop and train skilled replacementpersonnel. An inability to hire, develop, transfer retained knowledge, engage and retain a sufficient number of qualified employees could materiallyhinder our business by, for example, delaying our ability to bring new products to market or impairing the success of our operations.
A deterioration in labor relations could adversely impact our global business.
As of December 31 , 2018 , we had approximately 92,000 employees. We are subject to separate collective bargaining agreements with certainlabor unions, as well as various other commitments regarding our workforce. We periodically negotiate with certain unions representing ouremployees and may be subject to work stoppages or may be unable to renew collective bargaining agreements on the same or similar terms, or atall, all of which may also have a material adverse effect on our business, financial condition, or results of operations.
FINANCIAL RISKS
Fluctuations and volatility in the cost of raw materials and purchased components could adversely affect our operating results.
The sources and prices of the primary materials (such as steel, resins, and base metals) used to manufacture our products and componentscontaining those materials are susceptible to significant global and regional price fluctuations due to supply/demand trends, transportation costs,labor costs, government regulations and tariffs, changes in currency exchange rates, price controls, the economic climate, and other unforeseencircumstances. For example, we experienced significant inflation in raw materials and certain manufactured components during 2018, whichnegatively impacted our operating results. Significant increases in these and other costs now and in the future could have a material adverseeffect on our operating results.
14
Foreign currency fluctuations may affect our financial performance.
We generate a significant portion of our revenue and incur a significant portion of our expenses in foreign currencies. Changes in the exchangerates of functional currencies of those operations affect the U.S. dollar value of our revenue and earnings from our foreign operations. We usecurrency forwards, net investment hedges, and options to manage our foreign currency transaction exposures. We cannot completely eliminateour exposure to foreign currency fluctuations, which may adversely affect our financial performance. In addition, because our consolidatedfinancial results are reported in U.S. dollars, if we generate sales or earnings in other currencies, the translation of those results into U.S. dollarscan result in a significant increase or decrease in the amount of those sales or earnings. Finally, the amount of legal contingencies related toforeign operations may fluctuate significantly based upon changes in exchange rates and usually cannot be managed with currency forwards,options or other arrangements. Such fluctuations in exchange rates can significantly increase or decrease the amount of any legal contingencyrelated to our foreign operations and make it difficult to assess and manage the potential exposure.
Goodwill and indefinite-life intangible asset impairment charges may adversely affect our operating results.
We have a substantial amount of goodwill and indefinite-life intangible assets, primarily trademarks, on our balance sheet. We test the goodwilland intangible assets for impairment on an annual basis and when events occur or circumstances change that indicate that the fair value of thereporting unit or intangible asset may be below its carrying amount. Fair value determinations require considerable judgment and are sensitive toinherent uncertainties and changes in estimates and assumptions regarding revenue growth rates, EBIT margins, capital expenditures, workingcapital requirements, tax rates, terminal growth rates, discount rates, royalty rates, benefits associated with a taxable transaction and synergisticbenefits available to market participants. Declines in market conditions, a trend of weaker than anticipated financial performance for our reportingunits or declines in projected revenue for our trademarks, a decline in our share price for a sustained period of time, an increase in the market-based weighted average cost of capital or a decrease in royalty rates, among other factors, are indicators that the carrying value of our goodwill orindefinite-life intangible assets may not be recoverable. We may be required to record a goodwill or intangible asset impairment charge that, ifincurred, could have a material adverse effect on our financial condition and results of operations.
Impairment of long-lived assets may adversely affect our operating results.
Our long-lived asset groups are subject to an impairment assessment when certain triggering events or circumstances indicate that their carryingvalue may be impaired. If the carrying value exceeds our estimate of future undiscounted cash flows of the operations related to the asset group,an impairment is recorded for the difference between the carrying amount and the fair value of the asset group. The results of these tests forpotential impairment may be adversely affected by unfavorable market conditions, our financial performance trends, or an increase in interestrates, among other factors. If as a result of the impairment test we determine that the fair value of any of our long-lived asset groups is less thanits carrying amount, we may incur an impairment charge that could have a material adverse effect on our financial condition and results ofoperations.
We face inventory valuation risk.
We write down product and component inventories that have become obsolete or do not meet anticipated demand or net realizable value. Noassurance can be given that, given the unpredictable pace of product obsolescence and business conditions with trade customers and in general,we will not incur additional inventory related charges. Such charges could negatively affect our financial condition and operating results.
We are exposed to risks associated with the uncertain global economy.
The current domestic and international political and economic environment are posing challenges to the industry in which we operate. A number ofeconomic factors, including gross domestic product, availability of consumer credit, interest rates, consumer sentiment and debt levels, retailtrends, housing starts, sales of existing homes, the level of mortgage refinancing and defaults, fiscal and credit market uncertainty, and foreigncurrency exchange rates, currency controls, inflation and deflation, generally affect demand for our products.
15
Economic uncertainty and related factors exacerbate negative trends in business and consumer spending and may cause certain customers topush out, cancel, or refrain from placing orders for our products. Uncertain market conditions, difficulties in obtaining capital, or reducedprofitability may also cause some customers to scale back operations, exit markets, merge with other retailers, or file for bankruptcy protection andpotentially cease operations, which can also result in lower sales and/or additional inventory. These conditions may similarly affect key suppliers,which could impair their ability to deliver parts and result in delays for our products or added costs. In addition, these conditions may lead tostrategic alliances by, or consolidation of, other appliance manufacturers, which could adversely affect our ability to compete effectively.
A decline in economic activity and conditions in certain areas in which we operate have had an adverse effect on our financial condition andresults of operations in recent years, and future declines and adverse conditions could have a similar adverse effect. Regional, political andeconomic instability in countries in which we do business may adversely affect business conditions, disrupt our operations, and have an adverseeffect on our financial condition and results of operations. Uncertainty about future economic and industry conditions also makes it morechallenging for us to forecast our operating results, make business decisions, and identify and prioritize the risks that may affect our businesses,sources and uses of cash, financial condition and results of operations. We may be required to implement additional cost reduction efforts,including restructuring activities, which may adversely affect our ability to capitalize on opportunities in a market recovery. In addition, ouroperations are subject to general credit, liquidity, foreign exchange, market and interest rate risks. Our ability to invest in our businesses, fundstrategic acquisitions and refinance maturing debt obligations depends in part on access to the capital markets.
If we do not timely and appropriately adapt to changes resulting from the uncertain macroeconomic environment and industry conditions, or todifficulties in the financial markets, or if we are unable to continue to access the capital markets, our business, financial condition and results ofoperations may be materially and adversely affected.
Significant differences between actual results and estimates of the amount of future funding for our pension plans and postretirementhealth care benefit programs, and significant changes in funding assumptions or significant increases in funding obligations due toregulatory changes, could adversely affect our financial results.
We have both funded and unfunded defined benefit pension plans that cover certain employees around the world. We also have unfundedpostretirement health care benefit plans for eligible retired employees. The Employee Retirement Income Security Act of 1974 (ERISA) and theInternal Revenue Code, as amended, govern the funding obligations for our U.S. pension plans, which are our principal pension plans. Our U.S.defined benefit plans were frozen on or before December 31, 2006 for substantially all participants. Since 2007, U.S. employees have beeneligible for an enhanced employer contribution under Whirlpool's defined contribution (401(k)) plan.
As of December 31 , 2018 , our projected benefit obligations under our pension plans and postretirement health and welfare benefit programsexceeded the fair value of plan assets by an aggregate of approximately $1.0 billion , including $0.6 billion of which was attributable to pensionplans and $0.4 billion of which was attributable to postretirement health care benefits. Estimates for the amount and timing of the future fundingobligations of these pension plans and postretirement health and welfare benefit plans are based on various assumptions. These assumptionsinclude discount rates, expected long-term rate of return on plan assets, life expectancies and health care cost trend rates. These assumptionsare subject to change based on changes in interest rates on high quality bonds, stock and bond market returns, health care cost trend rates andregulatory changes, all of which are largely outside our control. Significant differences in results or significant changes in assumptions maymaterially affect our postretirement obligations and related future contributions and expenses.
LEGAL & COMPLIANCE RISKS
Unfavorable results of legal and regulatory proceedings could materially adversely affect our business and financial condition andperformance.
We are subject to a variety of litigation and legal compliance risks relating to, among other things: products; intellectual property rights; incomeand non–income taxes; environmental matters; corporate matters; commercial matters; credit matters; competition laws; distribution, marketingand trade practice matters; anti–bribery and anti–corruption regulations; energy regulations; financial regulations; and employment and benefitmatters. For example, we are currently disputing certain income and non-income tax related assessments issued by Brazilian authorities (seeNote 7 and Note 14 to the Consolidated Financial Statements for additional information on these matters). Unfavorable outcomes regarding theseassessments could have a material adverse effect on our financial
16
statements in any particular reporting period. Results of legal and regulatory proceedings cannot be predicted with certainty and for some matters,such as class actions, no insurance is cost effectively available. Regardless of merit, legal and regulatory proceedings may be both time-consuming and disruptive to our operations and could divert the attention of our management and key personnel from our business operations.Such proceedings could also generate significant adverse publicity and have a negative impact on our reputation and brand image, regardless ofthe existence or amount of liability. We estimate loss contingencies and establish accruals as required by generally accepted accountingprinciples, based on our assessment of contingencies where liability is deemed probable and reasonably estimable, in light of the facts andcircumstances known to us at a particular point in time. Subsequent developments in legal proceedings, volatility in foreign currency exchangerates and other factors may affect our assessment and estimates of the loss contingency recorded and could result in an adverse effect on ourresults of operations in the period in which a liability would be recognized or cash flows for the period in which amounts would be paid. Actualresults may significantly vary from our reserves.
We are subject to, and could be further subject to, governmental investigations or actions by other third parties.
We are subject to various federal, foreign and state laws, including antitrust and product-related laws and regulations, violations of which caninvolve civil or criminal sanctions. Responding to governmental investigations or other actions may be both time-consuming and disruptive to ouroperations and could divert the attention of our management and key personnel from our business operations. The impact of these and otherinvestigations and lawsuits could have a material adverse effect on our financial position, liquidity and results of operations.
Changes in the legal and regulatory environment, including changes in taxes and tariffs, could limit our business activities, increaseour operating costs, reduce demand for our products or result in litigation.
The conduct of our businesses, and the production, distribution, sale, advertising, labeling, safety, transportation and use of many of our products,are subject to various laws and regulations administered by federal, state and local governmental agencies in the United States, as well as toforeign laws and regulations administered by government entities and agencies in countries in which we operate. These laws and regulations maychange, sometimes dramatically, as a result of political, economic or social events. Changes in laws, regulations or governmental policy and therelated interpretations may alter the environment in which we do business and may impact our results or increase our costs or liabilities. Inaddition, we incur and will continue to incur capital and other expenditures to comply with various laws and regulations, especially relating to theprotection of the environment, human health and safety and energy efficiency. These types of costs could adversely affect our financialperformance. Additionally, we could be subjected to future liabilities, fines or penalties or the suspension of product production for failing to complywith various laws and regulations, including environmental regulations. Cleanup obligations that might arise at any of our manufacturing sites orthe imposition of more stringent environmental laws in the future could also adversely affect us.
Additionally, as a global company based in the United States, we are exposed to the impact of U.S. tax changes, especially those that affect theeffective corporate income tax rate, including the recently enacted Tax Cuts and Jobs Act. In addition, the current domestic and internationalpolitical environment, including government shutdowns and changes to U.S. policies related to global trade and tariffs, has resulted in uncertaintysurrounding the future state of the global economy. The U.S. federal government may propose additional changes to international tradeagreements, tariffs, taxes, and other government rules and regulations. These regulatory changes could significantly impact our business andfinancial performance. For additional information about our consolidated tax provision, see Note 14 to the Consolidated Financial Statements, andfor additional information about global trade and tariffs, please see "Other Matters" in the Management's Discussion and Analysis section of thisAnnual Report on Form 10-K.
ITEM 1B. UNRESOLVED STAFF COMMENTS
None.
17
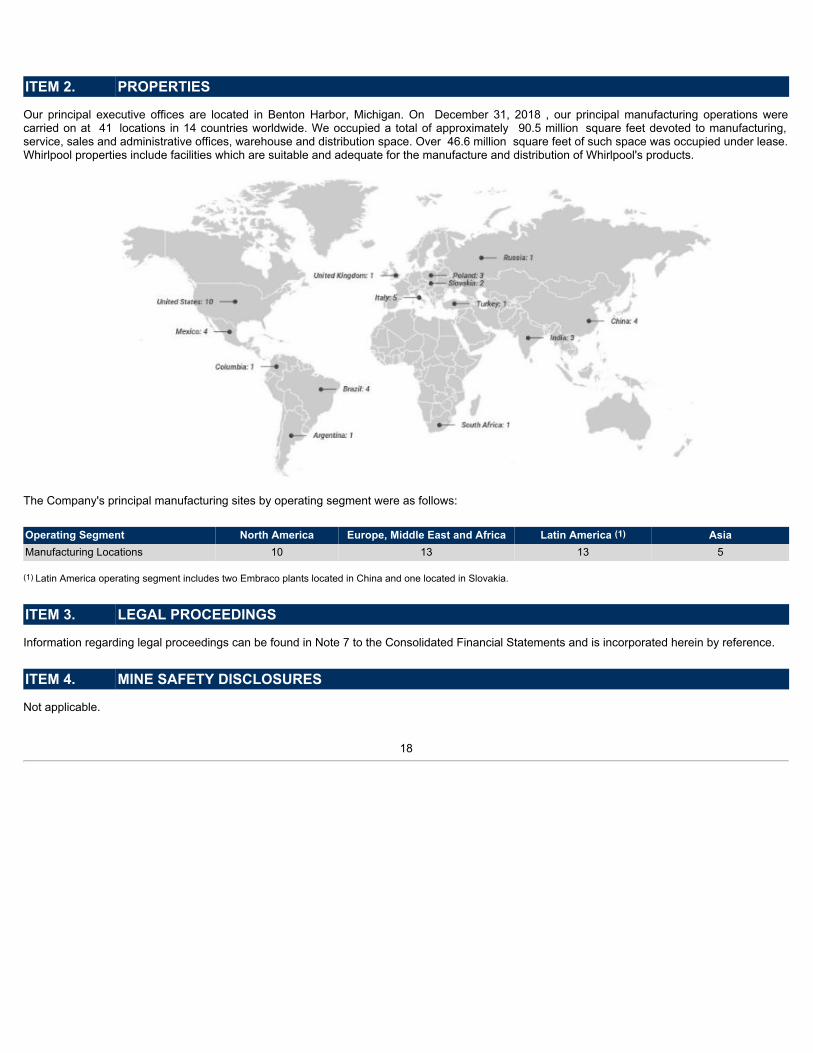
ITEM 2. PROPERTIES
Our principal executive offices are located in Benton Harbor, Michigan. On December 31, 2018 , our principal manufacturing operations werecarried on at 41 locations in 14 countries worldwide. We occupied a total of approximately 90.5 million square feet devoted to manufacturing,service, sales and administrative offices, warehouse and distribution space. Over 46.6 million square feet of such space was occupied under lease.Whirlpool properties include facilities which are suitable and adequate for the manufacture and distribution of Whirlpool's products.
The Company's principal manufacturing sites by operating segment were as follows:
Operating Segment North America Europe, Middle East and Africa Latin America (1) AsiaManufacturing Locations 10 13 13 5
(1) Latin America operating segment includes two Embraco plants located in China and one located in Slovakia.
ITEM 3. LEGAL PROCEEDINGS
Information regarding legal proceedings can be found in Note 7 to the Consolidated Financial Statements and is incorporated herein by reference.
ITEM 4. MINE SAFETY DISCLOSURES
Not applicable.
18
PART II
ITEM 5. MARKET FOR REGISTRANT'S COMMON EQUITY, RELATED STOCKHOLDER MATTERS ANDISSUER PURCHASES OF EQUITY SECURITIES
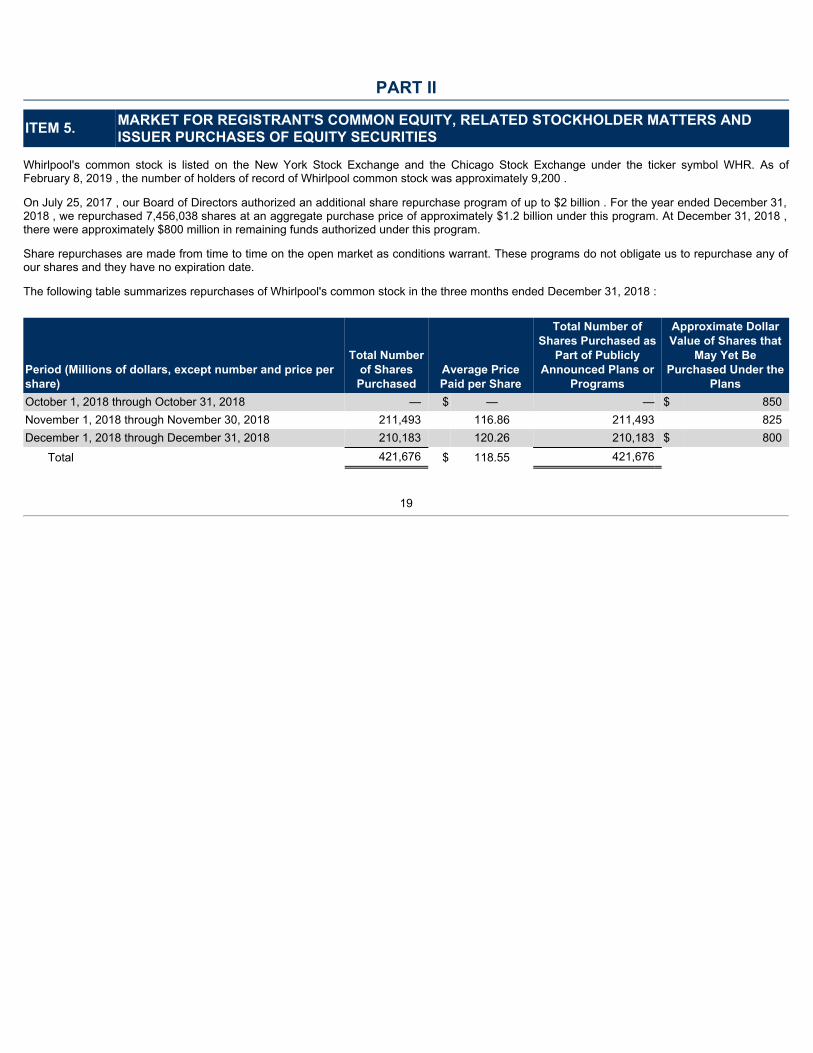
Whirlpool's common stock is listed on the New York Stock Exchange and the Chicago Stock Exchange under the ticker symbol WHR. As ofFebruary 8, 2019 , the number of holders of record of Whirlpool common stock was approximately 9,200 .
On July 25, 2017 , our Board of Directors authorized an additional share repurchase program of up to $2 billion . For the year ended December 31,2018 , we repurchased 7,456,038 shares at an aggregate purchase price of approximately $1.2 billion under this program. At December 31, 2018 ,there were approximately $800 million in remaining funds authorized under this program.
Share repurchases are made from time to time on the open market as conditions warrant. These programs do not obligate us to repurchase any ofour shares and they have no expiration date.
The following table summarizes repurchases of Whirlpool's common stock in the three months ended December 31, 2018 :
Period (Millions of dollars, except number and price pershare)
Total Numberof SharesPurchased
Average PricePaid per Share
Total Number ofShares Purchased as
Part of PubliclyAnnounced Plans or
Programs
Approximate DollarValue of Shares that
May Yet BePurchased Under the
PlansOctober 1, 2018 through October 31, 2018 — $ — — $ 850November 1, 2018 through November 30, 2018 211,493 116.86 211,493 825December 1, 2018 through December 31, 2018 210,183 120.26 210,183 $ 800 Total 421,676 $ 118.55 421,676
19
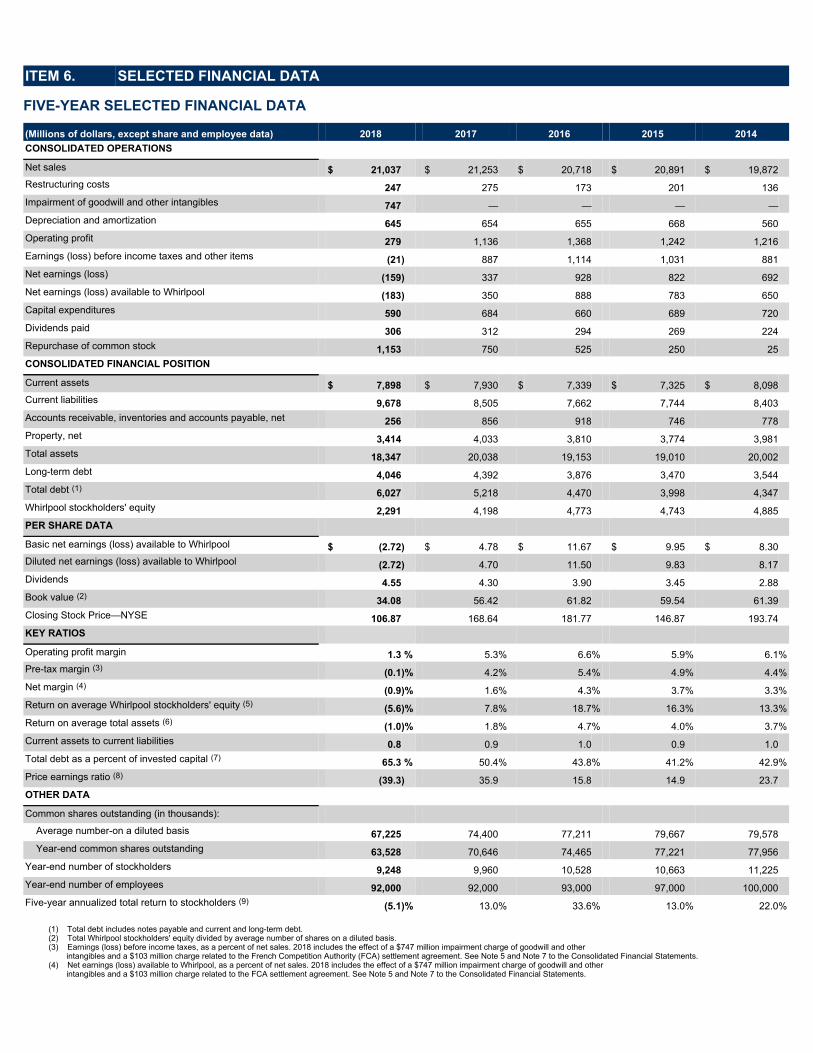
ITEM 6. SELECTED FINANCIAL DATA
FIVE-YEAR SELECTED FINANCIAL DATA
(Millions of dollars, except share and employee data) 2018 2017 2016 2015 2014CONSOLIDATED OPERATIONS Net sales $ 21,037 $ 21,253 $ 20,718 $ 20,891 $ 19,872Restructuring costs 247 275 173 201 136Impairment of goodwill and other intangibles 747 — — — —Depreciation and amortization 645 654 655 668 560Operating profit 279 1,136 1,368 1,242 1,216Earnings (loss) before income taxes and other items (21) 887 1,114 1,031 881Net earnings (loss) (159) 337 928 822 692Net earnings (loss) available to Whirlpool (183) 350 888 783 650Capital expenditures 590 684 660 689 720Dividends paid 306 312 294 269 224Repurchase of common stock 1,153 750 525 250 25CONSOLIDATED FINANCIAL POSITION Current assets $ 7,898 $ 7,930 $ 7,339 $ 7,325 $ 8,098Current liabilities 9,678 8,505 7,662 7,744 8,403Accounts receivable, inventories and accounts payable, net 256 856 918 746 778Property, net 3,414 4,033 3,810 3,774 3,981Total assets 18,347 20,038 19,153 19,010 20,002Long-term debt 4,046 4,392 3,876 3,470 3,544Total debt (1) 6,027 5,218 4,470 3,998 4,347Whirlpool stockholders' equity 2,291 4,198 4,773 4,743 4,885PER SHARE DATA Basic net earnings (loss) available to Whirlpool $ (2.72) $ 4.78 $ 11.67 $ 9.95 $ 8.30Diluted net earnings (loss) available to Whirlpool (2.72) 4.70 11.50 9.83 8.17Dividends 4.55 4.30 3.90 3.45 2.88Book value (2) 34.08 56.42 61.82 59.54 61.39Closing Stock Price—NYSE 106.87 168.64 181.77 146.87 193.74KEY RATIOS Operating profit margin 1.3 % 5.3% 6.6% 5.9% 6.1%Pre-tax margin (3) (0.1)% 4.2% 5.4% 4.9% 4.4%Net margin (4) (0.9)% 1.6% 4.3% 3.7% 3.3%Return on average Whirlpool stockholders' equity (5) (5.6)% 7.8% 18.7% 16.3% 13.3%Return on average total assets (6) (1.0)% 1.8% 4.7% 4.0% 3.7%Current assets to current liabilities 0.8 0.9 1.0 0.9 1.0Total debt as a percent of invested capital (7) 65.3 % 50.4% 43.8% 41.2% 42.9%Price earnings ratio (8) (39.3) 35.9 15.8 14.9 23.7OTHER DATA Common shares outstanding (in thousands): Average number-on a diluted basis 67,225 74,400 77,211 79,667 79,578 Year-end common shares outstanding 63,528 70,646 74,465 77,221 77,956Year-end number of stockholders 9,248 9,960 10,528 10,663 11,225Year-end number of employees 92,000 92,000 93,000 97,000 100,000Five-year annualized total return to stockholders (9) (5.1)% 13.0% 33.6% 13.0% 22.0%
(1) Total debt includes notes payable and current and long-term debt.(2) Total Whirlpool stockholders' equity divided by average number of shares on a diluted basis.(3) Earnings (loss) before income taxes, as a percent of net sales. 2018 includes the effect of a $747 million impairment charge of goodwill and other
intangibles and a $103 million charge related to the French Competition Authority (FCA) settlement agreement. See Note 5 and Note 7 to the Consolidated Financial Statements.(4) Net earnings (loss) available to Whirlpool, as a percent of net sales. 2018 includes the effect of a $747 million impairment charge of goodwill and other
intangibles and a $103 million charge related to the FCA settlement agreement. See Note 5 and Note 7 to the Consolidated Financial Statements.

20

(5) Net earnings (loss) available to Whirlpool, divided by average Whirlpool stockholders' equity. 2018 includes the effect of a $747 million impairmentcharge of goodwill and other intangibles and a $103 million charge related to the FCA settlement agreement. See Note 5 and Note 7 to the ConsolidatedFinancial Statements.
(6) Net earnings (loss) available to Whirlpool, divided by average total assets. 2018 includes the effect of a $747 million impairment charge of goodwill andother intangibles and a $103 million charge related to the FCA settlement agreement. See Note 5 and Note 7 to the Consolidated Financial Statements.
(7) Total debt divided by total debt and total stockholders' equity.(8) Closing stock price divided by diluted net earnings (loss) available to Whirlpool.(9) Stock appreciation plus reinvested dividends, divided by share price at the beginning of the period.
21
ITEM 7. MANAGEMENT'S DISCUSSION AND ANALYSIS OF FINANCIAL CONDITION AND RESULTS OFOPERATIONS
This Management Discussion and Analysis should be read in connection with the Consolidated Financial Statements, Notes to the ConsolidatedFinancial Statements and Selected Financial Data included in this Form 10-K. Certain references to particular information in the Notes to theConsolidated Financial Statements are made to assist readers.
OVERVIEWWhirlpool had a full-year GAAP net loss available to Whirlpool of $183 million compared to GAAP net earnings available to Whirlpool of $350 millionin the same prior-year period. Non-recurring items negatively impacted full-year net loss available to Whirlpool by approximately $850 million,including asset impairment charges related to the EMEA region and a settlement with the French Competition Authority ("FCA").
Whirlpool delivered ongoing (non-GAAP) EBIT margin of 6.3% for the full-year, overcoming significant external challenges. These results weredriven by positive global price/mix and strong cost discipline, which were offset by significant cost inflation and lower EMEA results. In addition, wedelivered very strong cash provided by operating activities and free cash flow driven by sustainable working capital improvement and the timing ofcertain payments.
We are pleased with the successful execution of our cost-based price increases, delivering positive price/mix in all regions. In addition, we tookstrong actions to address the weaker than anticipated results in EMEA and offset significant cost and currency challenges.
We are confident that our strategy and actions will drive positive results in 2019 and remain committed to generating strong free cash flow andmargin expansion.
22
MANAGEMENT'S DISCUSSION AND ANALYSIS OF FINANCIAL CONDITION ANDRESULTS OF OPERATIONS - (CONTINUED)
RESULTS OF OPERATIONSThe following table summarizes the consolidated results of operations:
December 31,
Consolidated - In Millions (except per share data) 2018 Better/(Worse) 2017 Better/(Worse) 2016Units (in thousands) 68,440 (4.6)% 71,704 —% 71,692Net sales $ 21,037 (1.0) $ 21,253 2.6 $ 20,718Gross margin 3,537 (1.8) 3,602 (2.2) 3,692Selling, general and administrative 2,189 (3.6) 2,112 (1.5) 2,080Restructuring costs 247 10.0 275 (58.9) 173Impairment of goodwill and other intangibles 747 nm — — —Interest and sundry (income) expense 108 (24.3) 87 6.5 93Interest expense 192 (18.2) 162 (0.7) 161Income tax expense 138 74.7 550 nm 186Net earnings (loss) available to Whirlpool (183) nm 350 (60.6) 888Diluted net earnings (loss) available to Whirlpool per share $ (2.72) nm $ 4.70 (59.1)% $ 11.50
nm: not meaningful
Consolidated net sales for 2018 decrease d 1.0% compared to 2017 , primarily driven by unit volume declines and unfavorable foreign currency,partially offset by favorable impacts from product price/mix. Excluding the impact of foreign currency, consolidated net sales for 2018 decreased0.1% compared to 2017 . Consolidated net sales for 2017 increased 2.6% compared to 2016 primarily driven by favorable impacts from productprice/mix and foreign currency. Excluding the impact of foreign currency, consolidated net sales for 2017 increased 1.5% compared to 2016 .
Effective January 1, 2018, we realigned the composition of certain segments to align with our new leadership reporting structure. We now report ourMexico business as a part of our Latin America segment and have shifted certain adjacent business from the North America segment to the Asiasegment. The determination of the Company's reportable segments was not affected by these changes. Prior year amounts have been reclassifiedto conform with current year presentation.
For additional information regarding non-GAAP financial measures including net sales excluding the impact of foreign currency, see the Non-GAAPFinancial Measures section of this Management's Discussion and Analysis.
The chart below summarizes the balance of net sales by operating segments for 2018 , 2017 and 2016 , respectively.
23

MANAGEMENT'S DISCUSSION AND ANALYSIS OF FINANCIAL CONDITION ANDRESULTS OF OPERATIONS - (CONTINUED)
The consolidated gross margin percentage for 2018 decreased to 16.8% compared to 16.9% in 2017 , primarily driven by the unfavorable impactfrom raw material inflation across all regions, tariffs and higher freight costs in the North America region, lower unit volumes in the EMEA region,partially offset by the favorable impact of product price/mix and restructuring benefits. The consolidated gross margin percentage for 2017decreased to 16.9% compared to 17.8% in 2016, primarily driven by unfavorable impacts from raw material inflation across all regions and productprice/mix in the EMEA region, partially offset by cost productivity and restructuring benefits.
24
MANAGEMENT'S DISCUSSION AND ANALYSIS OF FINANCIAL CONDITION ANDRESULTS OF OPERATIONS - (CONTINUED)
North AmericaFollowing are the results for the North America region:
2018 compared to 2017
Units sold for 2018 decreased 1.6% compared to 2017 .
2017 compared to 2016
Units sold for 2017 increased 6.1% compared to 2016 .
2018 compared to 2017
Net sales for 2018 increased 2.8% compared to 2017 primarily dueto the favorable impact of product price/mix, partially offset by unitvolume declines. Excluding the impact of foreign currency, net salesincreased 2.8% in 2018 .
2017 compared to 2016
Net sales for 2017 increased 5.0% compared to 2016 primarily due tounit volume growth. Excluding the impact of foreign currency, net salesincreased 4.8% in 2017 .
2018 compared to 2017
Gross margin percentage for 2018 increased compared to 2017primarily due to the favorable impact of product price/mix which waspartially offset by raw material inflation, tariffs and higher freight costs.
2017 compared to 2016
Gross margin percentage for 2017 decreased compared to 2016primarily due to raw material inflation, partially offset by unit volumegrowth and favorable cost productivity.
25
MANAGEMENT'S DISCUSSION AND ANALYSIS OF FINANCIAL CONDITION ANDRESULTS OF OPERATIONS - (CONTINUED)
EMEAFollowing are the results for the EMEA region:
2018 compared to 2017
Units sold for 2018 decreased 12.8% compared to 2017 .
2017 compared to 2016
Units sold for 2017 decreased 6.8% compared to 2016 .
2018 compared to 2017
Net sales for 2018 decreased 7.1% compared to 2017 primarily dueto unit volume declines, partially offset by the favorable impacts ofproduct/price mix and foreign currency. Excluding the impact offoreign currency, net sales decreased 8.5% in 2018 .
2017 compared to 2016
Net sales for 2017 decreased 5.2% compared to 2016 , primarily dueto unit volume declines, partially offset by a favorable impact fromforeign currency. Excluding the impact of foreign currency, net salesdecreased 6.8% in 2017 .
2018 compared to 2017
Gross margin percentage for 2018 decreased compared to 2017primarily due to the unfavorable productivity from unit volume declinesand raw material inflation, partially offset by the favorable impact ofproduct price/mix and foreign currency.
2017 compared to 2016
Gross margin percentage for 2017 decreased compared to 2016primarily due to unfavorable impacts of product price/mix, unitvolume declines and raw material inflation, partially offset by costproductivity and restructuring benefits.
26
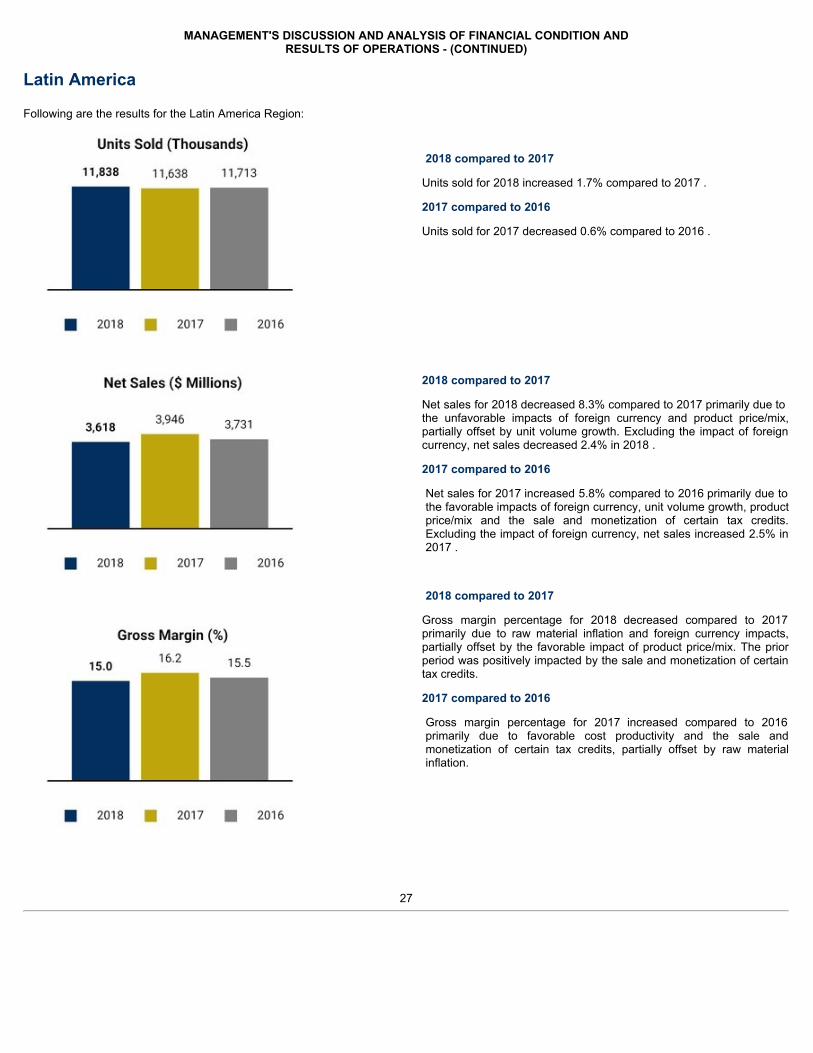
MANAGEMENT'S DISCUSSION AND ANALYSIS OF FINANCIAL CONDITION ANDRESULTS OF OPERATIONS - (CONTINUED)
Latin America
Following are the results for the Latin America Region:
2018 compared to 2017
Units sold for 2018 increased 1.7% compared to 2017 .
2017 compared to 2016
Units sold for 2017 decreased 0.6% compared to 2016 .
2018 compared to 2017
Net sales for 2018 decreased 8.3% compared to 2017 primarily due tothe unfavorable impacts of foreign currency and product price/mix,partially offset by unit volume growth. Excluding the impact of foreigncurrency, net sales decreased 2.4% in 2018 .
2017 compared to 2016
Net sales for 2017 increased 5.8% compared to 2016 primarily due tothe favorable impacts of foreign currency, unit volume growth, productprice/mix and the sale and monetization of certain tax credits.Excluding the impact of foreign currency, net sales increased 2.5% in2017 .
2018 compared to 2017
Gross margin percentage for 2018 decreased compared to 2017primarily due to raw material inflation and foreign currency impacts,partially offset by the favorable impact of product price/mix. The priorperiod was positively impacted by the sale and monetization of certaintax credits.
2017 compared to 2016
Gross margin percentage for 2017 increased compared to 2016primarily due to favorable cost productivity and the sale andmonetization of certain tax credits, partially offset by raw materialinflation.
27
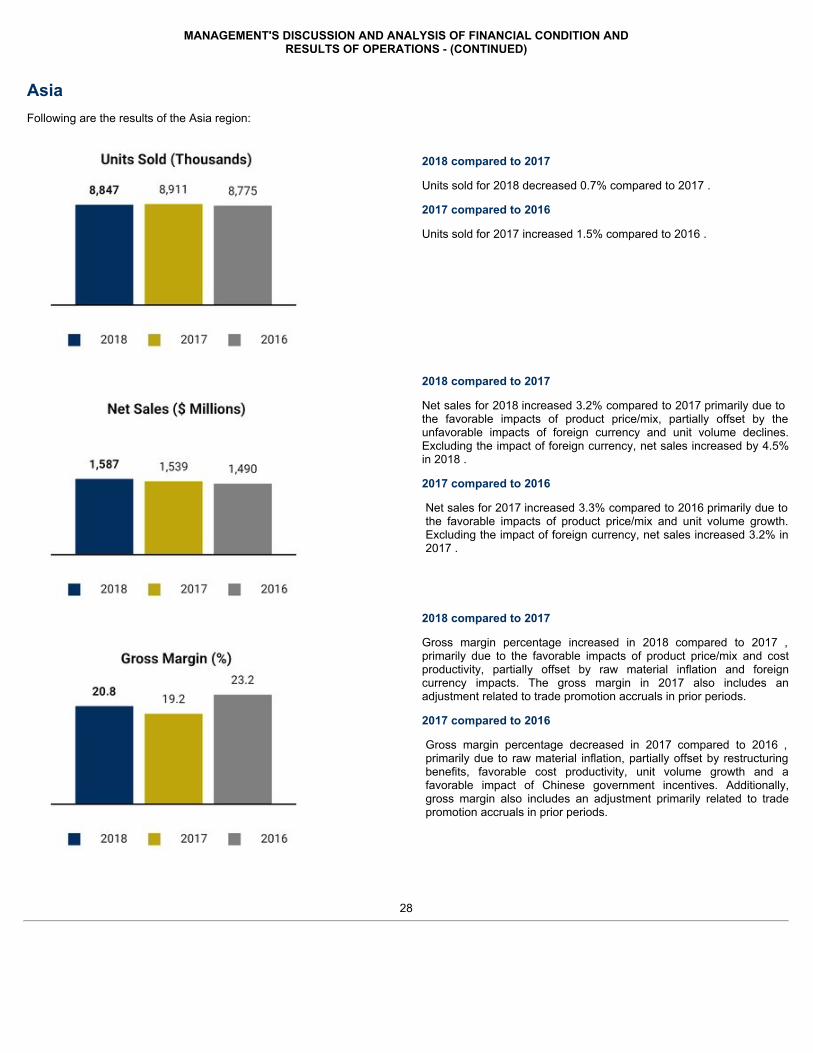
MANAGEMENT'S DISCUSSION AND ANALYSIS OF FINANCIAL CONDITION ANDRESULTS OF OPERATIONS - (CONTINUED)
AsiaFollowing are the results of the Asia region:
2018 compared to 2017
Units sold for 2018 decreased 0.7% compared to 2017 .
2017 compared to 2016
Units sold for 2017 increased 1.5% compared to 2016 .
2018 compared to 2017
Net sales for 2018 increased 3.2% compared to 2017 primarily due tothe favorable impacts of product price/mix, partially offset by theunfavorable impacts of foreign currency and unit volume declines.Excluding the impact of foreign currency, net sales increased by 4.5%in 2018 .
2017 compared to 2016
Net sales for 2017 increased 3.3% compared to 2016 primarily due tothe favorable impacts of product price/mix and unit volume growth.Excluding the impact of foreign currency, net sales increased 3.2% in2017 .
2018 compared to 2017
Gross margin percentage increased in 2018 compared to 2017 ,primarily due to the favorable impacts of product price/mix and costproductivity, partially offset by raw material inflation and foreigncurrency impacts. The gross margin in 2017 also includes anadjustment related to trade promotion accruals in prior periods.
2017 compared to 2016
Gross margin percentage decreased in 2017 compared to 2016 ,primarily due to raw material inflation, partially offset by restructuringbenefits, favorable cost productivity, unit volume growth and afavorable impact of Chinese government incentives. Additionally,gross margin also includes an adjustment primarily related to tradepromotion accruals in prior periods.
28
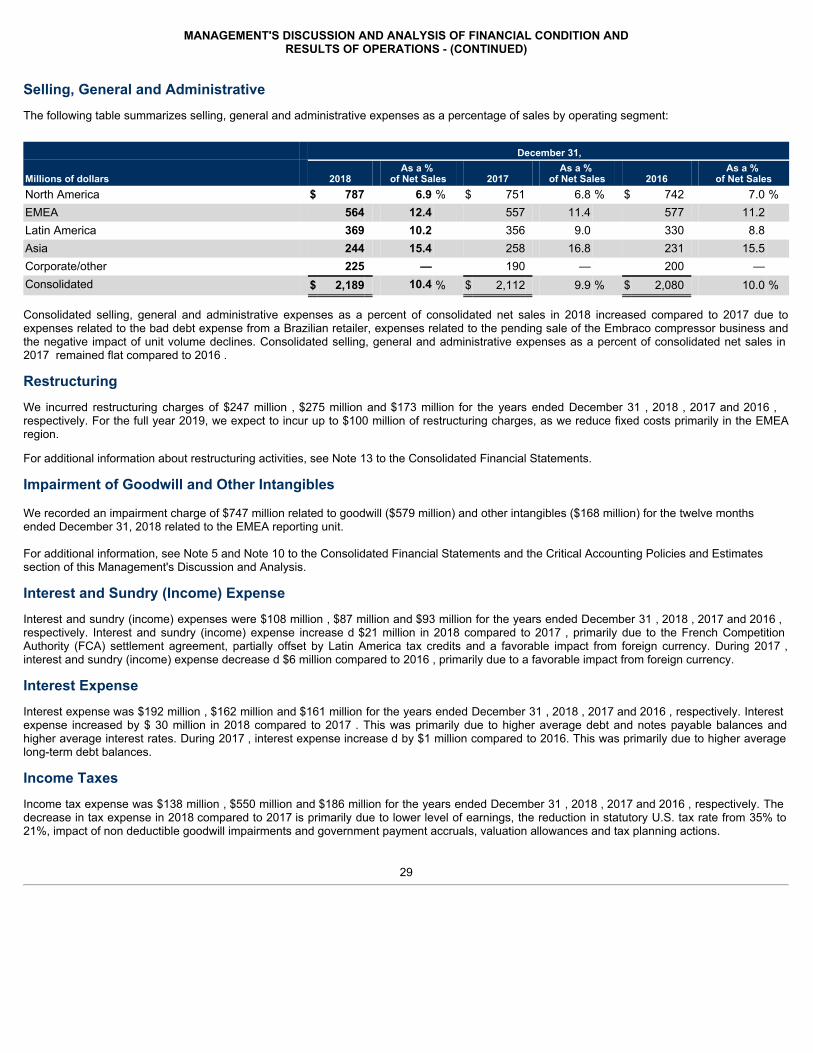
MANAGEMENT'S DISCUSSION AND ANALYSIS OF FINANCIAL CONDITION ANDRESULTS OF OPERATIONS - (CONTINUED)
Selling, General and AdministrativeThe following table summarizes selling, general and administrative expenses as a percentage of sales by operating segment:
December 31,
Millions of dollars 2018 As a %
of Net Sales 2017 As a %
of Net Sales 2016 As a %
of Net SalesNorth America $ 787 6.9 % $ 751 6.8 % $ 742 7.0 %EMEA 564 12.4 557 11.4 577 11.2 Latin America 369 10.2 356 9.0 330 8.8 Asia 244 15.4 258 16.8 231 15.5 Corporate/other 225 — 190 — 200 — Consolidated $ 2,189 10.4 % $ 2,112 9.9 % $ 2,080 10.0 %
Consolidated selling, general and administrative expenses as a percent of consolidated net sales in 2018 increased compared to 2017 due toexpenses related to the bad debt expense from a Brazilian retailer, expenses related to the pending sale of the Embraco compressor business andthe negative impact of unit volume declines. Consolidated selling, general and administrative expenses as a percent of consolidated net sales in 2017 remained flat compared to 2016 .
RestructuringWe incurred restructuring charges of $247 million , $275 million and $173 million for the years ended December 31 , 2018 , 2017 and 2016 ,respectively. For the full year 2019, we expect to incur up to $100 million of restructuring charges, as we reduce fixed costs primarily in the EMEAregion.
For additional information about restructuring activities, see Note 13 to the Consolidated Financial Statements.
Impairment of Goodwill and Other Intangibles
We recorded an impairment charge of $747 million related to goodwill ($579 million) and other intangibles ($168 million) for the twelve monthsended December 31, 2018 related to the EMEA reporting unit.
For additional information, see Note 5 and Note 10 to the Consolidated Financial Statements and the Critical Accounting Policies and Estimatessection of this Management's Discussion and Analysis.
Interest and Sundry (Income) ExpenseInterest and sundry (income) expenses were $108 million , $87 million and $93 million for the years ended December 31 , 2018 , 2017 and 2016 ,respectively. Interest and sundry (income) expense increase d $21 million in 2018 compared to 2017 , primarily due to the French CompetitionAuthority (FCA) settlement agreement, partially offset by Latin America tax credits and a favorable impact from foreign currency. During 2017 ,interest and sundry (income) expense decrease d $6 million compared to 2016 , primarily due to a favorable impact from foreign currency.
Interest ExpenseInterest expense was $192 million , $162 million and $161 million for the years ended December 31 , 2018 , 2017 and 2016 , respectively. Interestexpense increased by $ 30 million in 2018 compared to 2017 . This was primarily due to higher average debt and notes payable balances andhigher average interest rates. During 2017 , interest expense increase d by $1 million compared to 2016. This was primarily due to higher averagelong-term debt balances.
Income TaxesIncome tax expense was $138 million , $550 million and $186 million for the years ended December 31 , 2018 , 2017 and 2016 , respectively. Thedecrease in tax expense in 2018 compared to 2017 is primarily due to lower level of earnings, the reduction in statutory U.S. tax rate from 35% to21%, impact of non deductible goodwill impairments and government payment accruals, valuation allowances and tax planning actions.
29
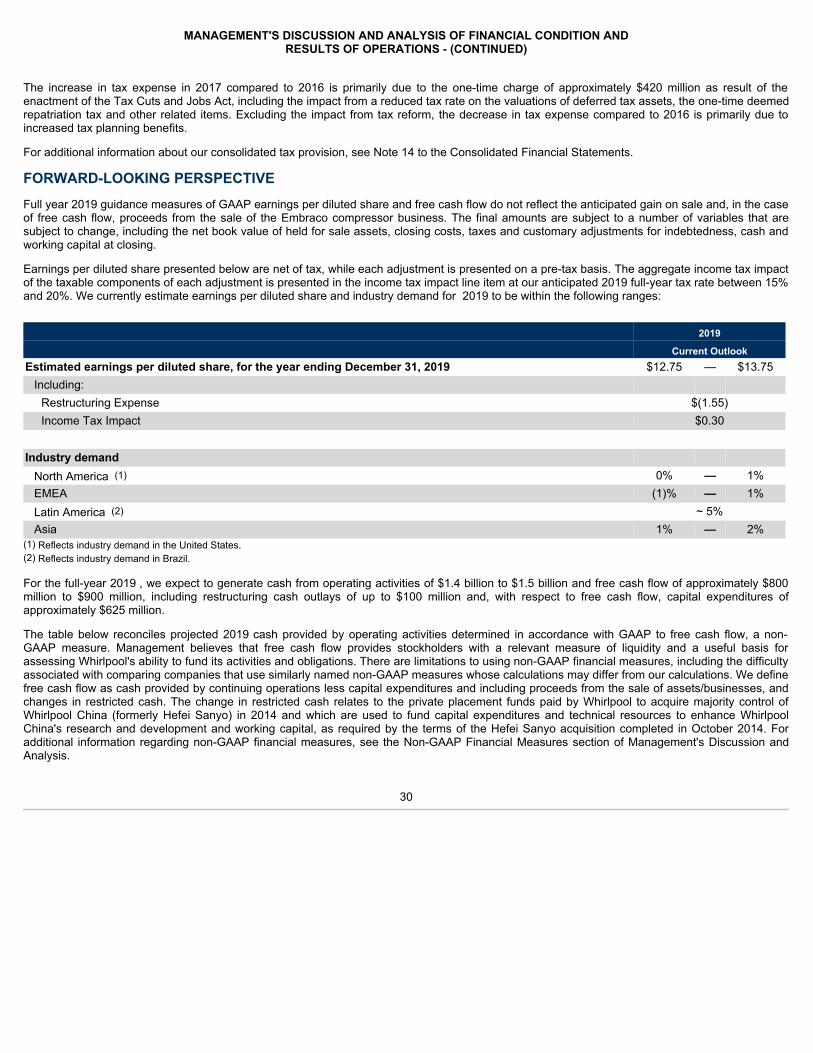
MANAGEMENT'S DISCUSSION AND ANALYSIS OF FINANCIAL CONDITION ANDRESULTS OF OPERATIONS - (CONTINUED)
The increase in tax expense in 2017 compared to 2016 is primarily due to the one-time charge of approximately $420 million as result of theenactment of the Tax Cuts and Jobs Act, including the impact from a reduced tax rate on the valuations of deferred tax assets, the one-time deemedrepatriation tax and other related items. Excluding the impact from tax reform, the decrease in tax expense compared to 2016 is primarily due toincreased tax planning benefits.
For additional information about our consolidated tax provision, see Note 14 to the Consolidated Financial Statements.
FORWARD-LOOKING PERSPECTIVEFull year 2019 guidance measures of GAAP earnings per diluted share and free cash flow do not reflect the anticipated gain on sale and, in the caseof free cash flow, proceeds from the sale of the Embraco compressor business. The final amounts are subject to a number of variables that aresubject to change, including the net book value of held for sale assets, closing costs, taxes and customary adjustments for indebtedness, cash andworking capital at closing.
Earnings per diluted share presented below are net of tax, while each adjustment is presented on a pre-tax basis. The aggregate income tax impactof the taxable components of each adjustment is presented in the income tax impact line item at our anticipated 2019 full-year tax rate between 15%and 20%. We currently estimate earnings per diluted share and industry demand for 2019 to be within the following ranges:
2019 Current OutlookEstimated earnings per diluted share, for the year ending December 31, 2019 $12.75 — $13.75
Including: Restructuring Expense $(1.55)Income Tax Impact $0.30
Industry demand
North America (1) 0% — 1%EMEA (1)% — 1%Latin America (2) ~ 5%Asia 1% — 2%
(1) Reflects industry demand in the United States.(2) Reflects industry demand in Brazil.
For the full-year 2019 , we expect to generate cash from operating activities of $1.4 billion to $1.5 billion and free cash flow of approximately $800million to $900 million, including restructuring cash outlays of up to $100 million and, with respect to free cash flow, capital expenditures ofapproximately $625 million.
The table below reconciles projected 2019 cash provided by operating activities determined in accordance with GAAP to free cash flow, a non-GAAP measure. Management believes that free cash flow provides stockholders with a relevant measure of liquidity and a useful basis forassessing Whirlpool's ability to fund its activities and obligations. There are limitations to using non-GAAP financial measures, including the difficultyassociated with comparing companies that use similarly named non-GAAP measures whose calculations may differ from our calculations. We definefree cash flow as cash provided by continuing operations less capital expenditures and including proceeds from the sale of assets/businesses, andchanges in restricted cash. The change in restricted cash relates to the private placement funds paid by Whirlpool to acquire majority control ofWhirlpool China (formerly Hefei Sanyo) in 2014 and which are used to fund capital expenditures and technical resources to enhance WhirlpoolChina's research and development and working capital, as required by the terms of the Hefei Sanyo acquisition completed in October 2014. Foradditional information regarding non-GAAP financial measures, see the Non-GAAP Financial Measures section of Management's Discussion andAnalysis.
30
MANAGEMENT'S DISCUSSION AND ANALYSIS OF FINANCIAL CONDITION ANDRESULTS OF OPERATIONS - (CONTINUED)
2019Millions of dollars Current OutlookCash provided by operating activities (1) $ 1,425 — $ 1,525Capital expenditures, proceeds from sale of assets/businesses and changes in restricted cash ~ (625)Free cash flow $ 800 — $ 900(1) Financial guidance on a GAAP basis for cash provided by (used in) financing activities and cash provided by (used in) investing activities has not been provided because inorder to prepare any such estimate or projection, the Company would need to rely on market factors and certain other conditions and assumptions that are outside of itscontrol.
The projections above are based on many estimates and are inherently subject to change based on future decisions made by management and theBoard of Directors of Whirlpool, and significant economic, competitive and other uncertainties and contingencies.
NON-GAAP FINANCIAL MEASURESWe supplement the reporting of our financial information determined under U.S. generally accepted accounting principles (GAAP) with certain non-GAAP financial measures, some of which we refer to as "ongoing" measures, including:
• Earnings before interest and taxes (EBIT)• Ongoing EBIT• Ongoing EBIT margin• Sales excluding currency• Ongoing net sales• Free cash flow
Ongoing measures exclude items that may not be indicative of, or are unrelated to, results from our ongoing operations and provide a betterbaseline for analyzing trends in our underlying businesses. Ongoing EBIT margin is calculated by dividing ongoing EBIT by net sales for 2018 andongoing net sales for 2017. Ongoing net sales for 2017 excludes $32 million primarily related to an adjustment for trade promotion accruals in priorperiods. Sales excluding foreign currency is calculated by translating the current period net sales, in functional currency, to U.S. dollars using theprior-year period's exchange rate compared to the prior-year period net sales. Management believes that sales excluding foreign currency providesstockholders with a clearer basis to assess our results over time, excluding the impact of exchange rate fluctuations. We also disclose segmentEBIT, which we define as operating profit less interest and sundry (income) expense, and ongoing segment EBIT as important financial metrics usedby the Company's Chief Operating Decision Maker to evaluate performance and allocate resources in accordance with ASC 280 - SegmentReporting. The Company provides free cash flow related metrics, such as free cash flow as a percentage of net sales, as long-term managementgoals, not an element of its annual financial guidance, and as such does not provide a reconciliation of free cash flow to cash provided by (used in)operating activities, the most directly comparable GAAP measure, for these long-term goal metrics. Any such reconciliation would rely on marketfactors and certain other conditions and assumptions that are outside of the Company's control.
We believe that these non-GAAP measures provide meaningful information to assist investors and stockholders in understanding our financialresults and assessing our prospects for future performance, and reflect an additional way of viewing aspects of our operations that, when viewedwith our GAAP financial measures, provide a more complete understanding of our business. Because non-GAAP financial measures are notstandardized, it may not be possible to compare these financial measures with other companies' non-GAAP financial measures having the same orsimilar names. These non-GAAP financial measures should not be considered in isolation or as a substitute for reported net earnings available toWhirlpool, net sales, and cash provided by (used in) operating activities, the most directly comparable GAAP financial measures. We stronglyencourage investors and stockholders to review our financial statements and publicly-filed reports in their entirety and not to rely on any singlefinancial measure.
Please refer to a reconciliation of these non-GAAP financial measures to the most directly comparable GAAP financial measures below.
31
MANAGEMENT'S DISCUSSION AND ANALYSIS OF FINANCIAL CONDITION ANDRESULTS OF OPERATIONS - (CONTINUED)
Ongoing Earnings Before Interest & Taxes (EBIT) Reconciliation:in millions
Twelve Months Ended December 31,
2018 2017 2016
Net earnings (loss) available to Whirlpool $ (183) $ 350 $ 888Net earnings (loss) available to noncontrolling interests 24 (13) 40Income tax expense 138 550 186Interest expense 192 162 161Earnings before interest & taxes $ 171 $ 1,049 $ 1,275
Restructuring expense 247 275 173France antitrust settlement 103 — —Impairment of goodwill and intangibles 747 — —Trade customer insolvency 30 — —Divestiture related transition costs 21 — —Out-of-period adjustment — 40 —Legacy product warranty and liability expense — — (23)Acquisition related transition costs — — 86Ongoing EBIT $ 1,319 $ 1,364 $ 1,511
Free Cash Flow (FCF) Reconciliation:in millions
Twelve Months Ended December 31,2018 2017 2016
Cash provided by operating activities $1,229 $1,264 $1,203Capital expenditures (590) (684) (660)Proceeds from sale of assets and businesses 160 61 63Change in restricted cash (1) 54 66 24Free cash flow $853 $707 $630(1) For additional information regarding restricted cash, see Note 3 to the Consolidated Financial Statements.
FINANCIAL CONDITION AND LIQUIDITYOur objective is to finance our business through operating cash flow and the appropriate mix of long-term and short-term debt. By diversifying thematurity structure, we avoid concentrations of debt and reduce liquidity risk. We have varying needs for short-term working capital financing as aresult of the nature of our business. We regularly review our capital structure and liquidity priorities, which include funding the business throughcapital and research and development spending to support innovation and productivity initiatives, funding our pension plan and term debt liabilities,providing return to shareholders and potential acquisitions.
Our short term potential uses of liquidity include funding our ongoing capital spending, restructuring activities, and returns to shareholders. We alsohave $947 million of term debt maturing in the next twelve months, and are currently evaluating our options, which may include repayment throughrefinancing, free cash flow generation, or cash on hand.
Notes payable consists of short-term borrowings payable to banks or commercial paper, which are generally used to fund working capitalrequirements. As of December 31, 2018, we have $1,034 million of notes payable outstanding which consists of short-term borrowings payable tobanks. We have no commercial paper outstanding at December 31, 2018. See Note 6 to the Consolidated Financial Statements for additionalinformation.
Whirlpool of India Limited (Whirlpool India), a majority-owned subsidiary of Whirlpool Corporation, announced in June 2018 that it had reached anagreement to acquire a 49% equity interest in Elica PB India. As part of the agreement, Whirlpool India received an option to acquire the remainingequity interest in the future for fair value, and the non-Whirlpool India shareholders of Elica PB India received an option to sell their remaining equityinterest to Whirlpool India in the future for fair value, which could be material to the financial statements depending on the performance of theventure. This transaction closed in the third quarter of 2018.
32
MANAGEMENT'S DISCUSSION AND ANALYSIS OF FINANCIAL CONDITION ANDRESULTS OF OPERATIONS - (CONTINUED)
We monitor the credit ratings and market indicators of credit risk of our lending, depository, and derivative counterparty banks regularly, and takecertain action to manage credit risk. We diversify our deposits and investments in short-term cash equivalents to limit the concentration of exposureby counterparty.
As of December 31, 2018 , we had cash or cash equivalents greater than 1% of our consolidated assets in China and Brazil, which represented3.2% and 1.4%, respectively. In addition, we did not have any third-party accounts receivable greater than 1% of our consolidated assets in anysingle country outside of the United States, with the exception of Italy and Mexico, which represented 1.3% and 1.1%, respectively. We continue tomonitor general financial instability and uncertainty globally.
The Company had cash and cash equivalents of approximately $1.5 billion at December 31, 2018 , of which substantially all was held bysubsidiaries in foreign countries. For each of its foreign subsidiaries, the Company makes an assertion regarding the amount of earnings intendedfor permanent reinvestment, with the balance available to be repatriated to the United States. The cash held by foreign subsidiaries for permanentreinvestment is generally used to finance the subsidiaries' operational activities and future foreign investments. Our intent is to permanently reinvestthese funds outside of the United States and our current plans do not demonstrate a need to repatriate the cash to fund our U.S. operations.However, if these funds were repatriated, we would be required to accrue and pay applicable United States taxes (if any) and withholding taxespayable to various countries. It is not practical to estimate the amount of the deferred tax liability associated with the repatriation of cash due to thecomplexity of its hypothetical calculation.
We continue to review customer conditions globally. As of December 31, 2018, we had 286 million reais (approximately $74 million) in short andlong-term receivables due to us from Maquina de Vendas S.A. In 2018, as part of their extrajudicial recovery plan, we agreed to receive payment ofour outstanding receivable, plus interest, over eight years under a tiered payment schedule. As of December 31, 2018, we have 127 million reais(approximately $32 million) of insurance against this credit risk through policies purchased from high-quality underwriters.
On October 15, 2018, Sears Holdings Corporation ("Sears") announced that it had filed for bankruptcy protection. As of December 31, 2018, we hadan immaterial accounts receivable and inventory exposure related to Sears. We believe the Sears bankruptcy will have a very limited short-termimpact on our results of operations as consumers adjust to the new retail landscape. Furthermore, we do not believe that the bankruptcy willmaterially impact our financial results over the long term.
In the past, when faced with a potential volume reduction from any one particular segment of our trade distribution network, we generally have beenable to offset such declines through increased sales throughout our broad distribution network.
For additional information on transfers and servicing of financial assets, accounts payable outsourcing and guarantees, see Note 1 and Note 7 to theConsolidated Financial Statements. For additional information on guarantees, see Note 7 to the Consolidated Financial Statements.
Embraco Sale Transaction
On April 24, 2018, we and certain of our subsidiaries entered into a purchase agreement with Nidec Corporation, a leading manufacturer of electricmotors incorporated under the laws of Japan, to sell our Embraco business unit.
Pursuant to the purchase agreement, at the closing of the transaction, Nidec will pay a purchase price of approximately $1.08 billion for the sale ofEmbraco. The purchase price is subject to customary adjustments including for indebtedness, cash and working capital of Embraco at closing.Whirlpool has agreed to retain certain liabilities relating to tax, environmental, labor and products following closing of the transaction. The purchaseagreement contains customary representations, conditions, warranties and covenants of the parties, including the requirement to obtain necessaryantitrust approvals, which have been received in the U.S., Brazil and China, and are still being considered in Europe and certain other jurisdictions.
The purchase agreement contains a closing deadline of April 24, 2019. In the unlikely event that closing does not occur by the closing deadline, theagreement permits closing up to six months later. The specific rights and obligations of the parties can be found in the purchase agreement, which isincorporated by reference into Exhibit 2(i) to this annual report of Form 10-K.
For additional information on the Embraco sale transaction, see Note 16 to the Consolidated Financial Statements.
33
MANAGEMENT'S DISCUSSION AND ANALYSIS OF FINANCIAL CONDITION ANDRESULTS OF OPERATIONS - (CONTINUED)
Share Repurchase ProgramFor additional information about our share repurchase program, see Note 11 to the Consolidated Financial Statements.
Sources and Uses of CashWe met our cash needs during 2018 through cash flows from operations, cash and cash equivalents, and financing arrangements. Our cash, cashequivalents and restricted cash at December 31, 2018 increased $245 million compared to the same period in 2017 .
The following table summarizes the net increase (decrease) in cash, cash equivalents and restricted cash for the periods presented. Significantdrivers of changes in our cash and cash equivalents balance during 2018 are discussed below:
Cash Flow Summary
Millions of dollars 2018 2017 2016Cash provided by (used in):
Operating activities $ 1,229 $ 1,264 $ 1,203Investing activities (399) (721) (612)Financing activities (518) (553) (278)Effect of exchange rate changes (67) 63 (36)
Net increase in cash, cash equivalents and restricted cash $ 245 $ 53 $ 277
Cash Flows from Operating ActivitiesThe decrease in cash provided by operating activities during 2018 primarily reflects $350 million of discretionary pension funding, partially offset bythe working capital impact from inventory reduction efforts, lower volumes and credit management activities. Net loss includes the non-cash impactsfrom impairment of goodwill and other intangibles.
The increase in cash provided by operating activities during 2017 was primarily driven by effective credit management, improvement in workingcapital and lower cash expenditures related to legacy product corrective action, partially offset by lower net earnings.
Cash provided by operating activities in 2016 reflects strong cash earnings and effective credit management and the impact of cash expendituresrelated to legacy product corrective action.
The timing of cash flows from operations varies significantly throughout the year primarily due to changes in production levels, sales patterns,promotional programs, funding requirements, credit management, as well as receivable and payment terms. Depending on the timing of cash flows,the location of cash balances, as well as the liquidity requirements of each country, external sources of funding are used to support working capitalrequirements.
Cash Flows from Investing ActivitiesThe decrease in cash used in investing activities during 2018 primarily reflects a decrease in capital expenditures (approximately $95 million),proceeds from a real estate sale-leaseback transaction (approximately $130 million) and the proceeds related to held-to-maturity securities(approximately $60 million).
The increase in cash used in investing activities during 2017 primarily reflects an increase in capital expenditures (approximately $25 million) andthe net impact of purchases (approximately $170 million) and proceeds (approximately $110 million) related to held-to-maturity securities.
Cash used in investing activities in 2016 primarily reflects capital expenditures (approximately $660 million).
34
MANAGEMENT'S DISCUSSION AND ANALYSIS OF FINANCIAL CONDITION ANDRESULTS OF OPERATIONS - (CONTINUED)
In June 2016, Whirlpool China Co., Ltd. ("Whirlpool China"), our majority-owned indirect subsidiary, entered into an agreement to return land userights for land now occupied by two Whirlpool China plants in Hefei, China to a division of the Hefei municipal government. The aggregate price forthe return of land use rights was approximately RMB 687 million (approximately $103 million as of June 27, 2016). Whirlpool China received RMB127 million (approximately $20 million) in 2018 and RMB 280 million (approximately $42 million) in 2017 and 2016. The related cash flow impactfrom these transactions is included in investing activities in each respective year.
Cash Flows from Financing ActivitiesThe decrease in cash used in financing activities during 2018 primarily reflects higher proceeds from borrowings of short-term debt (increase ofapproximately $300 million) and lower repayments of long-term debt (decrease of approximately $175 million), partially offset by higher sharerepurchase activity (increase of approximately $400 million). We also acquired the remaining minority interest in a subsidiary.
Cash used in financing activities during 2017 primarily reflects share repurchase activity and proceeds from borrowings (short-term and long-term)and repayments of long-term debt. The increase in cash used in financing activities in 2017 compared to 2016 was primarily due to higher sharerepurchase activity (increase of approximately $225 million).
Cash used in financing activities during 2016 primarily reflects share repurchase activity and proceeds from borrowings (short-term and long-term)and repayments of long-term debt.
Dividends paid in financing activities approximated $300 million during 2018, 2017 and 2016.
Whirlpool Subsidiary Share Repurchase
On July 12, 2016, Whirlpool S.A. ("WHR SA") and Brasmotor S.A. ("BMT"), both majority-owned indirect subsidiaries of Whirlpool Corporation,issued public announcements in Brazil reporting that Whirlpool do Brasil Ltda., the controlling shareholder of both WHR SA and BMT, intended toacquire the outstanding common and preferred shares of WHR SA and BMT by means of tender offers for the publicly-held shares. At that time,Whirlpool do Brasil Ltda. and other Whirlpool entities held 99.20% of the common and 95.68% of the preferred shares of WHR SA and 99.40% ofthe common and 93.55% of the preferred shares of BMT. The tender offers were launched in November 2016 and concluded in December 2016.The offer for BMT was successful and the squeeze-out was completed in January 2017 at a total cost of approximately $31 million. The WHR SAtender offer was abandoned because the minimum number of interested minority shareholders was not obtained.
Financing ArrangementsThe Company had total committed credit facilities of approximately $3.5 billion as of December 31, 2018 . The facilities reflect the Company'sgrowing global operations. The Company believes these facilities are sufficient to support its global operations. We had no borrowings outstandingunder the committed credit facilities at December 31, 2018 and 2017 , respectively.
For additional information about our financing arrangements, see Note 6 to the Consolidated Financial Statements.
DividendsIn April 2018, our Board of Directors approved a 4.5% increase in our quarterly dividend on our common stock to $1.15 per share from $1.10 pershare.
35
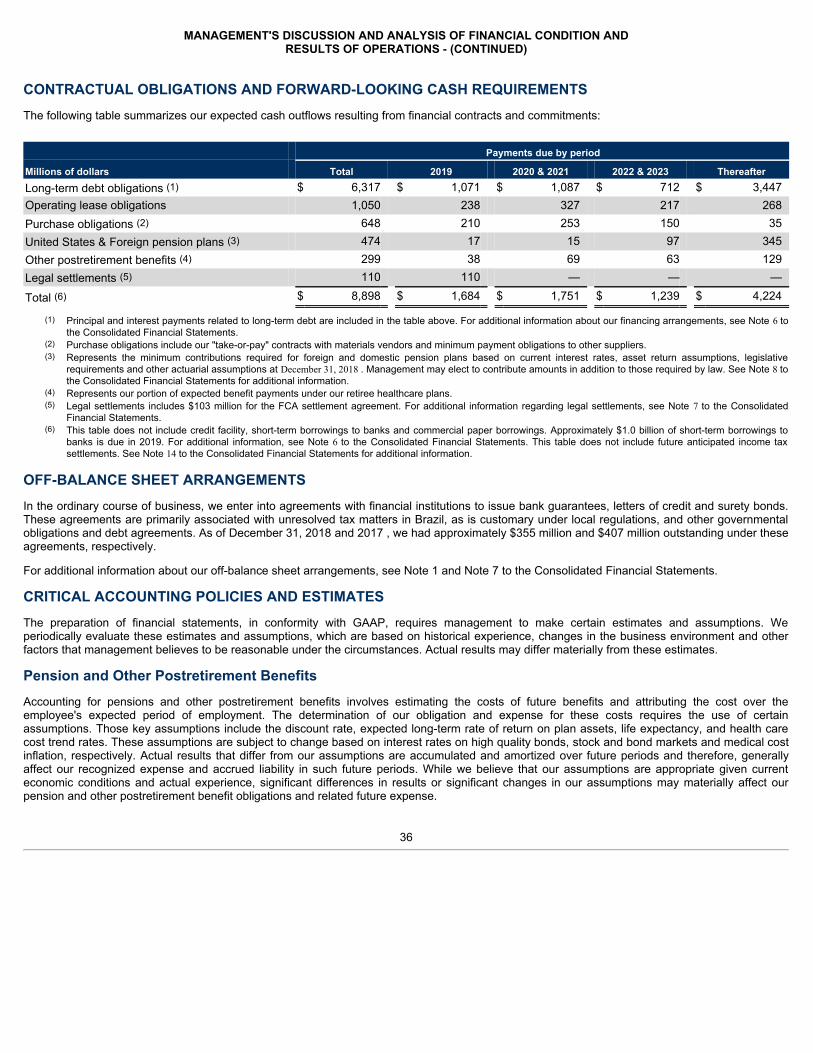
MANAGEMENT'S DISCUSSION AND ANALYSIS OF FINANCIAL CONDITION ANDRESULTS OF OPERATIONS - (CONTINUED)
CONTRACTUAL OBLIGATIONS AND FORWARD-LOOKING CASH REQUIREMENTSThe following table summarizes our expected cash outflows resulting from financial contracts and commitments:
Payments due by period
Millions of dollars Total 2019 2020 & 2021 2022 & 2023 ThereafterLong-term debt obligations (1) $ 6,317 $ 1,071 $ 1,087 $ 712 $ 3,447Operating lease obligations 1,050 238 327 217 268Purchase obligations (2) 648 210 253 150 35United States & Foreign pension plans (3) 474 17 15 97 345Other postretirement benefits (4) 299 38 69 63 129Legal settlements (5) 110 110 — — —
Total (6) $ 8,898 $ 1,684 $ 1,751 $ 1,239 $ 4,224
(1) Principal and interest payments related to long-term debt are included in the table above. For additional information about our financing arrangements, see Note 6 tothe Consolidated Financial Statements.
(2) Purchase obligations include our "take-or-pay" contracts with materials vendors and minimum payment obligations to other suppliers.(3) Represents the minimum contributions required for foreign and domestic pension plans based on current interest rates, asset return assumptions, legislative
requirements and other actuarial assumptions at December 31, 2018 . Management may elect to contribute amounts in addition to those required by law. See Note 8 tothe Consolidated Financial Statements for additional information.
(4) Represents our portion of expected benefit payments under our retiree healthcare plans.(5) Legal settlements includes $103 million for the FCA settlement agreement. For additional information regarding legal settlements, see Note 7 to the Consolidated
Financial Statements.(6) This table does not include credit facility, short-term borrowings to banks and commercial paper borrowings. Approximately $1.0 billion of short-term borrowings to
banks is due in 2019. For additional information, see Note 6 to the Consolidated Financial Statements. This table does not include future anticipated income taxsettlements. See Note 14 to the Consolidated Financial Statements for additional information.
OFF-BALANCE SHEET ARRANGEMENTSIn the ordinary course of business, we enter into agreements with financial institutions to issue bank guarantees, letters of credit and surety bonds.These agreements are primarily associated with unresolved tax matters in Brazil, as is customary under local regulations, and other governmentalobligations and debt agreements. As of December 31, 2018 and 2017 , we had approximately $355 million and $407 million outstanding under theseagreements, respectively.
For additional information about our off-balance sheet arrangements, see Note 1 and Note 7 to the Consolidated Financial Statements.
CRITICAL ACCOUNTING POLICIES AND ESTIMATESThe preparation of financial statements, in conformity with GAAP, requires management to make certain estimates and assumptions. Weperiodically evaluate these estimates and assumptions, which are based on historical experience, changes in the business environment and otherfactors that management believes to be reasonable under the circumstances. Actual results may differ materially from these estimates.
Pension and Other Postretirement BenefitsAccounting for pensions and other postretirement benefits involves estimating the costs of future benefits and attributing the cost over theemployee's expected period of employment. The determination of our obligation and expense for these costs requires the use of certainassumptions. Those key assumptions include the discount rate, expected long-term rate of return on plan assets, life expectancy, and health carecost trend rates. These assumptions are subject to change based on interest rates on high quality bonds, stock and bond markets and medical costinflation, respectively. Actual results that differ from our assumptions are accumulated and amortized over future periods and therefore, generallyaffect our recognized expense and accrued liability in such future periods. While we believe that our assumptions are appropriate given currenteconomic conditions and actual experience, significant differences in results or significant changes in our assumptions may materially affect ourpension and other postretirement benefit obligations and related future expense.
36
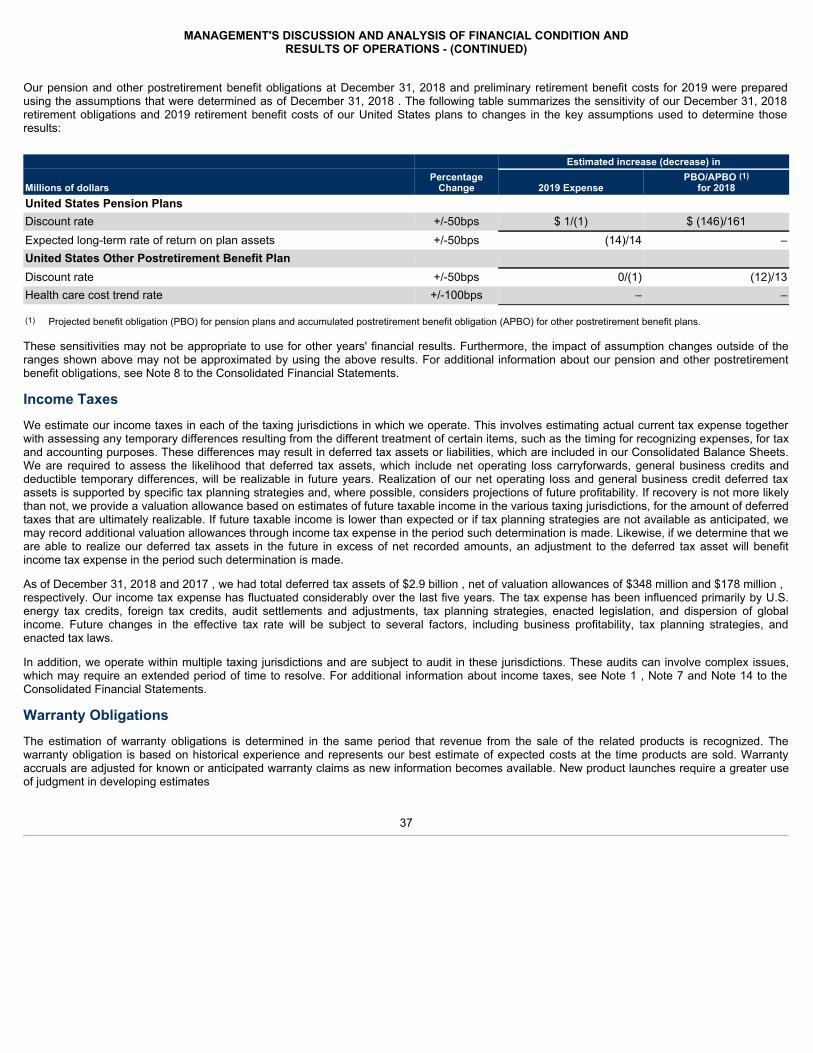
MANAGEMENT'S DISCUSSION AND ANALYSIS OF FINANCIAL CONDITION ANDRESULTS OF OPERATIONS - (CONTINUED)
Our pension and other postretirement benefit obligations at December 31, 2018 and preliminary retirement benefit costs for 2019 were preparedusing the assumptions that were determined as of December 31, 2018 . The following table summarizes the sensitivity of our December 31, 2018retirement obligations and 2019 retirement benefit costs of our United States plans to changes in the key assumptions used to determine thoseresults:
Estimated increase (decrease) in
Millions of dollarsPercentage
Change 2019 ExpensePBO/APBO (1)
for 2018United States Pension Plans Discount rate +/-50bps $ 1/(1) $ (146)/161Expected long-term rate of return on plan assets +/-50bps (14)/14 –United States Other Postretirement Benefit Plan Discount rate +/-50bps 0/(1) (12)/13Health care cost trend rate +/-100bps – –
(1) Projected benefit obligation (PBO) for pension plans and accumulated postretirement benefit obligation (APBO) for other postretirement benefit plans.
These sensitivities may not be appropriate to use for other years' financial results. Furthermore, the impact of assumption changes outside of theranges shown above may not be approximated by using the above results. For additional information about our pension and other postretirementbenefit obligations, see Note 8 to the Consolidated Financial Statements.
Income TaxesWe estimate our income taxes in each of the taxing jurisdictions in which we operate. This involves estimating actual current tax expense togetherwith assessing any temporary differences resulting from the different treatment of certain items, such as the timing for recognizing expenses, for taxand accounting purposes. These differences may result in deferred tax assets or liabilities, which are included in our Consolidated Balance Sheets.We are required to assess the likelihood that deferred tax assets, which include net operating loss carryforwards, general business credits anddeductible temporary differences, will be realizable in future years. Realization of our net operating loss and general business credit deferred taxassets is supported by specific tax planning strategies and, where possible, considers projections of future profitability. If recovery is not more likelythan not, we provide a valuation allowance based on estimates of future taxable income in the various taxing jurisdictions, for the amount of deferredtaxes that are ultimately realizable. If future taxable income is lower than expected or if tax planning strategies are not available as anticipated, wemay record additional valuation allowances through income tax expense in the period such determination is made. Likewise, if we determine that weare able to realize our deferred tax assets in the future in excess of net recorded amounts, an adjustment to the deferred tax asset will benefitincome tax expense in the period such determination is made.
As of December 31, 2018 and 2017 , we had total deferred tax assets of $2.9 billion , net of valuation allowances of $348 million and $178 million ,respectively. Our income tax expense has fluctuated considerably over the last five years. The tax expense has been influenced primarily by U.S.energy tax credits, foreign tax credits, audit settlements and adjustments, tax planning strategies, enacted legislation, and dispersion of globalincome. Future changes in the effective tax rate will be subject to several factors, including business profitability, tax planning strategies, andenacted tax laws.
In addition, we operate within multiple taxing jurisdictions and are subject to audit in these jurisdictions. These audits can involve complex issues,which may require an extended period of time to resolve. For additional information about income taxes, see Note 1 , Note 7 and Note 14 to theConsolidated Financial Statements.
Warranty ObligationsThe estimation of warranty obligations is determined in the same period that revenue from the sale of the related products is recognized. Thewarranty obligation is based on historical experience and represents our best estimate of expected costs at the time products are sold. Warrantyaccruals are adjusted for known or anticipated warranty claims as new information becomes available. New product launches require a greater useof judgment in developing estimates
37
MANAGEMENT'S DISCUSSION AND ANALYSIS OF FINANCIAL CONDITION ANDRESULTS OF OPERATIONS - (CONTINUED)
until historical experience becomes available. Future events and circumstances could materially change our estimates and require adjustments tothe warranty obligations. For additional information about warranty obligations, see Note 7 to the Consolidated Financial Statements.
Goodwill and Indefinite-Life Intangibles
Certain business acquisitions have resulted in the recording of goodwill and trademark assets which are not amortized. At December 31, 2018 and2017, we had goodwill of approximately $2.5 billion and $3.1 billion, respectively. We have trademark assets with a carrying value of approximately$1.9 billion and $2.0 billion as of December 31, 2018 and 2017, respectively.
We perform our annual impairment assessment for goodwill and other indefinite-life intangible assets as of October 1st or more frequently if eventsor changes in circumstances indicate that the asset might be impaired. We consider qualitative factors to assess if it is more likely than not that thefair value for goodwill or indefinite-life intangible assets is below the carrying amount. We may also elect to bypass the qualitative assessment andperform a quantitative assessment.
In conducting a qualitative assessment, the Company analyzes a variety of events or factors that may influence the fair value of the reporting unit orindefinite-life intangible, including, but not limited to: the results of prior quantitative assessments performed; changes in the carrying amount of thereporting unit or indefinite-life intangible; actual and projected revenue and EBIT margin; relevant market data for both the Company and its peercompanies; industry outlooks; macroeconomic conditions; liquidity; changes in key personnel; and the Company's competitive position. Significantjudgment is used to evaluate the totality of these events and factors to make the determination of whether it is more likely than not that the fair valueof the reporting unit or indefinite-life intangible is less than its carrying value.
For our annual impairment assessment as of October 1, 2018, the Company elected to bypass the qualitative assessment and perform aquantitative assessment to evaluate goodwill and certain brand trademarks. The Company elected to perform a qualitative assessment on the otherindefinite-life intangible assets noting no events that indicated that the fair value was less than carrying value that would require a quantitativeimpairment assessment.
During the second quarter of 2018, we identified impairment indicators for the goodwill in our EMEA reporting unit and the Indesitand Hotpoint*trademarks based on our qualitative assessment, which required us to complete an interim quantitative impairment assessment.
Goodwill Valuations
In performing a quantitative assessment, we estimate each reporting unit's fair value primarily by using the income approach. The income approachuses each reporting unit's projection of estimated operating results and cash flows that are discounted using a market participant discount ratebased on a weighted-average cost of capital. The financial projections reflect management's best estimate of economic and market conditions overthe projected period including forecasted revenue growth, EBIT margin, tax rate, capital expenditures, depreciation and amortization and changes inworking capital requirements. Other assumptions include discount rate and terminal growth rate. The estimated fair value of each reporting unit iscompared to their respective carrying values.
Additionally we validate our estimates of fair value under the income approach by comparing the values to fair value estimates using a marketapproach. A market approach estimates fair value by applying cash flow multiples to the operating performance of each reporting unit. The multiplesare derived from comparable publicly traded companies with operating and investment characteristics similar to the reporting units. We alsocorroborate the fair value through a market capitalization reconciliation to determine whether the implied control premium is reasonable based onrecent market transactions and other qualitative considerations.
Interimimpairmentassessment
In connection with the preparation of our Consolidated Condensed Financial Statements for the three months ended June 30, 2018, we identifiedindicators of goodwill impairment for our EMEA reporting unit based on our qualitative assessment, which required us to complete an interimquantitative impairment assessment. The primary indicator of
*Whirlpool ownership of the Hotpoint brand in the EMEA and Asia Pacific regions is not affiliated with the Hotpoint brand sold in the Americas.
38
MANAGEMENT'S DISCUSSION AND ANALYSIS OF FINANCIAL CONDITION ANDRESULTS OF OPERATIONS - (CONTINUED)
impairment for our EMEA reporting unit was the segment's continuing negative financial performance in 2018 that did not improve as anticipated,primarily driven by significant volume loss. The actual operating results for the three-months ended June 30, 2018 were significantly lower thanforecasted resulting in weak business performance. While the Indesit integration activities were substantially complete, as of the interim impairmentdate, the operating and macro-environment in the EMEA region continued to be very challenging and had not improved as anticipated. While ourcommercial transformation and supply chain initiatives were progressing, as of the impairment determination date, progress on market sharerecovery was slower than previously anticipated and the business has been impacted by raw material inflation and currency headwinds.
In evaluating the EMEA reporting unit, significant weight was provided to the forecasted EBIT margins and discount rate used in the discounted cashflow model, as we determined that these items have the most significant impact on the fair value of this reporting unit.
The average 5-year forecasted EBIT margin in the discounted cash flow model was approximately 5% and the discount rate was 12% based onmarket participant assumptions.
Based on our interim quantitative impairment assessment, the carrying value of the EMEA reporting unit exceeded its fair value by $579 million andwe recorded a goodwill impairment charge during the second quarter of 2018.
Annualimpairmentassessment
Based on the results of our annual quantitative assessment performed as of October 1, 2018, the fair values of our NAR, Asia and LAR reportingunits exceeded their respective carrying values by 111%, 165% and 31%, respectively.
Based on the quantitative assessment performed for the EMEA reporting unit, the fair value of the reporting unit exceeded its carrying value by lessthan 1%, which was consistent with management's expectation given the short time period between our interim and annual impairmentassessments. The EMEA reporting unit has goodwill of approximately $300 million at December 31, 2018.
In evaluating the EMEA reporting unit, significant weight was provided to the forecasted EBIT margins and discount rate used in the discounted cashflow model, as we determined that these items have the most significant impact on the fair value of this reporting unit.
• Forecasted EBIT margins are expected to recover as we stabilize volumes, sustain price/mix and recover market share and benefit from therecently announced strategic actions to rightsize and refocus the business. The 5-year average forecasted EBIT margin in the discountedcash flow model was approximately 4%.
• We used a discount rate of 11.25% based on market participant assumptions.
We performed a sensitivity analysis on our estimated fair value noting that a 100 basis point increase in the discount rate or a 5% reduction in theprojected EBIT margins in the forecasted periods would result in an impairment charge of $278 million and $148 million, respectively.
If actual results are not consistent with management's estimates and assumptions, a material impairment charge of goodwill could occur, whichwould have a material adverse effect on our consolidated financial statements.
Indefinite-Life Intangible Valuations
In performing a quantitative assessment of indefinite life intangible assets other than goodwill, primarily trademarks, we estimate the fair value ofthese intangible assets using the relief-from-royalty method which requires assumptions related to projected revenues from our annual long-rangeplan; assumed royalty rates that could be payable if we did not own the trademark; and a market participant discount rate based on a weighted-average cost of capital. If the estimated fair value of the indefinite-lived intangible asset is less than its carrying value, we would recognize animpairment loss.
39
MANAGEMENT'S DISCUSSION AND ANALYSIS OF FINANCIAL CONDITION ANDRESULTS OF OPERATIONS - (CONTINUED)
Interimimpairmentassessment
In connection with the preparation of our Consolidated Condensed Financial Statements for three months ended June 30, 2018, we identifiedindicators of impairment associated with other intangible assets in our EMEA reporting unit based on our qualitative assessment, which required usto complete an interim quantitative impairment assessment. The primary indicator of impairment was the continuing decline in revenue from weakervolumes through the six months ended June 30, 2018 that did not improve as anticipated. The actual operating results for the three months endedJune 30, 2018 were significantly lower than forecasted.
In performing the quantitative analysis on these assets, significant assumptions used in our relief-from-royalty method includes revenue growthrates, assumed royalty rates and the discount rate.
We used a royalty rate and discount rate of 3% and 15%, respectively, for Indesit and a royalty rate and discount rate of 3.5% and 15.5%,respectively, for Hotpoint*.
Based on our interim quantitative impairment assessment, the carrying value of certain other intangible assets, including Indesitand Hotpoint* ,exceeded their fair value, and we recorded an impairment charge of $168 million during the second quarter of 2018.
Annualimpairmentassessment
Based on the results of our annual quantitative assessment performed as of October 1, 2018, we determined there was an immaterial impairment asa result of the restructuring initiative to exit from domestic sales operations (not including manufacturing operations) in Turkey. There were no otherimpairments of indefinite-life intangible assets in 2018.
The fair value of the Indesit trademark exceeded its carrying value of $220 million by less than 1%. The fair value of the Hotpoint* trademarkapproximated its carrying value of $155 million. We expect revenue trends for both these brands to improve as we stabilize volumes, recover marketshare and benefit from our new product investments in the EMEA region.
The fair value of the Maytagtrademark exceeded its carrying value of $1,021 million by approximately 2%. We expect revenue trends for this brandto improve as we recover temporary volume loss from previously announced cost-based price increases, and continue to execute our brandleadership strategy and benefit from our new product investments.
The fair values of all other trademarks exceeded their carrying values by more than 20%.
In performing the quantitative assessment on these assets, significant assumptions used in our relief-from-royalty model included revenue growthrates, assumed royalty rates and the discount rate, which are discussed further below.
Revenue growth rates relate to projected revenues from our financial planning and analysis process and vary from brand to brand. Adverse changesin the operating environment or our inability to grow revenues at the forecasted rates may result in a material impairment charge. We performed asensitivity analysis on our estimated fair values noting a 10% reduction of forecasted revenues in the Indesit , Hotpoint*and Maytag trademarkswould result in an impairment charge of approximately $23 million, $23 million and $81 million, respectively.
In determining royalty rates for the valuation of our trademarks, we considered factors that affect the assumed royalty rates that would hypotheticallybe paid for the use of trademarks. The most significant factors in determining the assumed royalty rates include the overall role and importance ofthe trademarks in the particular industry, the profitability of the products utilizing the trademarks, and the position of the trademarked products in thegiven market segment. Based on this analysis, we determined a royalty rate of 3%, 3.5% and 4% for our Indesit, Hotpoint*and Maytagtrademarks,respectively. We performed a sensitivity analysis on our estimated fair values for Indesit, Hotpoint*and Maytagnoting a 50 basis point reduction ofthe royalty rates from each brand would result in an impairment charge of approximately $35 million, $46 million and $106 million, respectively.
*Whirlpool ownership of the Hotpoint brand in the EMEA and Asia Pacific regions is not affiliated with the Hotpoint brand sold in the Americas.
40
MANAGEMENT'S DISCUSSION AND ANALYSIS OF FINANCIAL CONDITION ANDRESULTS OF OPERATIONS - (CONTINUED)
In developing discount rates for the valuation of our trademarks, we used a market participant discount rate based on a weighted-average cost ofcapital, adjusted for higher relative level of risks associated with doing business in other countries, as applicable, as well as the higher relative levelsof risks associated with intangible assets. Based on this analysis, we determined the discount rates to be 15%, 15.5% and 10% for Indesit ,Hotpoint*and Maytag, respectively. We performed a sensitivity analysis on our estimated fair values for Indesit, Hotpoint*and Maytagnoting a 100basis point increase in the discount rate would result in an impairment charge of approximately $17 million, $17 million and $101 million,respectively.
If actual results are not consistent with management's estimate and assumptions, a material impairment charge of our trademarks could occur,which could have a material adverse effect on our consolidated financial statements.
For additional information about goodwill and indefinite-life intangible valuations, see Note 5 and Note 10 to the Consolidated Financial Statements.
The estimates of future cash flows used in determining the fair value of goodwill and intangible assets involve significant management judgment andare based upon assumptions about expected future operating performance, economic conditions, market conditions and cost of capital. Inherent inestimating the future cash flows are uncertainties beyond our control, such as changes in capital markets. The actual cash flows could differmaterially from management's estimates due to changes in business conditions, operating performance and economic conditions.
ISSUED BUT NOT YET EFFECTIVE ACCOUNTING PRONOUNCEMENTSAdditional information regarding recently issued accounting pronouncements can be found in Note 1 to the Consolidated Financial Statements.
OTHER MATTERSFor additional information regarding certain of our loss contingencies/litigation, see Note 7 to the Consolidated Financial Statements.
Grenfell TowerOn June 23, 2017, London's Metropolitan Police Service released a statement that it had identified a Hotpoint–branded refrigerator as the initialsource of the Grenfell Tower fire in West London. U.K. authorities are conducting investigations, including regarding the cause and spread of thefire. The model in question was manufactured by Indesit Company between 2006 and 2009, prior to Whirlpool's acquisition of Indesit in 2014. Weare fully cooperating with the investigating authorities. As these matters are ongoing, we cannot speculate on their eventual outcomes or potentialimpact on our financial statements; accordingly, we have not recorded any significant charges in 2017 and 2018. Claims may be filed related to thisincident.
Antidumping and Safeguard Petition
As previously reported, Whirlpool filed petitions in 2011 and 2015 alleging that Samsung, LG and Electrolux violated U.S. and international tradelaws by dumping washers into the U.S. Those petitions resulted in orders imposing antidumping duties on certain washers imported from SouthKorea, Mexico, and China, and countervailing duties on certain washers from South Korea. These orders could be subject to administrative reviewsand possible appeals. The South Korea and Mexico orders are currently being reviewed to determine whether the orders should continue to remainin effect for another five years.
Whirlpool also filed a safeguard petition in May 2017 to address our concerns that Samsung and LG are evading U.S. trade laws by movingproduction from countries covered by antidumping orders. A safeguard remedy went into effect in February 2018, implementing tariffs on finishedwashers and certain covered parts for three years. During the second year of the remedy, beginning February 7, 2019, the remedy imposes an 18%tariff on the first 1.2 million large residentialwashing machines imported into the United States and a 45% tariff on such imports in excess of 1.2 million, and also imposes a 45% tariff onwasher tub, drum, and cabinet imports in excess of 70,000 units. The tariff rates on washersand covered parts will decline slightly during the third year of the remedy. The safeguard remedy will be subject to an interim review by theInternational Trade Commission during 2019.
*Whirlpool ownership of the Hotpoint brand in the EMEA and Asia Pacific regions is not affiliated with the Hotpoint brand sold in the Americas.
41
MANAGEMENT'S DISCUSSION AND ANALYSIS OF FINANCIAL CONDITION ANDRESULTS OF OPERATIONS - (CONTINUED)
U.S. Tariffs and Global EconomyThe current domestic and international political environment, including existing and potential changes to U.S. policies related to global trade andtariffs, have resulted in uncertainty surrounding the future state of the global economy. The impact of previously-announced U.S. tariffs on steel andaluminum was a component of increased raw material costs during the year ended December 31, 2018 . We expect these and other tariffs to impactmaterial costs in future quarters, which could require us to modify our current business practices and could have a material adverse effect on ourfinancial statements in any particular reporting period.
Post-Retirement Benefit LitigationFor information regarding post-retirement benefit litigation, see Note 8 to the Consolidated Financial Statements.
FORWARD-LOOKING STATEMENTSThe Private Securities Litigation Reform Act of 1995 provides a safe harbor for forward-looking statements made by us or on our behalf. Certainstatements contained in this annual report, including those within the forward-looking perspective section within this Management's Discussion andAnalysis, and other written and oral statements made from time to time by us or on our behalf do not relate strictly to historical or current facts andmay contain forward-looking statements that reflect our current views with respect to future events and financial performance. As such, they areconsidered "forward-looking statements" which provide current expectations or forecasts of future events. Such statements can be identified by theuse of terminology such as "may," "could," "will," "should," "possible," "plan," "predict," "forecast," "potential," "anticipate," "estimate," "expect,""project," "intend," "believe," "may impact," "on track," and similar words or expressions. Our forward-looking statements generally relate to ourgrowth strategies, financial results, product development, and sales efforts. These forward-looking statements should be considered with theunderstanding that such statements involve a variety of risks and uncertainties, known and unknown, and may be affected by inaccurateassumptions. Consequently, no forward-looking statement can be guaranteed and actual results may vary materially.
This document contains forward-looking statements about Whirlpool Corporation and its consolidated subsidiaries ("Whirlpool") that speak only as ofthis date. Whirlpool disclaims any obligation to update these statements. Forward-looking statements in this document may include, but are notlimited to, statements regarding expected earnings per share, cash flow, productivity and raw material prices. Many risks, contingencies anduncertainties could cause actual results to differ materially from Whirlpool's forward-looking statements. Among these factors are: (1) intensecompetition in the home appliance industry reflecting the impact of both new and established global competitors, including Asian and Europeanmanufacturers, and the impact of the changing retail environment; (2) Whirlpool's ability to maintain or increase sales to significant trade customersand the ability of these trade customers to maintain or increase market share; (3) Whirlpool's ability to maintain its reputation and brand image; (4)the ability of Whirlpool to achieve its business plans, productivity improvements, and cost control objectives, and to leverage its global operatingplatform, and accelerate the rate of innovation; (5) Whirlpool's ability to obtain and protect intellectual property rights; (6) acquisition and investment-related risks, including risks associated with our past acquisitions, and risks associated with our increased presence in emerging markets; (7) risksrelated to our international operations, including changes in foreign regulations, regulatory compliance and disruptions arising from political, legaland economic instability; (8) information technology system failures, data security breaches, network disruptions, and cybersecurity attacks; (9)product liability and product recall costs; (10) the ability of suppliers of critical parts, components and manufacturing equipment to deliver sufficientquantities to Whirlpool in a timely and cost-effective manner; (11) our ability to attract, develop and retain executives and other qualified employees;(12) the impact of labor relations; (13) fluctuations in the cost of key materials (including steel, resins, copper and aluminum) and components andthe ability of Whirlpool to offset cost increases; (14) Whirlpool's ability to manage foreign currency fluctuations; (15) impacts from goodwillimpairment and related charges; (16) triggering events or circumstances impacting the carrying value of our long-lived assets; (17) inventory andother asset risk; (18) the uncertain global economy and changes in economic conditions which affect demand for our products; (19) health care costtrends, regulatory changes and variations between results and estimates that could increase future funding obligations for pension andpostretirement benefit plans; (20) litigation, tax, and legal compliance risk and costs, especially if materially different from the amount we expect toincur or have accrued for, and any disruptions caused by the same; (21) the effects and costs of governmental investigations or related actions bythird parties; and (22) changes in the legal and regulatory environment including environmental, health and safety regulations, and taxes and tariffs.
42
MANAGEMENT'S DISCUSSION AND ANALYSIS OF FINANCIAL CONDITION ANDRESULTS OF OPERATIONS - (CONTINUED)
We undertake no obligation to update any forward-looking statement, and investors are advised to review disclosures in our filings with the SEC. It isnot possible to foresee or identify all factors that could cause actual results to differ from expected or historic results. Therefore, investors should notconsider the foregoing factors to be an exhaustive statement of all risks, uncertainties, or factors that could potentially cause actual results to differfrom forward-looking statements.
Additional information concerning these and other factors can be found in "Risk Factors" in Item 1A of this report.
ITEM 7A. QUANTITATIVE AND QUALITATIVE DISCLOSURES ABOUT MARKET RISK
MARKET RISKWe have in place an enterprise risk management process that involves systematic risk identification and mitigation covering the categories ofenterprise, strategic, financial, operational and compliance and reporting risks. The enterprise risk management process receives Board of Directorsand management oversight, drives risk mitigation decision-making and is fully integrated into our internal audit planning and execution cycle.
We are exposed to market risk from changes in foreign currency exchange rates, domestic and foreign interest rates, and commodity prices, whichcan affect our operating results and overall financial condition. We manage exposure to these risks through our operating and financing activitiesand, when deemed appropriate, through the use of derivatives. Derivatives are viewed as risk management tools and are not used for speculation orfor trading purposes. Derivatives are generally contracted with a diversified group of investment grade counterparties to reduce exposure tononperformance on such instruments.
We use foreign currency forward contracts, currency options, and currency swaps to hedge the price risk associated with firmly committed andforecasted cross-border payments and receipts related to ongoing business and operational financing activities. We also use forward or optioncontracts to hedge our investment in the net assets of certain international subsidiaries to offset foreign currency translation adjustments related toour net investment in those subsidiaries. Foreign currency contracts are sensitive to changes in foreign currency exchange rates. At December 31,2018 , a 10% favorable or unfavorable exchange rate movement in each currency in our portfolio of foreign currency contracts would have resultedin an incremental unrealized gain of approximately $234 million or loss of approximately $241 million, respectively. Consistent with the use of thesecontracts to neutralize the effect of exchange rate fluctuations, such unrealized losses or gains would be offset by corresponding gains or losses,respectively, in the re-measurement of the underlying exposures.
We enter into commodity swap contracts to hedge the price risk associated with firmly committed and forecasted commodities purchases, the pricesof which are not fixed directly through supply contracts. As of December 31, 2018 , a 10% favorable or unfavorable shift in commodity prices wouldhave resulted in an incremental gain or loss of approximately $21 million, respectively, related to these contracts.
43
ITEM 8. FINANCIAL STATEMENTS AND SUPPLEMENTARY DATA
TABLE OF CONTENTS
PAGEFINANCIAL STATEMENTS AND SUPPLEMENTARY DATA Consolidated Statements of Income (Loss) 45Consolidated Statements of Comprehensive Income (Loss) 46Consolidated Balance Sheets 47Consolidated Statements of Cash Flows 48Consolidated Statements of Changes in Stockholders' Equity 49
PAGENOTES TO THE CONSOLIDATED FINANCIAL STATEMENTS
1. Summary of Principle Accounting Policies 502. Revenue Recognition 573. Cash, Cash Equivalents and Restricted Cash 604. Inventories 615. Goodwill and Other Intangibles 616. Financing Arrangements 637. Commitments and Contingencies 668. Pension and Other Postretirement Benefit Plans 709. Hedges and Derivative Financial Instruments 7710. Fair Value Measurements 8011. Stockholders' Equity 8112. Share-Based Incentive Plans 8313. Restructuring Charges 8514. Income Taxes 8715. Segment Information 8916. Assets and Liabilities Held for Sale 9117 Quarterly Results of Operations (Unaudited) 92
44
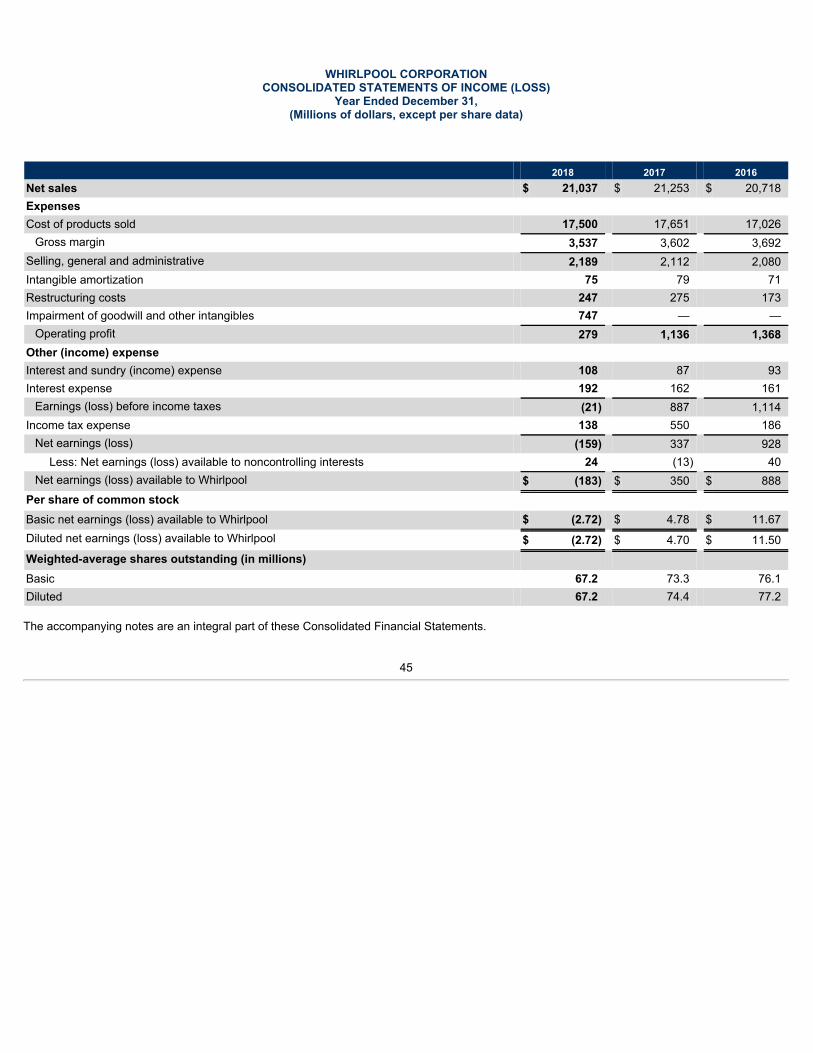
WHIRLPOOL CORPORATIONCONSOLIDATED STATEMENTS OF INCOME (LOSS)
Year Ended December 31,(Millions of dollars, except per share data)
2018 2017 2016Net sales $ 21,037 $ 21,253 $ 20,718Expenses Cost of products sold 17,500 17,651 17,026
Gross margin 3,537 3,602 3,692Selling, general and administrative 2,189 2,112 2,080Intangible amortization 75 79 71Restructuring costs 247 275 173Impairment of goodwill and other intangibles 747 — —
Operating profit 279 1,136 1,368Other (income) expense Interest and sundry (income) expense 108 87 93Interest expense 192 162 161
Earnings (loss) before income taxes (21) 887 1,114Income tax expense 138 550 186
Net earnings (loss) (159) 337 928Less: Net earnings (loss) available to noncontrolling interests 24 (13) 40
Net earnings (loss) available to Whirlpool $ (183) $ 350 $ 888Per share of common stock Basic net earnings (loss) available to Whirlpool $ (2.72) $ 4.78 $ 11.67Diluted net earnings (loss) available to Whirlpool $ (2.72) $ 4.70 $ 11.50Weighted-average shares outstanding (in millions) Basic 67.2 73.3 76.1Diluted 67.2 74.4 77.2
The accompanying notes are an integral part of these Consolidated Financial Statements.
45
WHIRLPOOL CORPORATIONCONSOLIDATED STATEMENTS OF COMPREHENSIVE INCOME (LOSS)
Year Ended December 31,(Millions of dollars)
2018 2017 2016Net earnings (loss) $ (159) $ 337 $ 928
Other comprehensive income (loss), before tax: Foreign currency translation adjustments (272) 32 (30) Derivative instruments: Net gain (loss) arising during period 77 (84) 106 Less: reclassification adjustment for gain (loss) included in net earnings (loss) 107 (80) 35 Derivative instruments, net (30) (4) 71 Marketable securities: Net gain (loss) arising during period — 6 (2) Marketable securities, net — 6 (2) Defined benefit pension and postretirement plans: Prior service (cost) credit arising during period (5) (16) 30 Net gain (loss) arising during period (102) (51) (139) Less: amortization of prior service credit (cost) and actuarial (loss) (59) (52) (39) Defined benefit pension and postretirement plans, net (48) (15) (70)Other comprehensive income (loss), before tax (350) 19 (31) Income tax benefit (expense) related to items of other comprehensive income (loss) 5 50 (37)Other comprehensive income (loss), net of tax $ (345) $ 69 $ (68)
Comprehensive income (loss) $ (504) $ 406 $ 860 Less: comprehensive income (loss), available to noncontrolling interests 26 (13) 40Comprehensive income (loss) available to Whirlpool $ (530) $ 419 $ 820
The accompanying notes are an integral part of these Consolidated Financial Statements.
46
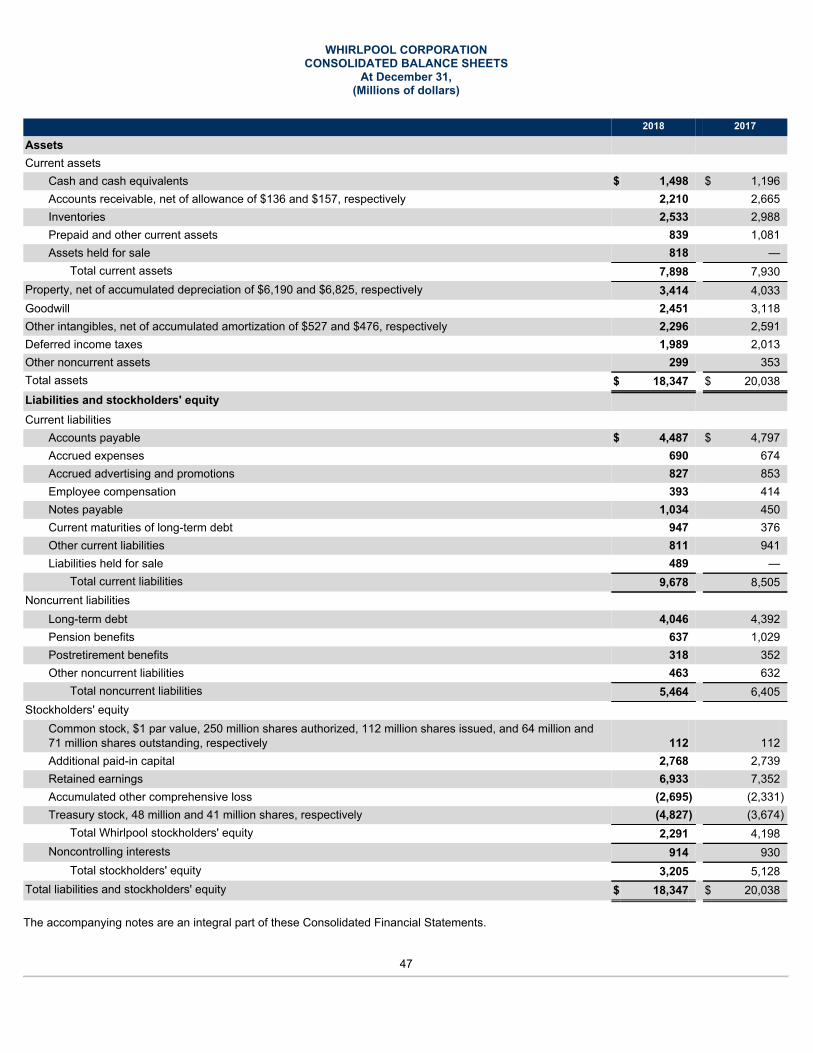
WHIRLPOOL CORPORATIONCONSOLIDATED BALANCE SHEETS
At December 31,(Millions of dollars)
2018 2017
Assets Current assets
Cash and cash equivalents $ 1,498 $ 1,196Accounts receivable, net of allowance of $136 and $157, respectively 2,210 2,665Inventories 2,533 2,988Prepaid and other current assets 839 1,081Assets held for sale 818 —
Total current assets 7,898 7,930Property, net of accumulated depreciation of $6,190 and $6,825, respectively 3,414 4,033Goodwill 2,451 3,118Other intangibles, net of accumulated amortization of $527 and $476, respectively 2,296 2,591Deferred income taxes 1,989 2,013Other noncurrent assets 299 353Total assets $ 18,347 $ 20,038Liabilities and stockholders' equity Current liabilities
Accounts payable $ 4,487 $ 4,797Accrued expenses 690 674Accrued advertising and promotions 827 853Employee compensation 393 414Notes payable 1,034 450Current maturities of long-term debt 947 376Other current liabilities 811 941Liabilities held for sale 489 —
Total current liabilities 9,678 8,505Noncurrent liabilities
Long-term debt 4,046 4,392Pension benefits 637 1,029Postretirement benefits 318 352Other noncurrent liabilities 463 632
Total noncurrent liabilities 5,464 6,405Stockholders' equity
Common stock, $1 par value, 250 million shares authorized, 112 million shares issued, and 64 million and71 million shares outstanding, respectively 112 112Additional paid-in capital 2,768 2,739Retained earnings 6,933 7,352Accumulated other comprehensive loss (2,695) (2,331)Treasury stock, 48 million and 41 million shares, respectively (4,827) (3,674)
Total Whirlpool stockholders' equity 2,291 4,198Noncontrolling interests 914 930
Total stockholders' equity 3,205 5,128Total liabilities and stockholders' equity $ 18,347 $ 20,038
The accompanying notes are an integral part of these Consolidated Financial Statements.
47
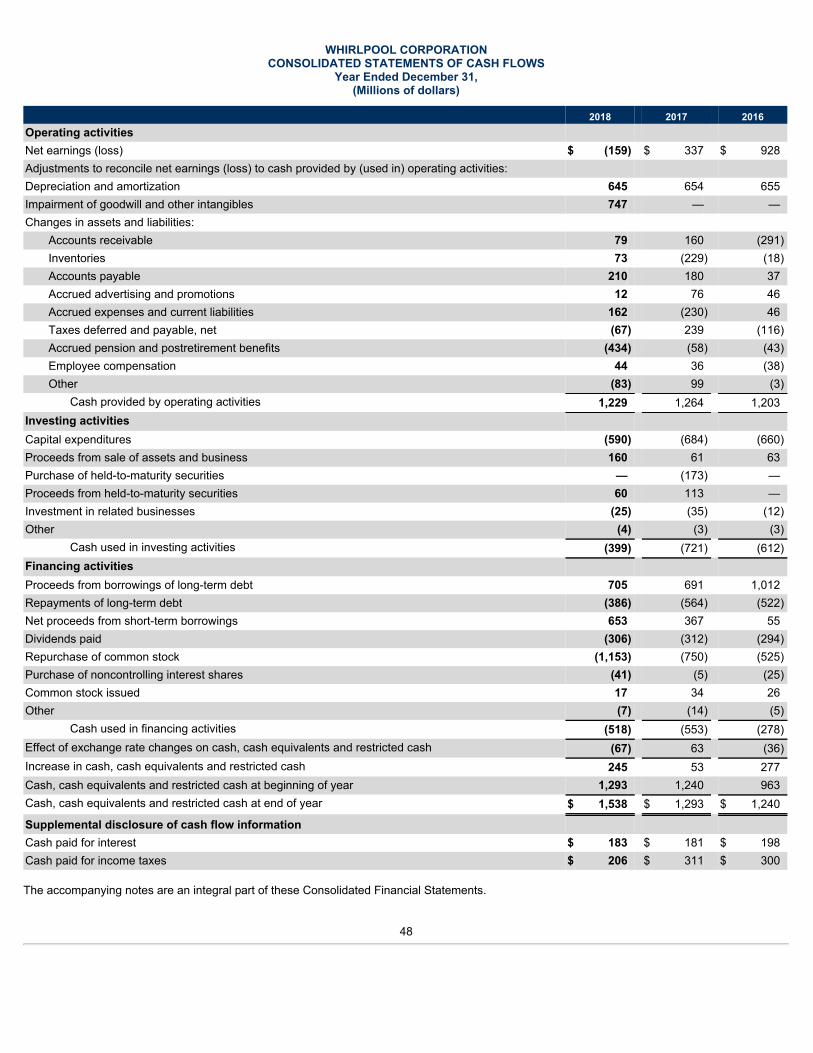
WHIRLPOOL CORPORATIONCONSOLIDATED STATEMENTS OF CASH FLOWS
Year Ended December 31,(Millions of dollars)
2018 2017 2016Operating activities Net earnings (loss) $ (159) $ 337 $ 928Adjustments to reconcile net earnings (loss) to cash provided by (used in) operating activities: Depreciation and amortization 645 654 655Impairment of goodwill and other intangibles 747 — —Changes in assets and liabilities:
Accounts receivable 79 160 (291)Inventories 73 (229) (18)Accounts payable 210 180 37Accrued advertising and promotions 12 76 46Accrued expenses and current liabilities 162 (230) 46Taxes deferred and payable, net (67) 239 (116)Accrued pension and postretirement benefits (434) (58) (43)Employee compensation 44 36 (38)Other (83) 99 (3)
Cash provided by operating activities 1,229 1,264 1,203Investing activities Capital expenditures (590) (684) (660)Proceeds from sale of assets and business 160 61 63Purchase of held-to-maturity securities — (173) —Proceeds from held-to-maturity securities 60 113 —Investment in related businesses (25) (35) (12)Other (4) (3) (3)
Cash used in investing activities (399) (721) (612)Financing activities Proceeds from borrowings of long-term debt 705 691 1,012Repayments of long-term debt (386) (564) (522)Net proceeds from short-term borrowings 653 367 55Dividends paid (306) (312) (294)Repurchase of common stock (1,153) (750) (525)Purchase of noncontrolling interest shares (41) (5) (25)Common stock issued 17 34 26Other (7) (14) (5)
Cash used in financing activities (518) (553) (278)Effect of exchange rate changes on cash, cash equivalents and restricted cash (67) 63 (36)Increase in cash, cash equivalents and restricted cash 245 53 277Cash, cash equivalents and restricted cash at beginning of year 1,293 1,240 963Cash, cash equivalents and restricted cash at end of year $ 1,538 $ 1,293 $ 1,240
Supplemental disclosure of cash flow information Cash paid for interest $ 183 $ 181 $ 198Cash paid for income taxes $ 206 $ 311 $ 300
The accompanying notes are an integral part of these Consolidated Financial Statements.
48
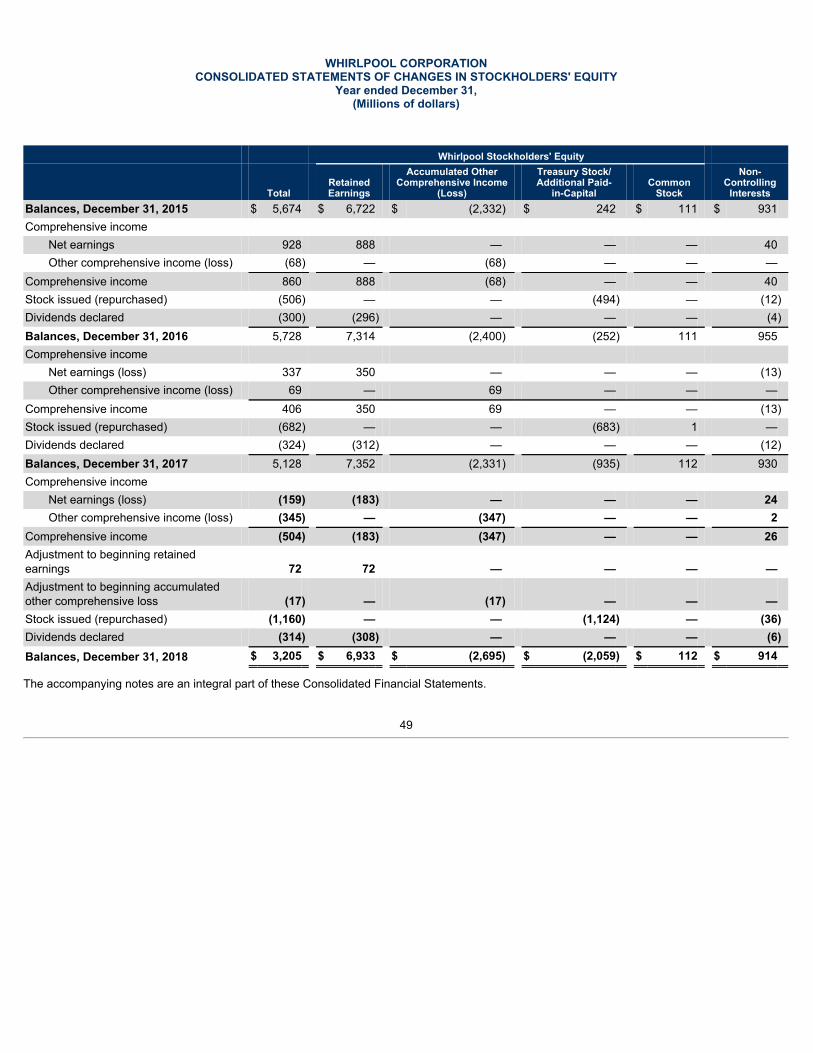
WHIRLPOOL CORPORATIONCONSOLIDATED STATEMENTS OF CHANGES IN STOCKHOLDERS' EQUITY
Year ended December 31,(Millions of dollars)
Whirlpool Stockholders' Equity
Total RetainedEarnings
Accumulated OtherComprehensive Income
(Loss)
Treasury Stock/Additional Paid-
in-Capital Common
Stock
Non-Controlling
InterestsBalances, December 31, 2015 $ 5,674 $ 6,722 $ (2,332) $ 242 $ 111 $ 931Comprehensive income
Net earnings 928 888 — — — 40Other comprehensive income (loss) (68) — (68) — — —
Comprehensive income 860 888 (68) — — 40Stock issued (repurchased) (506) — — (494) — (12)Dividends declared (300) (296) — — — (4)Balances, December 31, 2016 5,728 7,314 (2,400) (252) 111 955Comprehensive income
Net earnings (loss) 337 350 — — — (13)Other comprehensive income (loss) 69 — 69 — — —
Comprehensive income 406 350 69 — — (13)Stock issued (repurchased) (682) — — (683) 1 —Dividends declared (324) (312) — — — (12)Balances, December 31, 2017 5,128 7,352 (2,331) (935) 112 930Comprehensive income
Net earnings (loss) (159) (183) — — — 24Other comprehensive income (loss) (345) — (347) — — 2
Comprehensive income (504) (183) (347) — — 26Adjustment to beginning retainedearnings 72 72 — — — —Adjustment to beginning accumulatedother comprehensive loss (17) — (17) — — —Stock issued (repurchased) (1,160) — — (1,124) — (36)Dividends declared (314) (308) — — — (6)Balances, December 31, 2018 $ 3,205 $ 6,933 $ (2,695) $ (2,059) $ 112 $ 914
The accompanying notes are an integral part of these Consolidated Financial Statements.
49
NOTES TO THE CONSOLIDATED FINANCIAL STATEMENTS
( 1 ) SUMMARY OF PRINCIPLE ACCOUNTING POLICIESGeneral Information
Whirlpool Corporation, a Delaware corporation, manufactures products in 14 countries and markets products in nearly every country around theworld under brand names such as Whirlpool, KitchenAid, Maytag, Consul, Brastemp, Amana, Bauknecht, JennAir,Indesitand Hotpoint*. Weconduct our business through four operating segments, which we define based on geography. Whirlpool's operating segments consist of NorthAmerica, Europe, Middle East and Africa ("EMEA"), Latin America and Asia.
Principles of ConsolidationThe consolidated financial statements are prepared in conformity with GAAP, and include all majority-owned subsidiaries. All materialintercompany transactions have been eliminated upon consolidation. We do not consolidate the financial statements of any company in which wehave an ownership interest of 50% or less, unless that company is deemed to be a variable interest entity ("VIE") of which we are the primarybeneficiary. Our primary business purpose and involvement with VIE's is for product development and distribution.
Reclassifications
We reclassified certain prior period amounts in the Consolidated Financial Statements to conform with current year presentation.
Use of Estimates
We are required to make estimates and assumptions that affect the amounts reported in the Consolidated FinancialStatements. The most significant assumptions are estimates in determining the fair value of goodwill and indefinite-lived intangible assets, legalcontingencies, income taxes and pension and postretirement benefits. Actual results could differ materially from those estimates.
Revenue Recognition
Revenue is recognized when performance obligations under the terms of a contract with our customers are satisfied, the sales price is determinable,and the risk and rewards of ownership are transferred. Generally the risk and rewards of ownership are transferred with the transfer of control of ourproducts and services. For the majority of our sales, control is transferred to the customer as soon as products are shipped. For a portion of oursales, control is transferred to the customer upon receipt of products at the customer's location. Sales are net of allowances for product returns,which are based on historical return rates and certain promotions. For additional information on revenue recognition, see Note 2 to the ConsolidatedFinancial Statements.
Sales Incentives
The cost of sales incentives is accrued at the date at which revenue is recognized by Whirlpool as a reduction of revenue. If new incentives areadded after the product has been shipped, then they are accrued at that time, also as a reduction of revenue. These accrued promotions arerecognized based on the expected value amount of incentives that will be ultimately claimed by trade customers or consumers. The expected valueis the sum of probability-weighted amounts in a range of possible consideration amounts. If the amount of incentives cannot be reasonablyestimated, an accrued promotion liability is recognized for the maximum potential amount.
Accounts Receivable and Allowance for Doubtful Accounts
We carry accounts receivable at sales value less an allowance for doubtful accounts. We periodically evaluate accounts receivable and establish anallowance for doubtful accounts based on a combination of specific customer circumstances, credit conditions and the history of write-offs andcollections. We evaluate items on an individual basis when determining accounts receivable write-offs. In general, our policy is to not charge intereston trade receivables after the invoice becomes past due. A receivable is considered past due if payment has not been received within agreed uponinvoice terms.
*Whirlpool ownership of the Hotpoint brand in the EMEA and Asia Pacific regions is not affiliated with the Hotpoint brand sold in the Americas.
50
NOTES TO THE CONSOLIDATED FINANCIAL STATEMENTS - (CONTINUED)
Transfers and Servicing of Financial Assets
In an effort to manage economic and geographic trade customer risk, from time to time, the Company will transfer, primarily without recourse,accounts receivable balances of certain customers to financial institutions resulting in a nominal impact recorded in interest and sundry (income)expense. These transactions are accounted for as sales of the receivables resulting in the receivables being de-recognized from the ConsolidatedBalance Sheets. These transfers primarily do not require continuing involvement from the Company, however certain arrangements includeservicing of transferred receivables by Whirlpool. Outstanding accounts receivable transferred under arrangements where the Company continuesto service the transferred asset were $161 million and $137 million as of December 31, 2018 and December 31, 2017, respectively.
Freight and Warehousing Costs
We classify freight and warehousing costs within cost of products sold in our Consolidated Statements of Income (Loss).
Cash and Cash Equivalents
All highly liquid debt instruments purchased with an initial maturity of three months or less are considered cash equivalents.
Restricted Cash
Restricted cash can only be used to fund capital expenditures and technical resources to enhance Whirlpool China's research and development andworking capital, as required by the terms of the Hefei Sanyo acquisition completed in October 2014. As of December 31, 2018 and 2017 , restrictedcash was approximately $40 million and $97 million , respectively. Approximately $40 million and $48 million is recorded in other current assets as ofDecember 31, 2018 and 2017 , respectively, with the remaining portion recorded in other non-current assets. For additional information, see Note 3to the Consolidated Financial Statements.
Fair Value Measurements
We measure fair value based on an exit price, representing the amount that would be received to sell an asset or paid to transfer a liability in anorderly transaction between market participants. As such, fair value is a market-based measurement that should be determined based onassumptions that market participants would use in pricing an asset or liability. As a basis for considering such assumptions, a three-tiered fair valuehierarchy is established, which prioritizes the inputs used in measuring fair value as follows: (Level 1) observable inputs such as quoted prices inactive markets; (Level 2) inputs, other than the quoted prices in active markets that are observable, either directly or indirectly; and (Level 3)unobservable inputs in which there is little or no market data, which require the reporting entity to develop its own assumptions. Certain investmentsare valued based on net asset value (NAV), which approximates fair value. Such basis is determined by referencing the respective fund's underlyingassets. There are no unfunded commitments or other restrictions associated with these investments. We had no Level 3 assets or liabilities atDecember 31, 2018 and 2017 , with the exception of goodwill and other intangibles disclosed in Note 5 and Note 10 and pension plan assetsdisclosed in Note 8 to the Consolidated Financial Statements.
We measured fair value for money market funds, available for sale investments and held-to-maturity securities using quoted market prices in activemarkets for identical or comparable assets. We measured fair value for derivative contracts, all of which have counterparties with high credit ratings,based on model driven valuations using significant inputs derived from observable market data. For assets measured at net asset values, we haveno unfunded commitments or significant restraints. We measured fair value (non-recurring) for goodwill and other intangibles using a discountedcash flow model and a relief-from-royalty method, respectively, with inputs based on both observable and unobservable market data.
Inventories
United States production inventories are stated at last-in, first-out ("LIFO") cost. Latin America, Asia and certain EMEA inventories are stated ataverage cost. The remaining inventories are stated at first-in, first-out ("FIFO") cost. Costs include materials, labor and production overhead atnormal production capacity. Costs do not exceed net realizable values. Changes in the amount that FIFO cost exceed LIFO cost are recognized incost of goods sold. See Note 4 to the Consolidated Financial Statements for additional information about inventories.
51
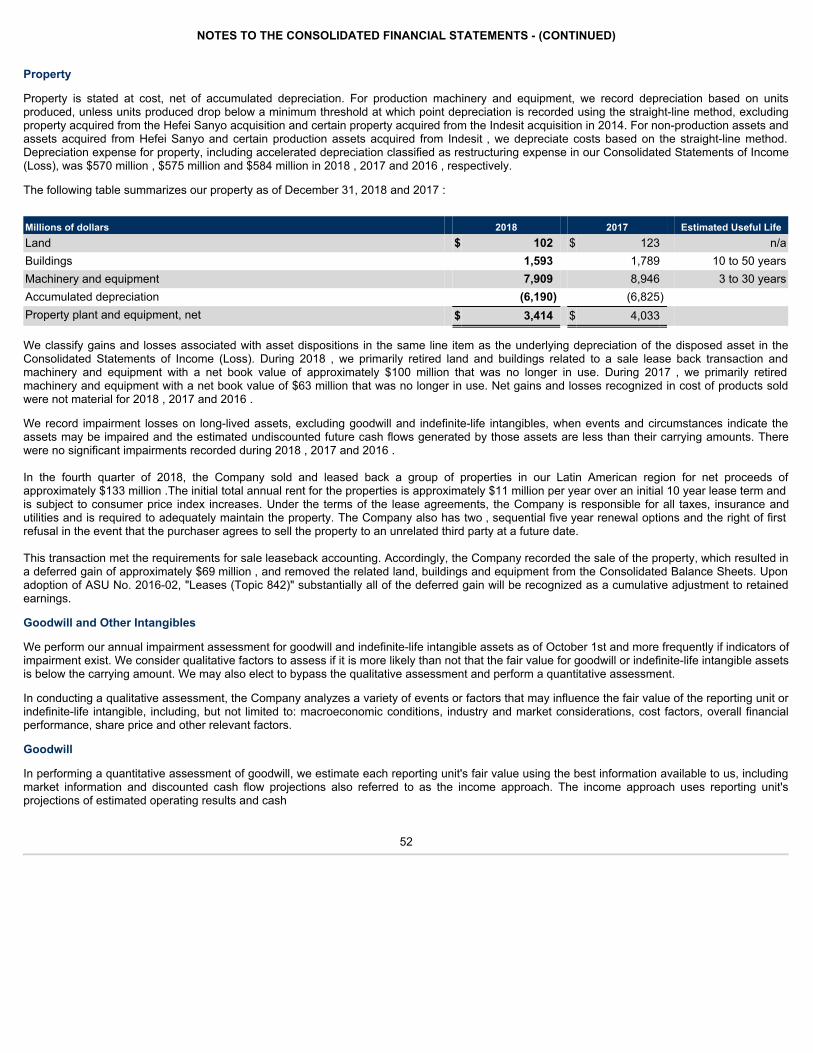
NOTES TO THE CONSOLIDATED FINANCIAL STATEMENTS - (CONTINUED)
Property
Property is stated at cost, net of accumulated depreciation. For production machinery and equipment, we record depreciation based on unitsproduced, unless units produced drop below a minimum threshold at which point depreciation is recorded using the straight-line method, excludingproperty acquired from the Hefei Sanyo acquisition and certain property acquired from the Indesit acquisition in 2014. For non-production assets andassets acquired from Hefei Sanyo and certain production assets acquired from Indesit , we depreciate costs based on the straight-line method.Depreciation expense for property, including accelerated depreciation classified as restructuring expense in our Consolidated Statements of Income(Loss), was $570 million , $575 million and $584 million in 2018 , 2017 and 2016 , respectively.
The following table summarizes our property as of December 31, 2018 and 2017 :
Millions of dollars 2018 2017 Estimated Useful LifeLand $ 102 $ 123 n/aBuildings 1,593 1,789 10 to 50 yearsMachinery and equipment 7,909 8,946 3 to 30 yearsAccumulated depreciation (6,190) (6,825) Property plant and equipment, net $ 3,414 $ 4,033
We classify gains and losses associated with asset dispositions in the same line item as the underlying depreciation of the disposed asset in theConsolidated Statements of Income (Loss). During 2018 , we primarily retired land and buildings related to a sale lease back transaction andmachinery and equipment with a net book value of approximately $100 million that was no longer in use. During 2017 , we primarily retiredmachinery and equipment with a net book value of $63 million that was no longer in use. Net gains and losses recognized in cost of products soldwere not material for 2018 , 2017 and 2016 .
We record impairment losses on long-lived assets, excluding goodwill and indefinite-life intangibles, when events and circumstances indicate theassets may be impaired and the estimated undiscounted future cash flows generated by those assets are less than their carrying amounts. Therewere no significant impairments recorded during 2018 , 2017 and 2016 .
In the fourth quarter of 2018, the Company sold and leased back a group of properties in our Latin American region for net proceeds ofapproximately $133 million .The initial total annual rent for the properties is approximately $11 million per year over an initial 10 year lease term andis subject to consumer price index increases. Under the terms of the lease agreements, the Company is responsible for all taxes, insurance andutilities and is required to adequately maintain the property. The Company also has two , sequential five year renewal options and the right of firstrefusal in the event that the purchaser agrees to sell the property to an unrelated third party at a future date.
This transaction met the requirements for sale leaseback accounting. Accordingly, the Company recorded the sale of the property, which resulted ina deferred gain of approximately $69 million , and removed the related land, buildings and equipment from the Consolidated Balance Sheets. Uponadoption of ASU No. 2016-02, "Leases (Topic 842)" substantially all of the deferred gain will be recognized as a cumulative adjustment to retainedearnings.
Goodwill and Other Intangibles
We perform our annual impairment assessment for goodwill and indefinite-life intangible assets as of October 1st and more frequently if indicators ofimpairment exist. We consider qualitative factors to assess if it is more likely than not that the fair value for goodwill or indefinite-life intangible assetsis below the carrying amount. We may also elect to bypass the qualitative assessment and perform a quantitative assessment.
In conducting a qualitative assessment, the Company analyzes a variety of events or factors that may influence the fair value of the reporting unit orindefinite-life intangible, including, but not limited to: macroeconomic conditions, industry and market considerations, cost factors, overall financialperformance, share price and other relevant factors.
Goodwill
In performing a quantitative assessment of goodwill, we estimate each reporting unit's fair value using the best information available to us, includingmarket information and discounted cash flow projections also referred to as the income approach. The income approach uses reporting unit'sprojections of estimated operating results and cash
52
NOTES TO THE CONSOLIDATED FINANCIAL STATEMENTS - (CONTINUED)
flows that are discounted using a market participant discount rate based on a weighted-average cost of capital. Additionally, we validate ourestimates of fair value under the income approach by comparing the values to fair value estimates using a market approach.
Intangible Assets
We perform a quantitative assessment of other indefinite-life intangible assets, which are primarily comprised of trademarks. We estimate the fairvalue of these intangible assets using the relief-from-royalty method, which primarily requires assumptions related to projected revenues from ourlong-range plan, assumed royalty rates that could be payable if we did not own the trademark, and a market participant discount rate based on aweighted-average cost of capital.
Other definite-life intangible assets are amortized over their useful life and are assessed for impairment when impairment indicators are present.
In 2018, we recorded an impairment charge on goodwill of $579 million and other intangibles of $168 million . There was no impairment of goodwilland other intangibles in 2017 and 2016. See Note 5 and Note 10 to the Consolidated Financial Statements for additional information about goodwilland other intangibles.
Accounts Payable Outsourcing
We offer our suppliers access to third party payable processors, independent from Whirlpool. The processors allow suppliers to sell their receivablesto financial institutions at the sole discretion of both the supplier and the financial institution. In China, as a common practice, we pay suppliers withbanker's acceptance drafts. Banker's acceptance drafts allow suppliers to sell their receivables to financial institutions at the sole discretion of boththe supplier and the financial institution. We have no economic interest in the sale of these receivables and no direct financial relationship with thefinancial institutions concerning these services. All of our obligations, including amounts due, remain to our suppliers as stated in our supplieragreements. As of December 31, 2018 and 2017 , approximately $1.4 billion and $1.5 billion , respectively, have been issued to participatingfinancial institutions.
Derivative Financial Instruments
We use derivative instruments designated as cash flow and fair value hedges to manage our exposure to the volatility in material costs, foreigncurrency and interest rates on certain debt instruments. Changes in the fair value of derivative assets or liabilities (i.e., gains or losses) arerecognized depending upon the type of hedging relationship and whether a hedge has been designated. For those derivative instruments thatqualify for hedge accounting, we designate the hedging instrument, based upon the exposure being hedged, as a cash flow hedge, fair value hedge,or a hedge of a net investment in a foreign operation. For a derivative instrument designated as a fair value hedge, the gain or loss on the derivativeis recognized in earnings immediately with the offsetting gain or loss on the hedged item. For a derivative instrument designated as a cash flowhedge, the effective portion of the derivative's gain or loss is initially reported as a component of Other Comprehensive Income (Loss) and issubsequently recognized in earnings when the hedged exposure affects earnings. For a derivative instrument designated as a hedge of a netinvestment in a foreign operation, the effective portion of the derivative's gain or loss is reported in Other Comprehensive Income (Loss) as part ofthe cumulative translation adjustment. Changes in fair value of derivative instruments that do not qualify for hedge accounting are recognizedimmediately in current net earnings. See Note 9 to the Consolidated Financial Statements for additional information about hedges and derivativefinancial instruments.
Foreign Currency Translation and Transactions
Foreign currency denominated assets and liabilities are translated into United States dollars at exchange rates existing at the respective balancesheet dates. Translation adjustments resulting from fluctuations in exchange rates are recorded as a separate component of Accumulated OtherComprehensive Income (Loss). The results of operations of foreign subsidiaries are translated at the average exchange rates during the respectiveperiods. Gains and losses resulting from foreign currency transactions are included in net earnings.
Research and Development Costs
Research and development costs are charged to expense and totaled $ 572 million , $596 million and $604 million in 2018 , 2017 and 2016 ,respectively.
53
NOTES TO THE CONSOLIDATED FINANCIAL STATEMENTS - (CONTINUED)
Advertising Costs
Advertising costs are charged to expense when the advertisement is first communicated and totaled $343 million , $330 million and $366 million in2018 , 2017 and 2016 , respectively.
Income Taxes
We account for income taxes using the asset and liability method. Under this method, deferred tax assets and liabilities are recognized for the futuretax consequences of temporary differences between the financial statement and tax basis of assets and liabilities using enacted rates. The effect ofa change in tax rates on deferred tax assets is recognized in income in the period of the enactment date.
We recognize, primarily in other noncurrent liabilities, in the Consolidated Balance Sheets, the effects of uncertain income tax positions. Interest andpenalties related to uncertain tax positions are reflected in income tax expense. We record liabilities net of the amount, based on technical merits,that will be sustained upon examination. We accrue for other non income tax contingencies when it is probable that a liability to a taxing authorityhas been incurred and the amount of the contingency can be reasonably estimated.
Provision is made for taxes on undistributed earnings of foreign subsidiaries and related companies to the extent that such earnings are not deemedto be permanently invested.
The Tax Cuts and Jobs Act created a new requirement that certain income earned by foreign subsidiaries, known as global intangible low-taxincome (GILTI), must be included in the gross income of their U.S. shareholder. The Company can apply an accounting policy election of eitherrecognizing deferred taxes for temporary differences expected to reverse as GILTI in future years or recognizing such taxes as a current-periodexpense when incurred. As of December 31, 2018, we have not made a provision for GILTI, however, if in the future we are subject to GILTI, wehave elected to treat the tax effect of GILTI as a current-period expense when incurred.
See Note 14 to the Consolidated Financial Statements for additional information about income taxes.
Stock Based Compensation
Stock based compensation expense is based on the grant date fair value and is expensed over the period during which an employee is required toprovide service in exchange for the award (generally the vesting period). The Company's stock based compensation includes stock options,performance stock units, performance shares, restricted stock and restricted stock units. The fair value of stock options are determined using theBlack-Scholes option-pricing model, which incorporates assumptions regarding the risk-free interest rate, expected volatility, expected option life,expected forfeitures and dividend yield. Expected forfeitures are based on historical experience. Stock options are granted with an exercise priceequal to the stock price on the date of grant. The fair value of restricted stock units and performance stock units is generally based on the closingmarket price of Whirlpool common stock on the grant date. Stock based compensation is recorded in selling, general and administrative expense onour Consolidated Statements of Income (Loss). See Note 12 to the Consolidated Financial Statements for additional information about stock basedcompensation.
BEFIEX Credits
In previous years, our Brazilian operations earned tax credits under the Brazilian government's export incentive program (BEFIEX). These creditsreduced Brazilian federal excise taxes on domestic sales, resulting in an increase in the operations' recorded net sales in 2017 and 2016. In 2018,these credit are reflected in interest and sundry income. We recognized export credits as they were monetized. See Note 2, Note 7 and Note 14 tothe Consolidated Financial Statements for additional information regarding BEFIEX credits.
Out-of-Period Adjustment
During 2017, we recorded prior period adjustments in our Asia reportable segment primarily related to trade promotion incentives. The 2017 netimpact of these out-of-period adjustments was a decrease to net sales of approximately $35 million and an increase to other operating expenses ofapproximately $8 million before tax. We determined that the impact was immaterial to prior periods. These adjustments resulted in a decrease to netearnings available to Whirlpool of approximately $16 million and a decrease of $0.22 in diluted earnings per share.
54
NOTES TO THE CONSOLIDATED FINANCIAL STATEMENTS - (CONTINUED)
Related Party Transaction
In 2018, Whirlpool of India Limited (Whirlpool India), a majority-owned subsidiary of Whirlpool Corporation, acquired a 49% equity interest in ElicaPB India for $22 million . Whirlpool Corporation owns 12.54% of Elica S.p.A, the parent of Elica PB India. As part of the agreement, Whirlpool Indiareceived an option to acquire the remaining equity interest in the future for fair value, and the non-Whirlpool India shareholders of Elica PB Indiareceived an option to sell their remaining equity interest to Whirlpool India in the future for fair value, which could be material to the financialstatements depending on the performance of the venture. We account for our minority interest under the equity method of accounting.
Adoption of New Accounting Standards
On January 1, 2018, we adopted Accounting Standards Update ("ASU") No. 2014-09, "Revenue from Contracts with Customers (Topic 606)" usingthe modified retrospective method. Under the modified retrospective method, we recognized the cumulative effect of initially applying the newrevenue standard as an increase to the opening balance of retained earnings. This adjustment did not have a material impact on our financialstatements. For additional information on the required disclosures related to the impact of adopting this standard, see Note 2 to the ConsolidatedFinancial Statements.
In October 2016, the Financial Accounting Standards Board ("FASB") issued ASU 2016-16, "Income Taxes (Topic 740): Intra-Entity Transfers ofAssets Other Than Inventory," which requires an entity to recognize the income tax consequences of an intra-entity transfer of an asset other thaninventory when the transfer occurs. The amendments were effective for fiscal years, and interim periods within those fiscal years, beginning afterDecember 15, 2017, and should be applied on a modified retrospective basis through a cumulative-effect adjustment directly to retained earnings atthe beginning of the period of adoption. The Company adopted the accounting standard on January 1, 2018 and recognized a $56 million increaseto the opening balance of retained earnings.
In January 2017, the FASB issued ASU 2017-04, "Intangibles - Goodwill and Other (Topic 350): Simplifying the Test for Goodwill Impairment". Theguidance in ASU 2017-04 eliminates the requirement to determine the fair value of individual assets and liabilities of a reporting unit to measuregoodwill impairment. Under the amendments in the new standard, goodwill impairment testing will be performed by comparing the fair value of thereporting unit with its carrying amount and recognizing an impairment charge for the amount by which the carrying amount exceeds the reportingunit's fair value. The new standard is effective for annual and interim goodwill impairment tests in fiscal years beginning after December 15, 2019,and should be applied on a prospective basis. Early adoption is permitted for annual or interim goodwill impairment testing performed after January1, 2017. The Company elected to early adopt the accounting standard in the second quarter of 2018. For additional information related to the impactof goodwill impairment, see Note 5 to the Consolidated Financial Statements.
We adopted the following standards, none of which have a material impact on our Consolidated Financial Statements:
Standard Effective Date2016-01 Financial Instruments - Overall (Subtopic 825-10): Recognition and Measurement of Financial Assets and
Financial LiabilitiesJanuary 1, 2018
2016-04 Liabilities-Extinguishments of Liabilities (Subtopic 405-20): Recognition of Breakage for Certain Prepaid Stored-Value Products
January 1, 2018
2016-15 Statement of Cash Flows (Topic 230): Classification of Certain Cash Receipts and Cash Payments January 1, 20182016-18 Statement of Cash Flows (Topic 230): Restricted Cash January 1, 20182017-01 Business Combinations (Topic 805): Clarifying the Definition of a Business January 1, 20182017-09 Compensation-Stock Compensation (Topic 718): Scope of Modification Accounting January 1, 2018
All other new issued and effective accounting standards during 2018 were not relevant or material to the Company.
Accounting Pronouncements Issued But Not Yet Effective
In November 2018, the FASB issued ASU 2018-18, "Collaborative Arrangements (Topic 808): Clarifying the Interaction between Topic 808 andTopic 606." The new standard is effective for fiscal years beginning after December 15, 2019, and interim periods within those fiscal years. Earlyadoption is permitted in any interim period for entities that have adopted ASC 606. The standard should be applied retrospectively to the periodwhen initially adopted ASC 606. The Company is currently evaluating the impact of adopting this guidance.
55
NOTES TO THE CONSOLIDATED FINANCIAL STATEMENTS - (CONTINUED)
In October 2018, the FASB issued ASU 2018-17, "Consolidation (Topic 810): Targeted Improvements to Related Party Guidance for VariableInterest Entities". The new standard changes how entities evaluate decision-making fees under the variable interest entity guidance. The newstandard is effective for fiscal years beginning after December 15, 2019, and interim periods within those fiscal years. Early adoption is permitted inany interim period after issuance. The standard should be applied on a modified retrospective basis through a cumulative-effect adjustment directlyto retained earnings at the beginning of the period of adoption. The Company is currently evaluating the impact of adopting this guidance.
In February 2018, the FASB issued ASU 2018-02, "Income Statement - Reporting Comprehensive Income (Topic 220): Reclassification of CertainTax Effects from Accumulated Other Comprehensive Income". The new standard gives entities the option to reclassify to retained earnings taxeffects related to items in accumulated other comprehensive income as a result of the tax reform. The new standard is effective for fiscal yearsbeginning after December 15, 2018, and interim periods within those fiscal years. Early adoption is permitted in any interim period after issuance.The Company is currently evaluating the impact of adopting this guidance.
In August 2017, the FASB issued ASU 2017-12, "Derivatives and Hedging (Topic 815): Targeted Improvements to Accounting for HedgingActivities". The new standard is effective for fiscal years beginning after December 15, 2018, and interim periods within those fiscal years. Earlyadoption is permitted in any interim period after issuance. All transition requirements and elections should be applied to hedging relationshipsexisting (that is, hedging relationships in which the hedging instrument has not expired, been sold, terminated, or exercised or the entity has notremoved the designation of the hedging relationship) on the date of adoption. The effect of adoption should be reflected as of the beginning of thefiscal year in which the entity adopts. The Company is currently evaluating the impact of adopting this guidance.
In February 2016, the FASB issued ASU No. 2016-02, "Leases (Topic 842)". The guidance in ASU 2016-02 supersedes the lease recognitionrequirements in ASC Topic 840, Leases (FAS 13). The new standard establishes a right-of-use (ROU) model that requires a lessee to record a ROUasset and a lease liability on the balance sheet for leases with terms longer than 12 months. Leases will be classified as either finance or operating,with classification affecting the pattern of expense recognition in the income statement. The new standard is effective for fiscal years beginning afterDecember 15, 2018, including interim periods within those fiscal years, with early adoption permitted. The Company has elected the package ofpractical expedients to not reassess prior conclusions related to contracts containing leases, lease classification and initial direct costs. In March2018, the FASB approved a new, optional transition method that will give companies the option to use the effective date as the date of initialapplication on transition. The Company is electing the transition method, and as a result, the Company will not adjust its comparative period financialinformation or make the new required lease disclosures for periods before the effective date. The Company has elected to make the accountingpolicy election for short-term leases. The lease payments will be recorded as an expense on a straight-line basis over the lease term. The Companyhas elected to not separate lease and non-lease components. The Company will not elect the hindsight practical expedient. The Company will notelect the land easement practical expedient.
In connection with the adoption of the new lease accounting standard, we established a cross-functional implementation team. As part of thatprocess, we have completed scoping reviews and updated business process, systems, accounting policies and internal controls.
The implementation strategy to obtain and summarize our leases includes utilizing surveys to centrally gather more information about theCompany's existing leases, lease processes, and contracts that may contain leases, including service agreements. The Company selected a newsystem to maintain all lease data. To ensure completeness of the population of lease contracts, the results of the survey were being cross-referenced against other available lease information such as prior year-end disclosures and recorded lease expense. As of December 31, 2018, theCompany has obtained the relevant lease contract data points.
The Company anticipates the adoption of this new standard will recognize approximately $800 million to $900 million of ROU assets and liabilities onour consolidated balance sheet. The impact on the Company's consolidated statements of income is being evaluated. As the impact of this standardis non–cash in nature, we do not anticipate its adoption having an impact on the consolidated statements of cash flows. There will also be no impacton existing debt covenants.
Upon adoption there will be a decrease of approximately $78 million to other liabilities as this amount represents deferred gains on sale leasebacktransactions which will be recognized as a cumulative adjustment to retained earnings on the date of adoption.
56
NOTES TO THE CONSOLIDATED FINANCIAL STATEMENTS - (CONTINUED)
The FASB has issued the following relevant standards, which are not expected to have a material impact on our Consolidated Financial Statements:
Standard Effective Date2016-13 Financial Instruments - Credit Losses (Topic 326): Measurement of Credit Losses on Financial Instruments January 1, 20202018-13 Fair Value Measurement (Topic 820): Disclosure Framework - Changes to the Disclosure Requirements for Fair
Value MeasurementJanuary 1, 2020
2018-14 Compensation - Retirement Benefits - Defined Benefit Plans - General (Subtopic 715-20): Disclosure Framework -Changes to the Disclosure Requirements for Defined Benefit Plans
January 1, 2021
2018-15 Intangibles - Goodwill and Other - Internal-Use Software (Subtopic 350-40): Customer's Accounting forImplementation Costs Incurred In a Cloud Computing Arrangement That Is a Service Contract
January 1, 2020
All other issued and not yet effective accounting standards are not relevant to the Company.
( 2 ) REVENUE RECOGNITION
Revenue from Contracts with Customers
On January 1, 2018, we adopted Topic 606 using the modified retrospective method, as a result, we recognized the cumulative effect of initiallyapplying the new revenue standard as an adjustment to the opening balance of retained earnings. This adjustment did not have a material impact onour Consolidated Financial Statements. Results for reporting periods beginning after January 1, 2018 are presented under Topic 606, while priorperiod amounts are not adjusted and continue to be reported in accordance with our historic accounting under Revenue Recognition ("Topic 605").The adoption of Topic 606 did not have a material impact on our Consolidated Statements of Comprehensive Income (Loss) and ConsolidatedBalance Sheets.
The adoption of Topic 606 represents a change in accounting principle that will provide financial statement readers with enhanced revenuerecognition disclosures. In accordance with Topic 606, revenue is recognized when performance obligations under the terms of a contract with ourcustomer are satisfied; generally this occurs with the transfer of control of our products or services. Revenue is measured as the amount ofconsideration we expect to receive in exchange for transferring products or providing services. Certain customers may receive cash and/or non-cashincentives, which are accounted for as variable consideration. To achieve this core principle, the Company applies the following five steps:
1. Identify the contract with a customer
A contract with a customer exists when (i) the Company enters into an agreement with a customer that defines each party's rights regarding theproducts or services to be transferred and identifies the payment terms related to these products or services, (ii) both parties to the contract arecommitted to perform their respective obligations, (iii) the contract has commercial substance, and (iv) the Company determines that collection ofsubstantially all consideration for products or services that are transferred is probable based on the customer's intent and ability to pay the promisedconsideration. The Company applies judgment in determining the customer's ability and intention to pay, which is based on a variety of factorsincluding the customer's payment history or, in the case of a new customer, published credit and financial information pertaining to the customer.
2. Identify the performance obligations in the contract
Performance obligations promised in a contract are identified based on the products or services that will be transferred to the customer that are bothcapable of being distinct, whereby the customer can benefit from the product or service either on its own or together with other resources that arereadily available from third parties or from the Company, and are distinct in the context of the contract, whereby the transfer of the products orservices is separately identifiable from other promises in the contract. To the extent a contract includes multiple promised products or services, theCompany must apply judgment to determine whether promised products or services are capable of being distinct and distinct in the context of thecontract. If these criteria are not met, the promised products or services are accounted for as a combined performance obligation. The Company haselected to account for shipping and handling activities as a fulfillment cost as permitted by the standard.
57
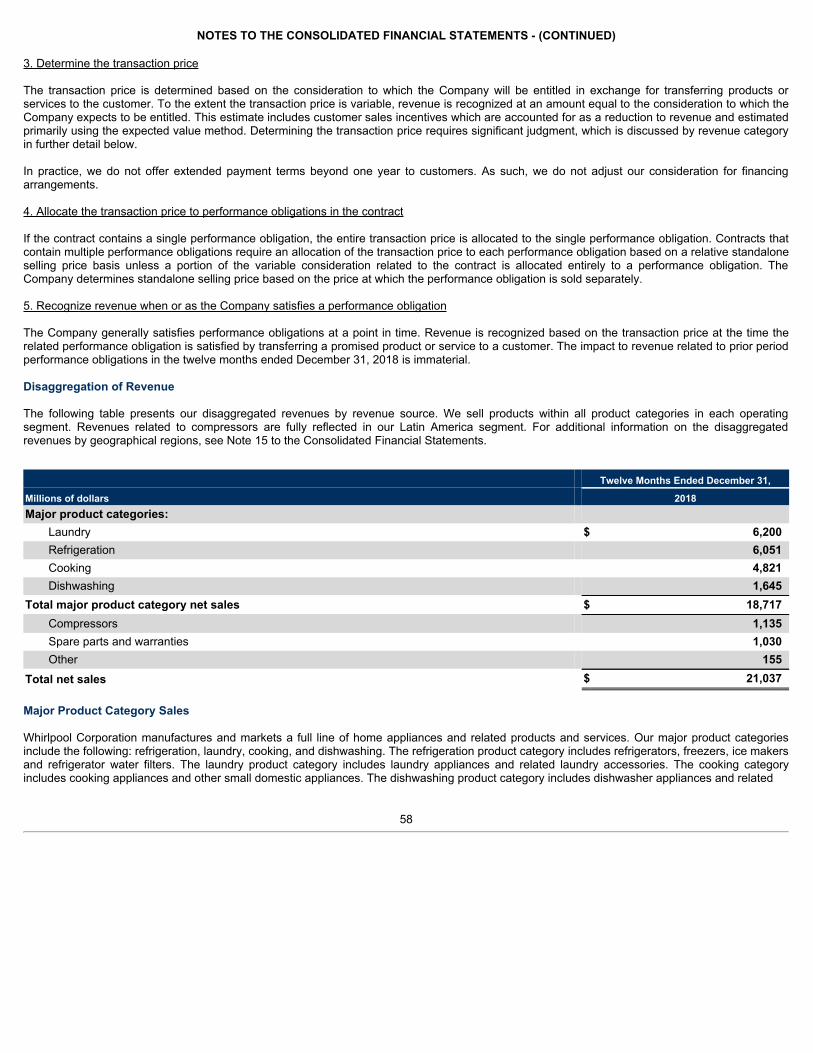
NOTES TO THE CONSOLIDATED FINANCIAL STATEMENTS - (CONTINUED)
3. Determine the transaction price
The transaction price is determined based on the consideration to which the Company will be entitled in exchange for transferring products orservices to the customer. To the extent the transaction price is variable, revenue is recognized at an amount equal to the consideration to which theCompany expects to be entitled. This estimate includes customer sales incentives which are accounted for as a reduction to revenue and estimatedprimarily using the expected value method. Determining the transaction price requires significant judgment, which is discussed by revenue categoryin further detail below.
In practice, we do not offer extended payment terms beyond one year to customers. As such, we do not adjust our consideration for financingarrangements.
4. Allocate the transaction price to performance obligations in the contract
If the contract contains a single performance obligation, the entire transaction price is allocated to the single performance obligation. Contracts thatcontain multiple performance obligations require an allocation of the transaction price to each performance obligation based on a relative standaloneselling price basis unless a portion of the variable consideration related to the contract is allocated entirely to a performance obligation. TheCompany determines standalone selling price based on the price at which the performance obligation is sold separately.
5. Recognize revenue when or as the Company satisfies a performance obligation
The Company generally satisfies performance obligations at a point in time. Revenue is recognized based on the transaction price at the time therelated performance obligation is satisfied by transferring a promised product or service to a customer. The impact to revenue related to prior periodperformance obligations in the twelve months ended December 31, 2018 is immaterial.
Disaggregation of Revenue
The following table presents our disaggregated revenues by revenue source. We sell products within all product categories in each operatingsegment. Revenues related to compressors are fully reflected in our Latin America segment. For additional information on the disaggregatedrevenues by geographical regions, see Note 15 to the Consolidated Financial Statements.
Twelve Months Ended December 31,
Millions of dollars 2018Major product categories:
Laundry $ 6,200Refrigeration 6,051Cooking 4,821Dishwashing 1,645
Total major product category net sales $ 18,717Compressors 1,135Spare parts and warranties 1,030Other 155
Total net sales $ 21,037
Major Product Category Sales
Whirlpool Corporation manufactures and markets a full line of home appliances and related products and services. Our major product categoriesinclude the following: refrigeration, laundry, cooking, and dishwashing. The refrigeration product category includes refrigerators, freezers, ice makersand refrigerator water filters. The laundry product category includes laundry appliances and related laundry accessories. The cooking categoryincludes cooking appliances and other small domestic appliances. The dishwashing product category includes dishwasher appliances and related
58
NOTES TO THE CONSOLIDATED FINANCIAL STATEMENTS - (CONTINUED)
accessories. In addition, we also produce hermetic compressors for refrigeration systems which is not considered a major product category.
For product sales and compressors, we transfer control and recognize a sale when we ship the product from our manufacturing facility to ourcustomer or when the customer receives the product based upon agreed shipping terms. Each unit sold is considered an independent, unbundledperformance obligation. We do not have any additional performance obligations other than product sales that are material in the context of thecontract. The amount of consideration we receive and revenue we recognize varies due to sales incentives and returns we offer to our customers.When we give our customers the right to return eligible products, we reduce revenue for our estimate of the expected returns which is primarilybased on an analysis of historical experience.
Spare Parts & Warranties
Spare parts are primarily sold to parts distributors and retailers, with a small number of sales to end consumers. For spare part sales, we transfercontrol and recognize a sale when we ship the product to our customer or when the customer receives product based upon agreed shipping terms.Each unit sold is considered an independent, unbundled performance obligation. We do not have any additional performance obligations other thanspare part sales that are material in the context of the contract. The amount of consideration we receive and revenue we recognize varies due tosales incentives and returns we offer to our customers. When we give our customers the right to return eligible products, we reduce revenue for ourestimate of the expected returns which is primarily based on an analysis of historical experience.
Warranties are classified as either assurance type or service type warranties. A warranty is considered an assurance type warranty if it provides theconsumer with assurance that the product will function as intended. A warranty that goes above and beyond ensuring basic functionality isconsidered a service type warranty. The Company offers certain limited warranties that are assurance type warranties and extended servicearrangements that are service type warranties. Assurance type warranties are not accounted for as separate performance obligations under therevenue model. If a service type warranty is sold with a product or separately, revenue is recognized over the life of the warranty. The Companyevaluates warranty offerings in comparison to industry standards and market expectations to determine appropriate warranty classification. Industrystandards and market expectations are determined by jurisdictional laws, competitor offerings and customer expectations. Market expectations andindustry standards can vary based on product type and geography. The Company primarily offers assurance type warranties.
Whirlpool sells certain extended service arrangements separately from the sale of products. Whirlpool acts as a sales agent under some of thesearrangements whereby the Company receives a fee that is recognized as revenue upon the sale of the extended service arrangement. TheCompany is also the principal for certain extended service arrangements. Revenue related to these arrangements is recognized ratably over thecontract term.
Other Revenue
Other revenue sources include subscription arrangements and licenses as described below.
The Company has a water subscription business in our Latin America segment which provides the customer with a water filtration system that isdelivered to the consumer's home. Our water subscription contracts represent a performance obligation that is satisfied over time and revenue isrecognized as the performance obligation is completed. The installation and maintenance of the water filtration system are not distinct services inthe context of the contract (i.e., the customer views all activities associated with the arrangement as one singular value proposition). The contractterm is generally less than one year for these arrangements and revenue is recognized based on the monthly invoiced amount which directlycorresponds to the value of our performance completed to date.
We license our brands in arrangements that do not include other performance obligations. Whirlpool licensing provides a right of access to theCompany's intellectual property throughout the license period. Whirlpool recognizes licensing revenue over the life of the license contract as theunderlying sale or usage occurs. As a result, we recognize revenue for these contracts at the amount which directly corresponds to the valueprovided to the customer.
59
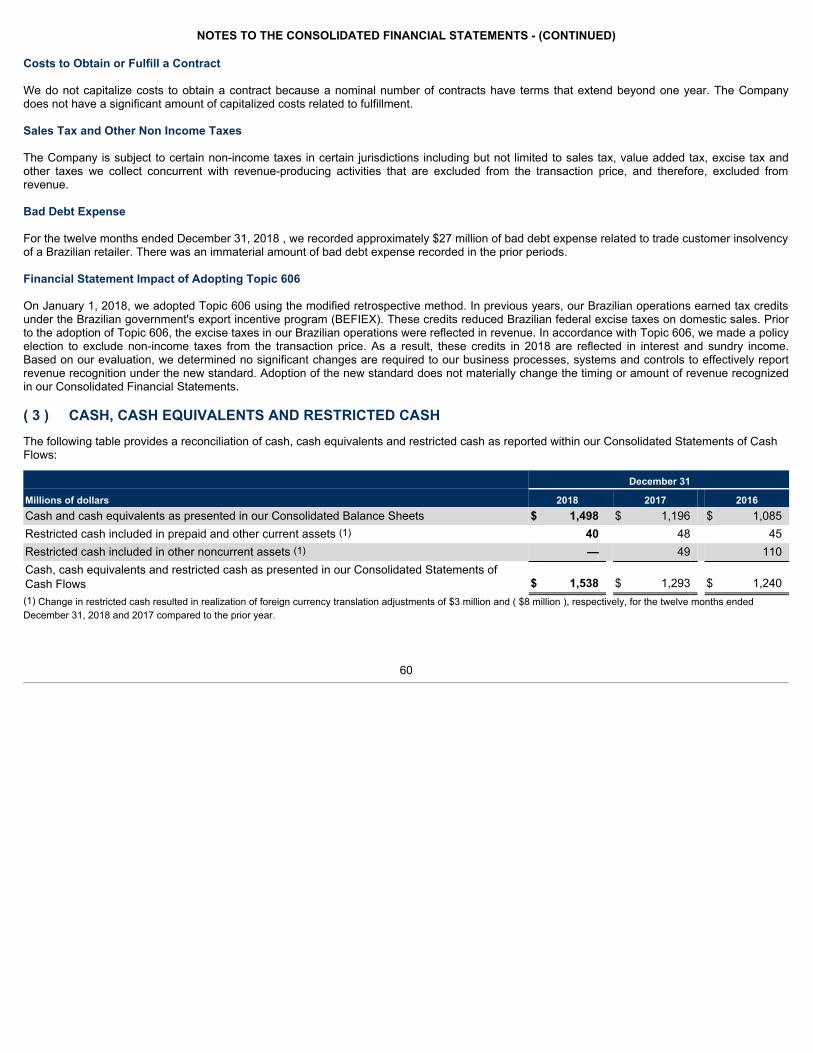
NOTES TO THE CONSOLIDATED FINANCIAL STATEMENTS - (CONTINUED)
Costs to Obtain or Fulfill a Contract
We do not capitalize costs to obtain a contract because a nominal number of contracts have terms that extend beyond one year. The Companydoes not have a significant amount of capitalized costs related to fulfillment.
Sales Tax and Other Non Income Taxes
The Company is subject to certain non-income taxes in certain jurisdictions including but not limited to sales tax, value added tax, excise tax andother taxes we collect concurrent with revenue-producing activities that are excluded from the transaction price, and therefore, excluded fromrevenue.
Bad Debt Expense
For the twelve months ended December 31, 2018 , we recorded approximately $27 million of bad debt expense related to trade customer insolvencyof a Brazilian retailer. There was an immaterial amount of bad debt expense recorded in the prior periods.
Financial Statement Impact of Adopting Topic 606
On January 1, 2018, we adopted Topic 606 using the modified retrospective method. In previous years, our Brazilian operations earned tax creditsunder the Brazilian government's export incentive program (BEFIEX). These credits reduced Brazilian federal excise taxes on domestic sales. Priorto the adoption of Topic 606, the excise taxes in our Brazilian operations were reflected in revenue. In accordance with Topic 606, we made a policyelection to exclude non-income taxes from the transaction price. As a result, these credits in 2018 are reflected in interest and sundry income.Based on our evaluation, we determined no significant changes are required to our business processes, systems and controls to effectively reportrevenue recognition under the new standard. Adoption of the new standard does not materially change the timing or amount of revenue recognizedin our Consolidated Financial Statements.
( 3 ) CASH, CASH EQUIVALENTS AND RESTRICTED CASHThe following table provides a reconciliation of cash, cash equivalents and restricted cash as reported within our Consolidated Statements of CashFlows:
December 31
Millions of dollars 2018 2017 2016Cash and cash equivalents as presented in our Consolidated Balance Sheets $ 1,498 $ 1,196 $ 1,085Restricted cash included in prepaid and other current assets (1) 40 48 45Restricted cash included in other noncurrent assets (1) — 49 110Cash, cash equivalents and restricted cash as presented in our Consolidated Statements ofCash Flows $ 1,538 $ 1,293 $ 1,240(1) Change in restricted cash resulted in realization of foreign currency translation adjustments of $3 million and ( $8 million ), respectively, for the twelve months endedDecember 31, 2018 and 2017 compared to the prior year.
60
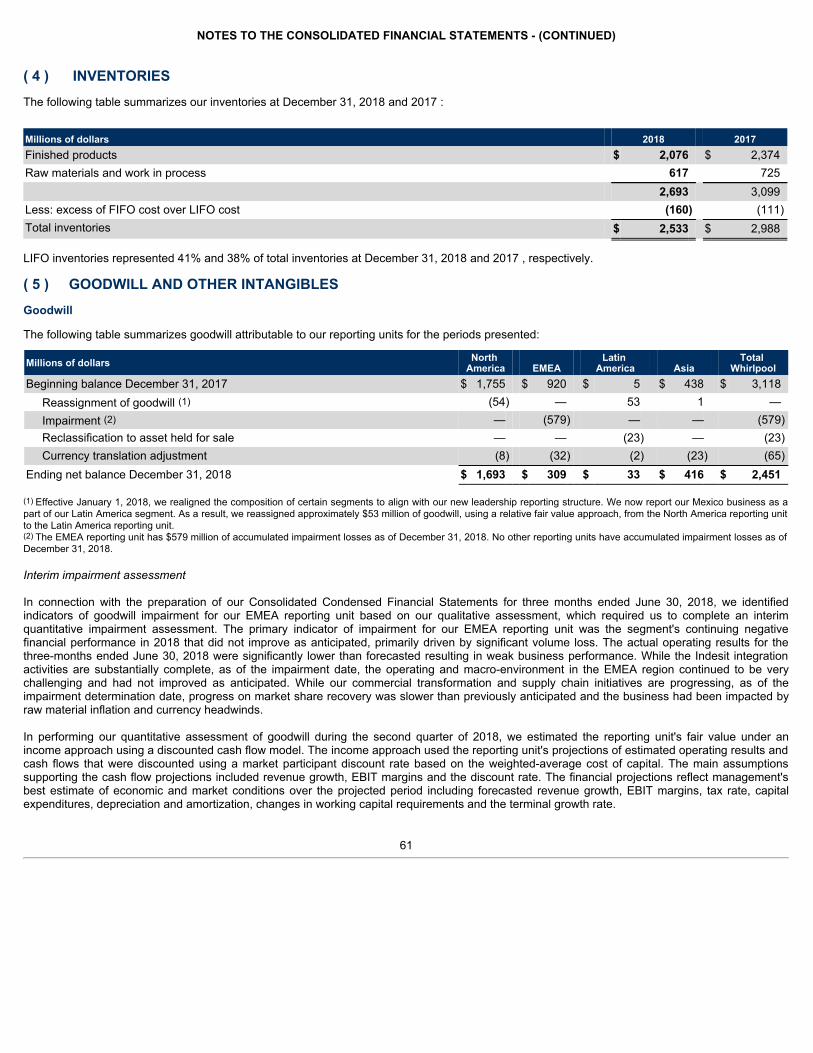
NOTES TO THE CONSOLIDATED FINANCIAL STATEMENTS - (CONTINUED)
( 4 ) INVENTORIESThe following table summarizes our inventories at December 31, 2018 and 2017 :
Millions of dollars 2018 2017Finished products $ 2,076 $ 2,374Raw materials and work in process 617 725 2,693 3,099Less: excess of FIFO cost over LIFO cost (160) (111)Total inventories $ 2,533 $ 2,988
LIFO inventories represented 41% and 38% of total inventories at December 31, 2018 and 2017 , respectively.
( 5 ) GOODWILL AND OTHER INTANGIBLESGoodwill
The following table summarizes goodwill attributable to our reporting units for the periods presented:
Millions of dollars North America EMEA
Latin America Asia
Total Whirlpool
Beginning balance December 31, 2017 $ 1,755 $ 920 $ 5 $ 438 $ 3,118Reassignment of goodwill (1) (54) — 53 1 —Impairment (2) — (579) — — (579)Reclassification to asset held for sale — — (23) — (23)Currency translation adjustment (8) (32) (2) (23) (65)
Ending net balance December 31, 2018 $ 1,693 $ 309 $ 33 $ 416 $ 2,451
(1) Effective January 1, 2018, we realigned the composition of certain segments to align with our new leadership reporting structure. We now report our Mexico business as apart of our Latin America segment. As a result, we reassigned approximately $53 million of goodwill, using a relative fair value approach, from the North America reporting unitto the Latin America reporting unit.(2) The EMEA reporting unit has $579 million of accumulated impairment losses as of December 31, 2018. No other reporting units have accumulated impairment losses as ofDecember 31, 2018.
Interimimpairmentassessment
In connection with the preparation of our Consolidated Condensed Financial Statements for three months ended June 30, 2018, we identifiedindicators of goodwill impairment for our EMEA reporting unit based on our qualitative assessment, which required us to complete an interimquantitative impairment assessment. The primary indicator of impairment for our EMEA reporting unit was the segment's continuing negativefinancial performance in 2018 that did not improve as anticipated, primarily driven by significant volume loss. The actual operating results for thethree-months ended June 30, 2018 were significantly lower than forecasted resulting in weak business performance. While the Indesit integrationactivities are substantially complete, as of the impairment date, the operating and macro-environment in the EMEA region continued to be verychallenging and had not improved as anticipated. While our commercial transformation and supply chain initiatives are progressing, as of theimpairment determination date, progress on market share recovery was slower than previously anticipated and the business had been impacted byraw material inflation and currency headwinds.
In performing our quantitative assessment of goodwill during the second quarter of 2018, we estimated the reporting unit's fair value under anincome approach using a discounted cash flow model. The income approach used the reporting unit's projections of estimated operating results andcash flows that were discounted using a market participant discount rate based on the weighted-average cost of capital. The main assumptionssupporting the cash flow projections included revenue growth, EBIT margins and the discount rate. The financial projections reflect management'sbest estimate of economic and market conditions over the projected period including forecasted revenue growth, EBIT margins, tax rate, capitalexpenditures, depreciation and amortization, changes in working capital requirements and the terminal growth rate.
61
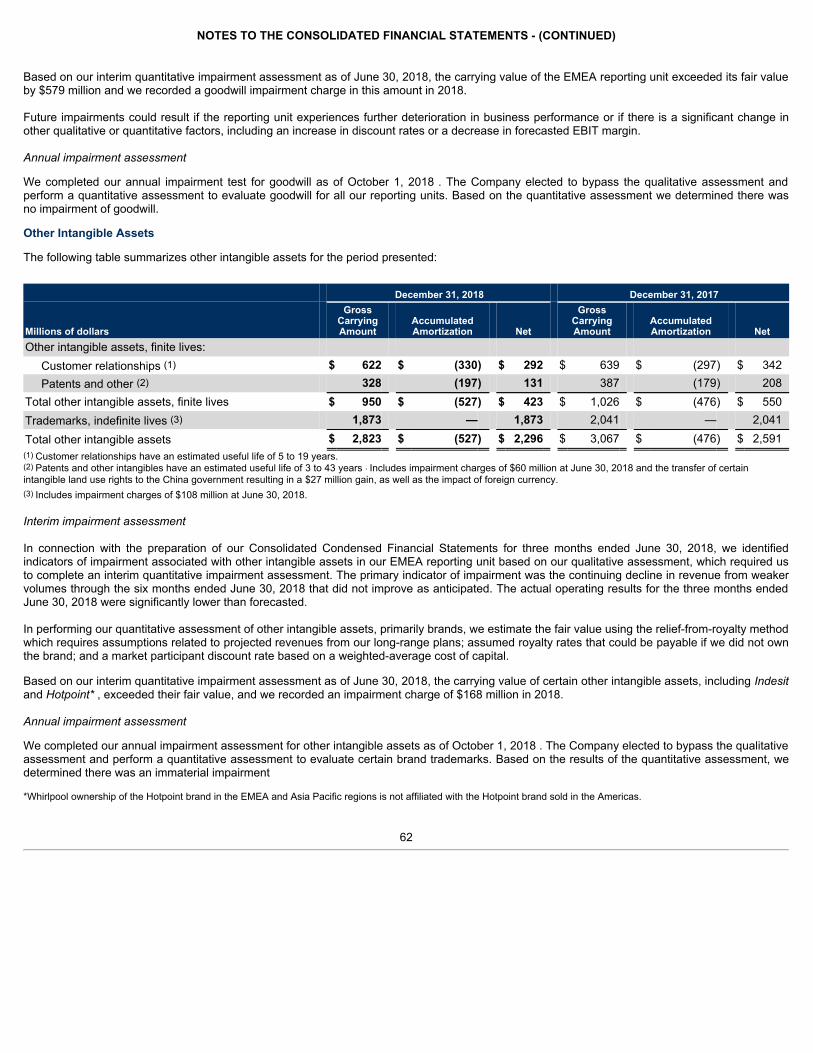
NOTES TO THE CONSOLIDATED FINANCIAL STATEMENTS - (CONTINUED)
Based on our interim quantitative impairment assessment as of June 30, 2018, the carrying value of the EMEA reporting unit exceeded its fair valueby $579 million and we recorded a goodwill impairment charge in this amount in 2018.
Future impairments could result if the reporting unit experiences further deterioration in business performance or if there is a significant change inother qualitative or quantitative factors, including an increase in discount rates or a decrease in forecasted EBIT margin.
Annualimpairmentassessment
We completed our annual impairment test for goodwill as of October 1, 2018 . The Company elected to bypass the qualitative assessment andperform a quantitative assessment to evaluate goodwill for all our reporting units. Based on the quantitative assessment we determined there wasno impairment of goodwill.
Other Intangible Assets
The following table summarizes other intangible assets for the period presented:
December 31, 2018 December 31, 2017
Millions of dollars
GrossCarryingAmount
AccumulatedAmortization Net
GrossCarryingAmount
AccumulatedAmortization Net
Other intangible assets, finite lives:Customer relationships (1) $ 622 $ (330) $ 292 $ 639 $ (297) $ 342Patents and other (2) 328 (197) 131 387 (179) 208
Total other intangible assets, finite lives $ 950 $ (527) $ 423 $ 1,026 $ (476) $ 550Trademarks, indefinite lives (3) 1,873 — 1,873 2,041 — 2,041Total other intangible assets $ 2,823 $ (527) $ 2,296 $ 3,067 $ (476) $ 2,591(1) Customer relationships have an estimated useful life of 5 to 19 years.(2) Patents and other intangibles have an estimated useful life of 3 to 43 years . Includes impairment charges of $60 million at June 30, 2018 and the transfer of certainintangible land use rights to the China government resulting in a $27 million gain, as well as the impact of foreign currency.(3) Includes impairment charges of $108 million at June 30, 2018.
Interimimpairmentassessment
In connection with the preparation of our Consolidated Condensed Financial Statements for three months ended June 30, 2018, we identifiedindicators of impairment associated with other intangible assets in our EMEA reporting unit based on our qualitative assessment, which required usto complete an interim quantitative impairment assessment. The primary indicator of impairment was the continuing decline in revenue from weakervolumes through the six months ended June 30, 2018 that did not improve as anticipated. The actual operating results for the three months endedJune 30, 2018 were significantly lower than forecasted.
In performing our quantitative assessment of other intangible assets, primarily brands, we estimate the fair value using the relief-from-royalty methodwhich requires assumptions related to projected revenues from our long-range plans; assumed royalty rates that could be payable if we did not ownthe brand; and a market participant discount rate based on a weighted-average cost of capital.
Based on our interim quantitative impairment assessment as of June 30, 2018, the carrying value of certain other intangible assets, including Indesitand Hotpoint*, exceeded their fair value, and we recorded an impairment charge of $168 million in 2018.
Annualimpairmentassessment
We completed our annual impairment assessment for other intangible assets as of October 1, 2018 . The Company elected to bypass the qualitativeassessment and perform a quantitative assessment to evaluate certain brand trademarks. Based on the results of the quantitative assessment, wedetermined there was an immaterial impairment
*Whirlpool ownership of the Hotpoint brand in the EMEA and Asia Pacific regions is not affiliated with the Hotpoint brand sold in the Americas.
62
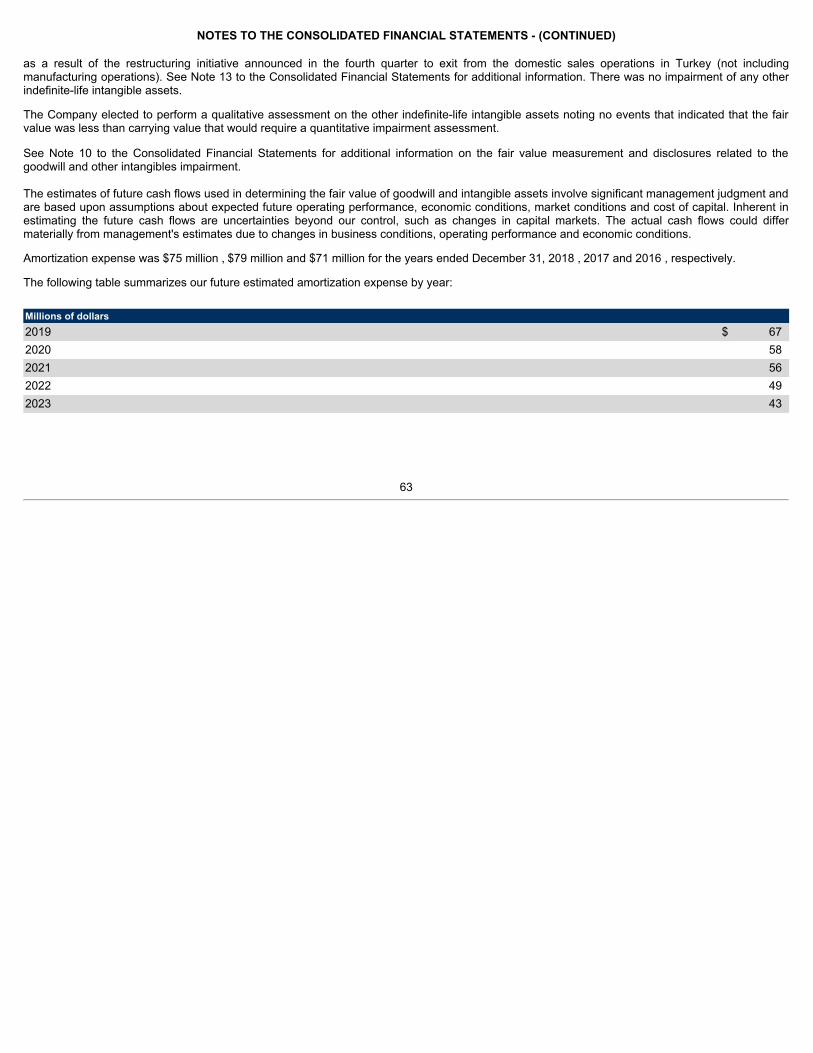
NOTES TO THE CONSOLIDATED FINANCIAL STATEMENTS - (CONTINUED)
as a result of the restructuring initiative announced in the fourth quarter to exit from the domestic sales operations in Turkey (not includingmanufacturing operations). See Note 13 to the Consolidated Financial Statements for additional information. There was no impairment of any otherindefinite-life intangible assets.
The Company elected to perform a qualitative assessment on the other indefinite-life intangible assets noting no events that indicated that the fairvalue was less than carrying value that would require a quantitative impairment assessment.
See Note 10 to the Consolidated Financial Statements for additional information on the fair value measurement and disclosures related to thegoodwill and other intangibles impairment.
The estimates of future cash flows used in determining the fair value of goodwill and intangible assets involve significant management judgment andare based upon assumptions about expected future operating performance, economic conditions, market conditions and cost of capital. Inherent inestimating the future cash flows are uncertainties beyond our control, such as changes in capital markets. The actual cash flows could differmaterially from management's estimates due to changes in business conditions, operating performance and economic conditions.
Amortization expense was $75 million , $79 million and $71 million for the years ended December 31, 2018 , 2017 and 2016 , respectively.
The following table summarizes our future estimated amortization expense by year:
Millions of dollars 2019 $ 672020 582021 562022 492023 43
63
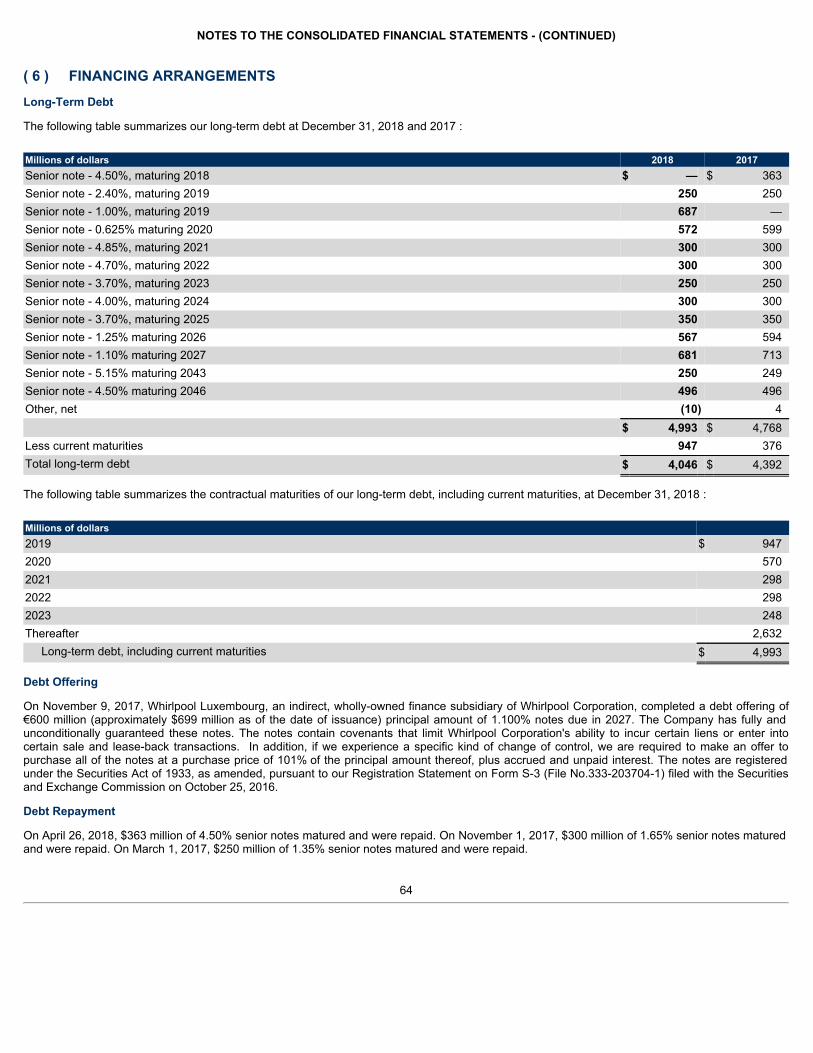
NOTES TO THE CONSOLIDATED FINANCIAL STATEMENTS - (CONTINUED)
( 6 ) FINANCING ARRANGEMENTSLong-Term Debt
The following table summarizes our long-term debt at December 31, 2018 and 2017 :
Millions of dollars 2018 2017Senior note - 4.50%, maturing 2018 $ — $ 363Senior note - 2.40%, maturing 2019 250 250Senior note - 1.00%, maturing 2019 687 —Senior note - 0.625% maturing 2020 572 599Senior note - 4.85%, maturing 2021 300 300Senior note - 4.70%, maturing 2022 300 300Senior note - 3.70%, maturing 2023 250 250Senior note - 4.00%, maturing 2024 300 300Senior note - 3.70%, maturing 2025 350 350Senior note - 1.25% maturing 2026 567 594Senior note - 1.10% maturing 2027 681 713Senior note - 5.15% maturing 2043 250 249Senior note - 4.50% maturing 2046 496 496Other, net (10) 4 $ 4,993 $ 4,768Less current maturities 947 376Total long-term debt $ 4,046 $ 4,392
The following table summarizes the contractual maturities of our long-term debt, including current maturities, at December 31, 2018 :
Millions of dollars 2019 $ 9472020 5702021 2982022 2982023 248Thereafter 2,632 Long-term debt, including current maturities $ 4,993
Debt Offering
On November 9, 2017, Whirlpool Luxembourg, an indirect, wholly-owned finance subsidiary of Whirlpool Corporation, completed a debt offering of€600 million (approximately $699 million as of the date of issuance) principal amount of 1.100% notes due in 2027. The Company has fully andunconditionally guaranteed these notes. The notes contain covenants that limit Whirlpool Corporation's ability to incur certain liens or enter intocertain sale and lease-back transactions. In addition, if we experience a specific kind of change of control, we are required to make an offer topurchase all of the notes at a purchase price of 101% of the principal amount thereof, plus accrued and unpaid interest. The notes are registeredunder the Securities Act of 1933, as amended, pursuant to our Registration Statement on Form S-3 (File No.333-203704-1) filed with the Securitiesand Exchange Commission on October 25, 2016.
Debt Repayment
On April 26, 2018, $363 million of 4.50% senior notes matured and were repaid. On November 1, 2017, $300 million of 1.65% senior notes maturedand were repaid. On March 1, 2017, $250 million of 1.35% senior notes matured and were repaid.
64
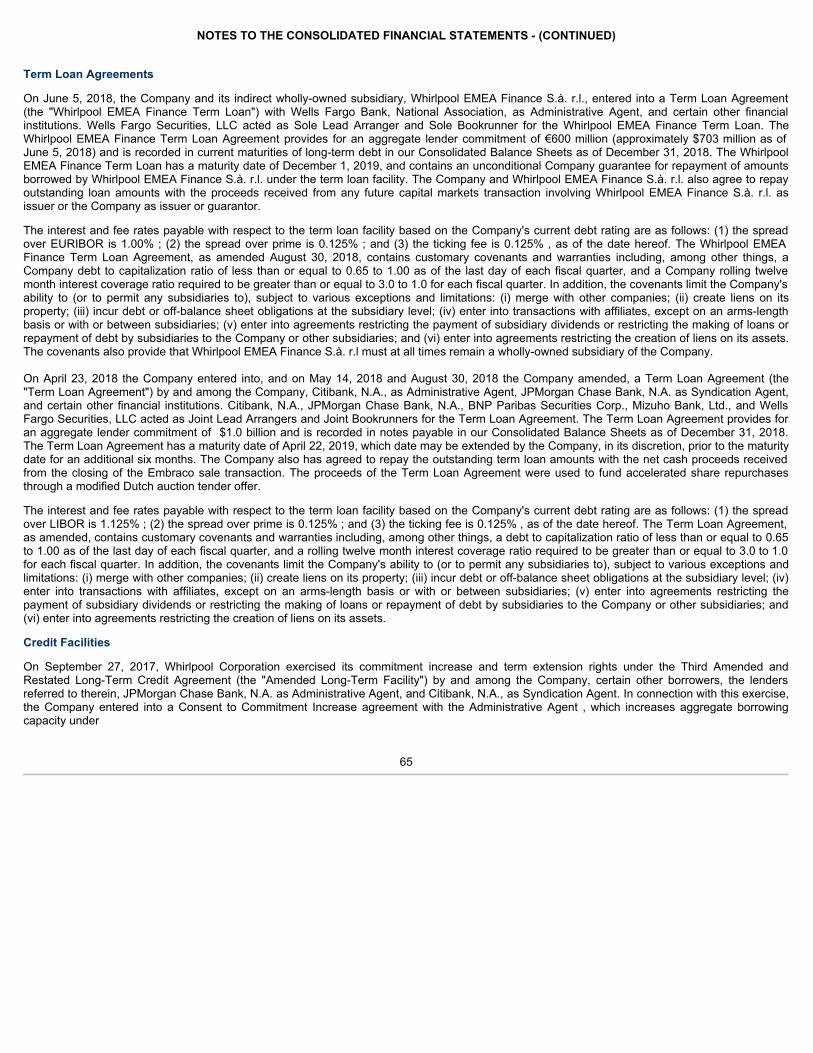
NOTES TO THE CONSOLIDATED FINANCIAL STATEMENTS - (CONTINUED)
Term Loan Agreements
On June 5, 2018, the Company and its indirect wholly-owned subsidiary, Whirlpool EMEA Finance S.à. r.l., entered into a Term Loan Agreement(the "Whirlpool EMEA Finance Term Loan") with Wells Fargo Bank, National Association, as Administrative Agent, and certain other financialinstitutions. Wells Fargo Securities, LLC acted as Sole Lead Arranger and Sole Bookrunner for the Whirlpool EMEA Finance Term Loan. TheWhirlpool EMEA Finance Term Loan Agreement provides for an aggregate lender commitment of €600 million (approximately $703 million as ofJune 5, 2018) and is recorded in current maturities of long-term debt in our Consolidated Balance Sheets as of December 31, 2018. The WhirlpoolEMEA Finance Term Loan has a maturity date of December 1, 2019, and contains an unconditional Company guarantee for repayment of amountsborrowed by Whirlpool EMEA Finance S.à. r.l. under the term loan facility. The Company and Whirlpool EMEA Finance S.à. r.l. also agree to repayoutstanding loan amounts with the proceeds received from any future capital markets transaction involving Whirlpool EMEA Finance S.à. r.l. asissuer or the Company as issuer or guarantor.
The interest and fee rates payable with respect to the term loan facility based on the Company's current debt rating are as follows: (1) the spreadover EURIBOR is 1.00% ; (2) the spread over prime is 0.125% ; and (3) the ticking fee is 0.125% , as of the date hereof. The Whirlpool EMEAFinance Term Loan Agreement, as amended August 30, 2018, contains customary covenants and warranties including, among other things, aCompany debt to capitalization ratio of less than or equal to 0.65 to 1.00 as of the last day of each fiscal quarter, and a Company rolling twelvemonth interest coverage ratio required to be greater than or equal to 3.0 to 1.0 for each fiscal quarter. In addition, the covenants limit the Company'sability to (or to permit any subsidiaries to), subject to various exceptions and limitations: (i) merge with other companies; (ii) create liens on itsproperty; (iii) incur debt or off-balance sheet obligations at the subsidiary level; (iv) enter into transactions with affiliates, except on an arms-lengthbasis or with or between subsidiaries; (v) enter into agreements restricting the payment of subsidiary dividends or restricting the making of loans orrepayment of debt by subsidiaries to the Company or other subsidiaries; and (vi) enter into agreements restricting the creation of liens on its assets.The covenants also provide that Whirlpool EMEA Finance S.à. r.l must at all times remain a wholly-owned subsidiary of the Company.
On April 23, 2018 the Company entered into, and on May 14, 2018 and August 30, 2018 the Company amended, a Term Loan Agreement (the"Term Loan Agreement") by and among the Company, Citibank, N.A., as Administrative Agent, JPMorgan Chase Bank, N.A. as Syndication Agent,and certain other financial institutions. Citibank, N.A., JPMorgan Chase Bank, N.A., BNP Paribas Securities Corp., Mizuho Bank, Ltd., and WellsFargo Securities, LLC acted as Joint Lead Arrangers and Joint Bookrunners for the Term Loan Agreement. The Term Loan Agreement provides foran aggregate lender commitment of $1.0 billion and is recorded in notes payable in our Consolidated Balance Sheets as of December 31, 2018.The Term Loan Agreement has a maturity date of April 22, 2019, which date may be extended by the Company, in its discretion, prior to the maturitydate for an additional six months. The Company also has agreed to repay the outstanding term loan amounts with the net cash proceeds receivedfrom the closing of the Embraco sale transaction. The proceeds of the Term Loan Agreement were used to fund accelerated share repurchasesthrough a modified Dutch auction tender offer.
The interest and fee rates payable with respect to the term loan facility based on the Company's current debt rating are as follows: (1) the spreadover LIBOR is 1.125% ; (2) the spread over prime is 0.125% ; and (3) the ticking fee is 0.125% , as of the date hereof. The Term Loan Agreement,as amended, contains customary covenants and warranties including, among other things, a debt to capitalization ratio of less than or equal to 0.65to 1.00 as of the last day of each fiscal quarter, and a rolling twelve month interest coverage ratio required to be greater than or equal to 3.0 to 1.0for each fiscal quarter. In addition, the covenants limit the Company's ability to (or to permit any subsidiaries to), subject to various exceptions andlimitations: (i) merge with other companies; (ii) create liens on its property; (iii) incur debt or off-balance sheet obligations at the subsidiary level; (iv)enter into transactions with affiliates, except on an arms-length basis or with or between subsidiaries; (v) enter into agreements restricting thepayment of subsidiary dividends or restricting the making of loans or repayment of debt by subsidiaries to the Company or other subsidiaries; and(vi) enter into agreements restricting the creation of liens on its assets.
Credit Facilities
On September 27, 2017, Whirlpool Corporation exercised its commitment increase and term extension rights under the Third Amended andRestated Long-Term Credit Agreement (the "Amended Long-Term Facility") by and among the Company, certain other borrowers, the lendersreferred to therein, JPMorgan Chase Bank, N.A. as Administrative Agent, and Citibank, N.A., as Syndication Agent. In connection with this exercise,the Company entered into a Consent to Commitment Increase agreement with the Administrative Agent , which increases aggregate borrowingcapacity under
65
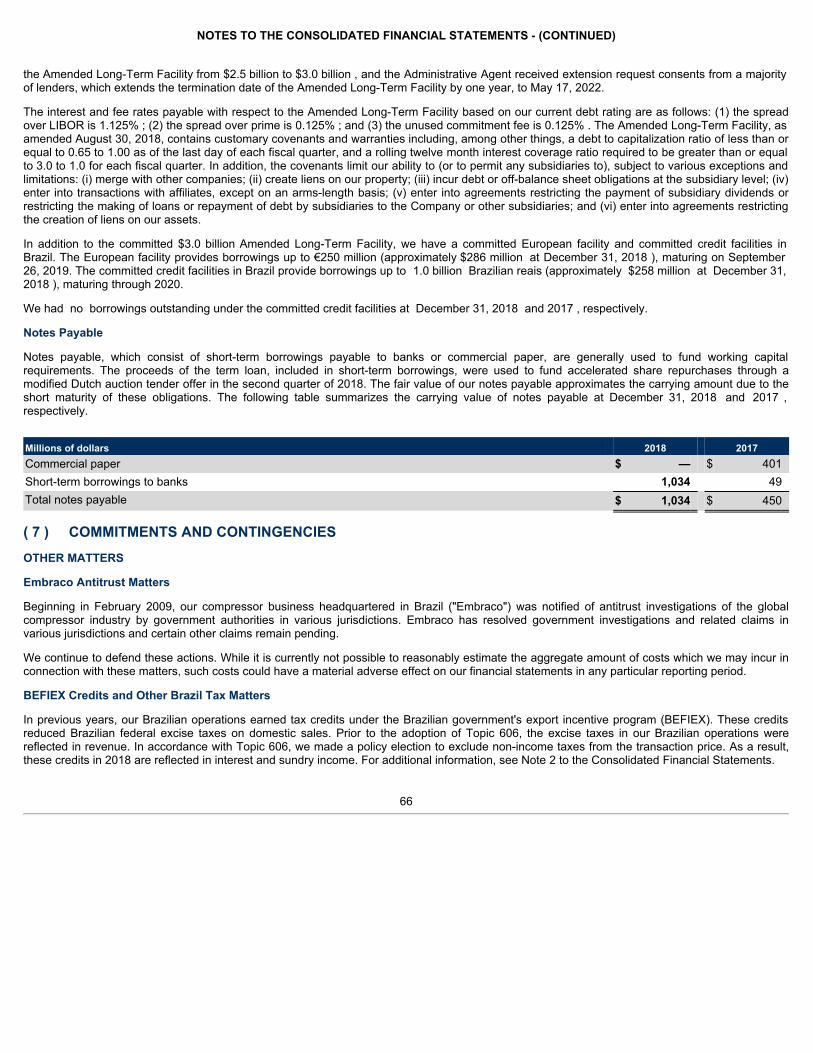
NOTES TO THE CONSOLIDATED FINANCIAL STATEMENTS - (CONTINUED)
the Amended Long-Term Facility from $2.5 billion to $3.0 billion , and the Administrative Agent received extension request consents from a majorityof lenders, which extends the termination date of the Amended Long-Term Facility by one year, to May 17, 2022.
The interest and fee rates payable with respect to the Amended Long-Term Facility based on our current debt rating are as follows: (1) the spreadover LIBOR is 1.125% ; (2) the spread over prime is 0.125% ; and (3) the unused commitment fee is 0.125% . The Amended Long-Term Facility, asamended August 30, 2018, contains customary covenants and warranties including, among other things, a debt to capitalization ratio of less than orequal to 0.65 to 1.00 as of the last day of each fiscal quarter, and a rolling twelve month interest coverage ratio required to be greater than or equalto 3.0 to 1.0 for each fiscal quarter. In addition, the covenants limit our ability to (or to permit any subsidiaries to), subject to various exceptions andlimitations: (i) merge with other companies; (ii) create liens on our property; (iii) incur debt or off-balance sheet obligations at the subsidiary level; (iv)enter into transactions with affiliates, except on an arms-length basis; (v) enter into agreements restricting the payment of subsidiary dividends orrestricting the making of loans or repayment of debt by subsidiaries to the Company or other subsidiaries; and (vi) enter into agreements restrictingthe creation of liens on our assets.
In addition to the committed $3.0 billion Amended Long-Term Facility, we have a committed European facility and committed credit facilities inBrazil. The European facility provides borrowings up to €250 million (approximately $286 million at December 31, 2018 ), maturing on September26, 2019. The committed credit facilities in Brazil provide borrowings up to 1.0 billion Brazilian reais (approximately $258 million at December 31,2018 ), maturing through 2020.
We had no borrowings outstanding under the committed credit facilities at December 31, 2018 and 2017 , respectively.
Notes Payable
Notes payable, which consist of short-term borrowings payable to banks or commercial paper, are generally used to fund working capitalrequirements. The proceeds of the term loan, included in short-term borrowings, were used to fund accelerated share repurchases through amodified Dutch auction tender offer in the second quarter of 2018. The fair value of our notes payable approximates the carrying amount due to theshort maturity of these obligations. The following table summarizes the carrying value of notes payable at December 31, 2018 and 2017 ,respectively.
Millions of dollars 2018 2017Commercial paper $ — $ 401Short-term borrowings to banks 1,034 49Total notes payable $ 1,034 $ 450
( 7 ) COMMITMENTS AND CONTINGENCIESOTHER MATTERS
Embraco Antitrust Matters
Beginning in February 2009, our compressor business headquartered in Brazil ("Embraco") was notified of antitrust investigations of the globalcompressor industry by government authorities in various jurisdictions. Embraco has resolved government investigations and related claims invarious jurisdictions and certain other claims remain pending.
We continue to defend these actions. While it is currently not possible to reasonably estimate the aggregate amount of costs which we may incur inconnection with these matters, such costs could have a material adverse effect on our financial statements in any particular reporting period.
BEFIEX Credits and Other Brazil Tax Matters
In previous years, our Brazilian operations earned tax credits under the Brazilian government's export incentive program (BEFIEX). These creditsreduced Brazilian federal excise taxes on domestic sales. Prior to the adoption of Topic 606, the excise taxes in our Brazilian operations werereflected in revenue. In accordance with Topic 606, we made a policy election to exclude non-income taxes from the transaction price. As a result,these credits in 2018 are reflected in interest and sundry income. For additional information, see Note 2 to the Consolidated Financial Statements.
66
NOTES TO THE CONSOLIDATED FINANCIAL STATEMENTS - (CONTINUED)
In December 2013, the Brazilian government reinstituted the monetary adjustment index applicable to BEFIEX credits that existed prior to July 2009,when the Brazilian government required companies to apply a different monetary adjustment index to BEFIEX credits. Whether use of thereinstituted index should be given retroactive effect for the July 2009 to December 2013 period has been subject to review by the Brazilian courts. Inthe third quarter of 2017, the Brazilian Supreme Court ruled that the reinstituted index should be given retroactive effect for the July 2009 toDecember 2013 period, which ruling has been appealed by the Brazilian government. Based on this ruling, we were entitled to recognize, and by thesecond quarter of 2018 had monetized, $72 million in additional credits. As of December 31, 2018 , no BEFIEX credits remain to be monetized.
Our Brazilian operations have received tax assessments for income and social contribution taxes associated with certain monetized BEFIEXcredits. We do not believe BEFIEX credits are subject to income or social contribution taxes. We believe these tax assessments are without meritand are vigorously defending our positions. We have not provided for income or social contribution taxes on these BEFIEX credits, and based on theopinions of tax and legal advisors, we have not accrued any amount related to these assessments as of December 31, 2018 . The total amount ofoutstanding tax assessments received for income and social contribution taxes relating to the BEFIEX credits, including interest and penalties, isapproximately 1.8 billion Brazilian reais (approximately $476 million as of December 31, 2018 ).
Relying on existing Brazilian legal precedent, in 2003 and 2004, we recognized tax credits in an aggregate amount of $26 million , adjusted forcurrency, on the purchase of raw materials used in production ("IPI tax credits"). The Brazilian tax authority subsequently challenged the recordingof IPI tax credits. No credits have been recognized since 2004. In 2009, we entered into a Brazilian government program ("IPI Amnesty") whichprovided extended payment terms and reduced penalties and interest to encourage tax payers to resolve this and certain other disputed tax creditamounts. As permitted by the program, we elected to settle certain debts through the use of other existing tax credits and recorded charges ofapproximately $34 million in 2009 associated with these matters. In July 2012, the Brazilian revenue authority notified us that a portion of ourproposed settlement was rejected and we received tax assessments of 248 million Brazilian reais (approximately $64 million as of December 31,2018 ) , reflecting interest and penalties to date. We believe these tax assessments are without merit and are vigorously defending our position. Thegovernment's assessment in this case relies heavily on its arguments regarding taxability of BEFIEX credits for certain years, which we are disputingin one of the BEFIEX government assessment cases cited in the prior paragraph. Because the IPI Amnesty case is moving faster than the BEFIEXtaxability case, we could be required to pay the IPI Amnesty assessment before obtaining a final decision in BEFIEX taxability case.
In 2001, Brazil adopted a law making the profits of controlled foreign corporations of Brazilian entities subject to income and social contribution taxregardless of whether the profits were repatriated ("CFC Tax"). Our Brazilian subsidiary, along with other corporations, challenged tax assessmentson foreign profits on constitutionality and other grounds. In April 2013, the Brazilian Supreme Court ruled on one of our cases, finding that the law isconstitutional, but remanded the case to a lower court for consideration of other arguments raised in our appeal, including the existence of taxtreaties with jurisdictions in which controlled foreign corporations are domiciled. As of December 31, 2018 , our potential exposure for income andsocial contribution taxes relating to profits of controlled foreign corporations, including interest and penalties and net of expected foreign tax credits,is approximately 208 million Brazilian reais (approximately $54 million as of December 31, 2018 ). We believe these assessments are without meritand are vigorously defending our positions. Based on the opinion of our tax and legal advisors, we have no t accrued any amount related to theseassessments as of December 31, 2018 .
In addition to the IPI tax credit and CFC Tax matters noted above, other assessments issued to us by the Brazilian tax authorities related to non-income and income tax matters, and other matters, are at various stages of review in numerous administrative and judicial proceedings. Theamounts related to these assessments will continue to be increased by monetary adjustments at the Selic rate, which is the benchmark rate set bythe Brazilian Central Bank. In accordance with our accounting policies, we routinely assess these matters and, when necessary, record our bestestimate of a loss. We believe these tax assessments are without merit and are vigorously defending our positions.
We also filed legal actions to recover certain social integration and social contribution taxes paid over gross sales including ICMS receipts, which isa form of Value Added Tax in Brazil. During 2017, we sold the rights to certain portions of this litigation to a third party for 90 million Brazilian reais(approximately $27 million as of December 31, 2017). Approximately $219 million in face value of credits related to this litigation remain. While theCompany's recovery with respect to the remaining litigation may be material, there is substantial uncertainty about both the amount and timing ofany recovery. A nominal amount has been recorded related to outstanding credits.
67
NOTES TO THE CONSOLIDATED FINANCIAL STATEMENTS - (CONTINUED)
Litigation is inherently unpredictable and the conclusion of these matters may take many years to ultimately resolve. Accordingly, it is possible thatan unfavorable outcome in these proceedings could have a material adverse effect on our financial statements in any particular reporting period.
Competition Investigation
In 2013, the French Competition Authority ("FCA") commenced an investigation of appliance manufacturers and retailers in France. Theinvestigation includes a number of manufacturers, including the Whirlpool and Indesit operations in France.
On June 26, 2018, Whirlpool France SAS, a subsidiary of the Company, reached an agreement with the staff of the FCA to settle the first part of itsinvestigation, which relates to a 14 -month period during parts of 2006-07 and 2008-09. In the third quarter of 2018, we accrued €95 million afterentering into a preliminary settlement agreement with the FCA. On December 6, 2018, the FCA's college issued its final decision, setting the finalamount of the fine at €102 million , with €56 million attributable to Whirlpool's France business and €46 million attributable to Indesit's Francebusiness. Under the terms of a settlement with Indesit's former owners, the former owners are obligated to pay €17 million out of escrow to theCompany. The Company expects payment of the FCA fine and payment to the Company from Indesit's former owners to both be made in thesecond quarter of 2019.
The second part of the FCA investigation, which is expected to focus primarily on manufacturer interactions with retailers, is ongoing but at a lessadvanced stage. The Company is cooperating with this investigation. Although it is currently not possible to assess the impact, if any, this mattermay have on our financial statements, the resolution of the second part of the FCA investigation could have a material adverse effect on ourfinancial statements in any particular reporting period.
Trade Customer Insolvency
In 2017, Alno AG and certain affiliated companies filed for insolvency protection in Germany. Bauknecht Hausgeräte GmbH, a subsidiary of theCompany, was a long-standing supplier to Alno and certain of its affiliated companies. The Company was also a former indirect minority shareholderof Alno. In August 2018, the insolvency trustee asserted €174.5 million in clawback and related claims against Bauknecht. We are reviewing theclaims made by the insolvency trustee. Based on our preliminary understanding of the facts and the applicable law, we expect to vigorously defendagainst the claims. Although it is currently not possible to assess the impact this matter may have on our Consolidated Financial Statements, theresolution of this matter could have a material adverse effect on our financial statements in any particular reporting period.
Other Litigation
We are currently defending against a lawsuit that has been certified for treatment as a class action in U.S. federal court, relating to two top-loadwashing machine models. We believe this lawsuit is without merit and are vigorously defending it. Given the preliminary stage of the proceeding, wecannot reasonably estimate a range of loss, if any, at this time. The resolution of this matter could have a material adverse effect on our financialstatements in any particular reporting period.
We are currently vigorously defending a number of other lawsuits related to the manufacture and sale of our products which include class actionallegations, and may become involved in similar actions. These lawsuits allege claims which include negligence, breach of contract, breach ofwarranty, product liability and safety claims, false advertising, fraud, and violation of federal and state regulations, including consumer protectionlaws. In general, we do not have insurance coverage for class action lawsuits. We are also involved in various other legal actions arising in thenormal course of business, for which insurance coverage may or may not be available depending on the nature of the action. We dispute the meritsof these suits and actions, and intend to vigorously defend them. Management believes, based upon its current knowledge, after taking intoconsideration legal counsel's evaluation of such suits and actions, and after taking into account current litigation accruals, that the outcome of thesematters currently pending against Whirlpool should not have a material adverse effect, if any, on our financial statements.
68
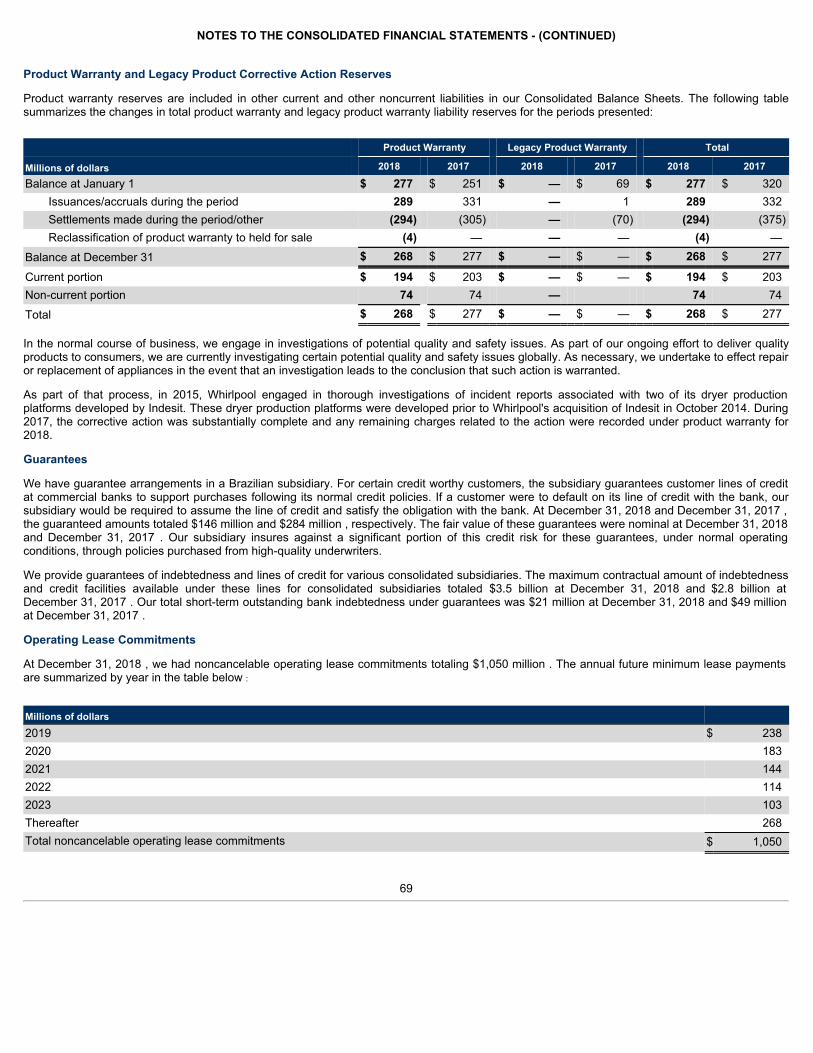
NOTES TO THE CONSOLIDATED FINANCIAL STATEMENTS - (CONTINUED)
Product Warranty and Legacy Product Corrective Action Reserves
Product warranty reserves are included in other current and other noncurrent liabilities in our Consolidated Balance Sheets. The following tablesummarizes the changes in total product warranty and legacy product warranty liability reserves for the periods presented:
Product Warranty Legacy Product Warranty Total
Millions of dollars 2018 2017 2018 2017 2018 2017
Balance at January 1 $ 277 $ 251 $ — $ 69 $ 277 $ 320Issuances/accruals during the period 289 331 — 1 289 332Settlements made during the period/other (294) (305) — (70) (294) (375)Reclassification of product warranty to held for sale (4) — — — (4) —
Balance at December 31 $ 268 $ 277 $ — $ — $ 268 $ 277
Current portion $ 194 $ 203 $ — $ — $ 194 $ 203Non-current portion 74 74 — 74 74Total $ 268 $ 277 $ — $ — $ 268 $ 277
In the normal course of business, we engage in investigations of potential quality and safety issues. As part of our ongoing effort to deliver qualityproducts to consumers, we are currently investigating certain potential quality and safety issues globally. As necessary, we undertake to effect repairor replacement of appliances in the event that an investigation leads to the conclusion that such action is warranted.
As part of that process, in 2015, Whirlpool engaged in thorough investigations of incident reports associated with two of its dryer productionplatforms developed by Indesit. These dryer production platforms were developed prior to Whirlpool's acquisition of Indesit in October 2014. During2017, the corrective action was substantially complete and any remaining charges related to the action were recorded under product warranty for2018.
Guarantees
We have guarantee arrangements in a Brazilian subsidiary. For certain credit worthy customers, the subsidiary guarantees customer lines of creditat commercial banks to support purchases following its normal credit policies. If a customer were to default on its line of credit with the bank, oursubsidiary would be required to assume the line of credit and satisfy the obligation with the bank. At December 31, 2018 and December 31, 2017 ,the guaranteed amounts totaled $146 million and $284 million , respectively. The fair value of these guarantees were nominal at December 31, 2018and December 31, 2017 . Our subsidiary insures against a significant portion of this credit risk for these guarantees, under normal operatingconditions, through policies purchased from high-quality underwriters.
We provide guarantees of indebtedness and lines of credit for various consolidated subsidiaries. The maximum contractual amount of indebtednessand credit facilities available under these lines for consolidated subsidiaries totaled $3.5 billion at December 31, 2018 and $2.8 billion atDecember 31, 2017 . Our total short-term outstanding bank indebtedness under guarantees was $21 million at December 31, 2018 and $49 millionat December 31, 2017 .
Operating Lease Commitments
At December 31, 2018 , we had noncancelable operating lease commitments totaling $1,050 million . The annual future minimum lease paymentsare summarized by year in the table below :
Millions of dollars 2019 $ 2382020 1832021 1442022 1142023 103Thereafter 268Total noncancelable operating lease commitments $ 1,050
69
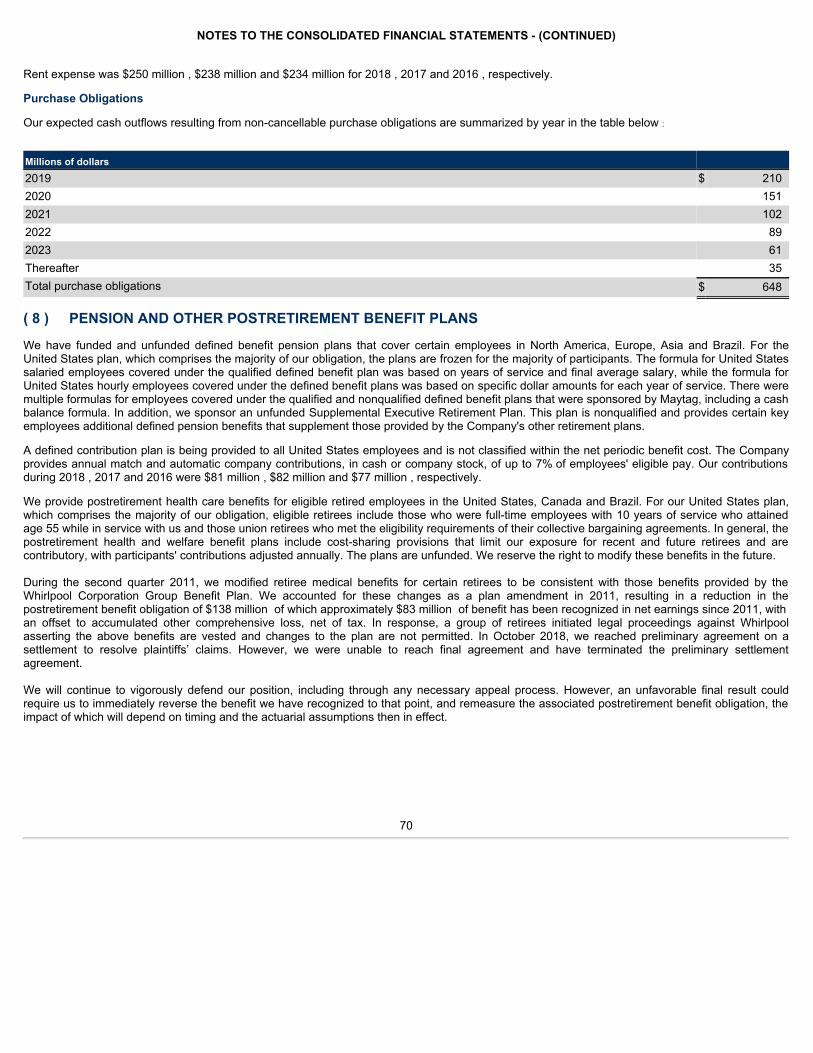
NOTES TO THE CONSOLIDATED FINANCIAL STATEMENTS - (CONTINUED)
Rent expense was $250 million , $238 million and $234 million for 2018 , 2017 and 2016 , respectively.
Purchase Obligations
Our expected cash outflows resulting from non-cancellable purchase obligations are summarized by year in the table below :
Millions of dollars 2019 $ 2102020 1512021 1022022 892023 61Thereafter 35Total purchase obligations $ 648
( 8 ) PENSION AND OTHER POSTRETIREMENT BENEFIT PLANS
We have funded and unfunded defined benefit pension plans that cover certain employees in North America, Europe, Asia and Brazil. For theUnited States plan, which comprises the majority of our obligation, the plans are frozen for the majority of participants. The formula for United Statessalaried employees covered under the qualified defined benefit plan was based on years of service and final average salary, while the formula forUnited States hourly employees covered under the defined benefit plans was based on specific dollar amounts for each year of service. There weremultiple formulas for employees covered under the qualified and nonqualified defined benefit plans that were sponsored by Maytag, including a cashbalance formula. In addition, we sponsor an unfunded Supplemental Executive Retirement Plan. This plan is nonqualified and provides certain keyemployees additional defined pension benefits that supplement those provided by the Company's other retirement plans.
A defined contribution plan is being provided to all United States employees and is not classified within the net periodic benefit cost. The Companyprovides annual match and automatic company contributions, in cash or company stock, of up to 7% of employees' eligible pay. Our contributionsduring 2018 , 2017 and 2016 were $81 million , $82 million and $77 million , respectively.
We provide postretirement health care benefits for eligible retired employees in the United States, Canada and Brazil. For our United States plan,which comprises the majority of our obligation, eligible retirees include those who were full-time employees with 10 years of service who attainedage 55 while in service with us and those union retirees who met the eligibility requirements of their collective bargaining agreements. In general, thepostretirement health and welfare benefit plans include cost-sharing provisions that limit our exposure for recent and future retirees and arecontributory, with participants' contributions adjusted annually. The plans are unfunded. We reserve the right to modify these benefits in the future.
During the second quarter 2011, we modified retiree medical benefits for certain retirees to be consistent with those benefits provided by theWhirlpool Corporation Group Benefit Plan. We accounted for these changes as a plan amendment in 2011, resulting in a reduction in thepostretirement benefit obligation of $138 million of which approximately $83 million of benefit has been recognized in net earnings since 2011, withan offset to accumulated other comprehensive loss, net of tax. In response, a group of retirees initiated legal proceedings against Whirlpoolasserting the above benefits are vested and changes to the plan are not permitted. In October 2018, we reached preliminary agreement on asettlement to resolve plaintiffs’ claims. However, we were unable to reach final agreement and have terminated the preliminary settlementagreement.
We will continue to vigorously defend our position, including through any necessary appeal process. However, an unfavorable final result couldrequire us to immediately reverse the benefit we have recognized to that point, and remeasure the associated postretirement benefit obligation, theimpact of which will depend on timing and the actuarial assumptions then in effect.
70
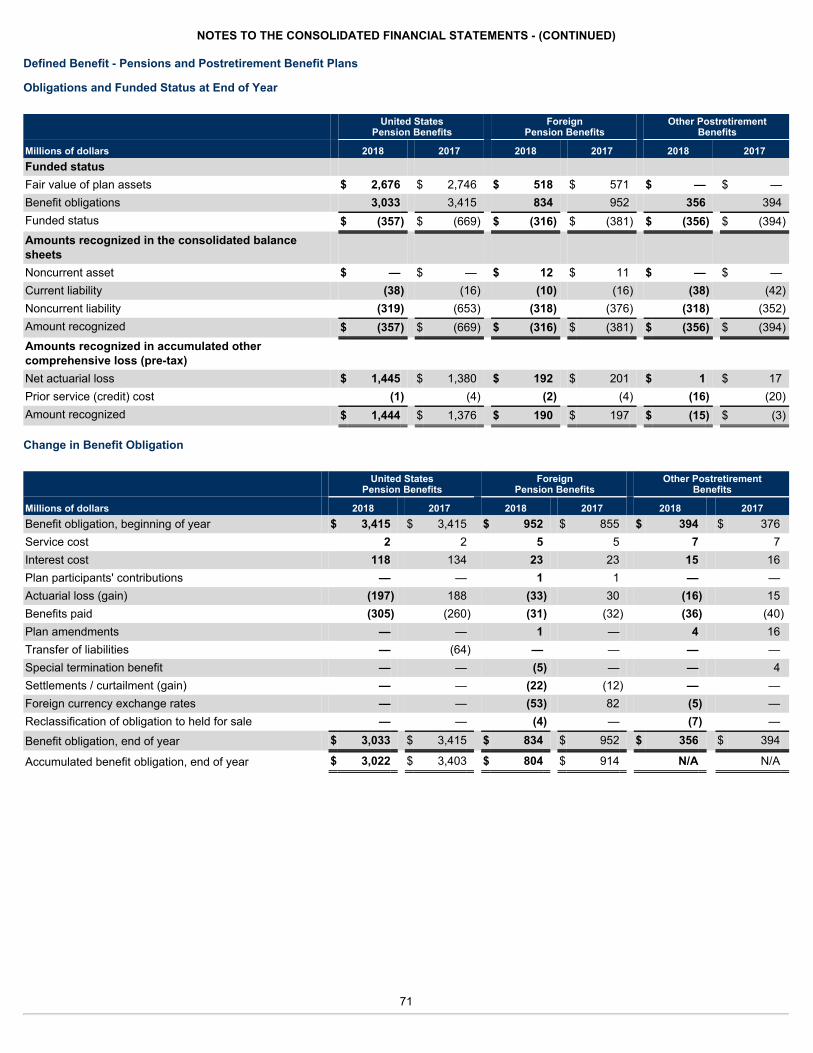
NOTES TO THE CONSOLIDATED FINANCIAL STATEMENTS - (CONTINUED)
Defined Benefit - Pensions and Postretirement Benefit Plans
Obligations and Funded Status at End of Year
United States
Pension Benefits Foreign
Pension Benefits Other Postretirement
Benefits
Millions of dollars 2018 2017 2018 2017 2018 2017Funded status Fair value of plan assets $ 2,676 $ 2,746 $ 518 $ 571 $ — $ —Benefit obligations 3,033 3,415 834 952 356 394Funded status $ (357) $ (669) $ (316) $ (381) $ (356) $ (394)Amounts recognized in the consolidated balancesheets Noncurrent asset $ — $ — $ 12 $ 11 $ — $ —Current liability (38) (16) (10) (16) (38) (42)Noncurrent liability (319) (653) (318) (376) (318) (352)Amount recognized $ (357) $ (669) $ (316) $ (381) $ (356) $ (394)Amounts recognized in accumulated othercomprehensive loss (pre-tax) Net actuarial loss $ 1,445 $ 1,380 $ 192 $ 201 $ 1 $ 17Prior service (credit) cost (1) (4) (2) (4) (16) (20)Amount recognized $ 1,444 $ 1,376 $ 190 $ 197 $ (15) $ (3)
Change in Benefit Obligation
United States
Pension Benefits Foreign
Pension Benefits Other Postretirement
Benefits
Millions of dollars 2018 2017 2018 2017 2018 2017Benefit obligation, beginning of year $ 3,415 $ 3,415 $ 952 $ 855 $ 394 $ 376Service cost 2 2 5 5 7 7Interest cost 118 134 23 23 15 16Plan participants' contributions — — 1 1 — —Actuarial loss (gain) (197) 188 (33) 30 (16) 15Benefits paid (305) (260) (31) (32) (36) (40)Plan amendments — — 1 — 4 16Transfer of liabilities — (64) — — — —Special termination benefit — — (5) — — 4Settlements / curtailment (gain) — — (22) (12) — —Foreign currency exchange rates — — (53) 82 (5) —Reclassification of obligation to held for sale — — (4) — (7) —Benefit obligation, end of year $ 3,033 $ 3,415 $ 834 $ 952 $ 356 $ 394
Accumulated benefit obligation, end of year $ 3,022 $ 3,403 $ 804 $ 914 N/A N/A
71
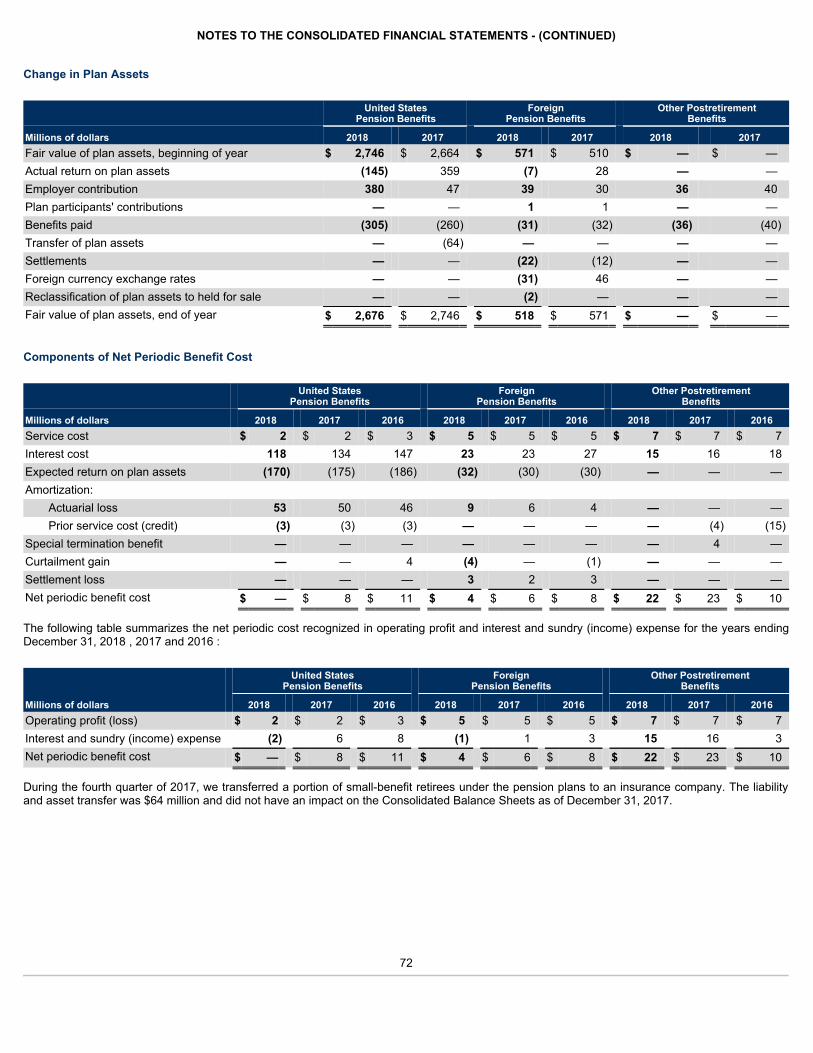
NOTES TO THE CONSOLIDATED FINANCIAL STATEMENTS - (CONTINUED)
Change in Plan Assets
United States
Pension Benefits Foreign
Pension Benefits Other Postretirement
Benefits
Millions of dollars 2018 2017 2018 2017 2018 2017Fair value of plan assets, beginning of year $ 2,746 $ 2,664 $ 571 $ 510 $ — $ —Actual return on plan assets (145) 359 (7) 28 — —Employer contribution 380 47 39 30 36 40Plan participants' contributions — — 1 1 — —Benefits paid (305) (260) (31) (32) (36) (40)Transfer of plan assets — (64) — — — —Settlements — — (22) (12) — —Foreign currency exchange rates — — (31) 46 — —Reclassification of plan assets to held for sale — — (2) — — —Fair value of plan assets, end of year $ 2,676 $ 2,746 $ 518 $ 571 $ — $ —
Components of Net Periodic Benefit Cost
United States
Pension Benefits Foreign
Pension Benefits Other Postretirement
Benefits
Millions of dollars 2018 2017 2016 2018 2017 2016 2018 2017 2016Service cost $ 2 $ 2 $ 3 $ 5 $ 5 $ 5 $ 7 $ 7 $ 7Interest cost 118 134 147 23 23 27 15 16 18Expected return on plan assets (170) (175) (186) (32) (30) (30) — — —Amortization:
Actuarial loss 53 50 46 9 6 4 — — —Prior service cost (credit) (3) (3) (3) — — — — (4) (15)
Special termination benefit — — — — — — — 4 —Curtailment gain — — 4 (4) — (1) — — —Settlement loss — — — 3 2 3 — — —Net periodic benefit cost $ — $ 8 $ 11 $ 4 $ 6 $ 8 $ 22 $ 23 $ 10
The following table summarizes the net periodic cost recognized in operating profit and interest and sundry (income) expense for the years endingDecember 31, 2018 , 2017 and 2016 :
United States
Pension Benefits Foreign
Pension Benefits Other Postretirement
Benefits
Millions of dollars 2018 2017 2016 2018 2017 2016 2018 2017 2016Operating profit (loss) $ 2 $ 2 $ 3 $ 5 $ 5 $ 5 $ 7 $ 7 $ 7Interest and sundry (income) expense (2) 6 8 (1) 1 3 15 16 3Net periodic benefit cost $ — $ 8 $ 11 $ 4 $ 6 $ 8 $ 22 $ 23 $ 10
During the fourth quarter of 2017, we transferred a portion of small-benefit retirees under the pension plans to an insurance company. The liabilityand asset transfer was $64 million and did not have an impact on the Consolidated Balance Sheets as of December 31, 2017.
72
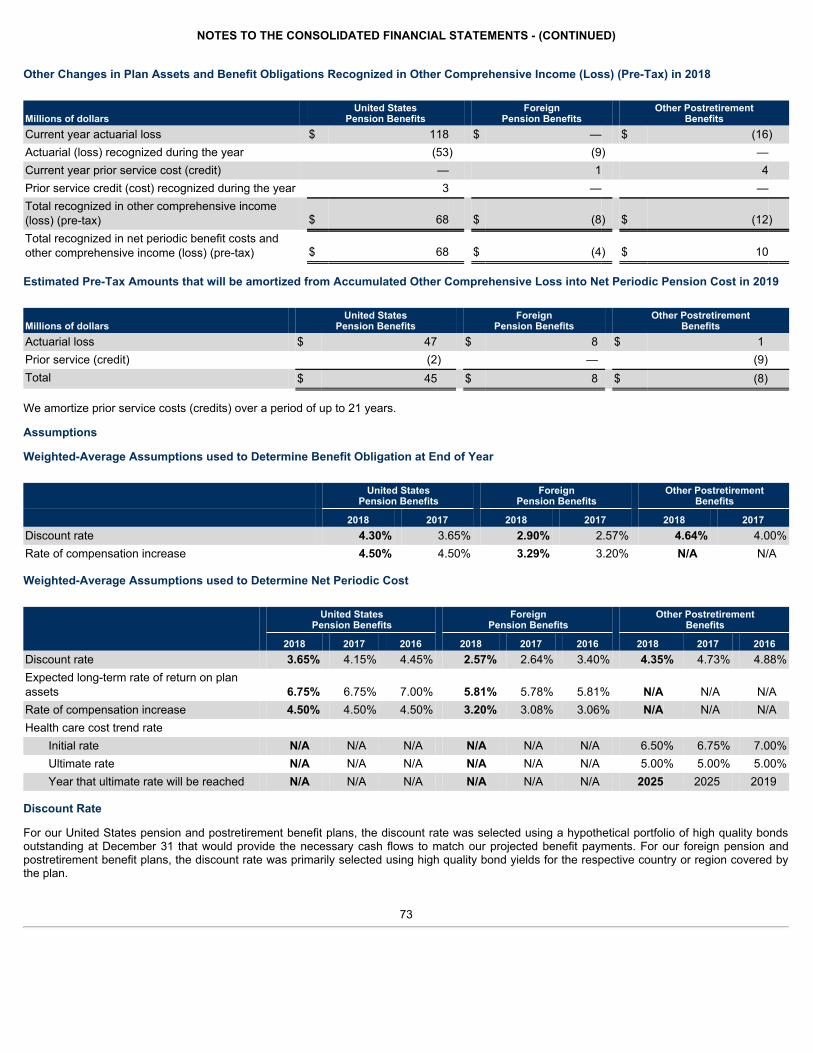
NOTES TO THE CONSOLIDATED FINANCIAL STATEMENTS - (CONTINUED)
Other Changes in Plan Assets and Benefit Obligations Recognized in Other Comprehensive Income (Loss) (Pre-Tax) in 2018
Millions of dollars United States
Pension Benefits Foreign
Pension Benefits Other Postretirement
BenefitsCurrent year actuarial loss $ 118 $ — $ (16)Actuarial (loss) recognized during the year (53) (9) —Current year prior service cost (credit) — 1 4Prior service credit (cost) recognized during the year 3 — —Total recognized in other comprehensive income(loss) (pre-tax) $ 68 $ (8) $ (12)Total recognized in net periodic benefit costs andother comprehensive income (loss) (pre-tax) $ 68 $ (4) $ 10
Estimated Pre-Tax Amounts that will be amortized from Accumulated Other Comprehensive Loss into Net Periodic Pension Cost in 2019
Millions of dollars United States
Pension Benefits Foreign
Pension Benefits Other Postretirement
BenefitsActuarial loss $ 47 $ 8 $ 1Prior service (credit) (2) — (9)Total $ 45 $ 8 $ (8)
We amortize prior service costs (credits) over a period of up to 21 years.
Assumptions
Weighted-Average Assumptions used to Determine Benefit Obligation at End of Year
United States
Pension Benefits Foreign
Pension Benefits Other Postretirement
Benefits
2018 2017 2018 2017 2018 2017Discount rate 4.30% 3.65% 2.90% 2.57% 4.64% 4.00%Rate of compensation increase 4.50% 4.50% 3.29% 3.20% N/A N/A
Weighted-Average Assumptions used to Determine Net Periodic Cost
United States
Pension Benefits Foreign
Pension Benefits Other Postretirement
Benefits
2018 2017 2016 2018 2017 2016 2018 2017 2016Discount rate 3.65% 4.15% 4.45% 2.57% 2.64% 3.40% 4.35% 4.73% 4.88%Expected long-term rate of return on planassets 6.75% 6.75% 7.00% 5.81% 5.78% 5.81% N/A N/A N/ARate of compensation increase 4.50% 4.50% 4.50% 3.20% 3.08% 3.06% N/A N/A N/AHealth care cost trend rate
Initial rate N/A N/A N/A N/A N/A N/A 6.50% 6.75% 7.00%Ultimate rate N/A N/A N/A N/A N/A N/A 5.00% 5.00% 5.00%Year that ultimate rate will be reached N/A N/A N/A N/A N/A N/A 2025 2025 2019
Discount Rate
For our United States pension and postretirement benefit plans, the discount rate was selected using a hypothetical portfolio of high quality bondsoutstanding at December 31 that would provide the necessary cash flows to match our projected benefit payments. For our foreign pension andpostretirement benefit plans, the discount rate was primarily selected using high quality bond yields for the respective country or region covered bythe plan.
73
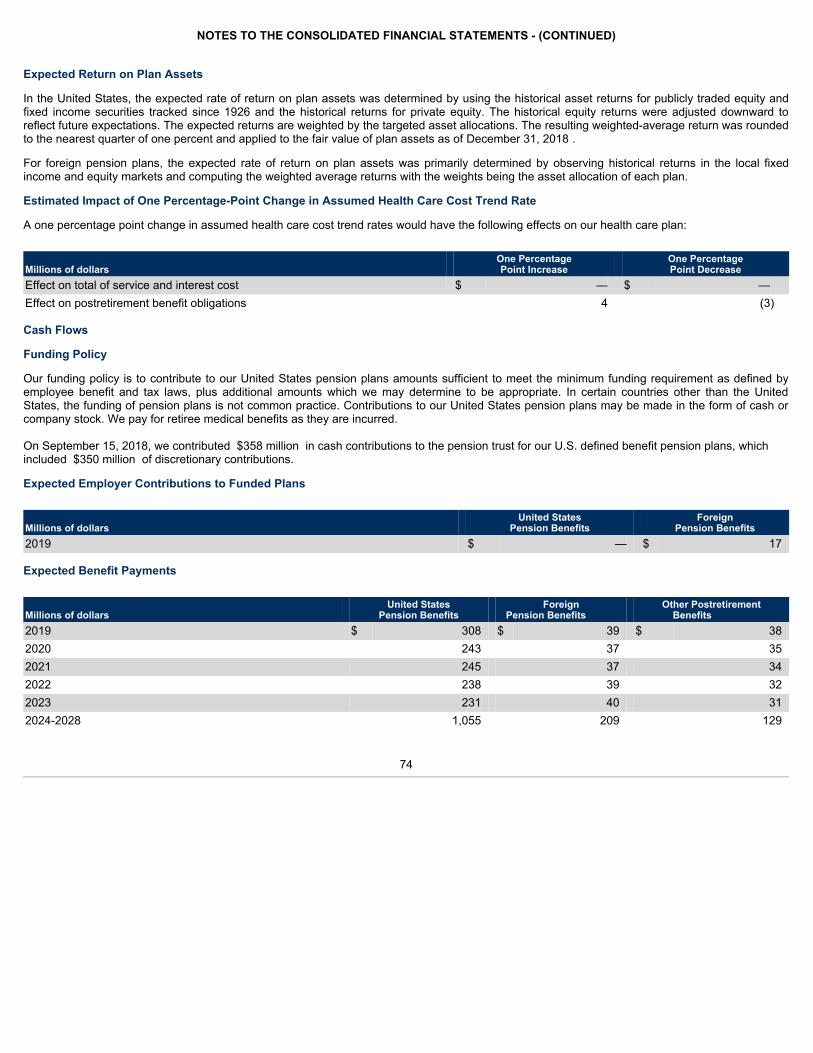
NOTES TO THE CONSOLIDATED FINANCIAL STATEMENTS - (CONTINUED)
Expected Return on Plan Assets
In the United States, the expected rate of return on plan assets was determined by using the historical asset returns for publicly traded equity andfixed income securities tracked since 1926 and the historical returns for private equity. The historical equity returns were adjusted downward toreflect future expectations. The expected returns are weighted by the targeted asset allocations. The resulting weighted-average return was roundedto the nearest quarter of one percent and applied to the fair value of plan assets as of December 31, 2018 .
For foreign pension plans, the expected rate of return on plan assets was primarily determined by observing historical returns in the local fixedincome and equity markets and computing the weighted average returns with the weights being the asset allocation of each plan.
Estimated Impact of One Percentage-Point Change in Assumed Health Care Cost Trend Rate
A one percentage point change in assumed health care cost trend rates would have the following effects on our health care plan:
Millions of dollars One PercentagePoint Increase
One PercentagePoint Decrease
Effect on total of service and interest cost $ — $ —Effect on postretirement benefit obligations 4 (3)
Cash Flows
Funding Policy
Our funding policy is to contribute to our United States pension plans amounts sufficient to meet the minimum funding requirement as defined byemployee benefit and tax laws, plus additional amounts which we may determine to be appropriate. In certain countries other than the UnitedStates, the funding of pension plans is not common practice. Contributions to our United States pension plans may be made in the form of cash orcompany stock. We pay for retiree medical benefits as they are incurred.
On September 15, 2018, we contributed $358 million in cash contributions to the pension trust for our U.S. defined benefit pension plans, whichincluded $350 million of discretionary contributions.
Expected Employer Contributions to Funded Plans
Millions of dollars United States
Pension Benefits Foreign
Pension Benefits2019 $ — $ 17
Expected Benefit Payments
Millions of dollars United States
Pension Benefits Foreign
Pension Benefits Other Postretirement
Benefits 2019 $ 308 $ 39 $ 382020 243 37 352021 245 37 342022 238 39 322023 231 40 312024-2028 1,055 209 129
74
NOTES TO THE CONSOLIDATED FINANCIAL STATEMENTS - (CONTINUED)
Plan Assets
Our overall investment strategy is to achieve an appropriate mix of investments for long-term growth and for near-term benefit payments with a widediversification of asset types, fund strategies, and investment fund managers. The target allocation for plan assets is generally 35% equity and 65%fixed income (with variance based on the plan's funded status), with exceptions for foreign pension plans. For our U.S. plans, the target allocation forequity securities is approximately 50% allocated to United States large-cap, 25% to international equity, 13% to United States mid and small-capcompanies and 12% in venture capital. The target allocation for fixed income is allocated with 75% to corporate bonds and 25% to United Statestreasury and other government securities. The fixed income securities duration is intended to match that of our United States pension liabilities.
Plan assets are reported at fair value based on an exit price, representing the amount that would be received to sell an asset in an orderlytransaction between market participants. As such, fair value is a market-based measurement that should be determined based on assumptions thatmarket participants would use in pricing an asset. As a basis for considering such assumptions, a three-tiered fair value hierarchy is established,which prioritizes the inputs used in measuring fair value as follows: (Level 1) observable inputs such as quoted prices in active markets; (Level 2)inputs, other than the quoted prices in active markets that are observable, either directly or indirectly; and (Level 3) unobservable inputs in whichthere is little or no market data, which require the reporting entity to develop its own assumptions. Certain investments are valued based on netasset value (NAV), which approximates fair value. Such basis is determined by referencing the respective fund's underlying assets. There are nounfunded commitments or other restrictions associated with these investments. We manage the process and approve the results of a third-partypricing service to value the majority of our securities and to determine the appropriate level in the fair value hierarchy.
75
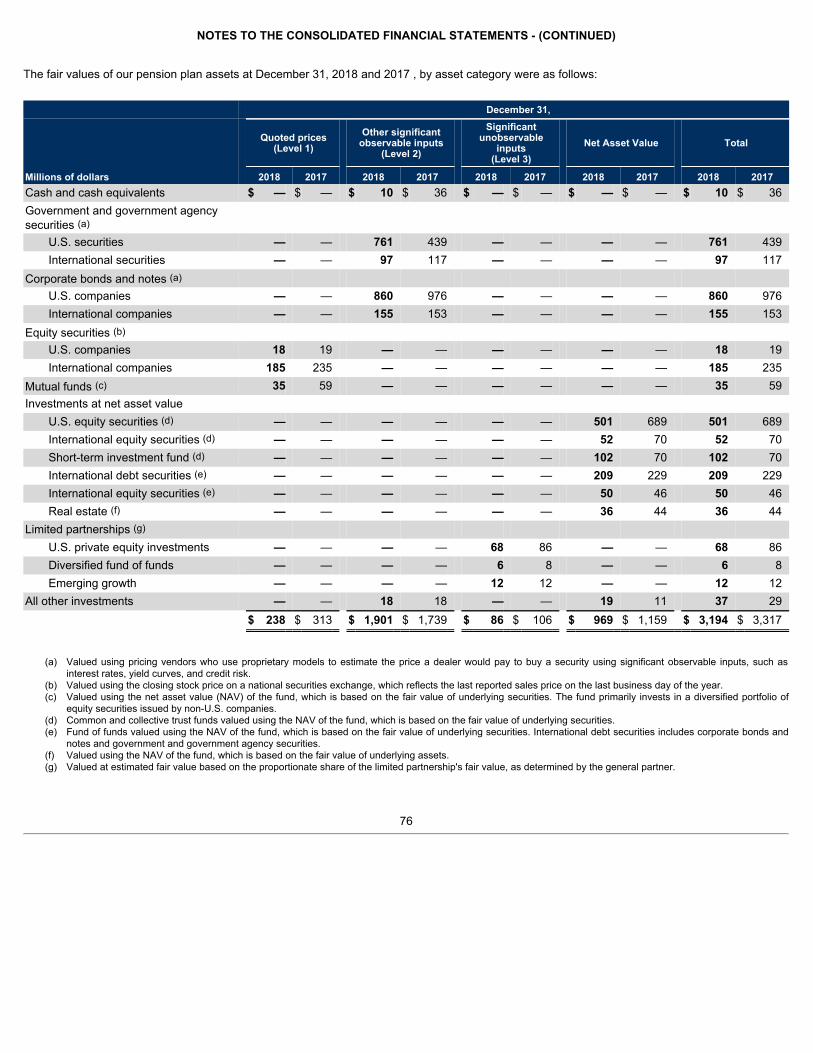
NOTES TO THE CONSOLIDATED FINANCIAL STATEMENTS - (CONTINUED)
The fair values of our pension plan assets at December 31, 2018 and 2017 , by asset category were as follows:
December 31,
Quoted prices(Level 1)
Other significantobservable inputs
(Level 2)
Significantunobservable
inputs(Level 3)
Net Asset Value
Total
Millions of dollars 2018 2017 2018 2017 2018 2017 2018 2017 2018 2017Cash and cash equivalents $ — $ — $ 10 $ 36 $ — $ — $ — $ — $ 10 $ 36Government and government agencysecurities (a)
U.S. securities — — 761 439 — — — — 761 439International securities — — 97 117 — — — — 97 117
Corporate bonds and notes (a) U.S. companies — — 860 976 — — — — 860 976International companies — — 155 153 — — — — 155 153
Equity securities (b) U.S. companies 18 19 — — — — — — 18 19International companies 185 235 — — — — — — 185 235
Mutual funds (c) 35 59 — — — — — — 35 59Investments at net asset value
U.S. equity securities (d) — — — — — — 501 689 501 689International equity securities (d) — — — — — — 52 70 52 70Short-term investment fund (d) — — — — — — 102 70 102 70International debt securities (e) — — — — — — 209 229 209 229International equity securities (e) — — — — — — 50 46 50 46Real estate (f) — — — — — — 36 44 36 44
Limited partnerships (g) U.S. private equity investments — — — — 68 86 — — 68 86Diversified fund of funds — — — — 6 8 — — 6 8Emerging growth — — — — 12 12 — — 12 12
All other investments — — 18 18 — — 19 11 37 29 $ 238 $ 313 $ 1,901 $ 1,739 $ 86 $ 106 $ 969 $ 1,159 $ 3,194 $ 3,317
(a) Valued using pricing vendors who use proprietary models to estimate the price a dealer would pay to buy a security using significant observable inputs, such asinterest rates, yield curves, and credit risk.
(b) Valued using the closing stock price on a national securities exchange, which reflects the last reported sales price on the last business day of the year.(c) Valued using the net asset value (NAV) of the fund, which is based on the fair value of underlying securities. The fund primarily invests in a diversified portfolio of
equity securities issued by non-U.S. companies.(d) Common and collective trust funds valued using the NAV of the fund, which is based on the fair value of underlying securities.(e) Fund of funds valued using the NAV of the fund, which is based on the fair value of underlying securities. International debt securities includes corporate bonds and
notes and government and government agency securities.(f) Valued using the NAV of the fund, which is based on the fair value of underlying assets.(g) Valued at estimated fair value based on the proportionate share of the limited partnership's fair value, as determined by the general partner.
76
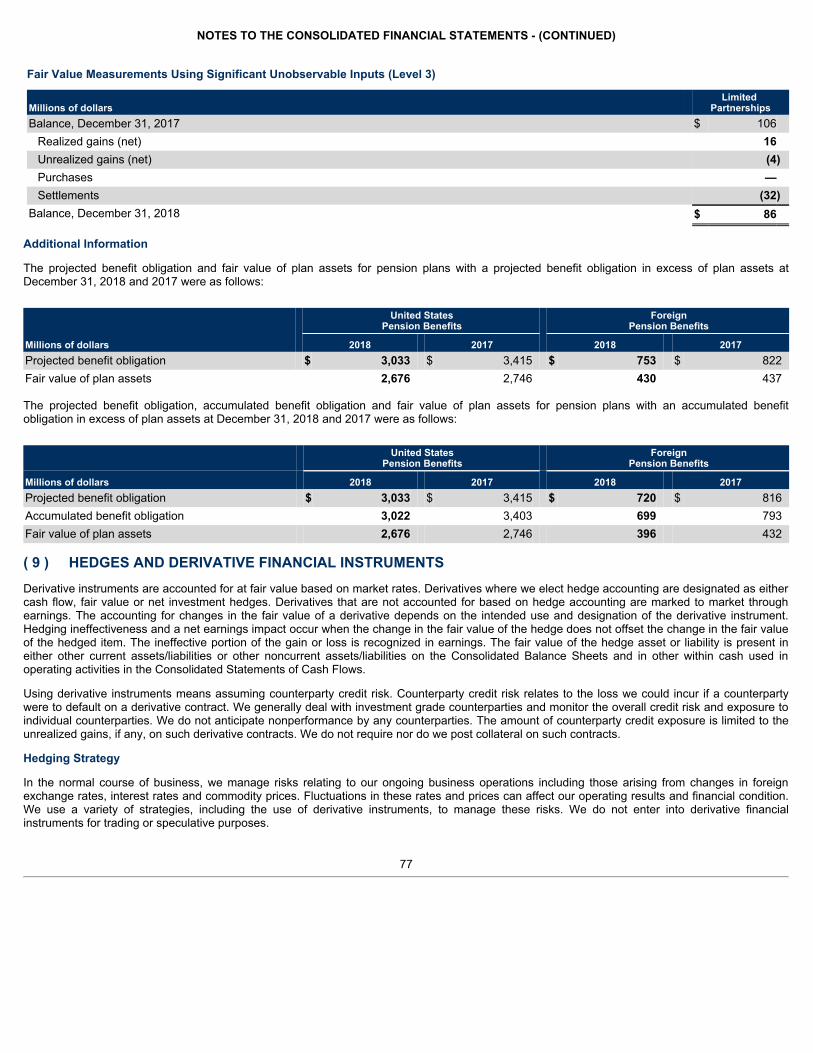
NOTES TO THE CONSOLIDATED FINANCIAL STATEMENTS - (CONTINUED)
Fair Value Measurements Using Significant Unobservable Inputs (Level 3)
Millions of dollars Limited
PartnershipsBalance, December 31, 2017 $ 106
Realized gains (net) 16Unrealized gains (net) (4)Purchases —Settlements (32)
Balance, December 31, 2018 $ 86
Additional Information
The projected benefit obligation and fair value of plan assets for pension plans with a projected benefit obligation in excess of plan assets atDecember 31, 2018 and 2017 were as follows:
United States
Pension Benefits Foreign
Pension Benefits
Millions of dollars 2018 2017 2018 2017Projected benefit obligation $ 3,033 $ 3,415 $ 753 $ 822Fair value of plan assets 2,676 2,746 430 437
The projected benefit obligation, accumulated benefit obligation and fair value of plan assets for pension plans with an accumulated benefitobligation in excess of plan assets at December 31, 2018 and 2017 were as follows:
United States
Pension Benefits Foreign
Pension Benefits
Millions of dollars 2018 2017 2018 2017Projected benefit obligation $ 3,033 $ 3,415 $ 720 $ 816Accumulated benefit obligation 3,022 3,403 699 793Fair value of plan assets 2,676 2,746 396 432
( 9 ) HEDGES AND DERIVATIVE FINANCIAL INSTRUMENTSDerivative instruments are accounted for at fair value based on market rates. Derivatives where we elect hedge accounting are designated as eithercash flow, fair value or net investment hedges. Derivatives that are not accounted for based on hedge accounting are marked to market throughearnings. The accounting for changes in the fair value of a derivative depends on the intended use and designation of the derivative instrument.Hedging ineffectiveness and a net earnings impact occur when the change in the fair value of the hedge does not offset the change in the fair valueof the hedged item. The ineffective portion of the gain or loss is recognized in earnings. The fair value of the hedge asset or liability is present ineither other current assets/liabilities or other noncurrent assets/liabilities on the Consolidated Balance Sheets and in other within cash used inoperating activities in the Consolidated Statements of Cash Flows.
Using derivative instruments means assuming counterparty credit risk. Counterparty credit risk relates to the loss we could incur if a counterpartywere to default on a derivative contract. We generally deal with investment grade counterparties and monitor the overall credit risk and exposure toindividual counterparties. We do not anticipate nonperformance by any counterparties. The amount of counterparty credit exposure is limited to theunrealized gains, if any, on such derivative contracts. We do not require nor do we post collateral on such contracts.
Hedging Strategy
In the normal course of business, we manage risks relating to our ongoing business operations including those arising from changes in foreignexchange rates, interest rates and commodity prices. Fluctuations in these rates and prices can affect our operating results and financial condition.We use a variety of strategies, including the use of derivative instruments, to manage these risks. We do not enter into derivative financialinstruments for trading or speculative purposes.
77
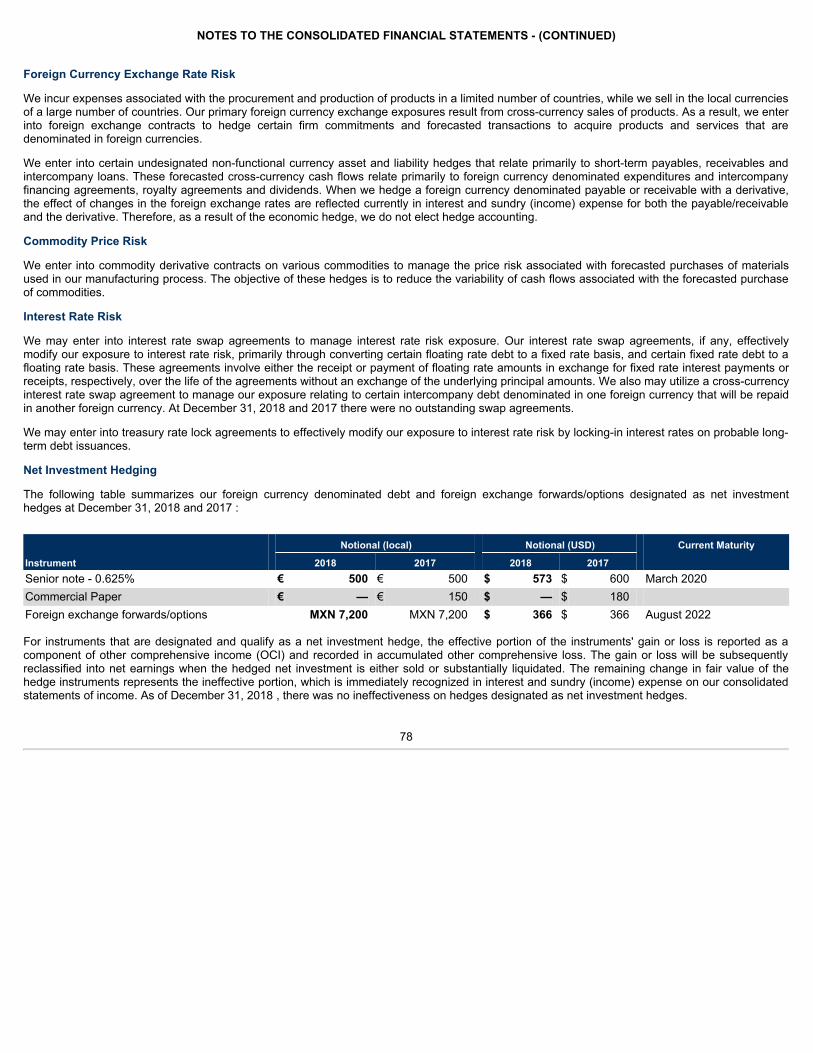
NOTES TO THE CONSOLIDATED FINANCIAL STATEMENTS - (CONTINUED)
Foreign Currency Exchange Rate Risk
We incur expenses associated with the procurement and production of products in a limited number of countries, while we sell in the local currenciesof a large number of countries. Our primary foreign currency exchange exposures result from cross-currency sales of products. As a result, we enterinto foreign exchange contracts to hedge certain firm commitments and forecasted transactions to acquire products and services that aredenominated in foreign currencies.
We enter into certain undesignated non-functional currency asset and liability hedges that relate primarily to short-term payables, receivables andintercompany loans. These forecasted cross-currency cash flows relate primarily to foreign currency denominated expenditures and intercompanyfinancing agreements, royalty agreements and dividends. When we hedge a foreign currency denominated payable or receivable with a derivative,the effect of changes in the foreign exchange rates are reflected currently in interest and sundry (income) expense for both the payable/receivableand the derivative. Therefore, as a result of the economic hedge, we do not elect hedge accounting.
Commodity Price Risk
We enter into commodity derivative contracts on various commodities to manage the price risk associated with forecasted purchases of materialsused in our manufacturing process. The objective of these hedges is to reduce the variability of cash flows associated with the forecasted purchaseof commodities.
Interest Rate Risk
We may enter into interest rate swap agreements to manage interest rate risk exposure. Our interest rate swap agreements, if any, effectivelymodify our exposure to interest rate risk, primarily through converting certain floating rate debt to a fixed rate basis, and certain fixed rate debt to afloating rate basis. These agreements involve either the receipt or payment of floating rate amounts in exchange for fixed rate interest payments orreceipts, respectively, over the life of the agreements without an exchange of the underlying principal amounts. We also may utilize a cross-currencyinterest rate swap agreement to manage our exposure relating to certain intercompany debt denominated in one foreign currency that will be repaidin another foreign currency. At December 31, 2018 and 2017 there were no outstanding swap agreements.
We may enter into treasury rate lock agreements to effectively modify our exposure to interest rate risk by locking-in interest rates on probable long-term debt issuances.
Net Investment Hedging
The following table summarizes our foreign currency denominated debt and foreign exchange forwards/options designated as net investmenthedges at December 31, 2018 and 2017 :
Notional (local) Notional (USD) Current Maturity
Instrument 2018 2017 2018 2017 Senior note - 0.625% € 500 € 500 $ 573 $ 600 March 2020Commercial Paper € — € 150 $ — $ 180 Foreign exchange forwards/options MXN 7,200 MXN 7,200 $ 366 $ 366 August 2022
For instruments that are designated and qualify as a net investment hedge, the effective portion of the instruments' gain or loss is reported as acomponent of other comprehensive income (OCI) and recorded in accumulated other comprehensive loss. The gain or loss will be subsequentlyreclassified into net earnings when the hedged net investment is either sold or substantially liquidated. The remaining change in fair value of thehedge instruments represents the ineffective portion, which is immediately recognized in interest and sundry (income) expense on our consolidatedstatements of income. As of December 31, 2018 , there was no ineffectiveness on hedges designated as net investment hedges.
78
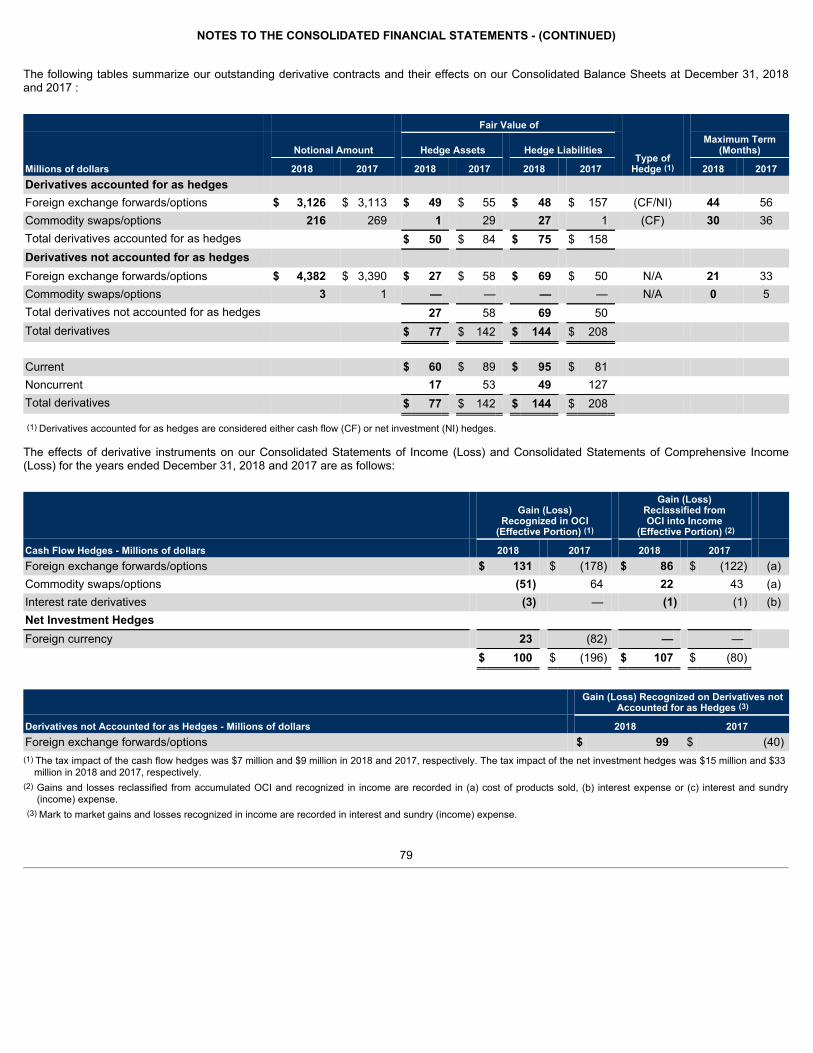
NOTES TO THE CONSOLIDATED FINANCIAL STATEMENTS - (CONTINUED)
The following tables summarize our outstanding derivative contracts and their effects on our Consolidated Balance Sheets at December 31, 2018and 2017 :
Fair Value of
Type ofHedge (1)
Notional Amount Hedge Assets Hedge Liabilities Maximum Term
(Months)
Millions of dollars 2018 2017 2018 2017 2018 2017 2018 2017Derivatives accounted for as hedges Foreign exchange forwards/options $ 3,126 $ 3,113 $ 49 $ 55 $ 48 $ 157 (CF/NI) 44 56Commodity swaps/options 216 269 1 29 27 1 (CF) 30 36Total derivatives accounted for as hedges $ 50 $ 84 $ 75 $ 158 Derivatives not accounted for as hedges Foreign exchange forwards/options $ 4,382 $ 3,390 $ 27 $ 58 $ 69 $ 50 N/A 21 33Commodity swaps/options 3 1 — — — — N/A 0 5Total derivatives not accounted for as hedges 27 58 69 50 Total derivatives $ 77 $ 142 $ 144 $ 208
Current $ 60 $ 89 $ 95 $ 81 Noncurrent 17 53 49 127 Total derivatives $ 77 $ 142 $ 144 $ 208
(1) Derivatives accounted for as hedges are considered either cash flow (CF) or net investment (NI) hedges.
The effects of derivative instruments on our Consolidated Statements of Income (Loss) and Consolidated Statements of Comprehensive Income(Loss) for the years ended December 31, 2018 and 2017 are as follows:
Gain (Loss)Recognized in OCI
(Effective Portion) (1)
Gain (Loss) Reclassified from OCI into Income
(Effective Portion) (2)
Cash Flow Hedges - Millions of dollars 2018 2017 2018 2017 Foreign exchange forwards/options $ 131 $ (178) $ 86 $ (122) (a)Commodity swaps/options (51) 64 22 43 (a)Interest rate derivatives (3) — (1) (1) (b)Net Investment Hedges Foreign currency 23 (82) — —
$ 100 $ (196) $ 107 $ (80)
Gain (Loss) Recognized on Derivatives not
Accounted for as Hedges (3)
Derivatives not Accounted for as Hedges - Millions of dollars 2018 2017Foreign exchange forwards/options $ 99 $ (40)(1) The tax impact of the cash flow hedges was $7 million and $9 million in 2018 and 2017, respectively. The tax impact of the net investment hedges was $15 million and $33
million in 2018 and 2017, respectively.(2)
Gains and losses reclassified from accumulated OCI and recognized in income are recorded in (a) cost of products sold, (b) interest expense or (c) interest and sundry(income) expense.
(3) Mark to market gains and losses recognized in income are recorded in interest and sundry (income) expense.
79
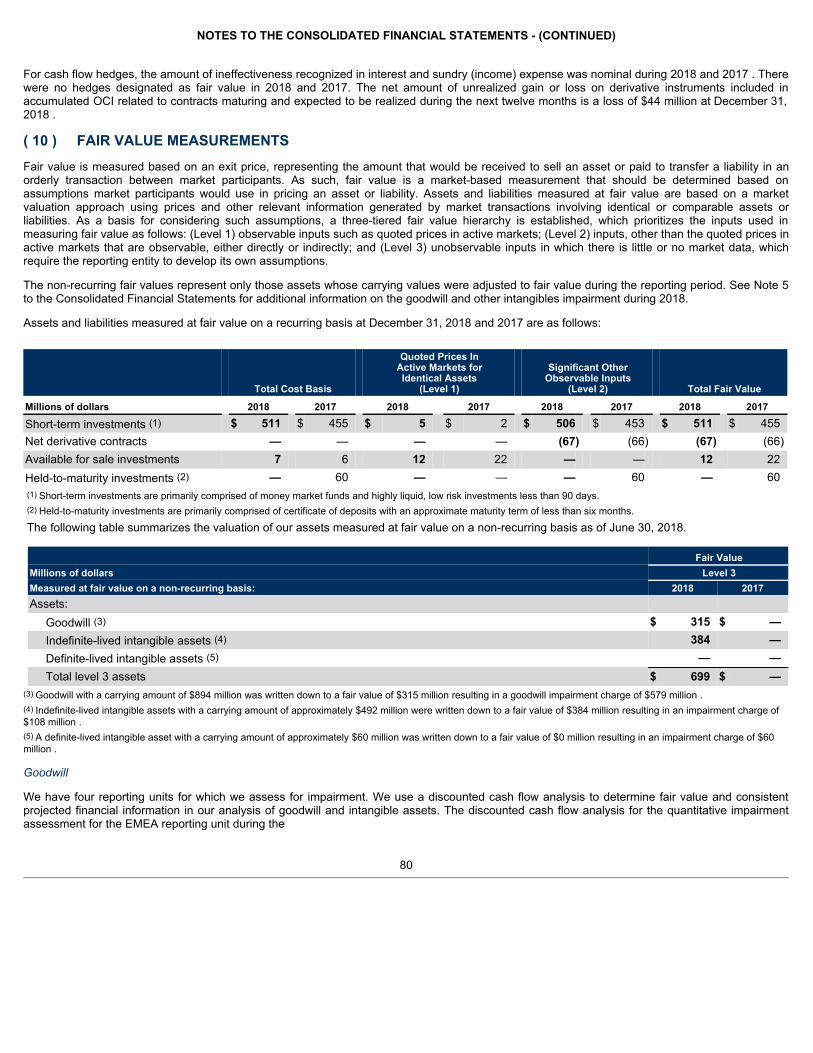
NOTES TO THE CONSOLIDATED FINANCIAL STATEMENTS - (CONTINUED)
For cash flow hedges, the amount of ineffectiveness recognized in interest and sundry (income) expense was nominal during 2018 and 2017 . Therewere no hedges designated as fair value in 2018 and 2017. The net amount of unrealized gain or loss on derivative instruments included inaccumulated OCI related to contracts maturing and expected to be realized during the next twelve months is a loss of $44 million at December 31,2018 .
( 10 ) FAIR VALUE MEASUREMENTSFair value is measured based on an exit price, representing the amount that would be received to sell an asset or paid to transfer a liability in anorderly transaction between market participants. As such, fair value is a market-based measurement that should be determined based onassumptions market participants would use in pricing an asset or liability. Assets and liabilities measured at fair value are based on a marketvaluation approach using prices and other relevant information generated by market transactions involving identical or comparable assets orliabilities. As a basis for considering such assumptions, a three-tiered fair value hierarchy is established, which prioritizes the inputs used inmeasuring fair value as follows: (Level 1) observable inputs such as quoted prices in active markets; (Level 2) inputs, other than the quoted prices inactive markets that are observable, either directly or indirectly; and (Level 3) unobservable inputs in which there is little or no market data, whichrequire the reporting entity to develop its own assumptions.
The non-recurring fair values represent only those assets whose carrying values were adjusted to fair value during the reporting period. See Note 5to the Consolidated Financial Statements for additional information on the goodwill and other intangibles impairment during 2018.
Assets and liabilities measured at fair value on a recurring basis at December 31, 2018 and 2017 are as follows:
Total Cost Basis
Quoted Prices InActive Markets forIdentical Assets
(Level 1)
Significant OtherObservable Inputs
(Level 2) Total Fair Value
Millions of dollars 2018 2017 2018 2017 2018 2017 2018 2017
Short-term investments (1) $ 511 $ 455 $ 5 $ 2 $ 506 $ 453 $ 511 $ 455Net derivative contracts — — — — (67) (66) (67) (66)Available for sale investments 7 6 12 22 — — 12 22Held-to-maturity investments (2) — 60 — — — 60 — 60(1) Short-term investments are primarily comprised of money market funds and highly liquid, low risk investments less than 90 days.(2) Held-to-maturity investments are primarily comprised of certificate of deposits with an approximate maturity term of less than six months.
The following table summarizes the valuation of our assets measured at fair value on a non-recurring basis as of June 30, 2018.
Fair ValueMillions of dollars Level 3Measured at fair value on a non-recurring basis: 2018 2017Assets:
Goodwill (3) $ 315 $ —Indefinite-lived intangible assets (4) 384 —Definite-lived intangible assets (5) — —Total level 3 assets $ 699 $ —
(3) Goodwill with a carrying amount of $894 million was written down to a fair value of $315 million resulting in a goodwill impairment charge of $579 million .(4) Indefinite-lived intangible assets with a carrying amount of approximately $492 million were written down to a fair value of $384 million resulting in an impairment charge of$108 million .(5) A definite-lived intangible asset with a carrying amount of approximately $60 million was written down to a fair value of $0 million resulting in an impairment charge of $60million .
Goodwill
We have four reporting units for which we assess for impairment. We use a discounted cash flow analysis to determine fair value and consistentprojected financial information in our analysis of goodwill and intangible assets. The discounted cash flow analysis for the quantitative impairmentassessment for the EMEA reporting unit during the
80
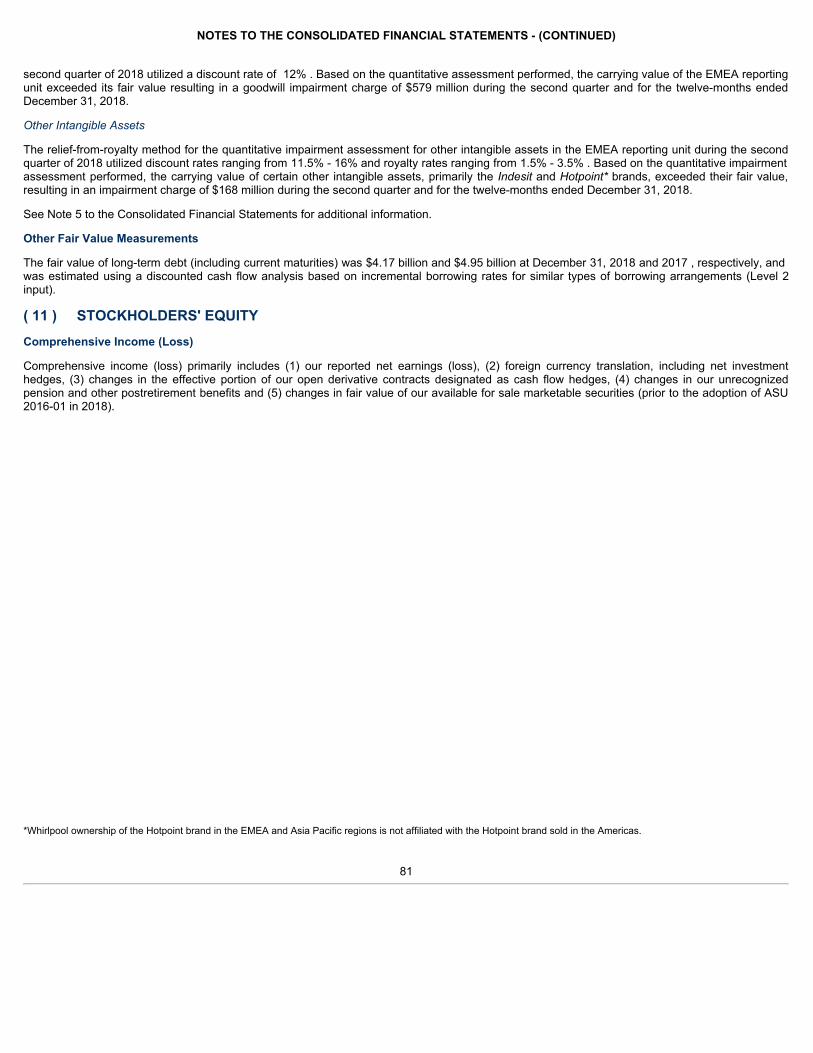
NOTES TO THE CONSOLIDATED FINANCIAL STATEMENTS - (CONTINUED)
second quarter of 2018 utilized a discount rate of 12% . Based on the quantitative assessment performed, the carrying value of the EMEA reportingunit exceeded its fair value resulting in a goodwill impairment charge of $579 million during the second quarter and for the twelve-months endedDecember 31, 2018.
OtherIntangibleAssets
The relief-from-royalty method for the quantitative impairment assessment for other intangible assets in the EMEA reporting unit during the secondquarter of 2018 utilized discount rates ranging from 11.5% - 16% and royalty rates ranging from 1.5% - 3.5% . Based on the quantitative impairmentassessment performed, the carrying value of certain other intangible assets, primarily the Indesitand Hotpoint*brands, exceeded their fair value,resulting in an impairment charge of $168 million during the second quarter and for the twelve-months ended December 31, 2018.
See Note 5 to the Consolidated Financial Statements for additional information.
Other Fair Value Measurements
The fair value of long-term debt (including current maturities) was $4.17 billion and $4.95 billion at December 31, 2018 and 2017 , respectively, andwas estimated using a discounted cash flow analysis based on incremental borrowing rates for similar types of borrowing arrangements (Level 2input).
( 11 ) STOCKHOLDERS' EQUITYComprehensive Income (Loss)
Comprehensive income (loss) primarily includes (1) our reported net earnings (loss), (2) foreign currency translation, including net investmenthedges, (3) changes in the effective portion of our open derivative contracts designated as cash flow hedges, (4) changes in our unrecognizedpension and other postretirement benefits and (5) changes in fair value of our available for sale marketable securities (prior to the adoption of ASU2016-01 in 2018).
*Whirlpool ownership of the Hotpoint brand in the EMEA and Asia Pacific regions is not affiliated with the Hotpoint brand sold in the Americas.
81
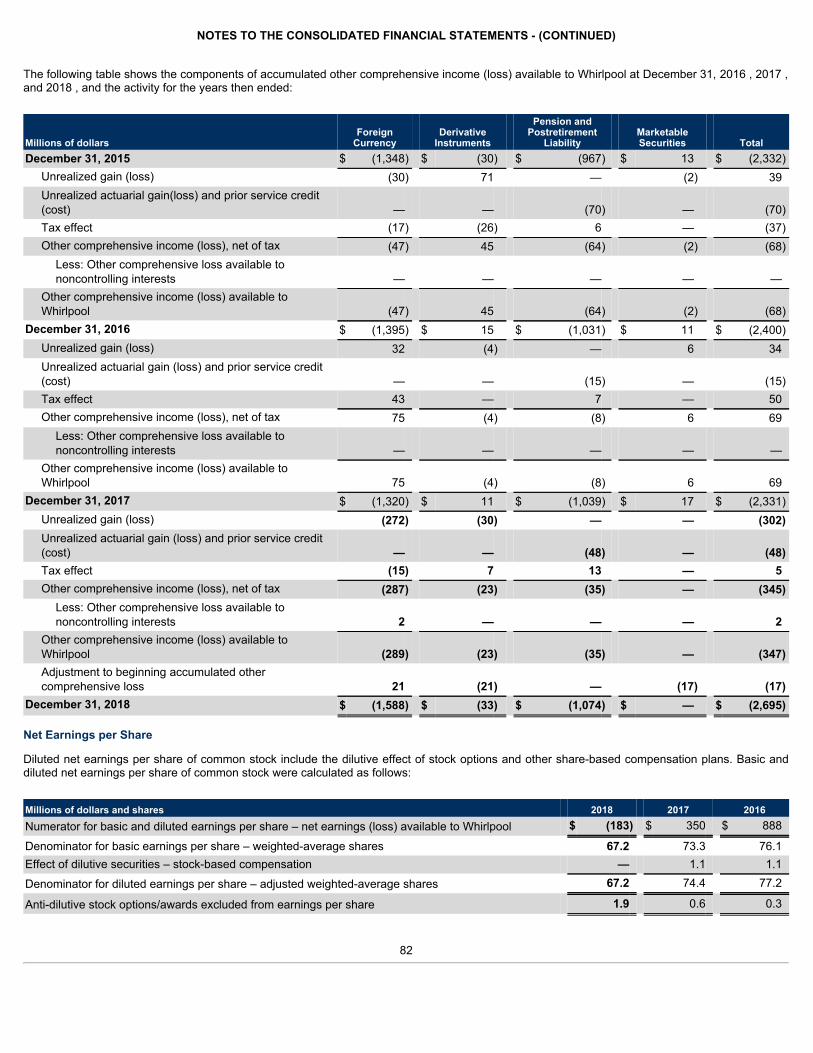
NOTES TO THE CONSOLIDATED FINANCIAL STATEMENTS - (CONTINUED)
The following table shows the components of accumulated other comprehensive income (loss) available to Whirlpool at December 31, 2016 , 2017 ,and 2018 , and the activity for the years then ended:
Millions of dollarsForeign
Currency Derivative
Instruments
Pension andPostretirement
Liability MarketableSecurities Total
December 31, 2015 $ (1,348) $ (30) $ (967) $ 13 $ (2,332)Unrealized gain (loss) (30) 71 — (2) 39Unrealized actuarial gain(loss) and prior service credit(cost) — — (70) — (70)Tax effect (17) (26) 6 — (37)Other comprehensive income (loss), net of tax (47) 45 (64) (2) (68)
Less: Other comprehensive loss available tononcontrolling interests — — — — —
Other comprehensive income (loss) available toWhirlpool (47) 45 (64) (2) (68)
December 31, 2016 $ (1,395) $ 15 $ (1,031) $ 11 $ (2,400)Unrealized gain (loss) 32 (4) — 6 34Unrealized actuarial gain (loss) and prior service credit(cost) — — (15) — (15)Tax effect 43 — 7 — 50Other comprehensive income (loss), net of tax 75 (4) (8) 6 69
Less: Other comprehensive loss available tononcontrolling interests — — — — —
Other comprehensive income (loss) available toWhirlpool 75 (4) (8) 6 69
December 31, 2017 $ (1,320) $ 11 $ (1,039) $ 17 $ (2,331)Unrealized gain (loss) (272) (30) — — (302)Unrealized actuarial gain (loss) and prior service credit(cost) — — (48) — (48)Tax effect (15) 7 13 — 5Other comprehensive income (loss), net of tax (287) (23) (35) — (345)
Less: Other comprehensive loss available tononcontrolling interests 2 — — — 2
Other comprehensive income (loss) available toWhirlpool (289) (23) (35) — (347)Adjustment to beginning accumulated othercomprehensive loss 21 (21) — (17) (17)
December 31, 2018 $ (1,588) $ (33) $ (1,074) $ — $ (2,695)
Net Earnings per Share
Diluted net earnings per share of common stock include the dilutive effect of stock options and other share-based compensation plans. Basic anddiluted net earnings per share of common stock were calculated as follows:
Millions of dollars and shares 2018 2017 2016Numerator for basic and diluted earnings per share – net earnings (loss) available to Whirlpool $ (183) $ 350 $ 888
Denominator for basic earnings per share – weighted-average shares 67.2 73.3 76.1Effect of dilutive securities – stock-based compensation — 1.1 1.1Denominator for diluted earnings per share – adjusted weighted-average shares 67.2 74.4 77.2
Anti-dilutive stock options/awards excluded from earnings per share 1.9 0.6 0.3
82
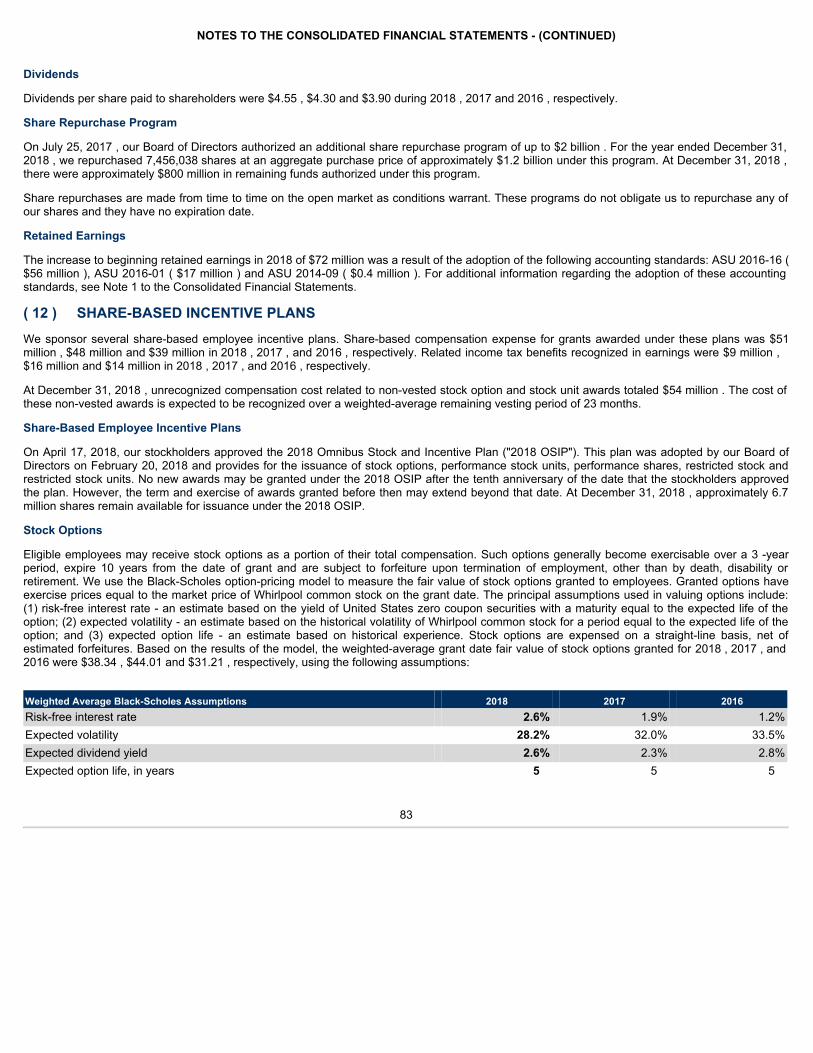
NOTES TO THE CONSOLIDATED FINANCIAL STATEMENTS - (CONTINUED)
Dividends
Dividends per share paid to shareholders were $4.55 , $4.30 and $3.90 during 2018 , 2017 and 2016 , respectively.
Share Repurchase Program
On July 25, 2017 , our Board of Directors authorized an additional share repurchase program of up to $2 billion . For the year ended December 31,2018 , we repurchased 7,456,038 shares at an aggregate purchase price of approximately $1.2 billion under this program. At December 31, 2018 ,there were approximately $800 million in remaining funds authorized under this program.
Share repurchases are made from time to time on the open market as conditions warrant. These programs do not obligate us to repurchase any ofour shares and they have no expiration date.
Retained Earnings
The increase to beginning retained earnings in 2018 of $72 million was a result of the adoption of the following accounting standards: ASU 2016-16 ($56 million ), ASU 2016-01 ( $17 million ) and ASU 2014-09 ( $0.4 million ). For additional information regarding the adoption of these accountingstandards, see Note 1 to the Consolidated Financial Statements.
( 12 ) SHARE-BASED INCENTIVE PLANSWe sponsor several share-based employee incentive plans. Share-based compensation expense for grants awarded under these plans was $51million , $48 million and $39 million in 2018 , 2017 , and 2016 , respectively. Related income tax benefits recognized in earnings were $9 million ,$16 million and $14 million in 2018 , 2017 , and 2016 , respectively.
At December 31, 2018 , unrecognized compensation cost related to non-vested stock option and stock unit awards totaled $54 million . The cost ofthese non-vested awards is expected to be recognized over a weighted-average remaining vesting period of 23 months.
Share-Based Employee Incentive Plans
On April 17, 2018, our stockholders approved the 2018 Omnibus Stock and Incentive Plan ("2018 OSIP"). This plan was adopted by our Board ofDirectors on February 20, 2018 and provides for the issuance of stock options, performance stock units, performance shares, restricted stock andrestricted stock units. No new awards may be granted under the 2018 OSIP after the tenth anniversary of the date that the stockholders approvedthe plan. However, the term and exercise of awards granted before then may extend beyond that date. At December 31, 2018 , approximately 6.7million shares remain available for issuance under the 2018 OSIP.
Stock Options
Eligible employees may receive stock options as a portion of their total compensation. Such options generally become exercisable over a 3 -yearperiod, expire 10 years from the date of grant and are subject to forfeiture upon termination of employment, other than by death, disability orretirement. We use the Black-Scholes option-pricing model to measure the fair value of stock options granted to employees. Granted options haveexercise prices equal to the market price of Whirlpool common stock on the grant date. The principal assumptions used in valuing options include:(1) risk-free interest rate - an estimate based on the yield of United States zero coupon securities with a maturity equal to the expected life of theoption; (2) expected volatility - an estimate based on the historical volatility of Whirlpool common stock for a period equal to the expected life of theoption; and (3) expected option life - an estimate based on historical experience. Stock options are expensed on a straight-line basis, net ofestimated forfeitures. Based on the results of the model, the weighted-average grant date fair value of stock options granted for 2018 , 2017 , and2016 were $38.34 , $44.01 and $31.21 , respectively, using the following assumptions:
Weighted Average Black-Scholes Assumptions 2018 2017 2016Risk-free interest rate 2.6% 1.9% 1.2%Expected volatility 28.2% 32.0% 33.5%Expected dividend yield 2.6% 2.3% 2.8%Expected option life, in years 5 5 5
83
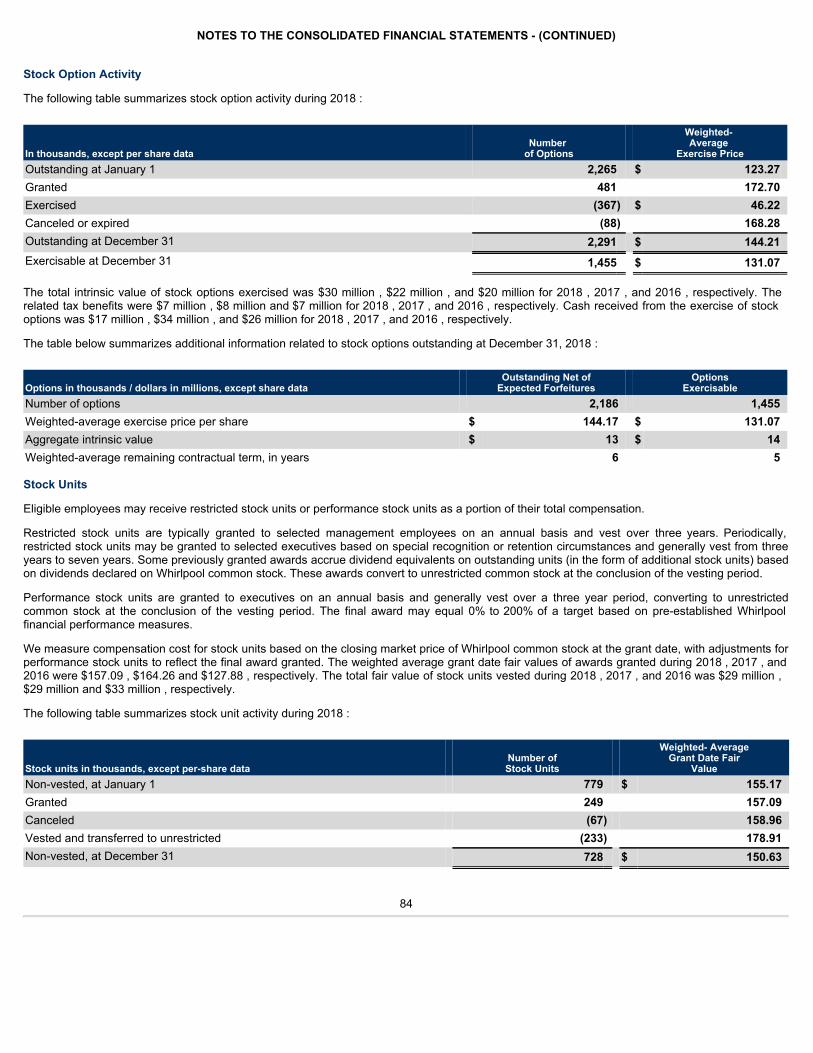
NOTES TO THE CONSOLIDATED FINANCIAL STATEMENTS - (CONTINUED)
Stock Option Activity
The following table summarizes stock option activity during 2018 :
In thousands, except per share data Number
of Options
Weighted- Average
Exercise PriceOutstanding at January 1 2,265 $ 123.27Granted 481 172.70Exercised (367) $ 46.22Canceled or expired (88) 168.28Outstanding at December 31 2,291 $ 144.21Exercisable at December 31 1,455 $ 131.07
The total intrinsic value of stock options exercised was $30 million , $22 million , and $20 million for 2018 , 2017 , and 2016 , respectively. Therelated tax benefits were $7 million , $8 million and $7 million for 2018 , 2017 , and 2016 , respectively. Cash received from the exercise of stockoptions was $17 million , $34 million , and $26 million for 2018 , 2017 , and 2016 , respectively.
The table below summarizes additional information related to stock options outstanding at December 31, 2018 :
Options in thousands / dollars in millions, except share data Outstanding Net of
Expected Forfeitures Options
ExercisableNumber of options 2,186 1,455Weighted-average exercise price per share $ 144.17 $ 131.07Aggregate intrinsic value $ 13 $ 14Weighted-average remaining contractual term, in years 6 5
Stock Units
Eligible employees may receive restricted stock units or performance stock units as a portion of their total compensation.
Restricted stock units are typically granted to selected management employees on an annual basis and vest over three years. Periodically,restricted stock units may be granted to selected executives based on special recognition or retention circumstances and generally vest from threeyears to seven years. Some previously granted awards accrue dividend equivalents on outstanding units (in the form of additional stock units) basedon dividends declared on Whirlpool common stock. These awards convert to unrestricted common stock at the conclusion of the vesting period.
Performance stock units are granted to executives on an annual basis and generally vest over a three year period, converting to unrestrictedcommon stock at the conclusion of the vesting period. The final award may equal 0% to 200% of a target based on pre-established Whirlpoolfinancial performance measures.
We measure compensation cost for stock units based on the closing market price of Whirlpool common stock at the grant date, with adjustments forperformance stock units to reflect the final award granted. The weighted average grant date fair values of awards granted during 2018 , 2017 , and2016 were $157.09 , $164.26 and $127.88 , respectively. The total fair value of stock units vested during 2018 , 2017 , and 2016 was $29 million ,$29 million and $33 million , respectively.
The following table summarizes stock unit activity during 2018 :
Stock units in thousands, except per-share data Number ofStock Units
Weighted- AverageGrant Date Fair
ValueNon-vested, at January 1 779 $ 155.17Granted 249 157.09Canceled (67) 158.96Vested and transferred to unrestricted (233) 178.91Non-vested, at December 31 728 $ 150.63
84
NOTES TO THE CONSOLIDATED FINANCIAL STATEMENTS - (CONTINUED)
Nonemployee Director Equity Awards
In 2018, each nonemployee director received an annual grant of Whirlpool common stock, with the number of shares issued to the directordetermined by dividing $130,000 by the closing price of Whirlpool common stock on the date of the annual meeting of our stockholders.Nonemployee directors receive a one-time grant of 1,000 shares of Whirlpool common stock made at the time they first join the Board.
( 13 ) RESTRUCTURING CHARGESWe periodically take action to improve operating efficiencies, typically in connection with business acquisitions or changes in the economicenvironment. Our footprint and headcount reductions and organizational integration actions relate to discrete, unique restructuring events, primarilyreflected in the following plans:
In the second quarter of 2015, we committed to a restructuring plan to integrate our Italian legacy operations with those of Indesit. The industrialrestructuring plan, which was approved by the relevant labor unions in July 2015 and signed by the Italian government in August 2015, provided forthe closure or repurposing of certain manufacturing facilities and headcount reductions at other facilities. In addition, the restructuring plan providedfor headcount reductions in the salaried employee workforce. We estimate that we will incur up to €179 million (approximately $205 million as ofDecember 31, 2018 ) in employee-related costs, €25 million (approximately $29 million as of December 31, 2018 ) in asset impairment costs and€37 million (approximately $42 million as of December 31, 2018 ) in other associated costs in connection with these actions. We expect theseactions will be complete in 2019. We estimate €209 million (approximately $240 million as of December 31, 2018 ) of the estimated €241 million(approximately $276 million as of December 31, 2018 ) total cost will result or has resulted in cash expenditures. As of December 31, 2018 , €10million (approximately $11 million ) remains to be expensed.
In January 2017 the Company and certain of its subsidiary companies began consultations with certain works councils and other regulatoryagencies in connection with the Company's proposal to restructure its EMEA dryer manufacturing operations. Company management authorized theinitiation of such consultations on December 30, 2016. These actions resulted in changing the operations at the Company's Yate, U.K. facility tofocus on manufacturing for U.K. consumer needs only; ending production in 2018 in Amiens, France; and concentrating the production of dryers fornon-U.K. consumer needs in Lodz, Poland. These actions were substantially complete in 2018 with approximately 500 positions being impacted.The Company estimates that it will incur up to approximately €59 million (approximately $68 million as of December 31, 2018 ) in employee-relatedcosts, approximately €11 million (approximately $13 million as of December 31, 2018 ) in asset impairment costs and approximately €10 million(approximately $11 million as of December 31, 2018 ) in other associated costs in connection with these actions. The Company estimates thatapproximately €69 million (approximately $79 million as of December 31, 2018 ) of the estimated €80 million (approximately $92 million as ofDecember 31, 2018 ) total cost will result or has resulted in cash expenditures. As of December 31, 2018 , €3 million (approximately $4 million )remains to be expensed.
In the fourth quarter of 2017, the Company announced an initiative to reduce fixed overhead costs by $150 million , which was implemented in2018. This initiative primarily impacted our overhead costs, including salary headcount and third-party services. The restructuring actions pursuantto this initiative are complete.
In January 2018, we announced certain restructuring actions related to streamlining operations in our Embraco compressor business. Theseactions resulted in ceasing operations and ending production at Embraco's Riva Presso Chieri, Turin, Italy facility in 2018, and concentrating theassembly and manufacturing of compressors in Embraco's other manufacturing centers. The restructuring actions pursuant to these actions arecomplete.
In the fourth quarter of 2018, the Company announced actions in EMEA to reduce fixed overhead costs by $50 million . The initiatives primarilyinclude the exit from domestic sales operations (which does not include manufacturing operations) in Turkey and headcount reductions throughoutthe EMEA region. The Company estimates that it will incur up to €56 million (approximately $64 million as of December 31, 2018 ) in employee-related costs, approximately €6 million (approximately $7 million as of December 31, 2018 ) in asset impairment costs and approximately €11 million(approximately $13 million as of December 31, 2018 ) in other associated costs in connection with these actions. We expect these actions will besubstantially complete in 2019.
85
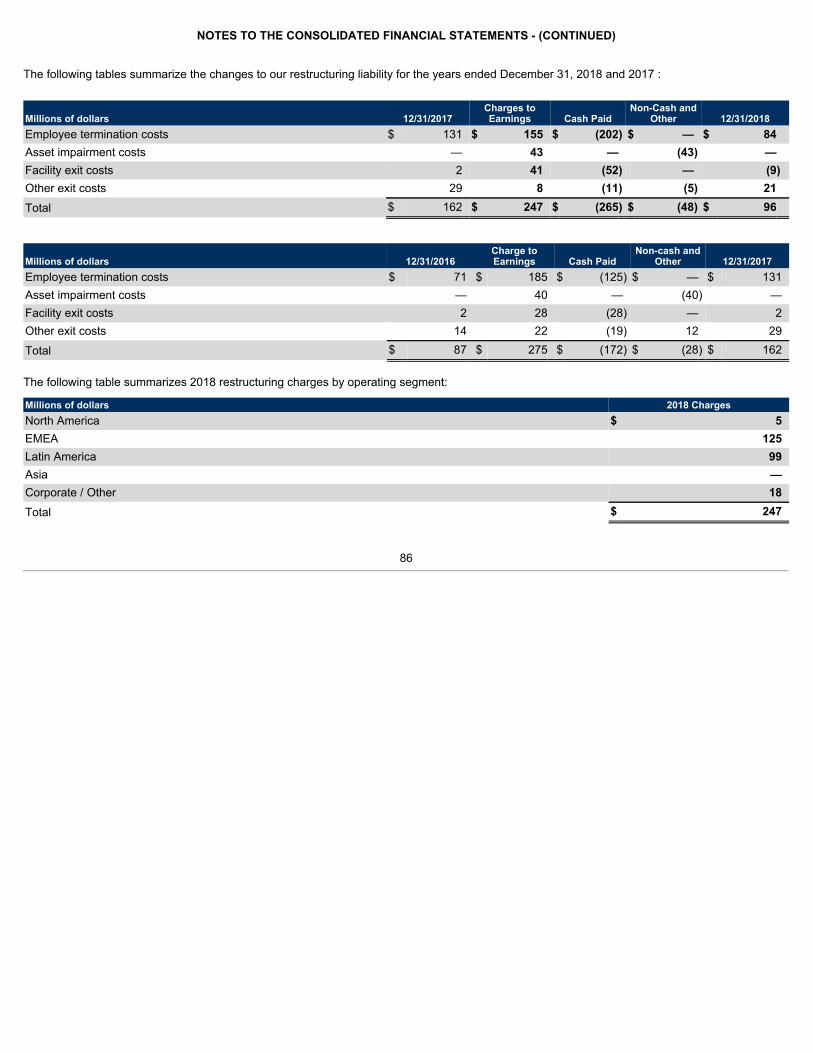
NOTES TO THE CONSOLIDATED FINANCIAL STATEMENTS - (CONTINUED)
The following tables summarize the changes to our restructuring liability for the years ended December 31, 2018 and 2017 :
Millions of dollars 12/31/2017Charges toEarnings Cash Paid
Non-Cash andOther 12/31/2018
Employee termination costs $ 131 $ 155 $ (202) $ — $ 84Asset impairment costs — 43 — (43) —Facility exit costs 2 41 (52) — (9)Other exit costs 29 8 (11) (5) 21Total $ 162 $ 247 $ (265) $ (48) $ 96
Millions of dollars 12/31/2016Charge toEarnings Cash Paid
Non-cash andOther 12/31/2017
Employee termination costs $ 71 $ 185 $ (125) $ — $ 131Asset impairment costs — 40 — (40) —Facility exit costs 2 28 (28) — 2Other exit costs 14 22 (19) 12 29Total $ 87 $ 275 $ (172) $ (28) $ 162
The following table summarizes 2018 restructuring charges by operating segment:
Millions of dollars 2018 ChargesNorth America $ 5EMEA 125Latin America 99Asia —Corporate / Other 18Total $ 247
86

NOTES TO THE CONSOLIDATED FINANCIAL STATEMENTS - (CONTINUED)
( 14 ) INCOME TAXESIncome tax expense was $138 million , $550 million , and $186 million in 2018 , 2017 and 2016 , respectively. The following table summarizes thedifference between an income tax benefit at the United States statutory rate of 21% in 2018, and 35% in 2017 and 2016, respectively, and theincome tax expense at effective worldwide tax rates for the respective periods:
Millions of dollars 2018 2017 2016Earnings (loss) before income taxes
United States $ 729 $ 671 $ 605Foreign (750) 216 509
Earnings (loss) before income taxes (21) 887 1,114 Income tax (benefit) expense computed at United States statutory rate (4) 310 390
U.S. government tax incentives (11) (13) (9)Foreign government tax incentives, including BEFIEX (21) (29) (11)Foreign tax rate differential (24) (14) (50)U.S. foreign tax credits (260) 17 (86)Valuation allowances 75 (68) (121)State and local taxes, net of federal tax benefit 23 29 20Foreign withholding taxes 24 41 36U.S. tax on foreign dividends and subpart F income 72 12 63Settlement of global tax audits 72 48 (40)U.S. Transition Tax 40 190 —Changes in enacted tax rates (54) 49 32Nondeductible goodwill 139 — —Nondeductible fines & penalties 30 — —Other items, net 37 (22) (38)
Income tax computed at effective worldwide tax rates $ 138 $ 550 $ 186
Current and Deferred Tax Provision
The following table summarizes our income tax (benefit) provision for 2018 , 2017 and 2016 :
2018 2017 2016
Millions of dollars Current Deferred Current Deferred Current DeferredUnited States $ (70) $ 120 $ 138 $ 386 $ 34 $ 120Foreign 182 (119) 213 (233) 167 (154)State and local 12 13 12 34 7 12 $ 124 $ 14 $ 363 $ 187 $ 208 $ (22)Total income tax expense $ 138 $ 550 $ 186
United States Government Tax Legislation
On December 22, 2017, H.R.1 (the “Tax Cuts and Jobs Act”) was signed into law. Significant provisions impacting Whirlpool's 2017 and 2018effective tax rate include the reduction in corporate tax rate from 35% to 21% effective in 2018, a one-time deemed repatriation (“Transition Tax”) onearnings of certain foreign subsidiaries that were previously tax deferred, and the creation of new taxes on certain foreign sourced earnings.
As of December 31, 2017, pursuant to the SEC guidance under SAB118, the Company made a reasonable estimate of the provisional effects of therate reduction on its existing deferred tax balances and the impact of the one-time Transition Tax. For the items for which the Company was able todetermine a reasonable estimate, it recognized the following provisional impacts. The reduction in corporate tax rate resulted in a one-time taxexpense in the amount of $49 million related to the revaluation of our U.S. net deferred tax asset. Transition Tax resulted in a one-time tax expensein the amount of $190 million . These amounts represented the Company's best estimate of the impact of the Tax Cuts and Jobs act, at that time.
87
NOTES TO THE CONSOLIDATED FINANCIAL STATEMENTS - (CONTINUED)
As of December 31, 2018, the Company has revised these estimated amounts and recognized an additional tax benefit in the amount of $54 millionon the difference between the 2017 U.S. enacted tax rate of 35%, and the 2018 enacted tax rate of 21%, primarily related to a $350 million taxdeductible pension plan contribution included on the Company's 2017 U.S. Corporation income tax return. The Company recognized additional taxexpense of $95 million related to the Transition Tax, including $55 million of unrecognized tax benefits during the fourth quarter. As of December 31,2018, we have recognized $285 million tax expense related to Transition Tax inclusive of the amount recorded during 2017. As of December 31,2018, the Company has completed its accounting for the tax effects of the enactment of the Tax Cuts and Jobs Act; however, we continue to expectthe United States Treasury to issue regulations that could have a material financial statement impact on the Company's effective tax rate in futureperiods. In addition, to the extent there are settlements in the future for certain foreign unrecognized tax benefits, the Transition Tax may also berevised in future period.
United States Tax on Foreign Dividends
We have historically reinvested all unremitted earnings of the majority of our foreign subsidiaries and affiliates, and therefore have not recognizedany U.S. deferred tax liability on those earnings. However, upon the enactment of the Tax Cuts and Jobs Act, the unremitted earnings and profits ofour foreign subsidiaries and affiliates, subsequent to 1986, are subject to U.S. tax under the Transition Tax provision. The Company has estimatedU.S. GAAP earnings as of December 31, 2018 of $2.8 billion . Under the Transition Tax provision, the Company recognized a deemed remittance of$3.3 billion . The Company had cash and cash equivalents of approximately $1.5 billion at December 31, 2018, of which substantially all was held bysubsidiaries in foreign countries. Our intent is to permanently reinvest these funds outside of the United States and our current plans do notdemonstrate a need to repatriate the cash to fund our U.S. operations. However, if these funds were repatriated, we would be required to accrueand pay applicable United States taxes (if any) and withholding taxes payable to various countries. It is not practicable to estimate the tax impact ofthe reversal of the outside basis difference, or the repatriation of cash due to the complexity of its hypothetical calculation.
Valuation Allowances
At December 31, 2018 , we had net operating loss carryforwards of $4.9 billion , $801 million of which were U.S. state net operating losscarryforwards. Of the total net operating loss carryforwards, $3.2 billion do not expire, with substantially all of the remaining carryforwards expiring invarious years through 2038. As of December 31, 2018 , we had $875 million of United States general business credit carryforwards available tooffset future payments of federal income taxes, expiring between 2029 and 2038.
We routinely review the future realization of deferred tax assets based on projected future reversal of taxable temporary differences, available taxplanning strategies and projected future taxable income. We have recorded a valuation allowance to reflect the net estimated amount of certaindeferred tax assets associated with net operating loss and other deferred tax assets we believe will be realized. Our recorded valuation allowance of$348 million at December 31, 2018 consists of $286 million of net operating loss carryforward deferred tax assets and $62 million of other deferredtax assets. Our recorded valuation allowance was $178 million at December 31, 2017 and consisted of $156 million of net operating losscarryforward deferred tax assets and $22 million of other deferred tax assets. The increase in our valuation allowance includes $75 millionrecognized in net earnings, with the remaining change related to reclassification within our net deferred tax asset. We believe that it is more likelythan not that we will realize the benefit of existing deferred tax assets, net of valuation allowances mentioned above.
Settlement of Global Tax Audits
We are in various stages of audits by certain governmental tax authorities. We establish liabilities for the difference between tax return provisionsand the benefits recognized in our financial statements. Such amounts represent a reasonable provision for taxes ultimately expected to be paid,and may need to be adjusted over time as more information becomes known. We are no longer subject to any significant United States federal taxexaminations for the years before 2009, or any state, local or foreign income tax examinations by tax authorities for years before 2004.
88
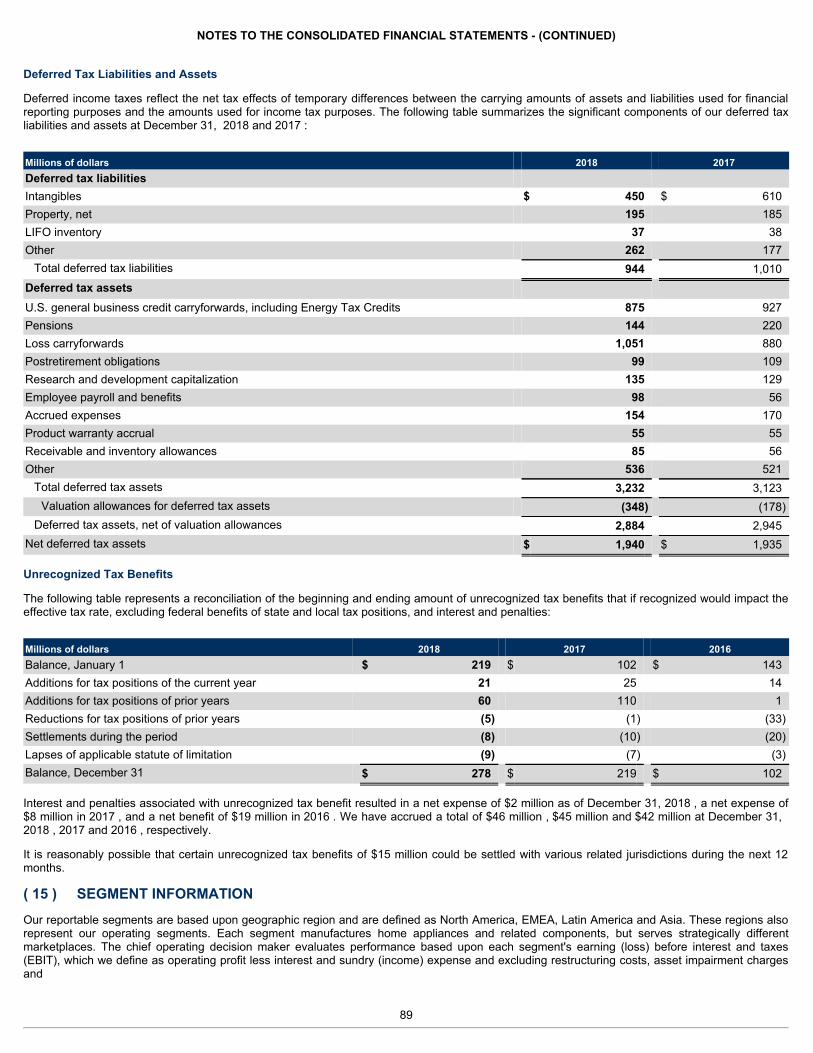
NOTES TO THE CONSOLIDATED FINANCIAL STATEMENTS - (CONTINUED)
Deferred Tax Liabilities and Assets
Deferred income taxes reflect the net tax effects of temporary differences between the carrying amounts of assets and liabilities used for financialreporting purposes and the amounts used for income tax purposes. The following table summarizes the significant components of our deferred taxliabilities and assets at December 31, 2018 and 2017 :
Millions of dollars 2018 2017Deferred tax liabilities Intangibles $ 450 $ 610Property, net 195 185LIFO inventory 37 38Other 262 177
Total deferred tax liabilities 944 1,010Deferred tax assets U.S. general business credit carryforwards, including Energy Tax Credits 875 927Pensions 144 220Loss carryforwards 1,051 880Postretirement obligations 99 109Research and development capitalization 135 129Employee payroll and benefits 98 56Accrued expenses 154 170Product warranty accrual 55 55Receivable and inventory allowances 85 56Other 536 521
Total deferred tax assets 3,232 3,123Valuation allowances for deferred tax assets (348) (178)
Deferred tax assets, net of valuation allowances 2,884 2,945Net deferred tax assets $ 1,940 $ 1,935
Unrecognized Tax Benefits
The following table represents a reconciliation of the beginning and ending amount of unrecognized tax benefits that if recognized would impact theeffective tax rate, excluding federal benefits of state and local tax positions, and interest and penalties:
Millions of dollars 2018 2017 2016Balance, January 1 $ 219 $ 102 $ 143Additions for tax positions of the current year 21 25 14Additions for tax positions of prior years 60 110 1Reductions for tax positions of prior years (5) (1) (33)Settlements during the period (8) (10) (20)Lapses of applicable statute of limitation (9) (7) (3)Balance, December 31 $ 278 $ 219 $ 102
Interest and penalties associated with unrecognized tax benefit resulted in a net expense of $2 million as of December 31, 2018 , a net expense of$8 million in 2017 , and a net benefit of $19 million in 2016 . We have accrued a total of $46 million , $45 million and $42 million at December 31,2018 , 2017 and 2016 , respectively.
It is reasonably possible that certain unrecognized tax benefits of $15 million could be settled with various related jurisdictions during the next 12months.
( 15 ) SEGMENT INFORMATIONOur reportable segments are based upon geographic region and are defined as North America, EMEA, Latin America and Asia. These regions alsorepresent our operating segments. Each segment manufactures home appliances and related components, but serves strategically differentmarketplaces. The chief operating decision maker evaluates performance based upon each segment's earning (loss) before interest and taxes(EBIT), which we define as operating profit less interest and sundry (income) expense and excluding restructuring costs, asset impairment chargesand
89
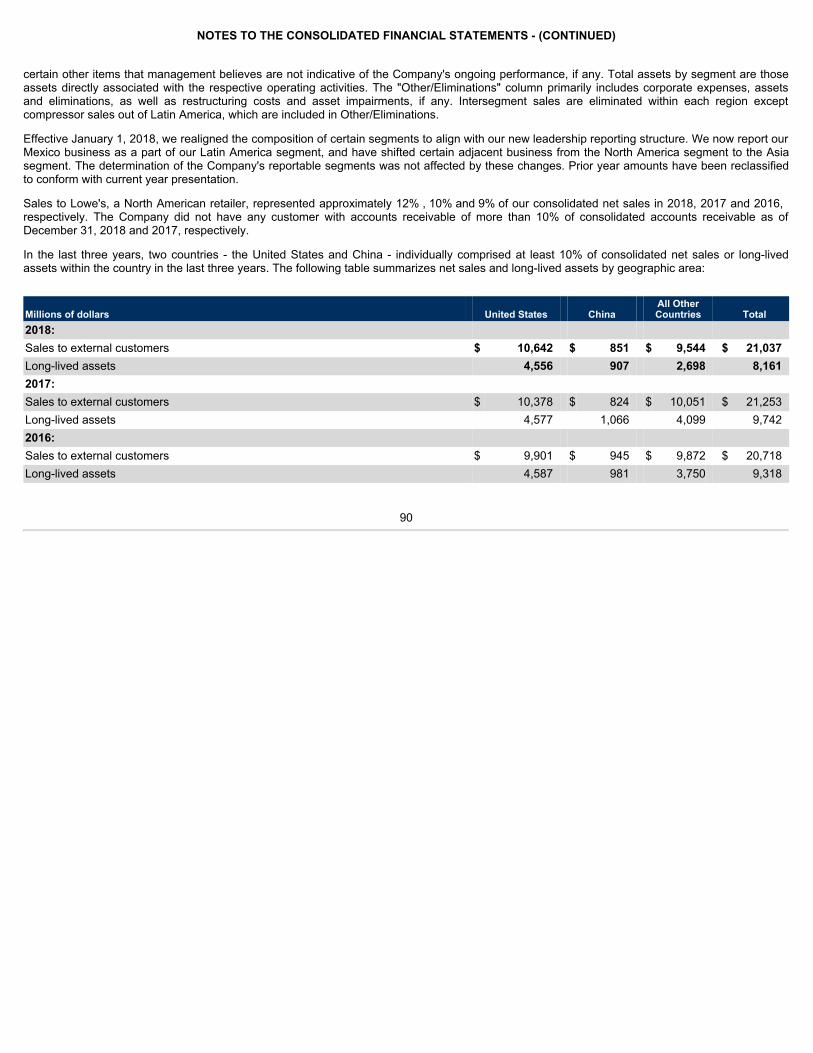
NOTES TO THE CONSOLIDATED FINANCIAL STATEMENTS - (CONTINUED)
certain other items that management believes are not indicative of the Company's ongoing performance, if any. Total assets by segment are thoseassets directly associated with the respective operating activities. The "Other/Eliminations" column primarily includes corporate expenses, assetsand eliminations, as well as restructuring costs and asset impairments, if any. Intersegment sales are eliminated within each region exceptcompressor sales out of Latin America, which are included in Other/Eliminations.
Effective January 1, 2018, we realigned the composition of certain segments to align with our new leadership reporting structure. We now report ourMexico business as a part of our Latin America segment, and have shifted certain adjacent business from the North America segment to the Asiasegment. The determination of the Company's reportable segments was not affected by these changes. Prior year amounts have been reclassifiedto conform with current year presentation.
Sales to Lowe's, a North American retailer, represented approximately 12% , 10% and 9% of our consolidated net sales in 2018, 2017 and 2016,respectively. The Company did not have any customer with accounts receivable of more than 10% of consolidated accounts receivable as ofDecember 31, 2018 and 2017, respectively.
In the last three years, two countries - the United States and China - individually comprised at least 10% of consolidated net sales or long-livedassets within the country in the last three years. The following table summarizes net sales and long-lived assets by geographic area:
Millions of dollars United States China All OtherCountries Total
2018: Sales to external customers $ 10,642 $ 851 $ 9,544 $ 21,037Long-lived assets 4,556 907 2,698 8,1612017: Sales to external customers $ 10,378 $ 824 $ 10,051 $ 21,253Long-lived assets 4,577 1,066 4,099 9,7422016: Sales to external customers $ 9,901 $ 945 $ 9,872 $ 20,718Long-lived assets 4,587 981 3,750 9,318
90
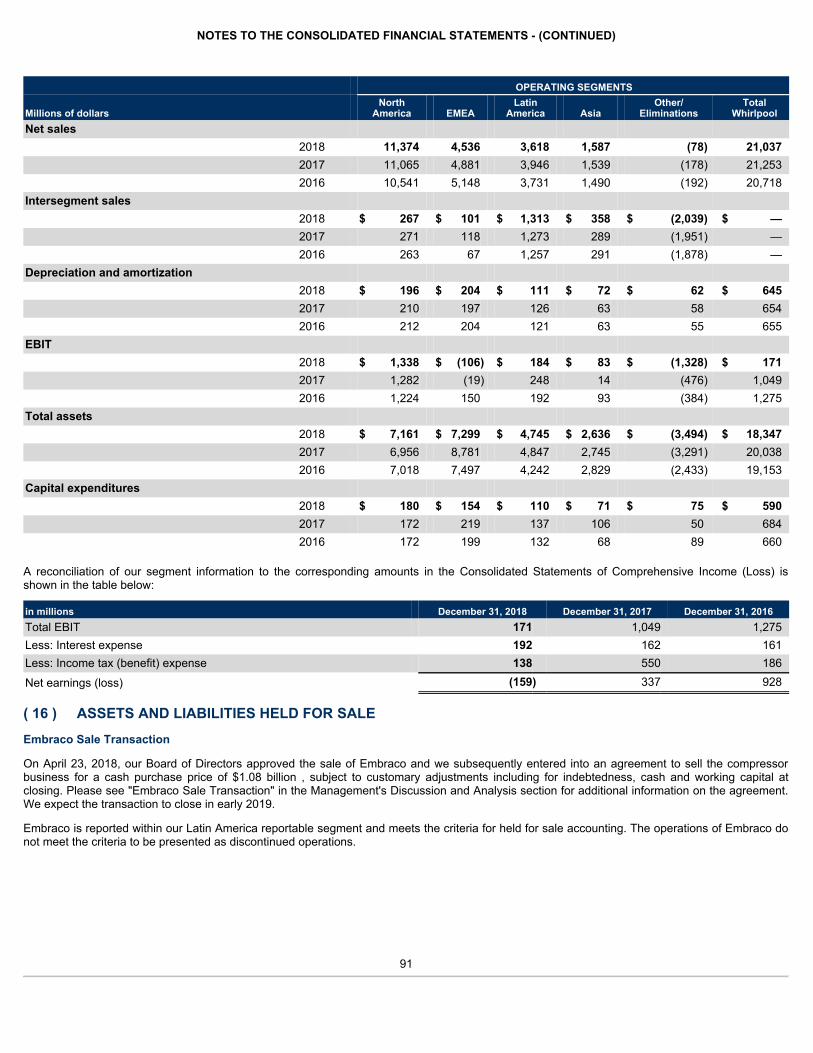
NOTES TO THE CONSOLIDATED FINANCIAL STATEMENTS - (CONTINUED)
OPERATING SEGMENTS
Millions of dollars North
America EMEA Latin
America Asia Other/
Eliminations Total
WhirlpoolNet sales
2018 11,374 4,536 3,618 1,587 (78) 21,0372017 11,065 4,881 3,946 1,539 (178) 21,2532016 10,541 5,148 3,731 1,490 (192) 20,718
Intersegment sales 2018 $ 267 $ 101 $ 1,313 $ 358 $ (2,039) $ —2017 271 118 1,273 289 (1,951) —2016 263 67 1,257 291 (1,878) —
Depreciation and amortization 2018 $ 196 $ 204 $ 111 $ 72 $ 62 $ 6452017 210 197 126 63 58 6542016 212 204 121 63 55 655
EBIT 2018 $ 1,338 $ (106) $ 184 $ 83 $ (1,328) $ 1712017 1,282 (19) 248 14 (476) 1,0492016 1,224 150 192 93 (384) 1,275
Total assets 2018 $ 7,161 $ 7,299 $ 4,745 $ 2,636 $ (3,494) $ 18,3472017 6,956 8,781 4,847 2,745 (3,291) 20,0382016 7,018 7,497 4,242 2,829 (2,433) 19,153
Capital expenditures 2018 $ 180 $ 154 $ 110 $ 71 $ 75 $ 5902017 172 219 137 106 50 6842016 172 199 132 68 89 660
A reconciliation of our segment information to the corresponding amounts in the Consolidated Statements of Comprehensive Income (Loss) isshown in the table below:
in millions December 31, 2018 December 31, 2017 December 31, 2016Total EBIT 171 1,049 1,275Less: Interest expense 192 162 161Less: Income tax (benefit) expense 138 550 186Net earnings (loss) (159) 337 928
( 16 ) ASSETS AND LIABILITIES HELD FOR SALEEmbraco Sale Transaction
On April 23, 2018, our Board of Directors approved the sale of Embraco and we subsequently entered into an agreement to sell the compressorbusiness for a cash purchase price of $1.08 billion , subject to customary adjustments including for indebtedness, cash and working capital atclosing. Please see "Embraco Sale Transaction" in the Management's Discussion and Analysis section for additional information on the agreement.We expect the transaction to close in early 2019.
Embraco is reported within our Latin America reportable segment and meets the criteria for held for sale accounting. The operations of Embraco donot meet the criteria to be presented as discontinued operations.
91
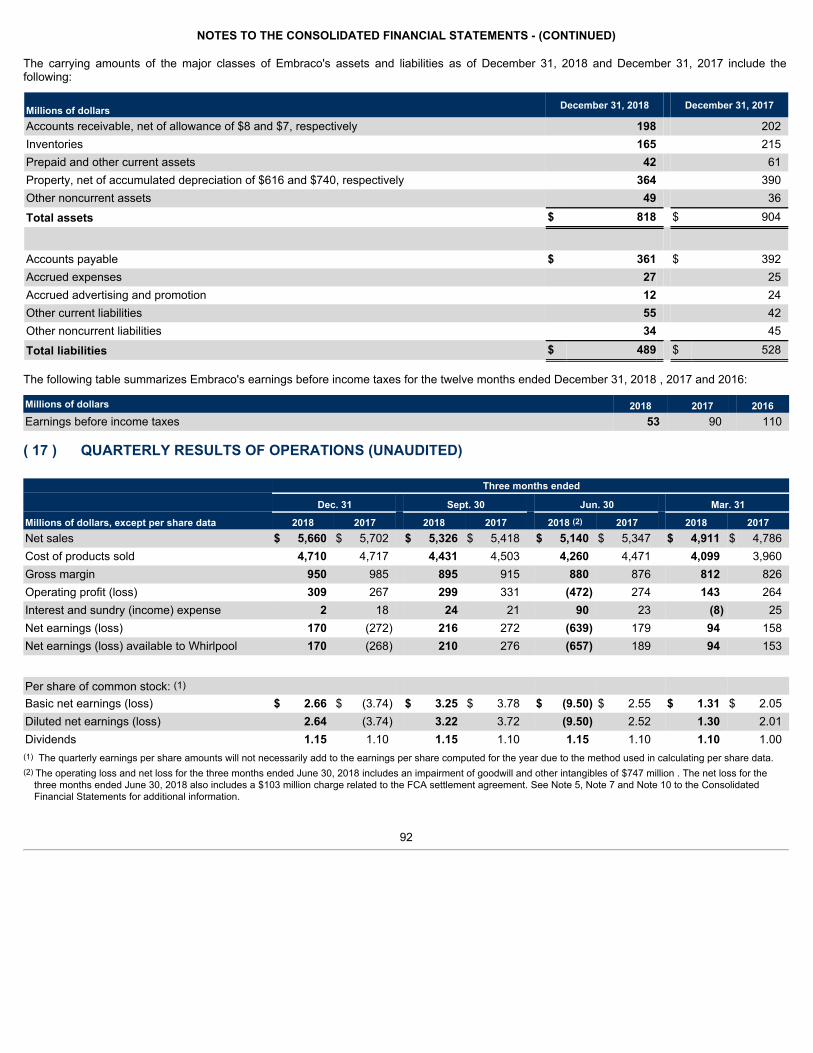
NOTES TO THE CONSOLIDATED FINANCIAL STATEMENTS - (CONTINUED)
The carrying amounts of the major classes of Embraco's assets and liabilities as of December 31, 2018 and December 31, 2017 include thefollowing:
Millions of dollars December 31, 2018 December 31, 2017
Accounts receivable, net of allowance of $8 and $7, respectively 198 202Inventories 165 215Prepaid and other current assets 42 61Property, net of accumulated depreciation of $616 and $740, respectively 364 390Other noncurrent assets 49 36Total assets $ 818 $ 904
Accounts payable $ 361 $ 392Accrued expenses 27 25Accrued advertising and promotion 12 24Other current liabilities 55 42Other noncurrent liabilities 34 45Total liabilities $ 489 $ 528
The following table summarizes Embraco's earnings before income taxes for the twelve months ended December 31, 2018 , 2017 and 2016:
Millions of dollars 2018 2017 2016Earnings before income taxes 53 90 110
( 17 ) QUARTERLY RESULTS OF OPERATIONS (UNAUDITED)
Three months ended Dec. 31 Sept. 30 Jun. 30 Mar. 31
Millions of dollars, except per share data 2018 2017 2018 2017 2018 (2) 2017 2018 2017Net sales $ 5,660 $ 5,702 $ 5,326 $ 5,418 $ 5,140 $ 5,347 $ 4,911 $ 4,786Cost of products sold 4,710 4,717 4,431 4,503 4,260 4,471 4,099 3,960Gross margin 950 985 895 915 880 876 812 826Operating profit (loss) 309 267 299 331 (472) 274 143 264Interest and sundry (income) expense 2 18 24 21 90 23 (8) 25Net earnings (loss) 170 (272) 216 272 (639) 179 94 158Net earnings (loss) available to Whirlpool 170 (268) 210 276 (657) 189 94 153
Per share of common stock: (1) Basic net earnings (loss) $ 2.66 $ (3.74) $ 3.25 $ 3.78 $ (9.50) $ 2.55 $ 1.31 $ 2.05Diluted net earnings (loss) 2.64 (3.74) 3.22 3.72 (9.50) 2.52 1.30 2.01Dividends 1.15 1.10 1.15 1.10 1.15 1.10 1.10 1.00(1) The quarterly earnings per share amounts will not necessarily add to the earnings per share computed for the year due to the method used in calculating per share data.(2) The operating loss and net loss for the three months ended June 30, 2018 includes an impairment of goodwill and other intangibles of $747 million . The net loss for the
three months ended June 30, 2018 also includes a $103 million charge related to the FCA settlement agreement. See Note 5, Note 7 and Note 10 to the ConsolidatedFinancial Statements for additional information.
92
ITEM 9. CHANGES IN AND DISAGREEMENTS WITH ACCOUNTANTS ON ACCOUNTING AND FINANCIALDISCLOSURE
None.
ITEM 9A. CONTROLS AND PROCEDURES
Disclosure controls and procedures. Whirlpool maintains disclosure controls and procedures (as defined in Rule 13a-15(e) of the SecuritiesExchange Act of 1934, as amended (the "Securities Exchange Act")) that are designed to provide reasonable assurance that information required tobe disclosed in our filings under the Securities Exchange Act is recorded, processed, summarized, and reported within the periods specified in therules and forms of the SEC and that such information is accumulated and communicated to Whirlpool's management, including its Chief ExecutiveOfficer and Chief Financial Officer, as appropriate, to allow timely decisions regarding required disclosure.
Prior to filing this report, we completed an evaluation under the supervision and with the participation of Whirlpool management, including the ChiefExecutive Officer and Chief Financial Officer, of the effectiveness of the design and operation of our disclosure controls and procedures as ofDecember 31, 2018 . Based on this evaluation, the Chief Executive Officer and Chief Financial Officer concluded that our disclosure controls andprocedures were effective at the reasonable assurance level as of December 31, 2018 .
Management's annual report on internal control over financial reporting. Pursuant to Section 404 of the Sarbanes-Oxley Act of 2002 and therules and regulations adopted pursuant thereto, we included a report of management's assessment of the effectiveness of our internal control overfinancial reporting as part of this report. Management's report is included on page 105 of this report under the caption entitled "Management'sReport on Internal Control Over Financial Reporting" and is incorporated herein by reference.
Our internal control over financial reporting as of December 31, 2018 has been audited by Ernst & Young LLP, an independent registered publicaccounting firm, as stated in their report, which is included on page 107 of this report under the caption entitled "Report of Independent RegisteredPublic Accounting Firm" and is incorporated herein by reference.
There were no changes in our internal control over financial reporting during the quarter ended December 31, 2018 that have materially affected, orare reasonably likely to materially affect, our internal control over financial reporting.
ITEM 9B. OTHER INFORMATION
None.
93
PART III
ITEM 10. DIRECTORS, EXECUTIVE OFFICERS AND CORPORATE GOVERNANCE
Information regarding our executive officers is included in ITEM 1 of PART I of this report.
Information regarding the background of the directors, matters related to the Audit Committee, Section 16(a) compliance, and the process by whichour shareholders may recommend nominees to our Board of Directors can be found under the captions "Directors and Nominees for Election asDirectors," "Board of Directors and Corporate Governance - Board of Directors and Committees," "Section 16(a) Beneficial Ownership ReportingCompliance," and "Board of Directors and Corporate Governance - Director Nominations by Stockholders" in our Proxy Statement, which isincorporated herein by reference.
We have recently adopted a refreshed code of ethics that applies to all of our employees, officers and directors, including our principal executiveofficer, principal financial officer and principal accounting officer. The text of our refreshed code of ethics, or Integrity Manual, is posted on ourwebsite: www.whirlpoolcorp.com (scroll to the bottom of the main page and click on "Policies," then on "Integrity Manual.") Whirlpool intends todisclose future amendments to, or waivers from, certain provisions of the code of ethics for executive officers and directors on this website withinfour business days following the date of such amendment or waiver. Stockholders may request a free copy of the Integrity Manual from:
Investor RelationsWhirlpool Corporation
2000 North M-63Mail Drop 2609
Benton Harbor, MI 49022-2692Telephone: (269) 923-2641
Whirlpool has also adopted Corporate Governance Guidelines and written charters for its Audit, Finance, Human Resources and CorporateGovernance and Nominating Committees, all of which are posted on our website: www.whirlpoolcorp.com (scroll to the bottom of the main page andclick on "Policies.") Stockholders may request a free copy of the charters and guidelines from the address or telephone number set forth above.
ITEM 11. EXECUTIVE COMPENSATION
Information regarding compensation of our executive officers and directors can be found under the captions "Nonemployee Director Compensation,""Compensation Discussion and Analysis," "Executive Compensation Tables," "Pay Ratio Disclosure," and "Human Resources Committee Interlocksand Insider Participation" in the Proxy Statement, which is incorporated herein by reference. See also the information under the caption "HumanResources Committee Report" in our Proxy Statement, which is incorporated herein by reference; however, such information is only "furnished"hereunder and not deemed "soliciting material" or "filed" with the SEC or subject to Regulation 14A or 14C or to the liabilities of Section 18 of theSecurities Exchange Act of 1934.
ITEM 12. SECURITY OWNERSHIP OF CERTAIN BENEFICIAL OWNERS AND MANAGEMENT AND RELATEDSTOCKHOLDER MATTERS
Information regarding the security ownership of any person that we know to beneficially own more than 5% of Whirlpool stock and by each Whirlpooldirector, each Whirlpool named executive officer, and all directors and executive officers as a group, can be found under the captions "SecurityOwnership" and "Beneficial Ownership" in the Proxy Statement, which is incorporated herein by reference. Information relating to securitiesauthorized under equity compensation plans can be found under the caption "Equity Compensation Plan Information" in the Proxy Statement, whichis incorporated herein by reference.
94

ITEM 13. CERTAIN RELATIONSHIPS AND RELATED TRANSACTIONS, AND DIRECTOR INDEPENDENCE
Information regarding certain relationships and related transactions (if any) and the independence of Whirlpool's directors, can be found under thecaptions "Related Person Transactions" and "Board of Directors and Corporate Governance - Board of Directors and Committees" in the ProxyStatement, which is incorporated herein by reference.
ITEM 14. PRINCIPAL ACCOUNTING FEES AND SERVICES
Information regarding our auditors and the Audit Committee's pre-approval policies can be found under the caption "Matters Relating to IndependentRegistered Public Accounting Firm" in the Proxy Statement, which is incorporated herein by reference.
95
PART IV
ITEM 15. EXHIBITS, FINANCIAL STATEMENT SCHEDULES(a) The following documents are filed as a part of this report:
1. Financial statements
PAGEConsolidated Statements of Income (Loss) 45Consolidated Statements of Comprehensive Income (Loss) 46Consolidated Balance Sheets 47Consolidated Statements of Cash Flows 48Consolidated Statements of Changes in Stockholders' Equity 49Notes to the Consolidated Financial Statements 50Report by Management on the Consolidated Financial Statements 104Report of Independent Registered Public Accounting Firm 106
2. Financial Statement Schedules - "Schedule II—Valuation and Qualifying Accounts" is contained on page 108 of this report. Certain schedulesfor which provisions are made in the applicable accounting regulations of the Securities and Exchange Commission are not required under therelated instructions or are inapplicable, and therefore have been omitted.
(b) The exhibits listed in the "Exhibit Index" is contained on page 97 of this report.(c) Individual financial statements of the registrant's affiliated foreign companies, accounted for by the equity method, have been omitted since nosuch company individually constitutes a significant subsidiary.
ITEM 16. Form 10-K Summary
None.
96
ANNUAL REPORT ON FORM 10-KITEMS 15(a)(3) and 15(c)
EXHIBIT INDEXYEAR ENDED DECEMBER 31, 2018
The following exhibits are submitted herewith or incorporated herein by reference in response to Items 15(a)(3) and 15(c). Each exhibit that isconsidered a management contract or compensatory plan or arrangement required to be filed pursuant to Item 15(a)(3) of Form 10-K is identified bya "(Z)."
Number and Description of Exhibit 2(i) Purchase Agreement dated April 24, 2018 by and among Whirlpool Corporation, certain subsidiaries thereof, and Nidec
Corporation [Incorporated by reference from Exhibit 2.1 to the Company's Form 8-K (Commission file number 1-3932) filed on April24, 2018]
3(i) Restated Certificate of Incorporation of Whirlpool Corporation (amended and restated as of April 22, 2009) [Incorporated byreference from Exhibit 3.1 to the Company's Form 8-K (Commission file number 1-3932) filed on April 23, 2009]
3(ii) By-Laws of Whirlpool Corporation (amended and restated effective October 18, 2016) [Incorporated by reference from Exhibit 3.2to the Company's Form 8-K (Commission file number 1-3932) filed on October 21, 2016]
4(i) The registrant hereby agrees to furnish to the Securities and Exchange Commission, upon request, a copy of instruments definingthe rights of holders of each issue of long-term debt of the registrant and its subsidiaries.
4(ii) Indenture dated as of April 15, 1990 between Whirlpool Corporation and Citibank, N.A. [Incorporated by reference from Exhibit 4(a)to the Company's Registration Statement on Form S-3 (Commission file number 33-40249) filed on May 6, 1991]
4(iii) Indenture dated as of March 20, 2000 between Whirlpool Corporation and U.S. Bank, National Association (as successor toCitibank, N.A.) [Incorporated by reference from Exhibit 4(a) to the Company's Registration Statement on Form S-3 (Commission filenumber 333-32886) filed on March 21, 2000]
4(iv) Indenture dated as of June 15, 1987 between Maytag Corporation and The First National Bank of Chicago [Incorporated byreference from Maytag Corporation's Quarterly Report on Form 10-Q (Commission file number 1-00655) for the quarter endedJune 30, 1987]
4(v) Ninth Supplemental Indenture dated as of October 30, 2001 between Maytag Corporation and Bank One, National Association[Incorporated by reference from Exhibit 4.1 to Maytag Corporation's Form 8-K (Commission file number 1-00655) filed on October31, 2001]
4(vi) Tenth Supplemental Indenture dated as of December 30, 2010, between Maytag Corporation, Whirlpool Corporation and The Bankof New York Mellon Trust Company, N.A. [Incorporated by reference from Exhibit 4(vi) to the Company's Annual Report on Form10-K (Commission file number 1-3932) for the fiscal year ended December 31, 2010]
4(vii) Indenture, dated November 2, 2016, among Whirlpool Finance Luxembourg S.à. r.l., Whirlpool Corporation and U.S. Bank NationalAssociation [Incorporated by reference from Exhibit 4.1 to the Company's Form 8-K (Commission file number 1-3932) filed onNovember 2, 2016]
97
10(i)(a) Share Purchase Agreement dated July 10, 2014 among Whirlpool Corporation and Fineldo S.p.A., Franca Carloni, Andrea Merloni,Aristide Merloni, Maria Paola Merloni, and Antonella Merloni [Incorporated by reference from Exhibit 10.1 to the Company'sQuarterly Report on Form 10-Q (Commission file number 1-3932) for the quarter ended September 30, 2014]
10(i)(b) Share Purchase Agreement dated July 10, 2014 among Whirlpool Corporation and Fineldo S.p.A., Fines S.p.A., Franca Carloni,
Andrea Merloni, Aristide Merloni, Maria Paola Merloni, Ester Merloni, Vittorio Merloni and Antonella Merloni [Incorporated byreference from Exhibit 10.2 to the Company's Quarterly Report on Form 10-Q (Commission file number 1-3932) for the quarterended September 30, 2014]
10(i)(c) Share Purchase Agreement dated July 10, 2014 between Whirlpool Corporation and Claudia Merloni [Incorporated by referencefrom Exhibit 10.3 to the Company's Quarterly Report on Form 10-Q (Commission file number 1-3932) for the quarter endedSeptember 30, 2014]
10(i)(d) Exclusivity Agreement dated July 10, 2014 among Whirlpool Corporation and Fineldo S.p.A., Fines S.p.A., Vittorio Merloni, FrancaCarloni, Aristide Merloni, Andrea Merloni, Maria Paola Merloni, Antonella Merloni, and Ester Merloni [Incorporated by referencefrom Exhibit 10.4 to the Company's Quarterly Report on Form 10-Q (Commission file number 1-3932) for the quarter endedSeptember 30, 2014]
10(i)(e) Amendment dated October 14, 2014 to Share Purchase Agreement dated July 10, 2014, among Whirlpool Italia Holdings S.r.l.,Whirlpool Corporation and Fineldo S.p.A., Franca Carloni, Andrea Merloni, Aristide Merloni, Maria Paola Merloni, and AntonellaMerloni [Incorporated by reference from Exhibit 10.5 to the Company's Quarterly Report on Form 10-Q (Commission file number 1-3932) for the quarter ended September 30, 2014]
10(i)(f) Third Amended and Restated Long-Term Five-Year Credit Agreement dated as of May 17, 2016 among Whirlpool Corporation,Whirlpool Europe B.V., Whirlpool Finance B.V., Whirlpool Canada Holding Co., certain Financial Institutions and JPMorgan ChaseBank, N.A. as Administrative Agent, The Royal Bank of Scotland PLC, BNP Paribas and Citibank, N.A. as Syndication Agents, andJ.P. Morgan Securities LLC, RBS Securities Inc., BNP Paribas Securities Corp., and Citigroup Global Markets Inc., as Joint LeadArrangers and Joint Bookrunners [Incorporated by reference from Exhibit 10.1 to the Company's Quarterly Report on Form 10-Q(Commission file number 1-3932) for the quarter ended June 30, 2016]
10(i)(g) Consent to Commitment Increase dated September 27, 2017 by and between Whirlpool Corporation and JPMorgan Chase Bank,N.A., as Administrative Agent, and form of consent by certain Financial Institutions [Incorporated by reference from Exhibit 10.1 tothe Company's Quarterly Report on Form 10-Q (Commission file number 1-3932) for the quarter ended September 30, 2017]
10(i)(h) Request for Extension dated September 8, 2017 by the Company and form of consent to Extension dated September 27, 2017 bycertain Financial Institutions to JPMorgan Chase Bank, N.A., as Administrative Agent [Incorporated by reference from Exhibit 10.2to the Company's Quarterly Report on Form 10-Q (Commission file number 1-3932) for the quarter ended September 30, 2017]
10(i)(i) Term Loan Agreement dated as of April 23, 2018 among Whirlpool Corporation, Citibank, N.A., as Administrative Agent, JPMorganChase Bank, N.A., as Syndication Agent, Citibank, N.A. and JPMorgan Chase Bank, N.A., as Joint Lead Arrangers and JointBookrunners, and certain other financial institutions [Incorporated by reference from Exhibit 10.1 to the Company's Form 10-Q(Commission file number 1-3932) for the quarter ended March 31, 2018]
10(i)(j) Term Loan Agreement dated as of June 5, 2018 among Whirlpool Corporation, Whirlpool EMEA Finance S.à r.l., Wells FargoBank, National Association, as Administrative Agent, and certain other financial institutions [Incorporated by reference from Exhibit10.1 to the Company's Form 8-K (Commission file number 1-3932) filed on June 8, 2018]
10(i)(k) Letter Amendment dated as of May 14, 2018 to Term Loan Agreement dated as of April 23, 2018 [Incorporated by reference fromExhibit 10.1 to the Company's Form 10-Q (Commission file number 1-3932) for the quarter ended June 30, 2018]
98
10(i)(l) Amendment No. 1 dated August 30, 2018 to Third Amended and Restated Long-Term Five-Year Credit Agreement amongWhirlpool Corporation, Whirlpool Europe B.V., Whirlpool Finance B.V., Whirlpool Canada Holding Co., the other Borrowers partythereto, JPMorgan Chase Bank, N.A. as Administrative Agent, and certain other financial institutions [Incorporated by referencefrom Exhibit 10.1 to the Company's Form 10-Q (Commission file number 1-3932) for the quarter ended September 30, 2018]
10(i)(m) Amendment No. 1 dated August 30, 2018 to Term Loan Agreement among Whirlpool Corporation, Whirlpool EMEA Finance S.àr.l., Wells Fargo Bank, National Association, as Administrative Agent, and certain other financial institutions [Incorporated byreference from Exhibit 10.2 to the Company's Form 10-Q (Commission file number 1-3932) for the quarter ended September 30,2018]
10(i)(n) Amendment No. 2 dated August 30, 2018 to Term Loan Agreement among Whirlpool Corporation, Citibank, N.A., as AdministrativeAgent, and certain other financial institutions [Incorporated by reference from Exhibit 10.3 to the Company's Form 10-Q(Commission file number 1-3932) for the quarter ended September 30, 2018]
10(iii)(a) Whirlpool Corporation Nonemployee Director Stock Ownership Plan (amended as of February 16, 1999, effective April 20, 1999)(Z) [Incorporated by reference from Exhibit A to the Company's Proxy Statement (Commission file number 1-3932) for the 1999annual meeting of stockholders]
10(iii)(b) Whirlpool Corporation Charitable Award Contribution and Additional Life Insurance Plan for Directors (effective April 20, 1993) (Z)[Incorporated by reference from Exhibit 10(iii)(p) to the Company's Annual Report on Form 10-K (Commission file number 1-3932)for the fiscal year ended December 31, 1994]
10(iii)(c) Whirlpool Corporation Deferred Compensation Plan for Directors (as amended effective January 1, 1992 and April 20, 1993) (Z)[Incorporated by reference from Exhibit 10(iii)(f) to the Company's Annual Report on Form 10-K (Commission file number 1-3932)for the fiscal year ended December 31, 1993]
10(iii)(d) Whirlpool Corporation Deferred Compensation Plan II for Non-Employee Directors (as amended and restated, effective January 1,
2009) (Z) [Incorporated by reference from Exhibit 10(iii)(e) to the Company's Annual Report on Form 10-K (Commission file number1-3932) for the fiscal year ended December 31, 2008]
10(iii)(e) Whirlpool Corporation Nonemployee Director Equity Plan (effective January 1, 2005) (Z) [Incorporated by reference from Exhibit
99.1 to the Company's Form 8-K (Commission file number 1-3932) filed on April 21, 2005]
10(iii)(f) Amendment of the Whirlpool Corporation Nonemployee Director Equity Plan (effective January 1, 2008) (Z) [Incorporated byreference to Exhibit 10(iii)(a) to the Company's Quarterly Report on Form 10-Q (Commission file number 1-3932) filed on April 24,2008]
10(iii)(g) Nonemployee Director Stock Option Form of Agreement (Z) [Incorporated by reference from Exhibit 10(iii)(b) to the Company'sQuarterly Report on Form 10-Q (Commission file number 1-3932) filed on April 24, 2008]
10(iii)(h) Nonemployee Director Stock Option Form of Agreement (Z) [Incorporated by reference from Exhibit 10.2 to the Company's Form 8-K (Commission file number 1-3932) filed on April 26, 2010]
10(iii)(i) Whirlpool Corporation 2007 Omnibus Stock and Incentive Plan (effective January 1, 2007) (Z) [Incorporated by reference fromAnnex A to the Company's Proxy Statement (Commission file number 1-3932) for the 2007 annual meeting of stockholders filed onMarch 12, 2007]
10(iii)(j) Omnibus Equity Plans 409A Amendment (effective December 19, 2008) (Z) [Incorporated by reference from Exhibit 10(iii)(n) to theCompany's Annual Report on Form 10-K (Commission file number 1-3932) for the fiscal year ended December 31, 2008]
99
10(iii)(k) Whirlpool Corporation 2010 Omnibus Stock and Incentive Plan (Z) [Incorporated by reference from Exhibit 10.1 to the Company'sForm 8-K (Commission file number 1-3932) filed on April 26, 2010]
10(iii)(l) Whirlpool Corporation Amended and Restated 2010 Omnibus Stock and Incentive Plan (Z) [Incorporated by reference from Exhibit10.1 to the Company's Registration Statement on Form S-8 (Commission file number 333-187948) filed on April 16, 2013]
10(iii)(m) Form of Agreement for the Whirlpool Corporation Career Stock Grant Program (pursuant to one or more of Whirlpool's OmnibusStock and Incentive Plans) (Z) [Incorporated by reference from Exhibit 10(iii)(q) to the Company's Annual Report on Form 10-K(Commission file number 1-3932) for the fiscal year ended December 31, 1995]
10(iii)(n) Form of Amendment to Whirlpool Corporation Career Stock Grant Agreement (Z) [Incorporated by reference from Exhibit 10(iii)(p)to the Company's Annual Report on Form 10-K (Commission file number 1-3932) for the fiscal year ended December 31, 2008]
10(iii)(o) Form of Stock Option Grant Document for the Whirlpool Corporation Stock Option Program (pursuant to one or more of Whirlpool'sOmnibus Stock and Incentive Plans)(Rev. 02/17/04) (Z) [Incorporated by reference from Exhibit 10(i) to the Company's Form 8-K(Commission file number 1-3932) filed on January 25, 2005]
10(iii)(p) Form of Restricted Stock Unit Agreement (pursuant to one or more of Whirlpool's Omnibus Stock and Incentive Plans) (Z)[Incorporated by reference from Exhibit 10.1 to the Company's Form 8-K (Commission file number 1-3932) filed on June 21, 2010]
10(iii)(q) Whirlpool Corporation 2010 Omnibus Stock and Incentive Plan Restricted Stock Unit Award (Z) [Incorporated by reference fromExhibit 10(iii)(a) to the Company's Form 10-Q (Commission file number 1-3932) for the quarter ended March 31, 2011]
10(iii)(r) Whirlpool Corporation 2010 Omnibus Stock and Incentive Plan Strategic Excellence Program Performance Unit Award (Z)[Incorporated by reference from Exhibit 10(iii)(b) to the Company's Form 10-Q (Commission file number 1-3932) for the quarterended March 31, 2011]
10(iii)(s) Whirlpool Corporation 2010 Omnibus Stock and Incentive Plan Strategic Excellence Program Stock Option Grant (Z) [Incorporatedby reference from Exhibit 10(iii)(c) to the Company's Form 10-Q (Commission file number 1-3932) for the quarter ended March 31,2011]
10(iii)(t) Whirlpool Corporation 2010 Omnibus Stock and Incentive Plan Strategic Excellence Program Restricted Stock Unit Award (Z)[Incorporated by reference from Exhibit 10(iii)(d) to the Company's Form 10-Q (Commission file number 1-3932) for the quarterended March 31, 2011]
10(iii)(u) Whirlpool Corporation 2010 Omnibus Stock and Incentive Plan Strategic Excellence Program Stock Option Grant Document (Z)[Incorporated by reference from Exhibit 10(iii)(a) to the Company's form 10-Q (Commission file number 1-3932) for the quarterended March 31, 2012]
10(iii)(v) Whirlpool Corporation 2010 Omnibus Stock and Incentive Plan Strategic Excellence Program Performance Restricted Stock Unit /Performance Unit Grant Document (Z) [Incorporated by reference from Exhibit 10(iii)(b) to the Company's form 10-Q (Commissionfile number 1-3932) for the quarter ended March 31, 2012]
10(iii)(w) Whirlpool Corporation Amended and Restated 2010 Omnibus Stock and Incentive Plan Strategic Excellence Program PerformanceUnit Award for Executive Chairman (Z) [Incorporated by reference from Exhibit 10.2 to the Company's Form 10-Q (Commission filenumber 1-3932) for the quarter ended March 31, 2018]
100
10(iii)(x) Whirlpool Corporation 2018 Omnibus Stock and Incentive Plan (Z) [Incorporated by reference from Exhibit 10.1 to the Company'sForm 8-K (Commission file number 1-3932) filed on April 18, 2018]
10(iii)(y) Form of Compensation and Benefits Assurance Agreements (Z) [Incorporated by reference from Exhibit 10.1 to the Company'sForm 8-K (Commission file number 1-3932) filed on August 23, 2010]
10(iii)(z) Whirlpool Corporation Executive Deferred Savings Plan (as amended effective January 1, 1992) (Z) [Incorporated by referencefrom Exhibit 10(iii)(n) to the Company's Annual Report on Form 10-K (Commission file number 1-3932) for the fiscal year endedDecember 31, 1993]
10(iii)(aa) Whirlpool Corporation Executive Deferred Savings Plan II (as amended and restated, effective January 1, 2009), includingSupplement A, Whirlpool Executive Restoration Plan (as amended and restated, effective January 1, 2009) (Z) [Incorporated byreference from Exhibit 10(iii)(y) to the Company's Annual Report on Form 10-K (Commission file number 1-3932) for the fiscal yearended December 31, 2008]
10(iii)(bb) Amendment to the Whirlpool Corporation Executive Deferred Savings Plan II (dated December 21, 2009) (Z) [Incorporated byreference from Exhibit 10(iii)(x) to the Company's Annual Report on Form 10-K (Commission file number 1-3932) for the fiscal yearended December 31, 2009]
10(iii)(cc) Whirlpool Retirement Benefits Restoration Plan (as amended and restated effective January 1, 2009) (Z) [Incorporated byreference from Exhibit 10(iii)(dd) to the Company's Annual Report on Form 10-K (Commission file number 1-3932) for the fiscalyear ended December 31, 2008]
10(iii)(dd) Whirlpool Supplemental Executive Retirement Plan (as amended and restated, effective January 1, 2009) (Z) [Incorporated byreference from Exhibit 10(iii)(ee) to the Company's Annual Report on Form 10-K (Commission file number 1-3932) for the fiscalyear ended December 31, 2008]
10(iii)(ee) Whirlpool Corporation Form of Indemnity Agreement (Z) [Incorporated by reference from Exhibit 10.1 to the Company's Form 8-K(Commission file number 1-3932) filed on February 23, 2006]
10(iii)(ff) Whirlpool Corporation Performance Excellence Plan (Z) [Incorporated by reference from Exhibit 10(iii)(a) to the Company'sQuarterly Report on Form 10-Q (Commission file number 1-3932) for the quarter ended March 31, 2014]
10(iii)(gg) Whirlpool Corporation 2014 Executive Performance Excellence Plan (Z) [Incorporated by reference from Exhibit 10.1 to theCompany's Form 8-K (Commission file number 1-3932) filed on April 17, 2014]
10(iii)(hh) Agreement dated May 1, 2012 by and between Whirlpool Corporation and Mr. João Carlos Costa Brega (Z) [Incorporated byreference from Exhibit 10(iii)(ii) to the Company's Annual Report on Form 10-K (Commission file number 1-3932) for the fiscal yearended December 31, 2015]
10(iii)(ii) Transition Agreement, dated June 22, 2016, between Whirlpool Corporation and Larry M. Venturelli [Incorporated by referencefrom Exhibit 10.1 to the Company's Form 8-K (Commission file number 1-3932) filed on June 24, 2016]
21 List of Subsidiaries
23 Consent of Independent Registered Public Accounting Firm
24 Power of Attorney
31.1 Certification of Chief Executive Officer, Pursuant to Section 302 of the Sarbanes-Oxley Act of 2002
101
31.2 Certification of Chief Financial Officer, Pursuant to Section 302 of the Sarbanes-Oxley Act of 2002
32 Certifications Pursuant to 18 U.S.C. Section 1350, as Adopted Pursuant to Section 906 of the Sarbanes-Oxley Act of 2002
101.INS XBRL Instance Document
101.SCH XBRL Taxonomy Extension Schema Document
101.CAL XBRL Taxonomy Extension Calculation Linkbase Document
101.LAB XBRL Taxonomy Extension Label Linkbase Document
101.PRE XBRL Taxonomy Extension Presentation Linkbase Document
101.DEF XBRL Taxonomy Extension Definition Linkbase Document
102
SIGNATURES
Pursuant to the requirements of Section 13 or 15(d) of the Securities Exchange Act of 1934, the registrant has duly caused this report to be signedon its behalf by the undersigned, thereunto duly authorized.
W HIRLPOOL C ORPORATION(Registrant) By: /s/ JAMES W. PETERS February 12, 2019
James W. Peters
Executive Vice President and Chief Financial Officer Pursuant to the requirements of the Securities Exchange Act of 1934, this report has been signed below by the following persons on behalf of
the registrant and in the capacities and on the date indicated.
Signature Title
/s/ MARC R. BITZER Chairman of the Board, President and Chief Executive Officer (Principal Executive Officer)Marc R. Bitzer
/s/ JAMES W. PETERS Executive Vice President and Chief Financial Officer
(Principal Financial Officer)James W. Peters
/s/ MATTHEW M. NOCHOWITZ Vice President and Corporate Controller (Principal Accounting Officer)Matthew M. Nochowitz
SAMUEL R. ALLEN* Director
Samuel R. Allen
GREG CREED* DirectorGreg Creed
GARY T. DICAMILLO* Director
Gary T. DiCamillo
DIANE M. DIETZ* DirectorDiane M. Dietz
GERRI T. ELLIOTT* Director
Gerri T. Elliott
MICHAEL F. JOHNSTON* DirectorMichael F. Johnston
JOHN D. LIU* Director
John D. Liu
JAMES M. LOREE* DirectorJames M. Loree
HARISH MANWANI* Director
Harish Manwani
WILLIAM D. PEREZ* DirectorWilliam D. Perez
LARRY O. SPENCER* Director
Larry O. Spencer
MICHAEL D. WHITE* DirectorMichael D. White
*By: /s/ JAMES W. PETERS Attorney-in-Fact February 12, 2019 James W. Peters

103
REPORT BY MANAGEMENT ON THE CONSOLIDATED FINANCIAL STATEMENTS
The management of Whirlpool Corporation has prepared the accompanying financial statements. The financial statements have been audited byErnst & Young LLP, an independent registered public accounting firm, whose report, based upon their audits, expresses the opinion that thesefinancial statements present fairly the consolidated financial position, statements of income and cash flows of Whirlpool and its subsidiaries inaccordance with accounting principles generally accepted in the United States. Their audits are conducted in conformity with the auditing standardsof the Public Company Accounting Oversight Board (United States).
The financial statements were prepared from the Company's accounting records, books and accounts which, in reasonable detail, accurately andfairly reflect all material transactions. The Company maintains a system of internal controls designed to provide reasonable assurance that theCompany's books and records, and the Company's assets are maintained and accounted for, in accordance with management's authorizations. TheCompany's accounting records, compliance with policies and internal controls are regularly reviewed by an internal audit staff.
The audit committee of the Board of Directors of the Company is composed of six independent directors who, in the opinion of the board, meet therelevant financial experience, literacy, and expertise requirements. The audit committee provides independent and objective oversight of theCompany's accounting functions and internal controls and monitors (1) the objectivity of the Company's financial statements, (2) the Company'scompliance with legal and regulatory requirements, (3) the independent registered public accounting firm's qualifications and independence, and(4) the performance of the Company's internal audit function and independent registered public accounting firm. In performing these functions, thecommittee has the responsibility to review and discuss the annual audited financial statements and quarterly financial statements and related reportswith management and the independent registered public accounting firm, including the Company's disclosures under "Management's Discussionand Analysis of Financial Condition and Results of Operations," to monitor the adequacy of financial disclosure. The committee also has theresponsibility to retain and terminate the Company's independent registered public accounting firm and exercise the committee's sole authority toreview and approve all audit engagement fees and terms and pre-approve the nature, extent, and cost of all non-audit services provided by theindependent registered public accounting firm.
/s/ JAMES W. PETERSJames W. PetersExecutive Vice President and Chief Financial OfficerFebruary 12, 2019
104
MANAGEMENT'S REPORT ON INTERNAL CONTROL OVER FINANCIAL REPORTING
The management of Whirlpool Corporation is responsible for establishing and maintaining adequate internal control over financial reporting asdefined in Rules 13a – 15(f) and 15d – 15(f) under the Securities Exchange Act of 1934. Whirlpool's internal control system is designed to providereasonable assurance to Whirlpool's management and board of directors regarding the reliability of financial reporting and the preparation and fairpresentation of published financial statements.
All internal control systems, no matter how well designed, have inherent limitations. Therefore, even those systems determined to be effective canprovide only reasonable assurance with respect to financial statement preparation and presentation.
The management of Whirlpool assessed the effectiveness of Whirlpool's internal control over financial reporting as of December 31, 2018 . Inmaking this assessment, it used the criteria set forth by the Committee of Sponsoring Organizations of the Treadway Commission (COSO) inInternal Control—Integrated Framework (2013 Framework). Based on the assessment and those criteria, management believes that Whirlpoolmaintained effective internal control over financial reporting as of December 31, 2018 .
Whirlpool's independent registered public accounting firm has issued an audit report on its assessment of Whirlpool's internal control over financialreporting. This report appears on page 107.
/s/ MARC R. BITZER /s/ JAMES W. PETERSMarc R. Bitzer James W. PetersChairman of the Board, President and Chief Executive Officer Executive Vice President and Chief Financial OfficerFebruary 12, 2019 February 12, 2019
105
REPORT OF INDEPENDENT REGISTERED PUBLIC ACCOUNTING FIRM
To the Shareholders and Board of Directors of Whirlpool Corporation
Opinion on the Financial StatementsWe have audited the accompanying consolidated balance sheets of Whirlpool Corporation (the Company) as of December 31, 2018 and 2017 , therelated consolidated statements of income (loss), comprehensive income (loss), shareholders' equity and cash flows for each of the three years inthe period ended December 31, 2018 , and the related notes and financial statement schedule listed in the index at Item 15(a) (collectively referredto as the "financial statements"). In our opinion, the financial statements present fairly, in all material respects, the consolidated financial position atDecember 31, 2018 and 2017 , and the consolidated results of its operations and its cash flows for each of the three years in the period endedDecember 31, 2018 , in conformity with U.S. generally accepted accounting principles.
We also have audited, in accordance with the standards of the Public Company Accounting Oversight Board (United States) (PCAOB), theCompany's internal control over financial reporting as of December 31, 2018 , based on criteria established in Internal Control-Integrated Frameworkissued by the Committee of Sponsoring Organizations of the Treadway Commission (2013 framework) and our report dated February 12, 2019expressed an unqualified opinion thereon.
Basis for OpinionThese financial statements are the responsibility of the Company's management. Our responsibility is to express an opinion on the Company'sfinancial statements based on our audits. We are a public accounting firm registered with the PCAOB and are required to be independent withrespect to the Company in accordance with the U.S. federal securities laws and the applicable rules and regulations of the Securities and ExchangeCommission and the PCAOB.
We conducted our audits in accordance with the standards of the PCAOB. Those standards require that we plan and perform the audit to obtainreasonable assurance about whether the financial statements are free of material misstatement, whether due to error or fraud. Our audits includedperforming procedures to assess the risks of material misstatement of the financial statements, whether due to error or fraud, and performingprocedures that respond to those risks. Such procedures included examining, on a test basis, evidence regarding the amounts and disclosures inthe financial statements. Our audits also included evaluating the accounting principles used and significant estimates made by management, as wellas evaluating the overall presentation of the financial statements. We believe that our audits provide a reasonable basis for our opinion.
/s/ Ernst & Young LLP
We have served as the Company's auditor since 1927.
Chicago, IllinoisFebruary 12, 2019
106
REPORT OF INDEPENDENT REGISTERED PUBLIC ACCOUNTING FIRM
To the Shareholders and Board of Directors of Whirlpool Corporation
Opinion on Internal Control over Financial ReportingWe have audited Whirlpool Corporation's internal control over financial reporting as of December 31, 2018 , based on criteria established in InternalControl-Integrated Framework issued by the Committee of Sponsoring Organizations of the Treadway Commission (2013 framework) (the COSOcriteria). In our opinion, Whirlpool Corporation (the Company) maintained, in all material respects, effective internal control over financial reporting asof December 31, 2018 , based on the COSO criteria.
We also have audited, in accordance with the standards of the Public Company Accounting Oversight Board (United States) (PCAOB), theconsolidated balance sheets of the Company as of December 31, 2018 and 2017 , the related consolidated statements of income (loss),comprehensive income (loss), shareholders' equity and cash flows for each of the three years in the period ended December 31, 2018 , and therelated notes and financial statement schedule listed in the index at Item 15(a) and our report dated February 12, 2019 expressed an unqualifiedopinion thereon.
Basis for OpinionThe Company's management is responsible for maintaining effective internal control over financial reporting and for its assessment of theeffectiveness of internal control over financial reporting included in the accompanying Management's Report on Internal Control over FinancialReporting. Our responsibility is to express an opinion on the Company's internal control over financial reporting based on our audit. We are a publicaccounting firm registered with the PCAOB and are required to be independent with respect to the Company in accordance with the U.S. federalsecurities laws and the applicable rules and regulations of the Securities and Exchange Commission and the PCAOB.
We conducted our audit in accordance with the standards of the PCAOB. Those standards require that we plan and perform the audit to obtainreasonable assurance about whether effective internal control over financial reporting was maintained in all material respects.
Our audit included obtaining an understanding of internal control over financial reporting, assessing the risk that a material weakness exists, testingand evaluating the design and operating effectiveness of internal control based on the assessed risk, and performing such other procedures as weconsidered necessary in the circumstances. We believe that our audit provides a reasonable basis for our opinion.
Definition and Limitations of Internal Control Over Financial ReportingA company's internal control over financial reporting is a process designed to provide reasonable assurance regarding the reliability of financialreporting and the preparation of financial statements for external purposes in accordance with generally accepted accounting principles. Acompany's internal control over financial reporting includes those policies and procedures that (1) pertain to the maintenance of records that, inreasonable detail, accurately and fairly reflect the transactions and dispositions of the assets of the company; (2) provide reasonable assurance thattransactions are recorded as necessary to permit preparation of financial statements in accordance with generally accepted accounting principles,and that receipts and expenditures of the company are being made only in accordance with authorizations of management and directors of thecompany; and (3) provide reasonable assurance regarding prevention or timely detection of unauthorized acquisition, use, or disposition of thecompany's assets that could have a material effect on the financial statements.
Because of its inherent limitations, internal control over financial reporting may not prevent or detect misstatements. Also, projections of anyevaluation of effectiveness to future periods are subject to the risk that controls may become inadequate because of changes in conditions, or thatthe degree of compliance with the policies or procedures may deteriorate.
/s/ Ernst & Young LLP
Chicago, IllinoisFebruary 12, 2019
107
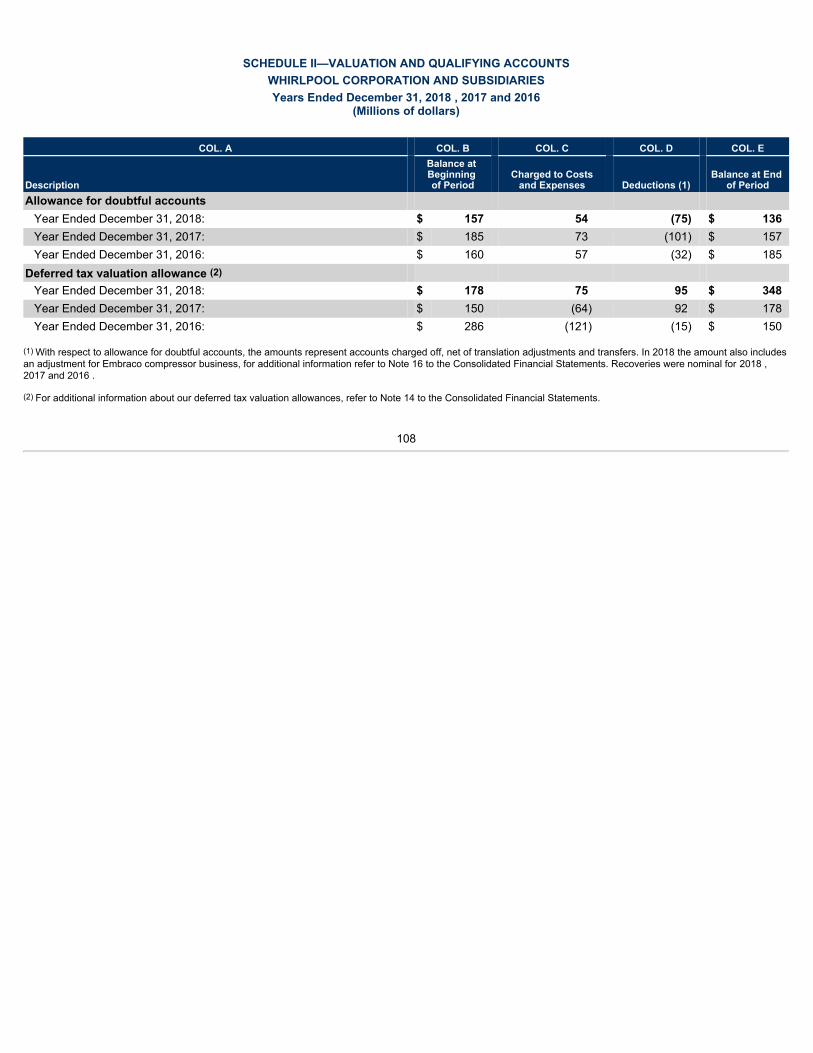
SCHEDULE II—VALUATION AND QUALIFYING ACCOUNTSWHIRLPOOL CORPORATION AND SUBSIDIARIESYears Ended December 31, 2018 , 2017 and 2016
(Millions of dollars)
COL. A COL. B COL. C COL. D COL. E
Description
Balance at Beginning of Period
Charged to Costsand Expenses Deductions (1)
Balance at End of Period
Allowance for doubtful accounts Year Ended December 31, 2018: $ 157 54 (75) $ 136Year Ended December 31, 2017: $ 185 73 (101) $ 157Year Ended December 31, 2016: $ 160 57 (32) $ 185
Deferred tax valuation allowance (2) Year Ended December 31, 2018: $ 178 75 95 $ 348Year Ended December 31, 2017: $ 150 (64) 92 $ 178Year Ended December 31, 2016: $ 286 (121) (15) $ 150
(1) With respect to allowance for doubtful accounts, the amounts represent accounts charged off, net of translation adjustments and transfers. In 2018 the amount also includesan adjustment for Embraco compressor business, for additional information refer to Note 16 to the Consolidated Financial Statements. Recoveries were nominal for 2018 ,2017 and 2016 .
(2) For additional information about our deferred tax valuation allowances, refer to Note 14 to the Consolidated Financial Statements.
108

[THIS PAGE INTENTIONALLY LEFT BLANK]
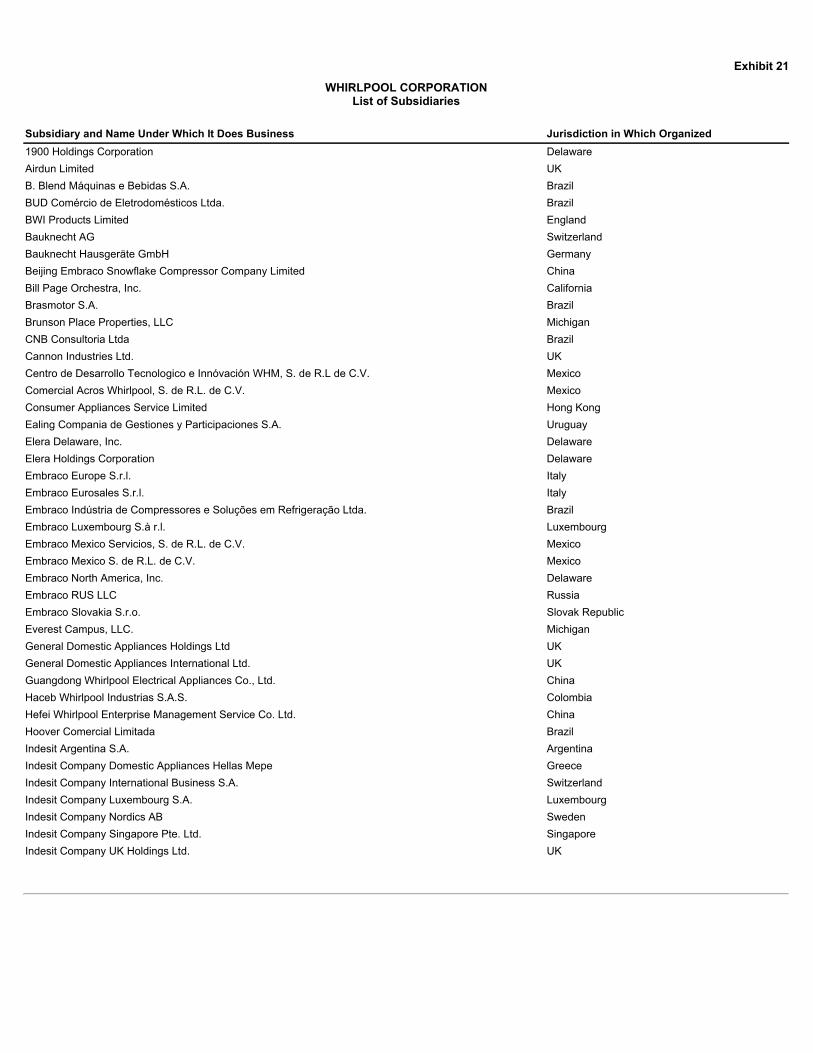
Exhibit 21
WHIRLPOOL CORPORATIONList of Subsidiaries
Subsidiary and Name Under Which It Does Business Jurisdiction in Which Organized 1900 Holdings Corporation DelawareAirdun Limited UKB. Blend Máquinas e Bebidas S.A. BrazilBUD Comércio de Eletrodomésticos Ltda. BrazilBWI Products Limited EnglandBauknecht AG SwitzerlandBauknecht Hausgeräte GmbH GermanyBeijing Embraco Snowflake Compressor Company Limited ChinaBill Page Orchestra, Inc. CaliforniaBrasmotor S.A. BrazilBrunson Place Properties, LLC MichiganCNB Consultoria Ltda BrazilCannon Industries Ltd. UKCentro de Desarrollo Tecnologico e Innóvación WHM, S. de R.L de C.V. MexicoComercial Acros Whirlpool, S. de R.L. de C.V. MexicoConsumer Appliances Service Limited Hong KongEaling Compania de Gestiones y Participaciones S.A. UruguayElera Delaware, Inc. DelawareElera Holdings Corporation DelawareEmbraco Europe S.r.l. ItalyEmbraco Eurosales S.r.l. ItalyEmbraco Indústria de Compressores e Soluções em Refrigeração Ltda. BrazilEmbraco Luxembourg S.à r.l. LuxembourgEmbraco Mexico Servicios, S. de R.L. de C.V. MexicoEmbraco Mexico S. de R.L. de C.V. MexicoEmbraco North America, Inc. DelawareEmbraco RUS LLC RussiaEmbraco Slovakia S.r.o. Slovak RepublicEverest Campus, LLC. MichiganGeneral Domestic Appliances Holdings Ltd UKGeneral Domestic Appliances International Ltd. UKGuangdong Whirlpool Electrical Appliances Co., Ltd. ChinaHaceb Whirlpool Industrias S.A.S. ColombiaHefei Whirlpool Enterprise Management Service Co. Ltd. ChinaHoover Comercial Limitada BrazilIndesit Argentina S.A. ArgentinaIndesit Company Domestic Appliances Hellas Mepe GreeceIndesit Company International Business S.A. SwitzerlandIndesit Company Luxembourg S.A. LuxembourgIndesit Company Nordics AB SwedenIndesit Company Singapore Pte. Ltd. SingaporeIndesit Company UK Holdings Ltd. UK
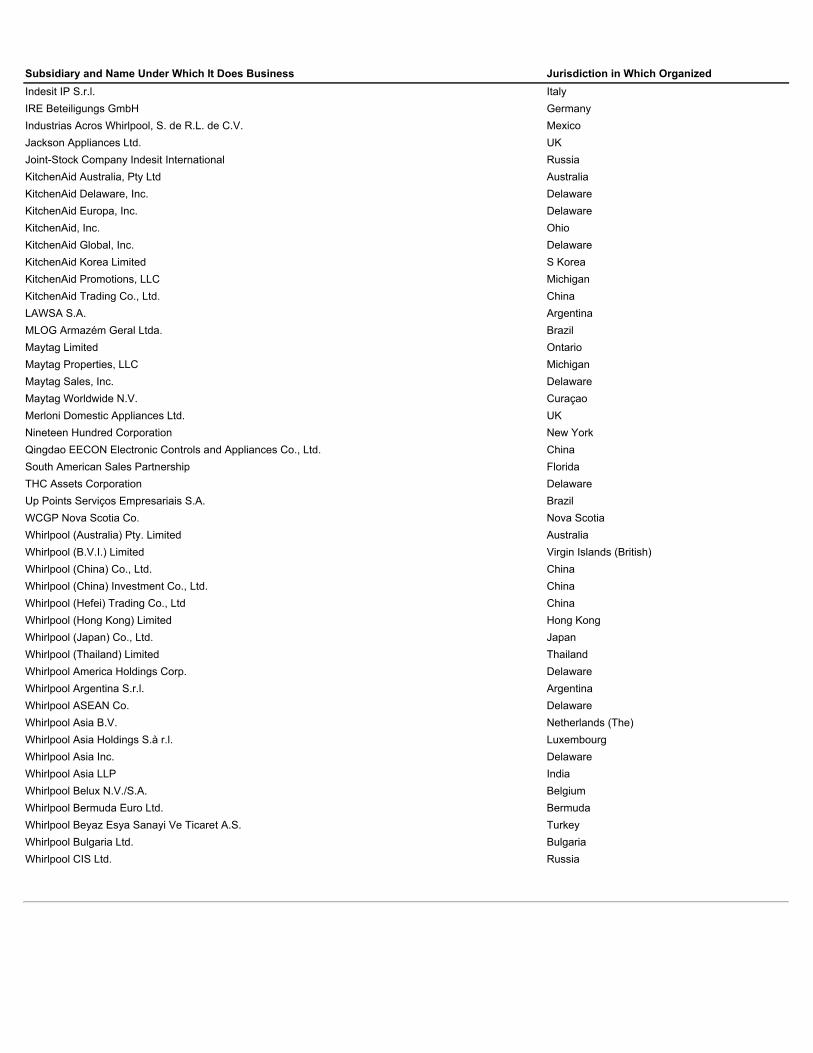
Subsidiary and Name Under Which It Does Business Jurisdiction in Which Organized Indesit IP S.r.l. ItalyIRE Beteiligungs GmbH GermanyIndustrias Acros Whirlpool, S. de R.L. de C.V. MexicoJackson Appliances Ltd. UKJoint-Stock Company Indesit International RussiaKitchenAid Australia, Pty Ltd AustraliaKitchenAid Delaware, Inc. DelawareKitchenAid Europa, Inc. DelawareKitchenAid, Inc. OhioKitchenAid Global, Inc. DelawareKitchenAid Korea Limited S KoreaKitchenAid Promotions, LLC MichiganKitchenAid Trading Co., Ltd. ChinaLAWSA S.A. ArgentinaMLOG Armazém Geral Ltda. BrazilMaytag Limited OntarioMaytag Properties, LLC MichiganMaytag Sales, Inc. DelawareMaytag Worldwide N.V. CuraçaoMerloni Domestic Appliances Ltd. UKNineteen Hundred Corporation New YorkQingdao EECON Electronic Controls and Appliances Co., Ltd. ChinaSouth American Sales Partnership FloridaTHC Assets Corporation DelawareUp Points Serviços Empresariais S.A. BrazilWCGP Nova Scotia Co. Nova ScotiaWhirlpool (Australia) Pty. Limited AustraliaWhirlpool (B.V.I.) Limited Virgin Islands (British)Whirlpool (China) Co., Ltd. ChinaWhirlpool (China) Investment Co., Ltd. ChinaWhirlpool (Hefei) Trading Co., Ltd ChinaWhirlpool (Hong Kong) Limited Hong KongWhirlpool (Japan) Co., Ltd. JapanWhirlpool (Thailand) Limited ThailandWhirlpool America Holdings Corp. DelawareWhirlpool Argentina S.r.l. ArgentinaWhirlpool ASEAN Co. DelawareWhirlpool Asia B.V. Netherlands (The)Whirlpool Asia Holdings S.à r.l. LuxembourgWhirlpool Asia Inc. DelawareWhirlpool Asia LLP IndiaWhirlpool Belux N.V./S.A. BelgiumWhirlpool Bermuda Euro Ltd. BermudaWhirlpool Beyaz Esya Sanayi Ve Ticaret A.S. TurkeyWhirlpool Bulgaria Ltd. BulgariaWhirlpool CIS Ltd. Russia
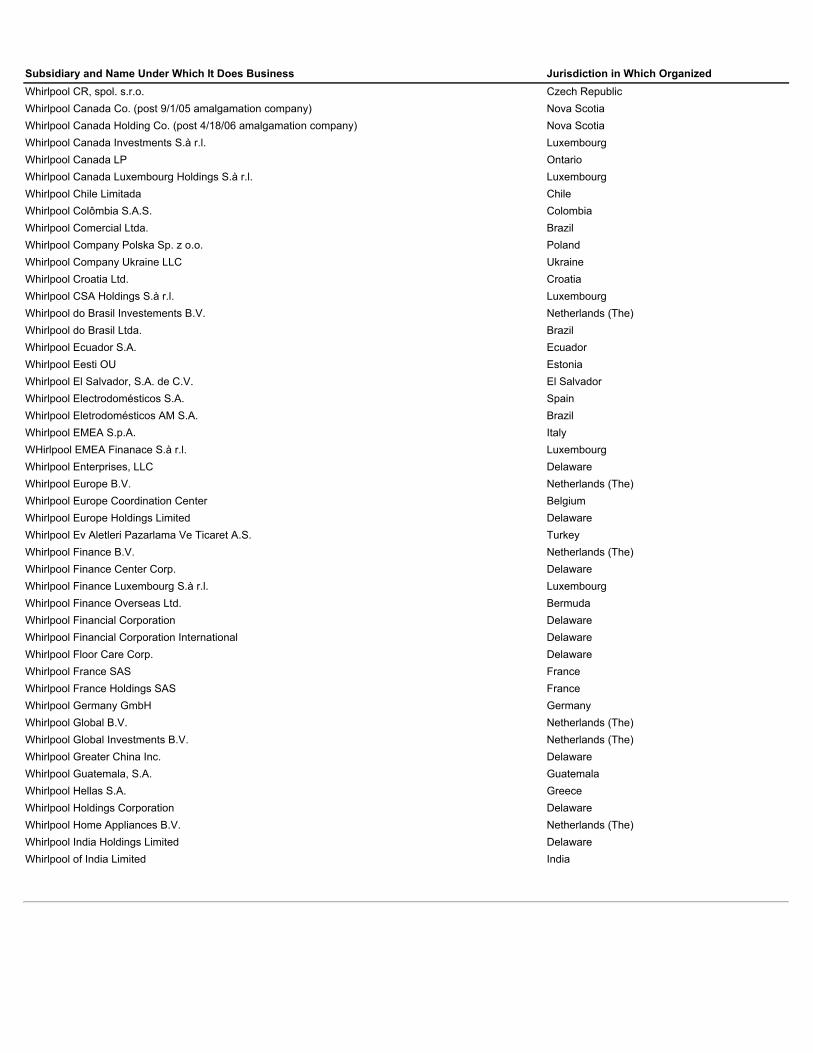
Subsidiary and Name Under Which It Does Business Jurisdiction in Which Organized Whirlpool CR, spol. s.r.o. Czech RepublicWhirlpool Canada Co. (post 9/1/05 amalgamation company) Nova ScotiaWhirlpool Canada Holding Co. (post 4/18/06 amalgamation company) Nova ScotiaWhirlpool Canada Investments S.à r.l. LuxembourgWhirlpool Canada LP OntarioWhirlpool Canada Luxembourg Holdings S.à r.l. LuxembourgWhirlpool Chile Limitada ChileWhirlpool Colômbia S.A.S. ColombiaWhirlpool Comercial Ltda. BrazilWhirlpool Company Polska Sp. z o.o. PolandWhirlpool Company Ukraine LLC UkraineWhirlpool Croatia Ltd. CroatiaWhirlpool CSA Holdings S.à r.l. LuxembourgWhirlpool do Brasil Investements B.V. Netherlands (The)Whirlpool do Brasil Ltda. BrazilWhirlpool Ecuador S.A. EcuadorWhirlpool Eesti OU EstoniaWhirlpool El Salvador, S.A. de C.V. El SalvadorWhirlpool Electrodomésticos S.A. SpainWhirlpool Eletrodomésticos AM S.A. BrazilWhirlpool EMEA S.p.A. ItalyWHirlpool EMEA Finanace S.à r.l. LuxembourgWhirlpool Enterprises, LLC DelawareWhirlpool Europe B.V. Netherlands (The)Whirlpool Europe Coordination Center BelgiumWhirlpool Europe Holdings Limited DelawareWhirlpool Ev Aletleri Pazarlama Ve Ticaret A.S. TurkeyWhirlpool Finance B.V. Netherlands (The)Whirlpool Finance Center Corp. DelawareWhirlpool Finance Luxembourg S.à r.l. LuxembourgWhirlpool Finance Overseas Ltd. BermudaWhirlpool Financial Corporation DelawareWhirlpool Financial Corporation International DelawareWhirlpool Floor Care Corp. DelawareWhirlpool France SAS FranceWhirlpool France Holdings SAS FranceWhirlpool Germany GmbH GermanyWhirlpool Global B.V. Netherlands (The)Whirlpool Global Investments B.V. Netherlands (The)Whirlpool Greater China Inc. DelawareWhirlpool Guatemala, S.A. GuatemalaWhirlpool Hellas S.A. GreeceWhirlpool Holdings Corporation DelawareWhirlpool Home Appliances B.V. Netherlands (The)Whirlpool India Holdings Limited DelawareWhirlpool of India Limited India
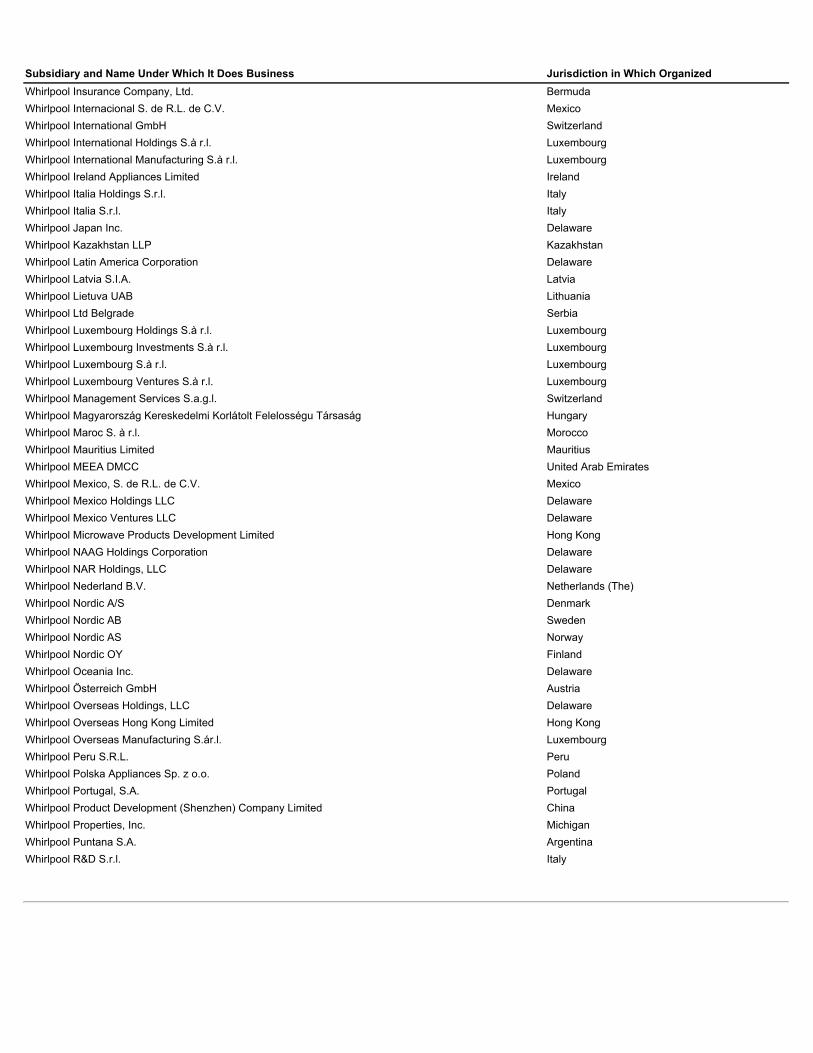
Subsidiary and Name Under Which It Does Business Jurisdiction in Which Organized Whirlpool Insurance Company, Ltd. BermudaWhirlpool Internacional S. de R.L. de C.V. MexicoWhirlpool International GmbH SwitzerlandWhirlpool International Holdings S.à r.l. LuxembourgWhirlpool International Manufacturing S.à r.l. LuxembourgWhirlpool Ireland Appliances Limited IrelandWhirlpool Italia Holdings S.r.l. ItalyWhirlpool Italia S.r.l. ItalyWhirlpool Japan Inc. DelawareWhirlpool Kazakhstan LLP KazakhstanWhirlpool Latin America Corporation DelawareWhirlpool Latvia S.I.A. LatviaWhirlpool Lietuva UAB LithuaniaWhirlpool Ltd Belgrade SerbiaWhirlpool Luxembourg Holdings S.à r.l. LuxembourgWhirlpool Luxembourg Investments S.à r.l. LuxembourgWhirlpool Luxembourg S.à r.l. LuxembourgWhirlpool Luxembourg Ventures S.à r.l. LuxembourgWhirlpool Management Services S.a.g.l. SwitzerlandWhirlpool Magyarország Kereskedelmi Korlátolt Felelosségu Társaság HungaryWhirlpool Maroc S. à r.l. MoroccoWhirlpool Mauritius Limited MauritiusWhirlpool MEEA DMCC United Arab EmiratesWhirlpool Mexico, S. de R.L. de C.V. MexicoWhirlpool Mexico Holdings LLC DelawareWhirlpool Mexico Ventures LLC DelawareWhirlpool Microwave Products Development Limited Hong KongWhirlpool NAAG Holdings Corporation DelawareWhirlpool NAR Holdings, LLC DelawareWhirlpool Nederland B.V. Netherlands (The)Whirlpool Nordic A/S DenmarkWhirlpool Nordic AB SwedenWhirlpool Nordic AS NorwayWhirlpool Nordic OY FinlandWhirlpool Oceania Inc. DelawareWhirlpool Österreich GmbH AustriaWhirlpool Overseas Holdings, LLC DelawareWhirlpool Overseas Hong Kong Limited Hong KongWhirlpool Overseas Manufacturing S.ár.l. LuxembourgWhirlpool Peru S.R.L. PeruWhirlpool Polska Appliances Sp. z o.o. PolandWhirlpool Portugal, S.A. PortugalWhirlpool Product Development (Shenzhen) Company Limited ChinaWhirlpool Properties, Inc. MichiganWhirlpool Puntana S.A. ArgentinaWhirlpool R&D S.r.l. Italy
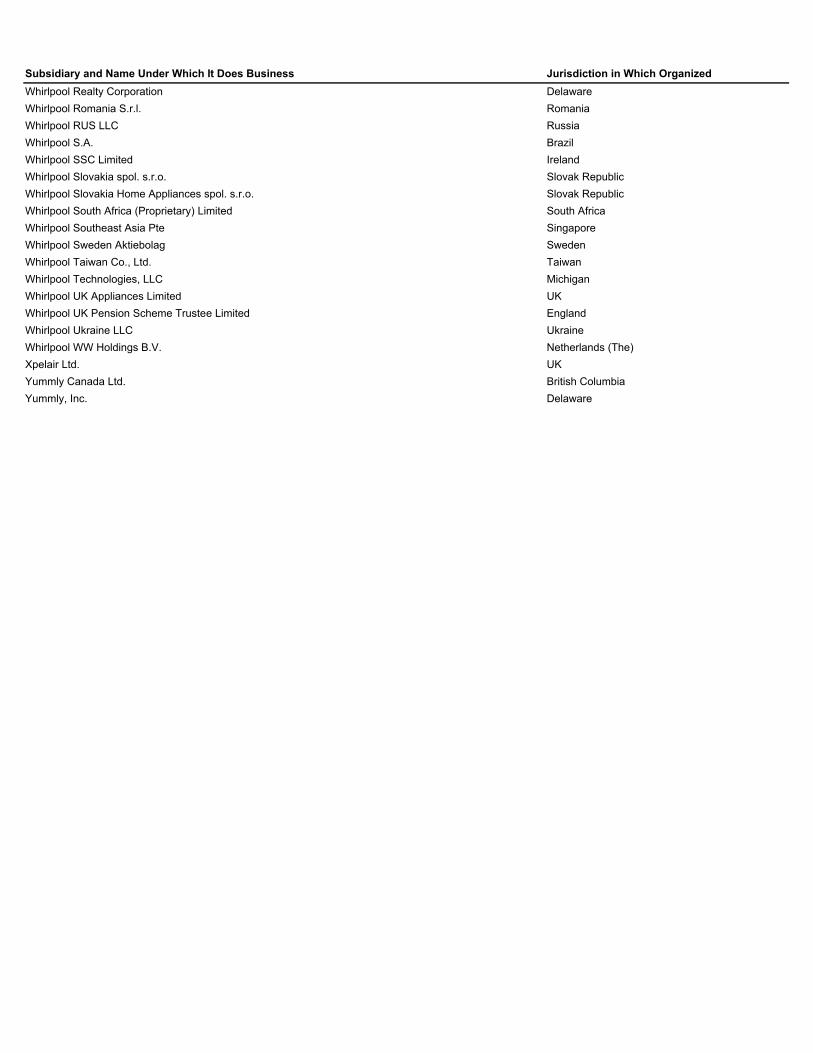
Subsidiary and Name Under Which It Does Business Jurisdiction in Which Organized Whirlpool Realty Corporation DelawareWhirlpool Romania S.r.l. RomaniaWhirlpool RUS LLC RussiaWhirlpool S.A. BrazilWhirlpool SSC Limited IrelandWhirlpool Slovakia spol. s.r.o. Slovak RepublicWhirlpool Slovakia Home Appliances spol. s.r.o. Slovak RepublicWhirlpool South Africa (Proprietary) Limited South AfricaWhirlpool Southeast Asia Pte SingaporeWhirlpool Sweden Aktiebolag SwedenWhirlpool Taiwan Co., Ltd. TaiwanWhirlpool Technologies, LLC MichiganWhirlpool UK Appliances Limited UKWhirlpool UK Pension Scheme Trustee Limited EnglandWhirlpool Ukraine LLC UkraineWhirlpool WW Holdings B.V. Netherlands (The)Xpelair Ltd. UKYummly Canada Ltd. British ColumbiaYummly, Inc. Delaware
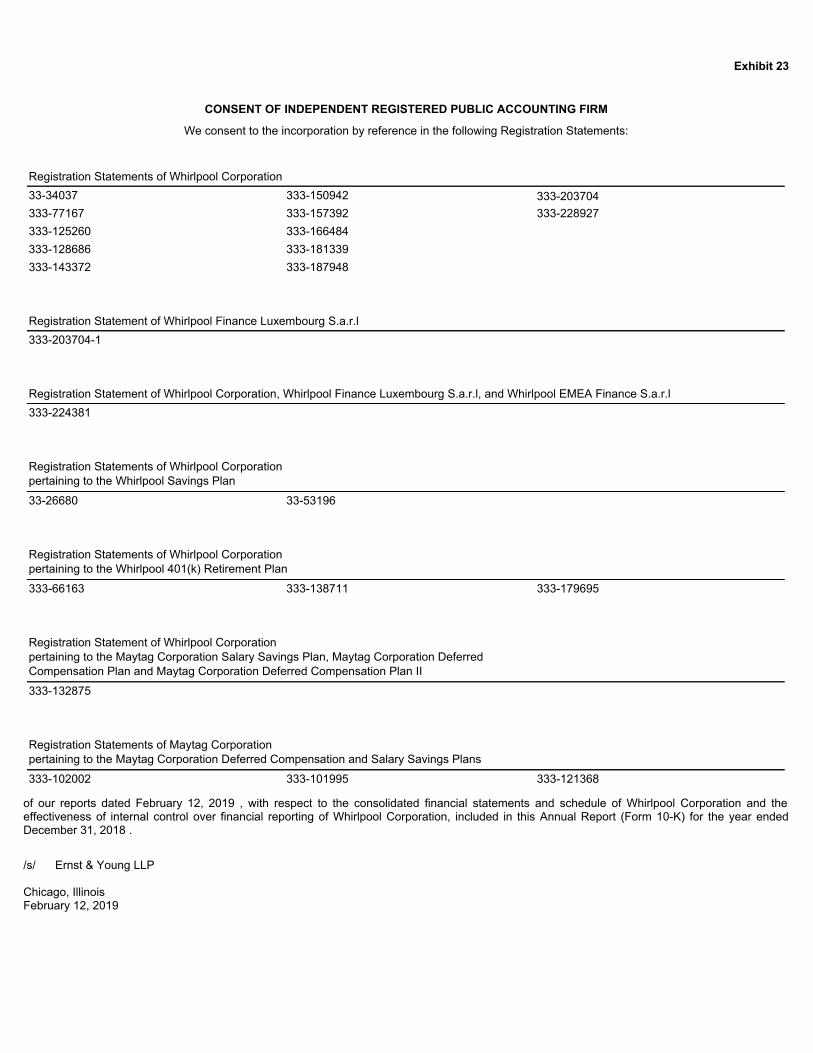
Exhibit 23
CONSENT OF INDEPENDENT REGISTERED PUBLIC ACCOUNTING FIRM
We consent to the incorporation by reference in the following Registration Statements:
Registration Statements of Whirlpool Corporation33-34037 333-150942 333-203704 333-77167 333-157392 333-228927333-125260 333-166484 333-128686 333-181339 333-143372 333-187948 Registration Statement of Whirlpool Finance Luxembourg S.a.r.l333-203704-1 Registration Statement of Whirlpool Corporation, Whirlpool Finance Luxembourg S.a.r.l, and Whirlpool EMEA Finance S.a.r.l333-224381 Registration Statements of Whirlpool Corporationpertaining to the Whirlpool Savings Plan33-26680 33-53196
Registration Statements of Whirlpool Corporationpertaining to the Whirlpool 401(k) Retirement Plan333-66163 333-138711 333-179695 Registration Statement of Whirlpool Corporationpertaining to the Maytag Corporation Salary Savings Plan, Maytag Corporation DeferredCompensation Plan and Maytag Corporation Deferred Compensation Plan II333-132875 Registration Statements of Maytag Corporationpertaining to the Maytag Corporation Deferred Compensation and Salary Savings Plans333-102002 333-101995 333-121368
of our reports dated February 12, 2019 , with respect to the consolidated financial statements and schedule of Whirlpool Corporation and theeffectiveness of internal control over financial reporting of Whirlpool Corporation, included in this Annual Report (Form 10-K) for the year endedDecember 31, 2018 .
/s/ Ernst & Young LLP
Chicago, IllinoisFebruary 12, 2019
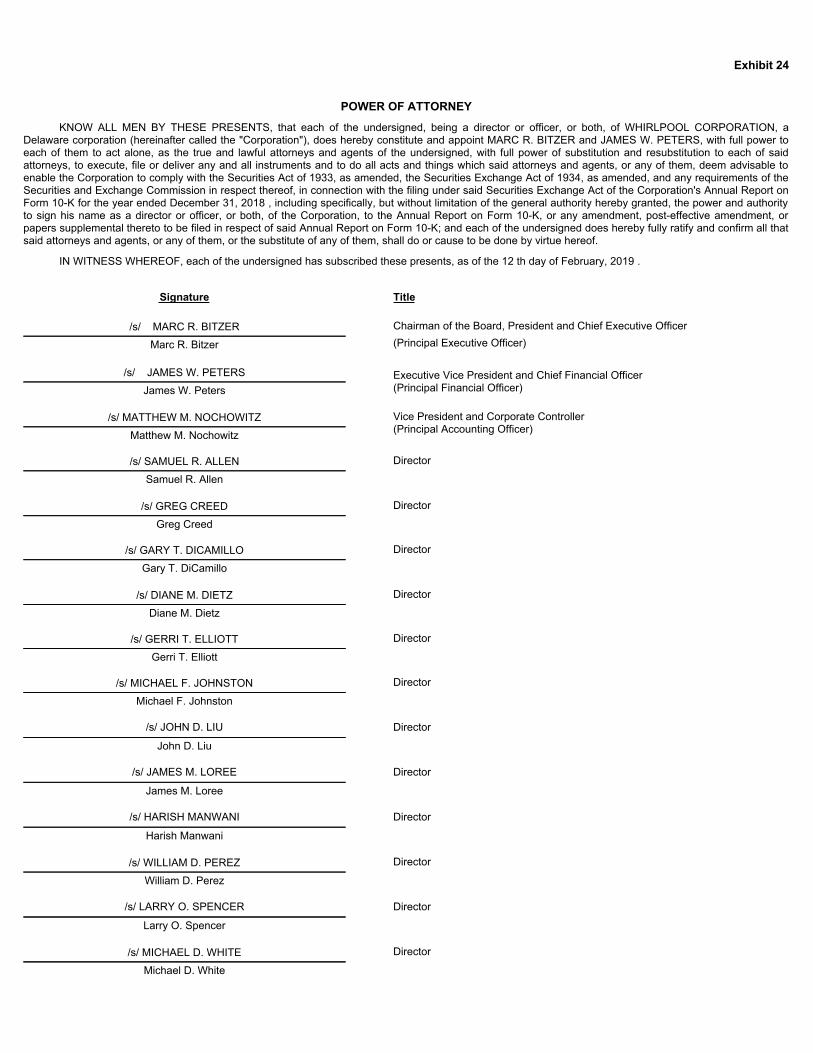
Exhibit 24
POWER OF ATTORNEYKNOW ALL MEN BY THESE PRESENTS, that each of the undersigned, being a director or officer, or both, of WHIRLPOOL CORPORATION, a
Delaware corporation (hereinafter called the "Corporation"), does hereby constitute and appoint MARC R. BITZER and JAMES W. PETERS, with full power toeach of them to act alone, as the true and lawful attorneys and agents of the undersigned, with full power of substitution and resubstitution to each of saidattorneys, to execute, file or deliver any and all instruments and to do all acts and things which said attorneys and agents, or any of them, deem advisable toenable the Corporation to comply with the Securities Act of 1933, as amended, the Securities Exchange Act of 1934, as amended, and any requirements of theSecurities and Exchange Commission in respect thereof, in connection with the filing under said Securities Exchange Act of the Corporation's Annual Report onForm 10-K for the year ended December 31, 2018 , including specifically, but without limitation of the general authority hereby granted, the power and authorityto sign his name as a director or officer, or both, of the Corporation, to the Annual Report on Form 10-K, or any amendment, post-effective amendment, orpapers supplemental thereto to be filed in respect of said Annual Report on Form 10-K; and each of the undersigned does hereby fully ratify and confirm all thatsaid attorneys and agents, or any of them, or the substitute of any of them, shall do or cause to be done by virtue hereof.
IN WITNESS WHEREOF, each of the undersigned has subscribed these presents, as of the 12 th day of February, 2019 .
Signature Title
/s/ MARC R. BITZER Chairman of the Board, President and Chief Executive Officer(Principal Executive Officer)Marc R. Bitzer
/s/ JAMES W. PETERS Executive Vice President and Chief Financial Officer
(Principal Financial Officer)James W. Peters
/s/ MATTHEW M. NOCHOWITZ Vice President and Corporate Controller (Principal Accounting Officer)Matthew M. Nochowitz
/s/ SAMUEL R. ALLEN Director
Samuel R. Allen
/s/ GREG CREED Director
Greg Creed
/s/ GARY T. DICAMILLO Director
Gary T. DiCamillo
/s/ DIANE M. DIETZ Director
Diane M. Dietz
/s/ GERRI T. ELLIOTT Director
Gerri T. Elliott
/s/ MICHAEL F. JOHNSTON Director
Michael F. Johnston /s/ JOHN D. LIU Director
John D. Liu /s/ JAMES M. LOREE Director
James M. Loree /s/ HARISH MANWANI Director
Harish Manwani
/s/ WILLIAM D. PEREZ Director
William D. Perez /s/ LARRY O. SPENCER Director
Larry O. Spencer
/s/ MICHAEL D. WHITE Director
Michael D. White
Exhibit 31.1
CERTIFICATION PURSUANT TO SECTION 302 OF THE SARBANES-OXLEY ACT OF 2002
I, Marc R. Bitzer, certify that:
1. I have reviewed this annual report on Form 10-K of Whirlpool Corporation;
2. Based on my knowledge, this report does not contain any untrue statement of a material fact or omit to state a material fact necessary tomake the statements made, in light of the circumstances under which such statements were made, not misleading with respect to the periodcovered by this report;
3. Based on my knowledge, the financial statements, and other financial information included in this report, fairly present in all materialrespects the financial condition, results of operations and cash flows of the registrant, as of, and for, the periods presented in this report;
4. The registrant's other certifying officer and I are responsible for establishing and maintaining disclosure controls and procedures (as definedin Exchange Act Rules 13a-15(e) and 15d-15(e)) and internal control over financial reporting (as defined in Exchange Act Rule 13a-15(f)and 15d-15(f)) for the registrant and have:
(a) Designed such disclosure controls and procedures, or caused such disclosure controls and procedures to be designed under oursupervision, to ensure that material information relating to the registrant, including its consolidated subsidiaries, is made known tous by others within those entities, particularly during the period in which this report is being prepared;
(b) Designed such internal control over financial reporting, or caused such internal control over financial reporting to be designed underour supervision, to provide reasonable assurance regarding the reliability of financial reporting and the preparation of financialstatements for external purposes in accordance with generally accepted accounting principles;
(c) Evaluated the effectiveness of the registrant's disclosure controls and procedures and presented in this report our conclusionsabout the effectiveness of the disclosure controls and procedures, as of the end of the period covered by this report based on suchevaluation; and
(d) Disclosed in this report any change in the registrant's internal control over financial reporting that occurred during the registrant'smost recent fiscal quarter (the registrant's fourth fiscal quarter in the case of an annual report) that has materially affected, or isreasonably likely to materially affect, the registrant's internal control over financial reporting; and
5. The registrant's other certifying officer and I have disclosed, based on our most recent evaluation of internal control over financial reporting,to the registrant's auditors and the audit committee of the registrant's board of directors (or persons performing the equivalent functions):
(a) All significant deficiencies and material weaknesses in the design or operation of internal control over financial reporting which arereasonably likely to adversely affect the registrant's ability to record, process, summarize and report financial information; and
(b) Any fraud, whether or not material, that involves management or other employees who have a significant role in the registrant'sinternal control over financial reporting.
Date: February 12, 2019 /s/ MARC R. BITZERName: Marc R. BitzerTitle: Chairman of the Board, President and Chief Executive Officer
Exhibit 31.2
CERTIFICATION PURSUANT TO SECTION 302 OF THE SARBANES-OXLEY ACT OF 2002
I, James W. Peters, certify that:
1. I have reviewed this annual report on Form 10-K of Whirlpool Corporation;
2. Based on my knowledge, this report does not contain any untrue statement of a material fact or omit to state a material fact necessary tomake the statements made, in light of the circumstances under which such statements were made, not misleading with respect to the periodcovered by this report;
3. Based on my knowledge, the financial statements, and other financial information included in this report, fairly present in all materialrespects the financial condition, results of operations and cash flows of the registrant, as of, and for, the periods presented in this report;
4. The registrant's other certifying officer and I are responsible for establishing and maintaining disclosure controls and procedures (as definedin Exchange Act Rules 13a-15(e) and 15d-15(e)) and internal control over financial reporting (as defined in Exchange Act Rule 13a-15(f)and 15d-15(f)) for the registrant and have:
(a) Designed such disclosure controls and procedures, or caused such disclosure controls and procedures to be designed under oursupervision, to ensure that material information relating to the registrant, including its consolidated subsidiaries, is made known tous by others within those entities, particularly during the period in which this report is being prepared;
(b) Designed such internal control over financial reporting, or caused such internal control over financial reporting to be designed underour supervision, to provide reasonable assurance regarding the reliability of financial reporting and the preparation of financialstatements for external purposes in accordance with generally accepted accounting principles;
(c) Evaluated the effectiveness of the registrant's disclosure controls and procedures and presented in this report our conclusionsabout the effectiveness of the disclosure controls and procedures, as of the end of the period covered by this report based on suchevaluation; and
(d) Disclosed in this report any change in the registrant's internal control over financial reporting that occurred during the registrant'smost recent fiscal quarter (the registrant's fourth fiscal quarter in the case of an annual report) that has materially affected, or isreasonably likely to materially affect, the registrant's internal control over financial reporting; and
5. The registrant's other certifying officer and I have disclosed, based on our most recent evaluation of internal control over financial reporting,to the registrant's auditors and the audit committee of the registrant's board of directors (or persons performing the equivalent functions):
(a) All significant deficiencies and material weaknesses in the design or operation of internal control over financial reporting which arereasonably likely to adversely affect the registrant's ability to record, process, summarize and report financial information; and
(b) Any fraud, whether or not material, that involves management or other employees who have a significant role in the registrant'sinternal control over financial reporting.
Date: February 12, 2019 /s/ JAMES W. PETERSName: James W. PetersTitle: Executive Vice President and Chief Financial Officer
Exhibit 32.1
Certifications Pursuant to18 U.S.C. Section 1350,as Adopted Pursuant to Section 906 of theSarbanes-Oxley Act of 2002
In connection with the Annual Report on Form 10-K of Whirlpool Corporation ("Whirlpool") for the period ended December 31, 2018 as filed with theSecurities and Exchange Commission on the date hereof (the "Report"), Marc R. Bitzer, as Chief Executive Officer of Whirlpool, and James W.Peters, as Chief Financial Officer of Whirlpool, each hereby certifies, pursuant to 18 U.S.C. Section 1350, as adopted pursuant to Section 906 of theSarbanes-Oxley Act of 2002, that, to his knowledge:
1. The Report fully complies with the requirements of Section 13(a) or 15(d) of the Securities Exchange Act of 1934; and
2. The information contained in the Report fairly presents, in all material respects, the financial condition and results of operations of Whirlpool.
/s/ MARC R. BITZERName: Marc R. BitzerTitle: Chairman of the Board, President and Chief Executive Officer
Date: February 12, 2019 /s/ JAMES W. PETERSName: James W. PetersTitle: Executive Vice President and Chief Financial Officer
Date: February 12, 2019