OPEN ECONOMY MACROECONOMICS AMBA Macroeconomics Lecturer:Jack Wu.
Upload
robyn-websterCategory
view
219download
2
Where You Are!
Economics 201 – Principles of Macroeconomics
Tuesday and Thursday from 2:00 to 3:15pmDiscussion – Friday from 10:00am – 10:50am
Text: Macroeconomics, Principles & Applications, Hall & Lieberman, Cengage Learning, 6th edition.
Course website: http://www.terpconnect.umd.edu/~jneri/Econ201
Who Am I
Dr. John Neri
Office Location: 1102B Morrill Hall
Office Hours: T and Th: 3:30pm - 4:30pm

Illness or Family Emergency & Exams Important Steps to follow:• Pre-Notification: If you are sick or have a family emergency and cannot take an exam, you must contact Professor Neri before the exam. You must fill out the Request for Excuse form.
• Written Verification: Illness or family emergency must be subsequently verified in writing by a physician, the Student Health Center
• If both steps are not followed, you will not be excused from the exam

• Students using the DSS facility must meet with me within the first 2 weeks of classes.

Advice!!!• Course is cumulative.• Important to keep up with the lectures,
and readings each week.• We will have practice quizzes in the
Friday discussion and review the answers.
• The collection of quizzes from the Friday discussion constitutes a practice exam. I do not post old exams.
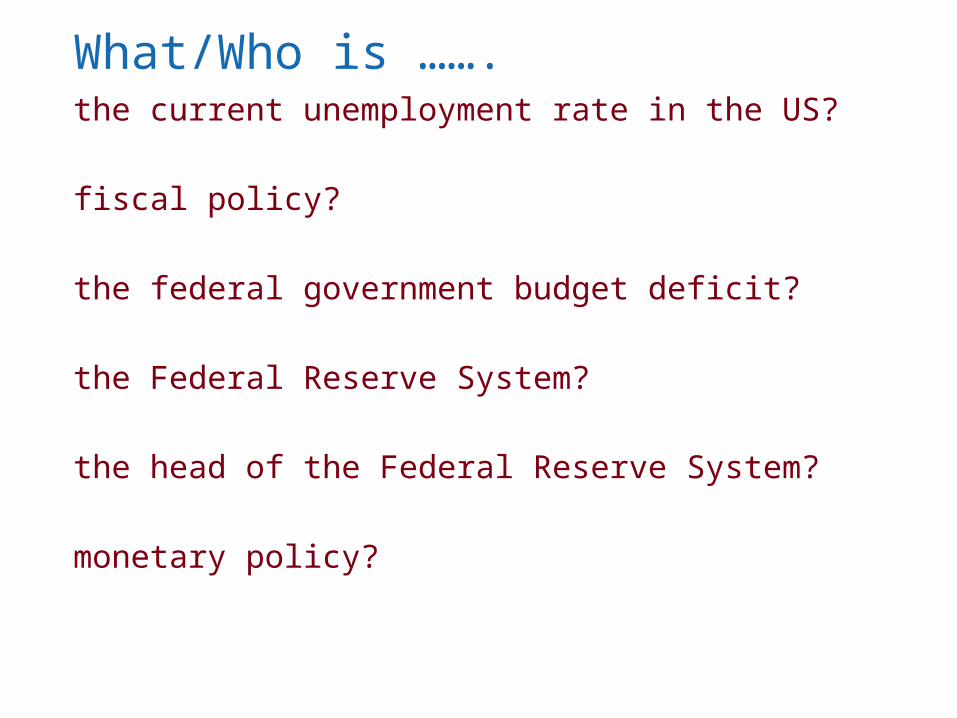
What/Who is …….the current unemployment rate in the US?
fiscal policy?
the federal government budget deficit?
the Federal Reserve System?
the head of the Federal Reserve System?
monetary policy?
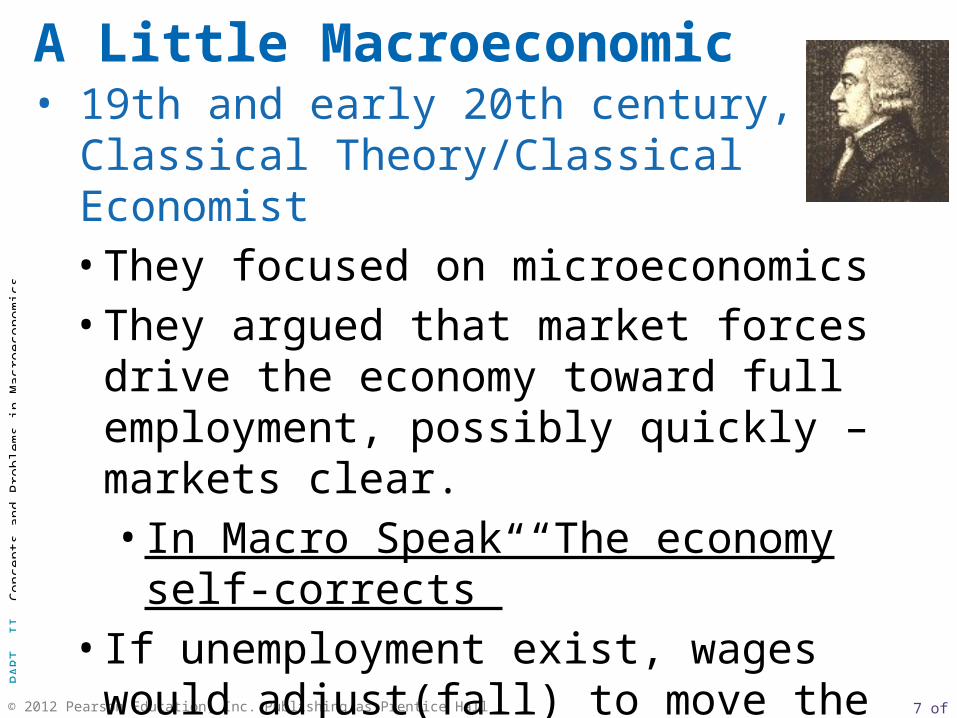
A Little Macroeconomic History: • 19th and early 20th century, Classical
Theory/Classical Economist• They focused on microeconomics• They argued that market forces drive the
economy toward full employment, possibly quickly – markets clear. • In Macro Speak “The economy self-
corrects”• If unemployment exist, wages would
adjust(fall) to move the economy back to full employment.
A Little Macroeconomic History:
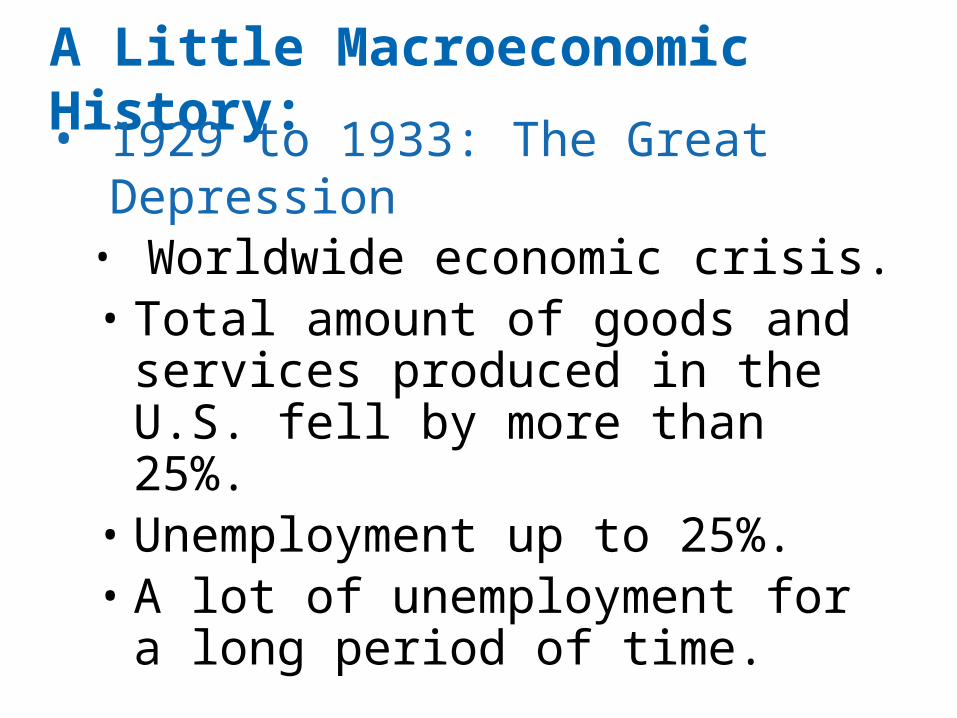
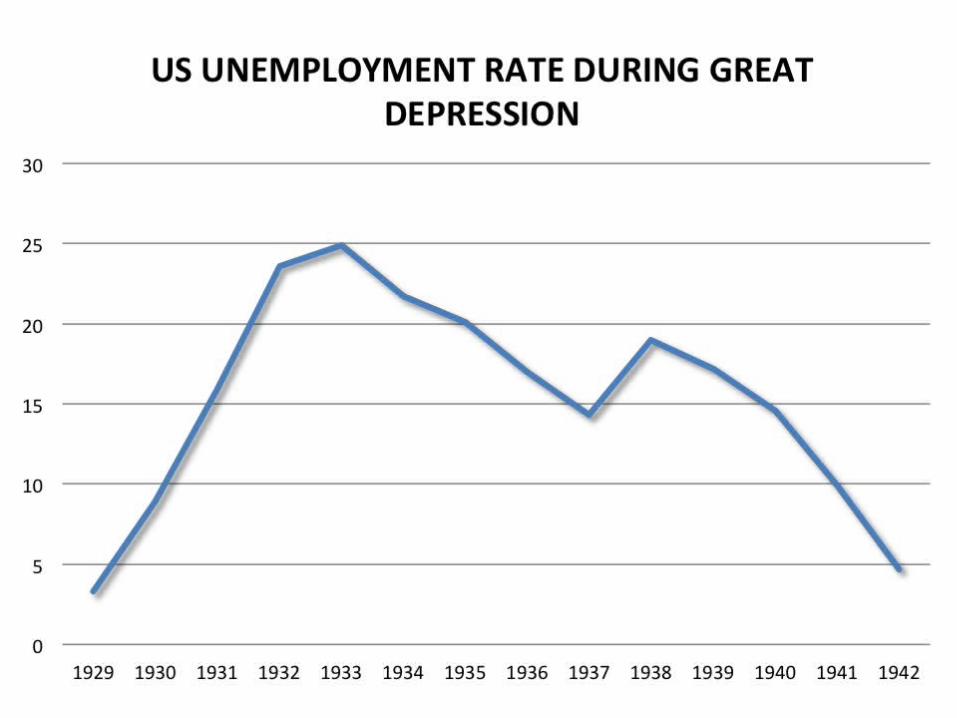
• 1929 to 1933: The Great Depression • Worldwide economic crisis. • Total amount of goods and services
produced in the U.S. fell by more than 25%.
• Unemployment up to 25%.• A lot of unemployment for a long
period of time.
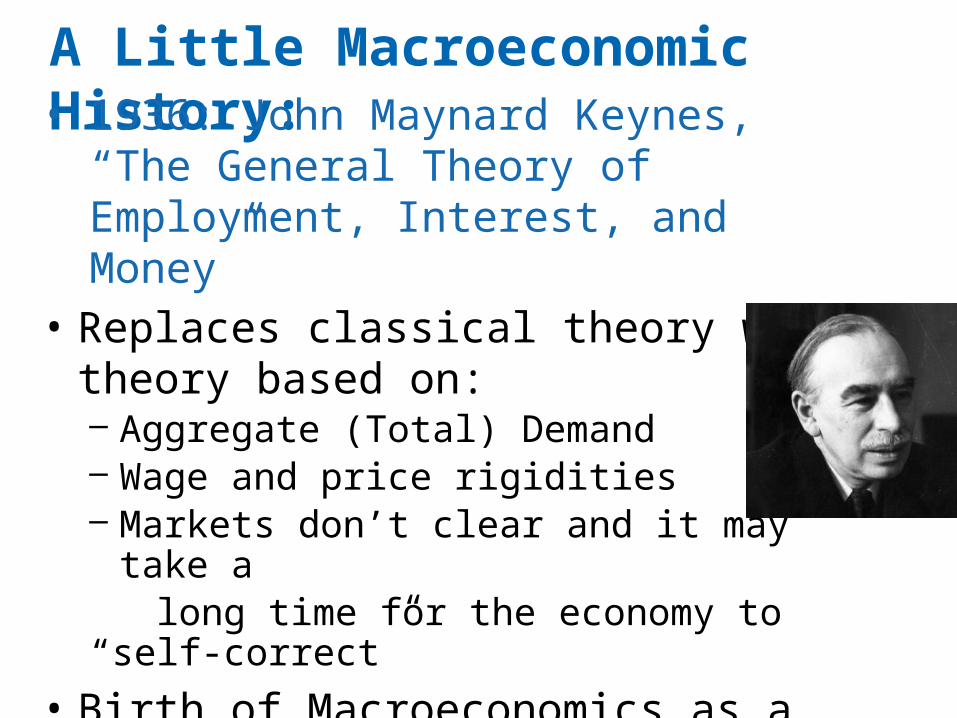
A Little Macroeconomic History: • 1936: John Maynard Keynes, “The
General Theory of Employment, Interest, and Money”
• Replaces classical theory with theory based on:– Aggregate (Total) Demand – Wage and price rigidities– Markets don’t clear and it may take a long time for the economy to “self-correct”
• Birth of Macroeconomics as a field separate from microeconomics
A Little Macroeconomic History:
• Keynes believed government should intervene in the economy to stimulate the level of output and employment – During periods of low private demand, the
government should take action to stimulate aggregate (total) demand to lift the economy to full employment.
– Keynes was not a socialist. He was a capitalist. He simply felt capitalism could be unstable.
A Little Macroeconomic History:
• Private demand and Public demand? • • What can the government do to stimulate
aggregate total demand (private and public) to lift the economy out of recession?
• • Big, Big Question – does this stuff work?
• Almost 80 years later still debating this!
A Little Macroeconomic History:
• 1940’s – WWII – large increase in government spending (public demand)
• 1950’s – Korean War (more public demand)• 1960’s – Kennedy tax cut in the early 60’s (very
Keynesian, cut taxes to stimulates private demand). 1960’s very prosperous decade.
• 1960’s – Johnson, Great Society/ Viet Nam – large increases in government spending (Public demand). But this lead to inflation.
A Little Macroeconomic History:
• 1970’s – Oil price increase. • A supply shock to the economy and a
shock to macroeconomics. • Challenge to Keynes.
• 1980’s – Reagan, Supply-side Economics. Cut taxes, people will work harder, invest more, produce more. Incomes grow and tax revenues grow.
• 2008-2009 - Keynesian ideas once again at the center of heated debate

Chapter 5
What Macroeconomics Tries to Explain:
• Macroeconomics examines the economy as a whole.
• Focuses on total national income instead of individual income.
• Deals with aggregates (total) such as aggregate consumption and investment.
• Looks at the overall level of prices instead of individual prices.
Examples of Macroeconomic Questions
• What causes inflation?• Why is the unemployment rate sometimes
high and sometimes low?• Why do some national economies grow faster
than other national economies?• What might cause interest rates to be low one
year and high the next?• How do changes in the money supply affect
the economy?• How do changes in government spending and
tax policy affect the economy
Microeconomics • Examines the functioning of individual industries
and the behavior of individual decision-making units – a business firm, an individual, an industry, a single market. For example:
What level of output does a firm produce? What price does a firm charge for the goods it produces? How does a consumer determine how much of a good
he or she will buy?
INTRODUCTION TO MACROECONOMICS
aggregate behavior The behavior of all households and firms together.
sticky prices Prices that do not always adjust rapidly to maintain equality between quantity supplied and quantity demanded.
Three Major Macroeconomic Goals
• Economic growth – Growth in Output • how much we produce and can we keep
it growing
• High employment • Low unemployment
• Stable prices • Low stable inflation
Economic Growth1. Economic Growth
– Defined as the increase in total production of goods and services in an economy that occurs over long periods of time
• Real Gross Domestic Product (real GDP)– Total quantity of goods and services
produced in a country over a year– Also called “total output”
Economic Growth• When real GDP rises faster than the
population, output per person rises- GDP per Capita rises- Average standard of living rises
• From 1929 to mid-2011– Real GDP increased dramatically– Real GDP per Capita increased
dramatically– Rate of growth varied
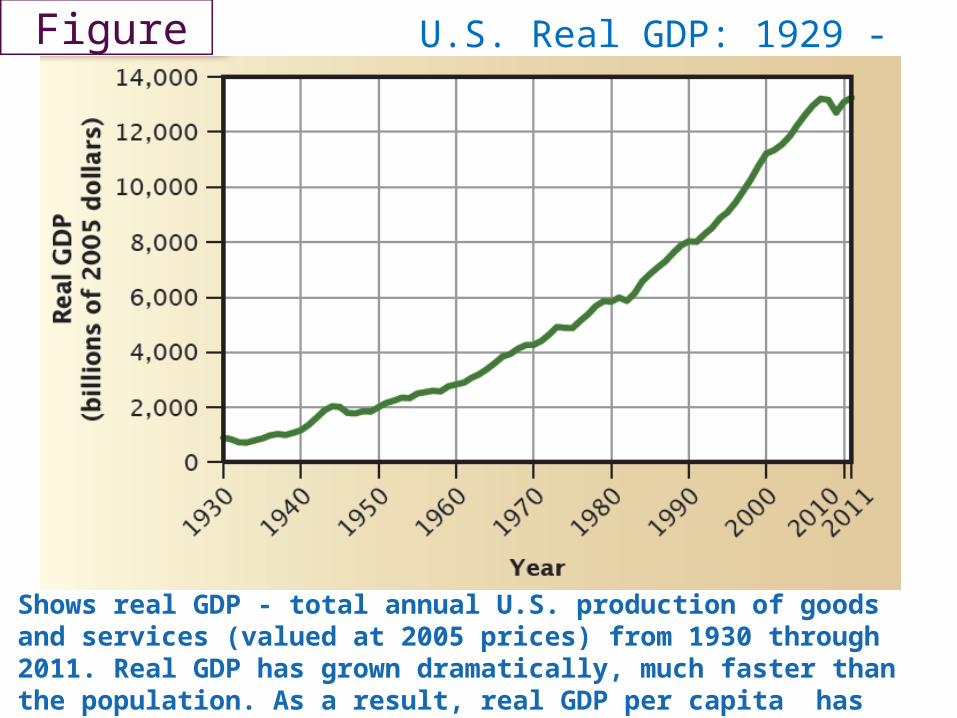
Shows real GDP - total annual U.S. production of goods and services (valued at 2005 prices) from 1930 through 2011. Real GDP has grown dramatically, much faster than the population. As a result, real GDP per capita has grown rapidly as well – NEXT SLIDE
U.S. Real GDP: 1929 -2011

U.S. Real GDP Per Capita: 1929 -2011
(b)
The Business Cycle
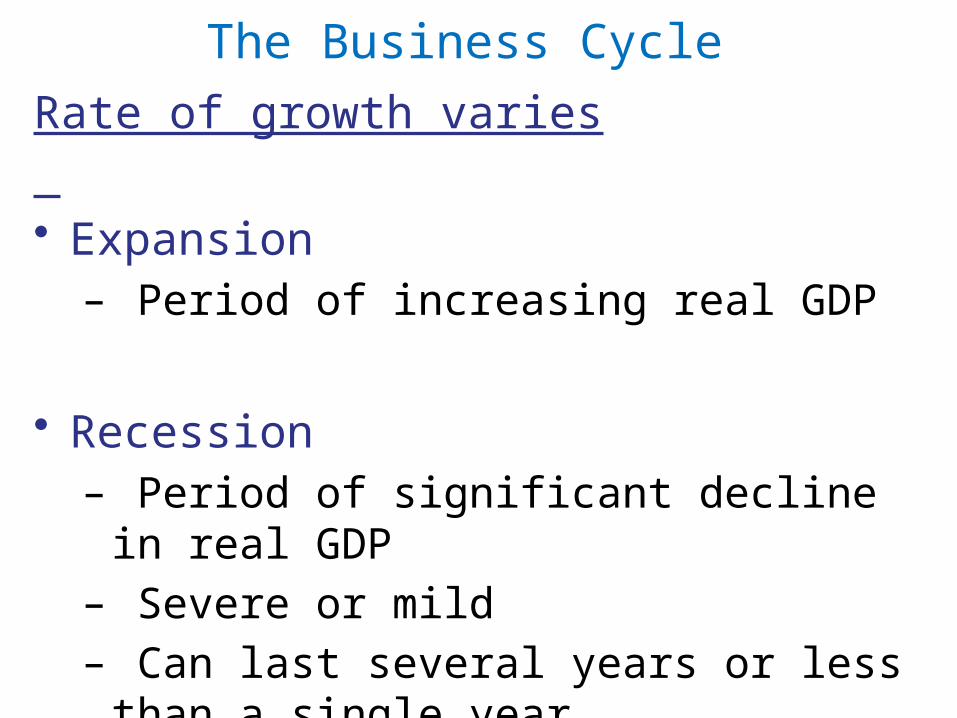
Rate of growth varies
• Expansion
– Period of increasing real GDP
• Recession – Period of significant decline in real GDP– Severe or mild– Can last several years or less than a
single year

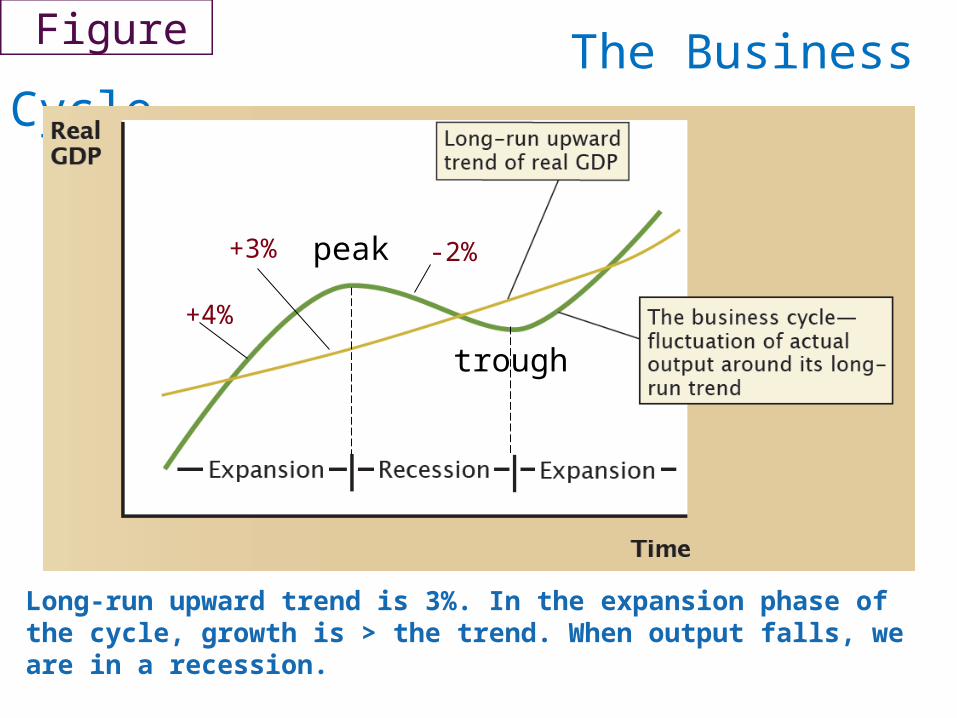
Over time, real GDP fluctuates around an overall long-run upward trend. Such fluctuations are called business cycles. When output rises, we are in the expansion phase of the cycle; when output falls, we are in a recession.
The Business Cycle
peak
trough
The Business Cycle
peak
trough
+3%
+4%
-2%
Long-run upward trend is 3%. In the expansion phase of the cycle, growth is > the trend. When output falls, we are in a recession.
The Business Cycle
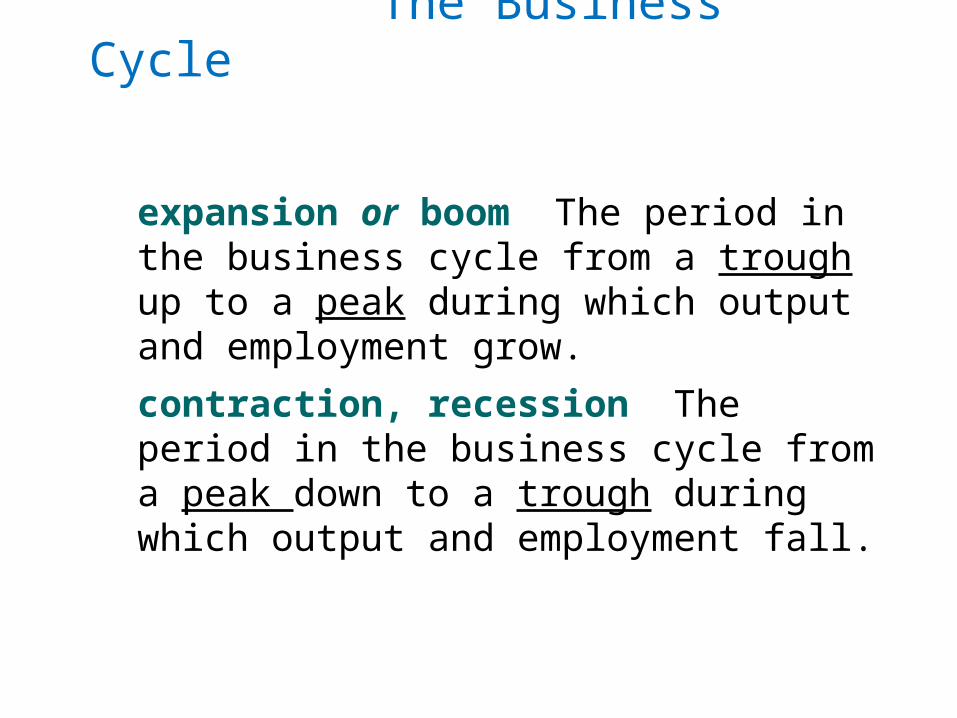
expansion or boom The period in the business cycle from a trough up to a peak during which output and employment grow.
contraction, recession The period in the business cycle from a peak down to a trough during which output and employment fall.

The Business Cycle
• Depression – An unusually severe recession– 1929-1933
• U.S. output dropped by more than 25 percent
• Since 1950– Three severe recessions (in 1974–75,
1981–82, and 2008–2009) – And several more mild ones

Real GDP- Shaded Areas Indicate Recessions
• What causes Expansions and Recessions?
• What macroeconomic policies can be used to offset recessions or to sustain expansions?
• What has caused the current recession - often referred to as the “Great Recession”?
Questions - Economic Growth
Second Macroeconomic Goal
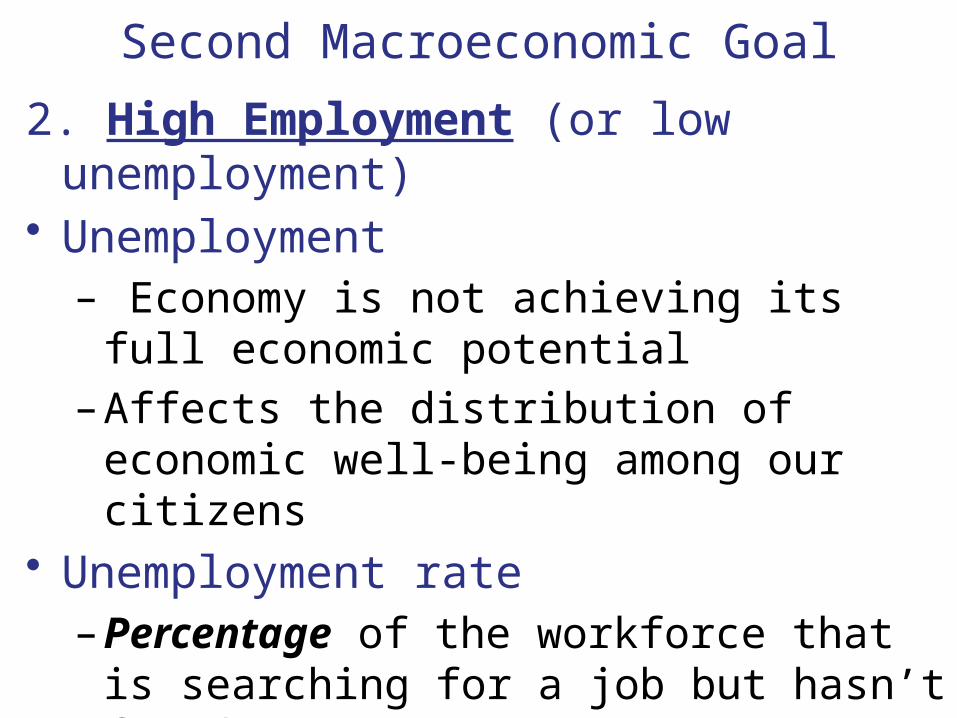
2. High Employment (or low unemployment)• Unemployment
– Economy is not achieving its full economic potential
– Affects the distribution of economic well-being among our citizens
• Unemployment rate– Percentage of the workforce that is
searching for a job but hasn’t found one
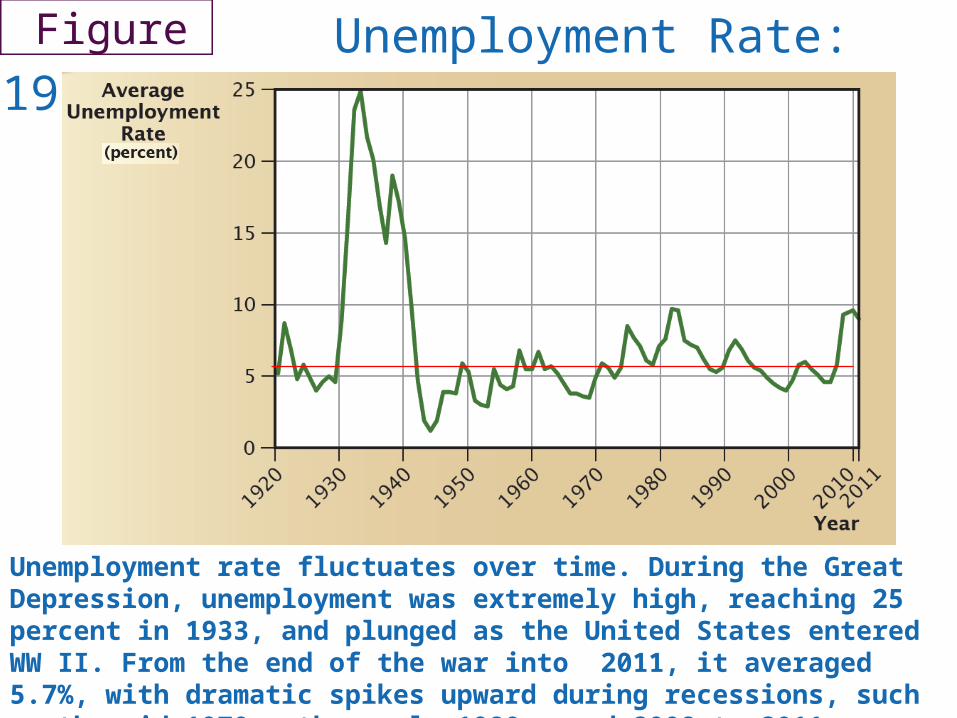
Unemployment rate fluctuates over time. During the Great Depression, unemployment was extremely high, reaching 25 percent in 1933, and plunged as the United States entered WW II. From the end of the war into 2011, it averaged 5.7%, with dramatic spikes upward during recessions, such as the mid-1970s, the early 1980s, and 2008 to 2011.
Unemployment Rate: 1920 - 2011
High Employment• Unemployment rate is never zero
– There are always some people looking for work• Even when the economy is doing well
• Employment Act of 1946– Federal government to “promote maximum
employment, production, and purchasing power”
• Full Employment and Balanced Growth Act, 1978– Called for an unemployment rate of 4 percent
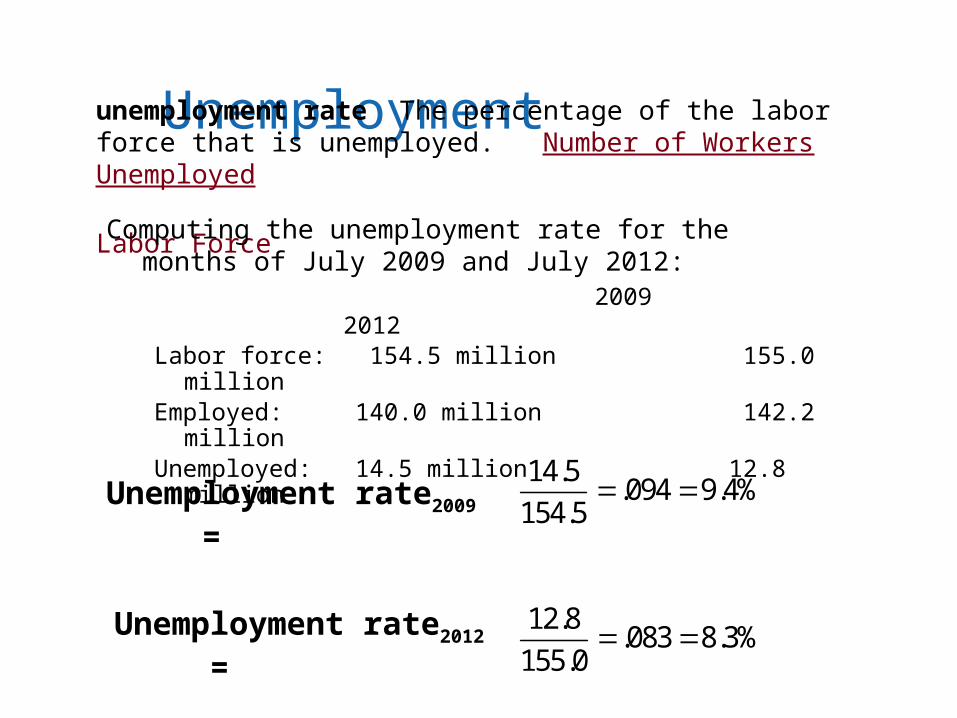
Unemploymentunemployment rate The percentage of the labor force that is unemployed. Number of Workers Unemployed
Labor Force
Computing the unemployment rate for the months of July 2009 and July 2012:
2009 2012Labor force: 154.5 million 155.0 millionEmployed: 140.0 million 142.2 millionUnemployed: 14.5 million 12.8 million
Unemployment rate 2009 =14.5
.094 9.4%154.5
Unemployment rate 2012 =
12.8.083 8.3%
155.0
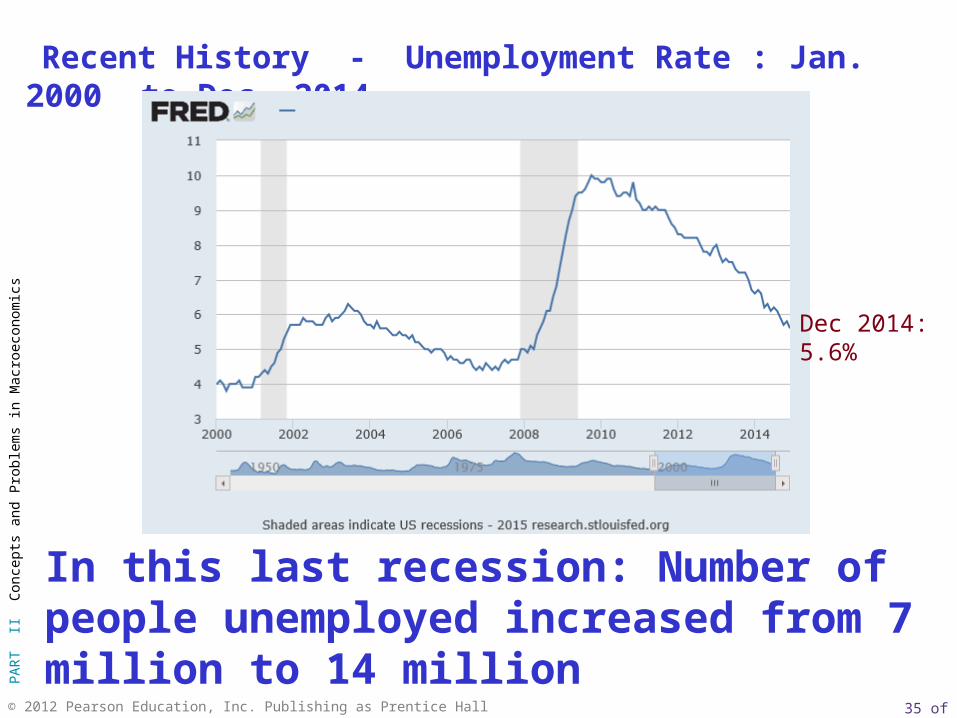
Recent History - Unemployment Rate : Jan. 2000 to Dec. 2014
In this last recession: Number of people unemployed increased from 7 million to 14 million
Dec 2014: 5.6%
• What causes unemployment to rise and fall?
• Can Monetary and Fiscal Policies be used to keep the unemployment rate low?
• What are the obstacles?
Questions - Unemployment Rate
Third Macroeconomic Goal
3. Stable Prices• Inflation rate
– Percentage increase in the average level of prices
• Zimbabwe: mid-November 2007 to mid-November 2008– Price roses by 89,700,000,000,000,000,000,000
percent (89.7 sextillion.)• During the last few weeks of that period,
prices were doubling every day
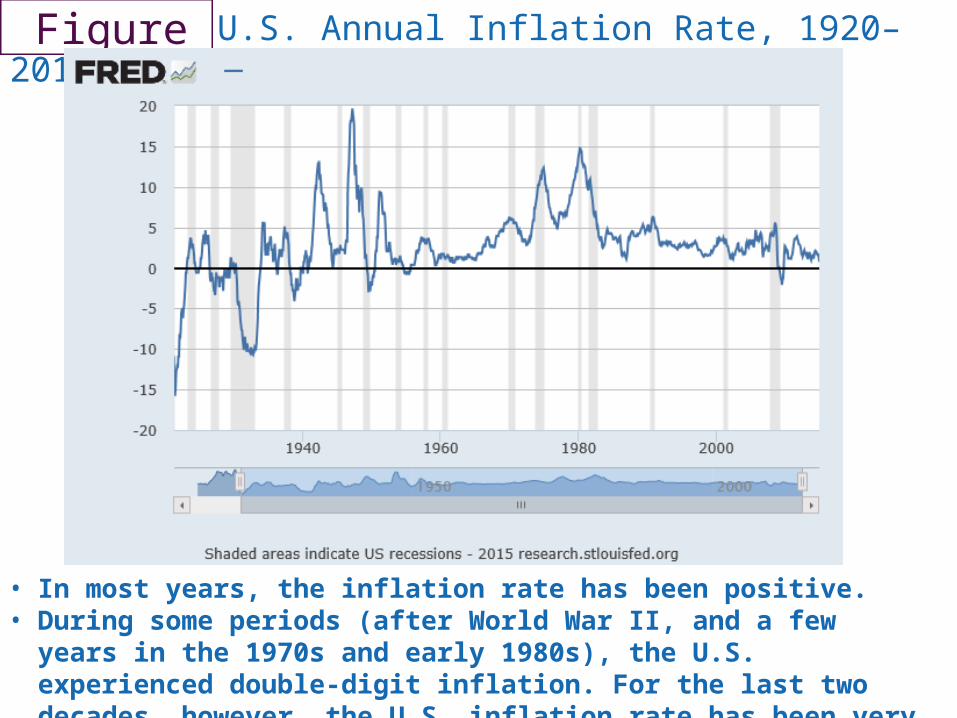
• In most years, the inflation rate has been positive. • During some periods (after World War II, and a few years in the 1970s
and early 1980s), the U.S. experienced double-digit inflation. For the last two decades, however, the U.S. inflation rate has been very low.
U.S. Annual Inflation Rate, 1920–2014
INFLATION AND DEFLATION
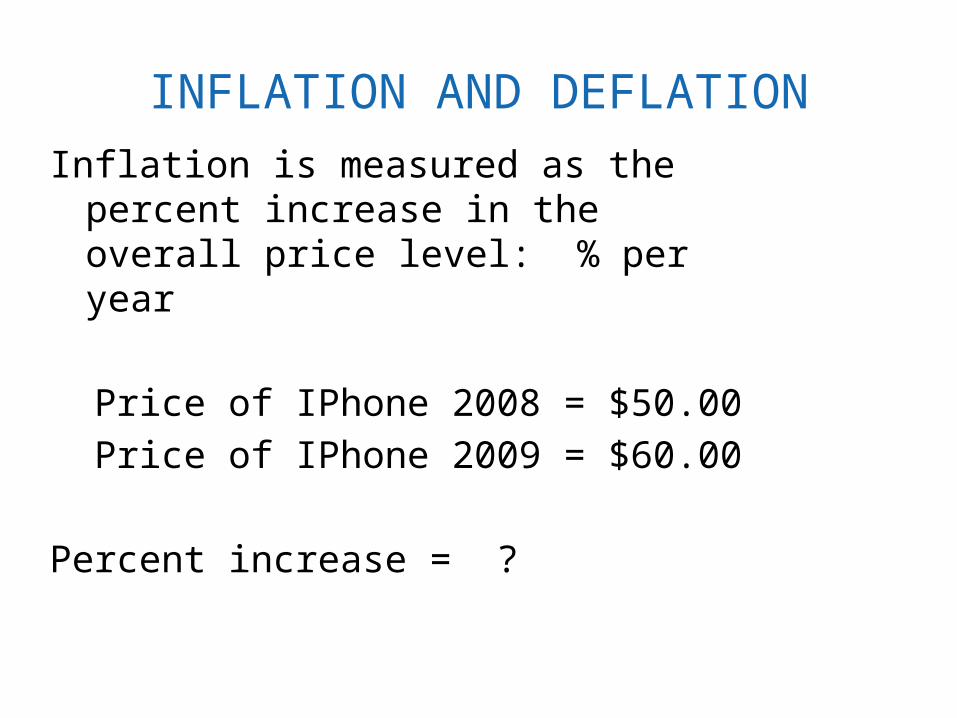
Inflation is measured as the percent increase in the overall price level: % per year
Price of IPhone 2008 = $50.00
Price of IPhone 2009 = $60.00
Percent increase = ?
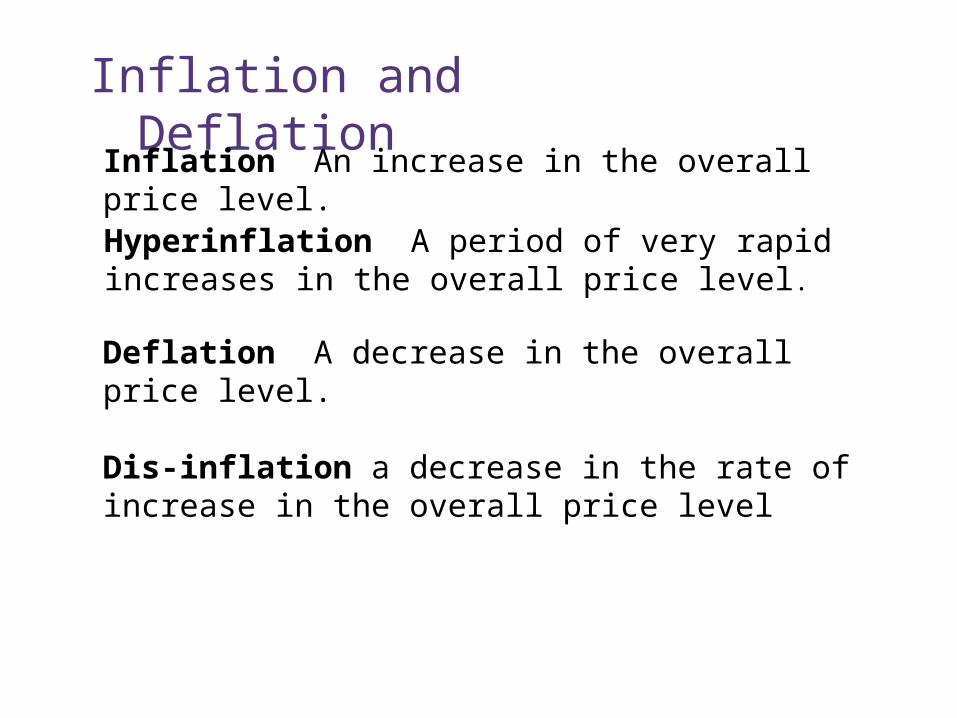
Inflation and Deflation
Inflation An increase in the overall price level.
Hyperinflation A period of very rapid increases in the overall price level.
Deflation A decrease in the overall price level.
Dis-inflation a decrease in the rate of increase in the overall price level
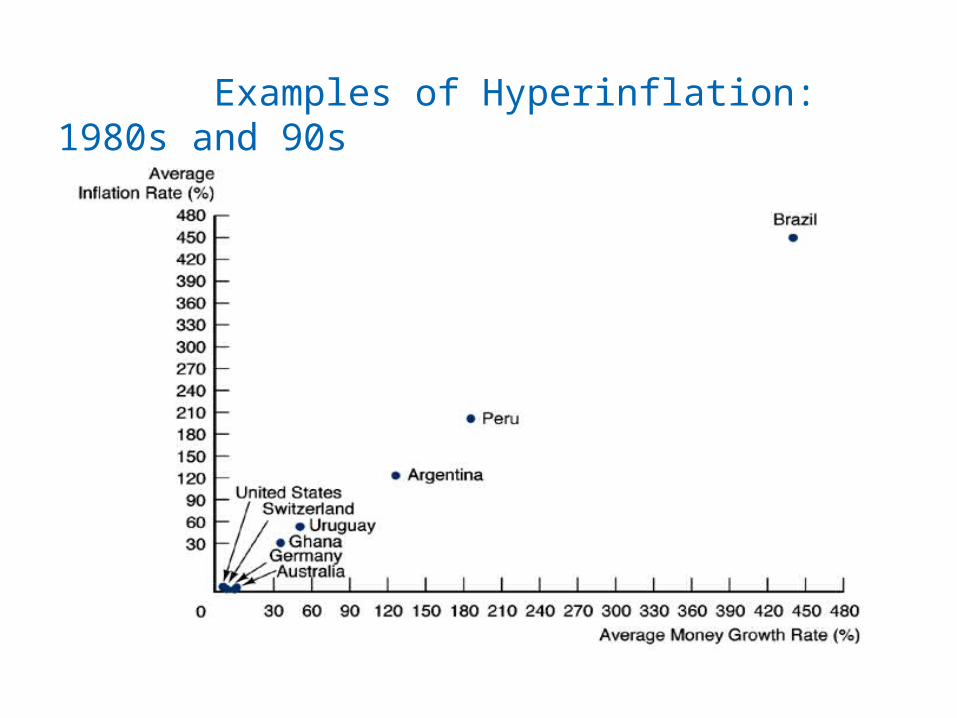
Examples of Hyperinflation: 1980s and 90s
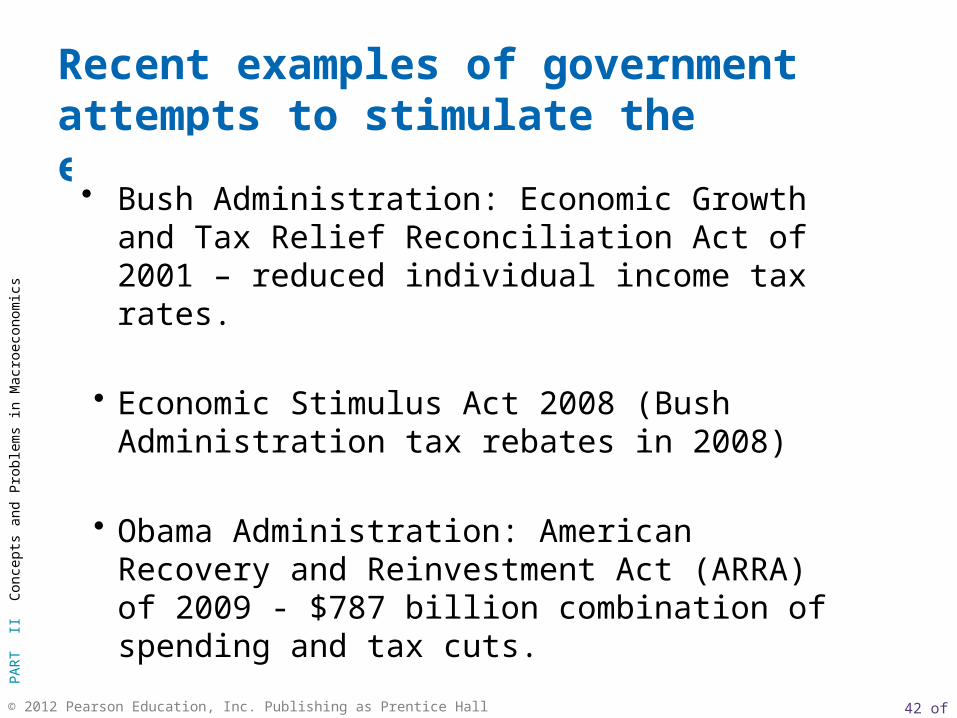
Recent examples of government attempts to stimulate the economy:
• Bush Administration: Economic Growth and Tax Relief Reconciliation Act of 2001 – reduced individual income tax rates.
• Economic Stimulus Act 2008 (Bush Administration tax rebates in 2008)
• Obama Administration: American Recovery and Reinvestment Act (ARRA) of 2009 - $787 billion combination of spending and tax cuts.
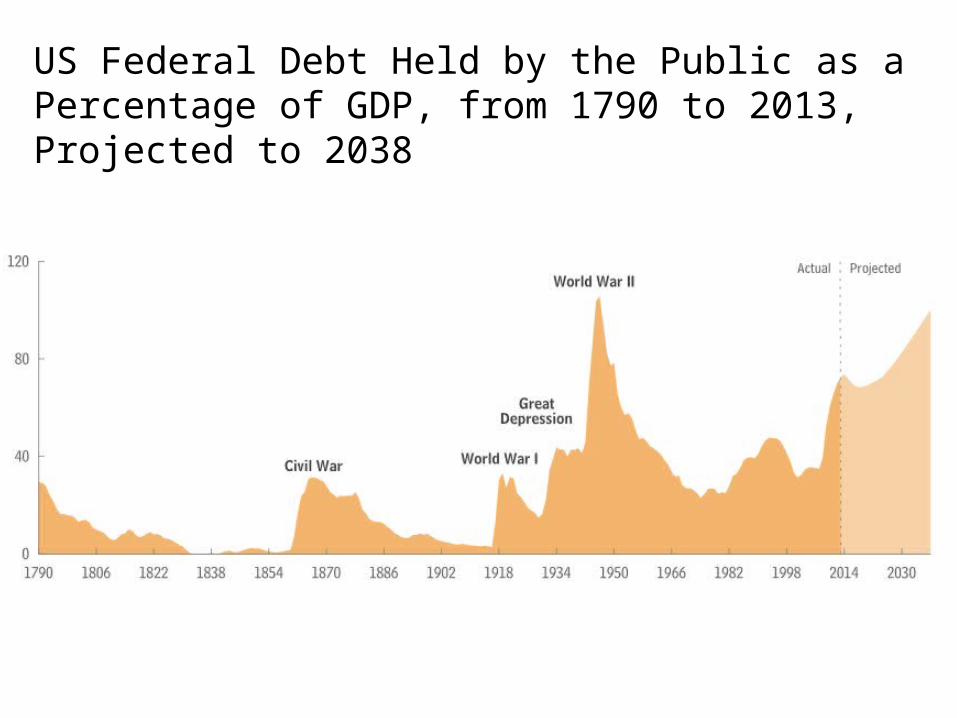
US Federal Debt Held by the Public as a Percentage of GDP, from 1790 to 2013, Projected to 2038
Macroeconomic Controversies
• Disagreements on issues reflect both different positive economic views
- cause and effect, what is
• As well as normative difference
- judgment, opinion, values, what should be
Final Item
The Circular Flow Diagram
circular flow A diagram showing the income received and payments made by each sector of the economy.

Simple Circular FlowIncome ($)
Labor
Goods (bread)
Expenditure ($)
Households Firms
The circular flow diagram shows the income received and payments made by each sector of the economy.