Where to manufacture?
20
Where to manufacture? Global analysis of the cost of doing business KPMG International home.kpmg/industrialmanufacturing
Transcript of Where to manufacture?

Where to manufacture?Global analysis of the cost of doing business
KPMG International
home.kpmg/industrialmanufacturing

Foreword
Country andjurisdiction rankings:
Cost impacts: Changing world:
Canada ranked first for overall cost of doing business.
Secondary Cost Index performance is a strong predictor of overall cost of doing business.
Many manufacturers are currently reassessing their supply chain costs and stability.
Tax reform can have a significant impact on a country’s relative ranking.
Countries that do well on primary factors tend to perform poorly on secondary factors and vice versa.
Exchange rates remain in flux, which can have a direct impact on costs.
Automation is changing the dynamics and value equation of certain markets and sectors.
Asia-pacific markets performed well, led by Taiwan, South Korea and Malaysia.
Traditional ‘low-cost’ markets like Mexico, India, China and Brazil returned higher-than-average cost of doing business results.
Stéphane Souchet Global Head, Industrial Manufacturing KPMG International [email protected]
Across the globe, manufacturers are taking a critical look at their networks. Confidence in supply chains has been shaken; policy disputes and tariffs have undermined global trade; customer demands and expectations have shifted. Many manufacturers are asking whether their current production footprint is still optimal in the context of the new reality.
As they rethink their network, cost is coming under the microscope. What manufacturers increasingly recognize is that labor costs are only part of the overall cost of doing business that can vary from market to market. In fact, ‘secondary costs’ (those typically related to the business environment or ease of doing business) are often a better predictor of a market’s overall cost of doing business than ‘primary
costs’ like labor. Yet quantifying those costs and their impact on a manufacturer’s overall operations can be challenging.
To help support manufacturing executives as they assess different markets, KPMG collaborated with the Manufacturing Institute (MI) to see if a quantitative index of the cost of doing business (CoDB) across 17 key manufacturing markets in the developed and emerging markets could be developed.
To discuss the factors that influence your cost of doing business or to drill down into a specific market or strategy, we encourage you to contact your local KPMG firm or one of the contacts listed at the end of this report.
Key findings:
© 2021 Copyright owned by one or more of the KPMG International entities. KPMG International entities provide no services to clients. All rights reserved.

2.54
2.65
2.69
2.74
2.77
2.84
3.26
3.46
4.20
2.63
2.67
2.69
2.77
2.83
3.00
3.33
3.49
Canada
Taiwan
South Korea
Malaysia
US
UK
Germany
Switzerland
Ireland
France
China
Italy
Japan
Mexico
Vietnam
India
Brazil
CoDB Index score by country and jurisdiction
Source: Cost of Manufacturing Operations Around the Globe, KPMG LLP, 2020.
© 2021 Copyright owned by one or more of the KPMG International entities. KPMG International entities provide no services to clients. All rights reserved.

Contents
This report is a result of a collaboration between KPMG and the Manufacturing Institute.
What are the costs of doing business?
01
03
13 14
04 11Developing the Index
Results Conclusion
Data sourcesAppendix A: Index methodology
© 2021 Copyright owned by one or more of the KPMG International entities. KPMG International entities provide no services to clients. All rights reserved.

What are the costs of doing business?Where to locate a production facility is an important strategic decision for a manufacturing company. The location decision can have a long-term impact on performance. The selection of a particular site (or country) requires more than just an assessment of labor costs. It requires the consideration of multiple factors, including the cost of setting up the facility, real estate costs, energy costs, the quality of the labor force and infrastructure, the regulatory environment, and intellectual property protections.Companies consider a variety of CoDB factors when evaluating their international manufacturing location decisions. Our study considers the factors evaluated by companies at the country level and seeks to incorporate these into country-level rankings. A country’s competitiveness is often judged by the cost of labor and an often cited motivation for moving manufacturing offshore (relative to higher-cost countries like the US) is the desire to gain access to low labor costs and to lower the cost of production. Studies, however, have indicated that a range of other factors go into the location selection decision.1
The leading factors identified that contribute to the location decision are:1. Availability of skilled labor2. Cost and productivity of labor3. Availability of and proximity to transportation
infrastructure4. Tax rates5. Regulatory environment6. Real estate costs7. Availability and cost of power, communications, water,
and other utilities8. Access to and cost of capital9. Transparency in government and business practices,
and the ease of doing business
10. A politically and economically stable environment with ability to enforce legal and property rights
We compiled data on each of these factors, directly or through proxy measures, over the 2012 to 2019 time period for the 17 countries (see Appendix A for details). The selection of specific categories of costs to compare were guided by the surveys and studies we reviewed (see Appendix A for details). We note here that data for every cost element were not available for every country or not available for a recent time period. Thus, the cost types analyzed are those that could be obtained from public sources spanning 2012–2019, but we use only the most recent data in our analysis where available.Given the large number of indicators being considered, we categorized these decision factors into two groups:
— Primary costs — Those that can be measured in cost terms (dollars or percentage, in the case of cost of capital and tax rates). These cost factors are more readily assessed and include expenses such as wages, utilities, real estate costs, and taxes.
— Secondary costs — Factors that impact overhead costs and the facility’s ability to operate efficiently. The secondary factors are typically related to the business environment or the ease of doing business. For instance, they take into consideration the level of transparency in business and government processes, the legal protection of property rights, and the regulatory burden.
For primary cost factors, the specific measures we have included are:
— Labor costs — Hourly labor rates (including benefits) — Utility costs — Energy costs — Real estate costs — Lease costs for industrial/logistics
locations — Cost of capital — Borrowing interest rates — Corporate tax rates.
a. B.L. MacCarthy and W. Atthirawong. “Factors Affecting Location Decisions in International Operations – a Delphi Study,” International Journal of Operations & Production Management, 2003.
b. C. Manning, M. Rodriguez and Chinmoy Ghosh. “Devising a Corporate Facility Location Strategy to Maximize Shareholder Wealth,” Journal of Real Estate Research, 1999.
c. F. Karakaya and C. Canel. Underlying Dimensions of Business Location Decisions, Industrial Management & Data Systems, 1998.d. S. Turhan, B.C. Ozbag and B. Cetin. “Factors Affecting Location Decisions of Food Processing Plants,” Journal of Applied Sciences, 2007.e. M. Plaziak and A.I. Symanska. Role of Modern Factors in the Process of Choosing a Location of the Enterprise.
1 For a discussion of these factors see for example:
© 2021 Copyright owned by one or more of the KPMG International entities. KPMG International entities provide no services to clients. All rights reserved.
1Where to manufacture?

# Measure Cost type Subcategory
1 Hourly compensation costs Primary -
2 Real estate costs Primary -
3 Utility costs Primary -
4 Corporate tax rates Primary -
5 Interest rates Primary -
6 Learning-adjusted years of schooling Secondary Quality of labor
7 Skill set of graduates Secondary Quality of labor
8 Real value added per employee Secondary Quality of labor
9 Days to start business Secondary Ease of doing business
10 Burden of government regulation Secondary Ease of doing business
11 Registering property Secondary Ease of doing business
12 Road Quality Index Secondary Infrastructure
13 Railroad quality Secondary Infrastructure
14 Airport connectivity Secondary Infrastructure
15 Liner Shipping Connectivity Index Secondary Infrastructure
16 Electric power losses (% of output) Secondary Infrastructure
17 Exposure to unsafe drinking water Secondary Infrastructure
18 Reliability of water supply Secondary Infrastructure
19 Access to internet/Wi-Fi Secondary Infrastructure
20 Political risk Secondary Risk and protections
21 Enforcing contracts Secondary Risk and protections
22 Protecting minority investors Secondary Risk and protections
23 Corruption Perception Index Secondary Risk and protections
Based on these indicators, we first developed separate indices, one for the primary costs and another for the secondary costs, and then combined the two to produce the CoDB Index, an overall competitiveness index. We adopted this approach to produce one common index by which to rank the countries with respect to CoDB while retaining the ability to explore how the primary and secondary costs influenced the overall rank.
Appendix A provides details on the sources from which the data on these measures were gathered.
Primary and secondary measures by subcategory
For secondary cost factors tied to the business environment and infrastructure, we considered a range of indicators reflecting the quality of labor, the ease of doing business, infrastructure, and risk and protections. The table below summarizes the measures and cost types considered.
© 2021 Copyright owned by one or more of the KPMG International entities. KPMG International entities provide no services to clients. All rights reserved.
2 Where to manufacture?

Developing the IndexSince we are evaluating 23 factors — some that impact a manufacturing company’s operations in a country directly and others more indirectly — it is challenging to draw cross-country inferences by evaluating each separate CoDB factor. Instead, we created a composite index that would jointly reflect the information provided by the various individual measures. We recognize that such an index will subsume a significant range of information across all the identified measures. To provide transparency and to allow further exploration to identify the set of factors driving a country’s index level (and rank), we developed two indices — one for the primary cost factors and another for the secondary cost factors. Subsequently, we combined them to generate an overall index (the CoDB Index) to benchmark country performance. This allowed us to analyze the relative importance of each set of factors to each country’s overall index score.
As with any index, the weighting placed on each component is a key consideration. Most studies that examine CoDB factors tend to weight the key factors
equally.2 It did not appear that one or some of the four secondary cost categories we considered — quality of labor, ease of doing business, infrastructure, and risk and protections — stood out in importance relative to the others. Accordingly, the assumption of equal weighting appeared to be reasonable for all factors (see Appendix D for a specific breakdown of the weights).
With respect to the primary cost factors, namely, labor, utility, real estate costs, interest rates, and tax rates, we evaluated the need to place higher weight on labor given its perceived importance as a factor in location decisions. Specifically, we reviewed data on the contribution of labor costs to manufacturing. The 16 percent weight indicated by this analysis is similar in magnitude to the 20 percent weight that we use for labor under an equal weighting approach. In the absence of any clear indication that pointed to an alternate weighting choice, we assigned equal weighting to the five primary factors.3
In summary, we utilized the following weights when calculating index values for each country:
Index weights
Primary costs
Secondary costs
CoDB Index50% 50%
Quality of labor
Ease of doing business
Infrastructure
Risk and protections
Secondary Cost Index
25% 25%
25%25%
20%
Primary Cost Index
Hourly compensation costs
Real estate costs
Utility costs
Corporate tax rates
Interest rates
20%
20%
20%
20%
© 2021 Copyright owned by one or more of the KPMG International entities. KPMG International entities provide no services to clients. All rights reserved.
3Where to manufacture?

Country and jurisdiction ranking — CoDB Index
Source: Cost of Manufacturing Operations Around the Globe, KPMG LLP, 2020.
The application of the indexing methodology resulted in a ranking of countries as summarized on a score from 1–5, with 1 being the best and 5 being the worst.
Canada, Taiwan, and South Korea ranked as the top three countries and jurisdictions on the CoDB Index, which equally weights primary cost factors and secondary cost factors. The US ranked fifth among the 17 countries. The country with the lowest rank was Brazil, with Japan, Mexico, Vietnam, and India ranking just above it.
To understand the overall CoDB rankings based on the Primary Cost Index and the Secondary Cost Index, the next two tables summarize the rankings across the two subcategories of factors. For primary costs, unsurprisingly for the most part, Malaysia, China, Mexico, and Vietnam are all tied for the top position (i.e. most competitive).
Results
CoDB Index score by country and jurisdiction (1=best, 5=worst)
Malaysia US UK Germany Switzerland Ireland France China Italy Japan Mexico
2.54 2.63 2.65 2.67 2.69 2.69 2.74 2.77 2.77 2.83 2.84 3.00 3.26 3.33 3.46 3.49 4.20
Vietnam India BrazilCanada Taiwan SouthKorea
1 2 3 4 5 6 7 8 9 10 11 12 13 14 15 16 17
Country and jurisdiction rank
© 2021 Copyright owned by one or more of the KPMG International entities. KPMG International entities provide no services to clients. All rights reserved.
4 Where to manufacture?
Vietnam India Canada Taiwan Italy South Korea Ireland France Germany UK US
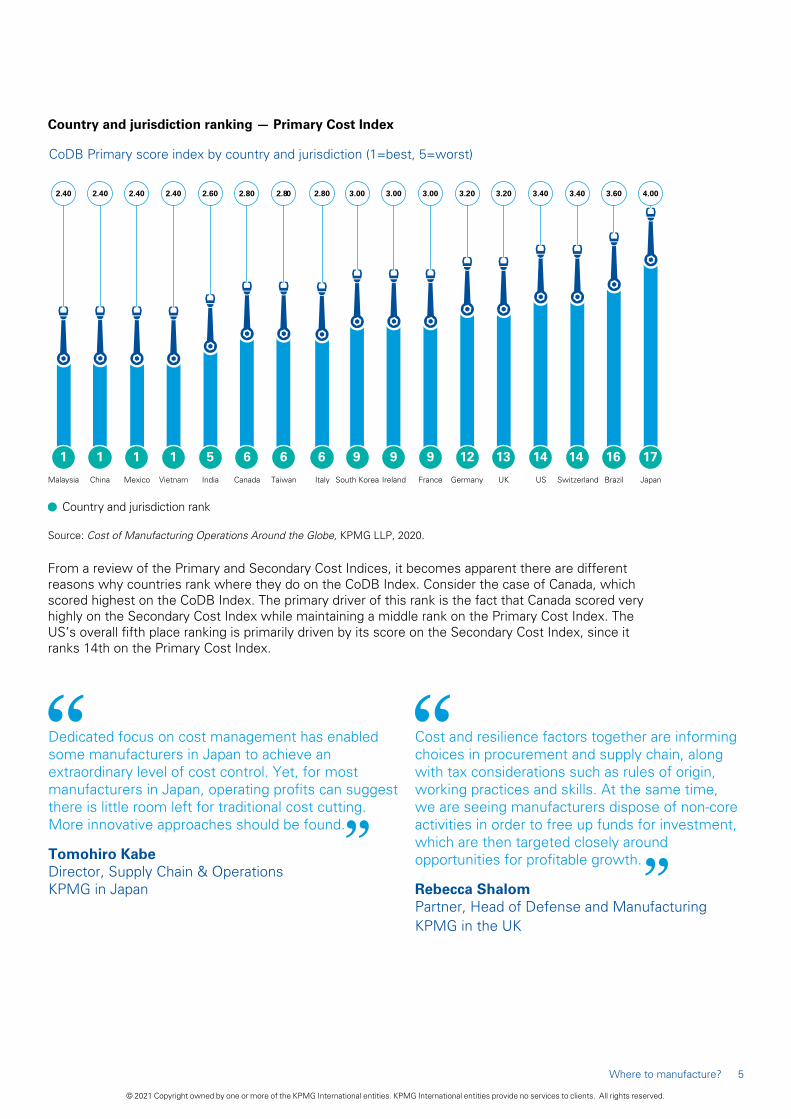
2.40 2.40 2.40 2.40 2.60 2.80 2.80 2.80 3.00 3.00 3.00 3.20 3.20 3.40 3.40 3.60 4.00
Switzerland Brazil JapanChina Mexico
1 1 1 1 5 6 6 6 9 9 9 12 13 14 14 16 17
Country and jurisdiction rank
CoDB Primary score index by country and jurisdiction (1=best, 5=worst)
Malaysia
Dedicated focus on cost management has enabled some manufacturers in Japan to achieve an extraordinary level of cost control. Yet, for most manufacturers in Japan, operating profits can suggest there is little room left for traditional cost cutting. More innovative approaches should be found.
Tomohiro Kabe Director, Supply Chain & OperationsKPMG in Japan
Cost and resilience factors together are informing choices in procurement and supply chain, along with tax considerations such as rules of origin, working practices and skills. At the same time, we are seeing manufacturers dispose of non-core activities in order to free up funds for investment, which are then targeted closely around opportunities for profitable growth.
Rebecca Shalom Partner, Head of Defense and Manufacturing KPMG in the UK
From a review of the Primary and Secondary Cost Indices, it becomes apparent there are different reasons why countries rank where they do on the CoDB Index. Consider the case of Canada, which scored highest on the CoDB Index. The primary driver of this rank is the fact that Canada scored very highly on the Secondary Cost Index while maintaining a middle rank on the Primary Cost Index. The US’s overall fifth place ranking is primarily driven by its score on the Secondary Cost Index, since it ranks 14th on the Primary Cost Index.
Country and jurisdiction ranking — Primary Cost Index
Source: Cost of Manufacturing Operations Around the Globe, KPMG LLP, 2020.
© 2021 Copyright owned by one or more of the KPMG International entities. KPMG International entities provide no services to clients. All rights reserved.
5Where to manufacture?

CoDB Secondary index score by country and jurisdiction (1=best, 5=worst)
Canada Germany SouthKorea
Taiwan Japan Ireland France Malaysia Italy China Mexico India Vietnam BrazilUS Switzerland UK
Country and jurisdiction rank
1 2 3 4 5 6 7 8 9 10 11 12 13 14 15 16 17
1.97 2.13 2.19 2.27 2.28 2.29 2.47 2.52 2.54 2.65 2.93 3.21 3.28 4.26 4.38 4.51 4.81
There are multiple factors that can influence the cost of doing business, including local market demand, local supply chain and parts availability, tax incentive policies and others.
Frank Li Partner, AdvisoryKPMG China
With a high priority on primary costs, German manufacturers have traditionally focused on near-shore countries in Eastern Europe and off-shore countries in ASPAC or in Central and South America. But the disruption and supply chain volatility created by the COVID-19 pandemic has made them think very seriously about diversifying their supply base.
Kaveh Taghizadeh Partner, Consulting, Value Chain TransformationKPMG in Germany
Country and jurisdiction ranking — Secondary Cost Index
Source: Cost of Manufacturing Operations Around the Globe, KPMG LLP, 2020.
In contrast, the ranks of Malaysia and Taiwan on the CoDB Index result from high scores on the Primary Cost Index. For instance, Taiwan ranks second on the CoDB Index despite a ranking of seventh on the Secondary Cost Index.
Interestingly, China’s middling score of 11 on the CoDB Index, despite being part of a four-way tie for first on the primary factors, is caused by its poor performance (rank of 13th) on the Secondary Cost Index. China’s low score on Secondary Cost Index arises primarily from higher operating risks. Overall, it appears that countries that do well on primary factors do less well on the secondary factors and vice versa. The clear exception appears to be Brazil, which ranks poorly on both indices.
Primary costs are clearly important to location decisions. To examine how the overall CoDB ranking may change under an alternate set of weights, we recomputed the results placing greater consideration on primary costs. That is, we re-ran our analysis, changing the weight of the primary costs and secondary costs from equal or 50 percent–50 percent weighting to 70 percent–30 percent in favor of primary costs. As presented in Table 6, not surprisingly, this caused China’s ranking on the CoDB Index to move up significantly, from 11th to third, and the US ranking to decline from fifth to 12th. However, Canada, Malaysia, and South Korea retained their top-five CoDB rankings despite this change.
© 2021 Copyright owned by one or more of the KPMG International entities. KPMG International entities provide no services to clients. All rights reserved.
6 Where to manufacture?

US ranking with higher weight on labor quality
Source: Cost of Manufacturing Operations Around the Globe, KPMG LLP, 2020.
Countries Overall ranking
Primary cost
ranking
Secondary cost
ranking
Ireland 1 9 2Canada 2 6 5Germany 3 12 4US 4 14 1Switzerland 5 14 3South Korea 6 9 6
4 We increased the weight on quality of labor to 70 percent in the Secondary Cost Index and equally weighted the other three measures at 10 percent each. 5 The US tax rates used here are after tax reform.
Understanding the results
Primary Cost Index
Selected country and jurisdiction primary cost percentile rankings (sorted by Primary Cost Index)
Source: Cost of Manufacturing Operations Around the Globe, KPMG LLP, 2020.
To understand these results better, we further examined the constituents of the Primary and Secondary Cost Indices.
To further understand the drivers of our findings, we examined which factors cause East Asian countries and jurisdictions such as Vietnam, Taiwan, and Malaysia to rank highly on the Primary Cost Index and the US to rank 14th. The table below presents constituent ranks for countries and jurisdictions that rank highly on the Primary Cost Index — Vietnam, Taiwan, Malaysia, India, China, and Mexico — and for the US. Note that the table shows percentile ranks, that is to say a percentile rank of 5 represents the top 15 percentile of costs. The percentile ranking of 1 indicates the best-performing countries in the category and the percentile ranking of 5 indicates the worst-performing countries in the category (see Appendix D for additional details). As Table 8 indicates, the differences are most stark with respect to hourly compensation costs between the US and other countries.
Countries and jurisdictions
Hourly compensation
costs
Real estate costs
Utility costs
Corporate tax rates
Interest rates
Malaysia 2 1 3 2 4China 2 2 1 3 4Mexico 1 1 1 4 5Vietnam 1 4 1 2 4India 1 1 2 4 5Taiwan 3 4 2 2 3US 5 3 3 3 3
In terms of real estate costs and the cost of capital, the US is relatively competitive compared to the Southeast Asian nations. Among these countries and jurisdictions, only India, Malaysia, and China had lower average costs for industrial property than the US, while only Taiwan had a lower interest rate. The US compares less favorably to the Southeast Asian nations on the measures of utility costs and corporate tax rates.5 The US is tied with Malaysia for the highest electricity costs among these countries, significantly higher than the average rate paid by Chinese electricity users. In terms of corporate tax rates among this group, only India and Mexico have higher statutory tax rates, at 30 percent compared to 27 percent for the US.
From a labor market perspective, the quality of labor available in the US is a strong asset. However, increasing the weight of the quality of labor measure reveals that there is also significant competition from European countries and Canada in this regard. For example, as presented in the table below, increasing the weight on the quality of labor to 70 percent from 25 percent within the Secondary Cost Index (but maintaining equal weight between primary and secondary costs) causes Ireland, Germany, and Switzerland to rise to the top five most competitive countries, with the US and Canada rising and falling by one rank, respectively.4
Country and jurisdiction ranking with higher weight on primary costs
Source: Cost of Manufacturing Operations Around the Globe, KPMG LLP, 2020.
Countries and jurisdictions
CoDB Index
ranking
Primary Cost Index
ranking
Secondary Cost Index
ranking
Malaysia 1 1 11Canada 2 6 4China 3 1 13Taiwan 4 6 7South Korea 5 9 6Ireland 6 9 9
Social expectations have changed quickly. And legislation is rapidly catching up with a focus on supply chain transparency. More and more, sustainability is playing an increasingly important role in the investment decisions of European manufacturers.
Kaveh Taghizadeh Partner, Consulting, Value Chain TransformationKPMG in Germany
© 2021 Copyright owned by one or more of the KPMG International entities. KPMG International entities provide no services to clients. All rights reserved.
7Where to manufacture?

Industrialized country primary cost percentile rankings (sorted by Primary Cost Index)
Source: Cost of Manufacturing Operations Around the Globe, KPMG LLP, 2020.
CountriesHourly
compensation costs
Real estate costs
Utility costs
Corporate tax rates
Interest rates
Canada 3 3 2 3 3South Korea 3 3 3 3 3
UK 3 5 4 1 3
US 5 3 3 3 3
Japan 3 5 5 5 2
The impact of tax reform
As part of this analysis, we also examined if tax reform had a material impact on the relative standing of the US. In particular, we examined how the US would have ranked had we used the pre-tax-reform corporate tax rate of 40 percent (combined federal and state average) instead of the post-tax-reform combined rate of 27 percent.
It is worth noting here that our analysis of the tax input is limited to the statutory corporate rate only. We recognize that many other factors contribute to the overall tax burden in any given jurisdiction — including but not limited to the methodology of cost recovery, the deductibility of debt service, and the taxation of cross-border flows of income. Those other factors, which vary from jurisdiction to jurisdiction, were outside the scope
of this report. Still, we believe that the use of the statutory rate alone provides valid directional information even if not necessarily the entire picture.
As presented in the next table, tax reform improved the US’s ranking not only on the corporate tax measure, but also on the Primary Cost Index and the CoDB Index. With tax reform, the US was considered a median tax country. Had the US corporate tax rate continued to be 40 percent, it would have one of the highest corporate tax rates in the comparison group of countries. Tax reform resulted in the US ranking on the Primary Cost Index to improve two notches, from being 16th to 14th out of the 17 countries. The impact on the CoDB Index score is even more significant, with the US’s ranking increasing from 11th place (considering pre-reform tax rates) to 5th (after tax reform).
Ranking of the industrialized countriesThe table on the right provides a comparison to some of the industrialized countries relative to the US. The table shows percentile ranks, that is to say a percentile rank of 5 represents the top 15th percentile of costs (worst performing from a competitiveness standpoint) while a percentile rank of 1 slots into the best performing in the category (see Appendix D for additional details). We note that, even compared to the industrialized countries, US labor costs are high. Hourly rates in Canada, the UK, and Japan range between US$23 per hour and US$30 per hour, compared to US$39 per hour in the US. With respect to corporate tax rates, where tax reform lowered rates significantly, the US rates are lower than Japan and comparable to Canada, but still higher than those imposed by the UK.
© 2021 Copyright owned by one or more of the KPMG International entities. KPMG International entities provide no services to clients. All rights reserved.
8 Where to manufacture?

Secondary Cost IndexWith respect to secondary cost factors, the US is clearly in a strong position. As the table below indicates (the countries sorted by their respective rank on the Secondary Cost Index), the US scores are among the top three on almost all of the metrics, including quality of labor, transport infrastructure, and ease of doing business. The scores below represent weighted averages of percentile ranks for each measure considered under the category. A score of one (1) is best while five (5) is worst (see Appendix D for additional details).
Source: Cost of Manufacturing Operations Around the Globe, KPMG LLP, 2020.
Secondary cost factor scores (sorted by Secondary Cost Index)
Countries and jurisdictions
Quality of labor score
Ease of doing business
score
Infrastructure score6
Infrastructure — Transport score
Infrastructure — Utility score
Risk and protections
score
US 1.67 2.00 2.22 2.00 2.67 2.00
Switzerland 1.67 1.67 2.44 3.00 2.33 2.75
UK 2.67 2.33 2.25 2.75 3.00 1.50
Canada 2.33 2.33 2.42 3.25 3.00 2.00
Germany 1.67 2.67 2.28 2.50 2.33 2.50
South Korea 2.33 3.33 1.50 1.50 2.00 2.00
Taiwan 3.00 2.33 2.78 3.00 2.33 1.75
Japan 2.33 3.00 2.25 1.75 2.00 2.50
Ireland 1.33 3.00 3.58 4.75 3.00 2.25
France 2.67 3.00 2.69 2.75 2.33 2.25
Malaysia 3.33 2.33 3.06 2.50 3.67 3.00
Italy 3.33 3.00 3.50 3.50 3.00 3.00
China 3.67 2.33 3.64 2.25 3.67 3.50
Mexico 4.33 4.00 4.44 4.00 4.33 4.25
India 5.00 4.33 4.42 3.25 5.00 3.75
Vietnam 4.67 4.33 4.31 4.25 4.67 4.75
Brazil 5.00 5.00 4.47 4.75 4.67 4.75
6 The infrastructure score is a combined score across transportation, utility, and internet. Details are shown for transportation and utility subcomponents while internet access is not shown in the table but is included in the combined score. Each of these three factors (transport, utility, and internet) get an equal weight.
© 2021 Copyright owned by one or more of the KPMG International entities. KPMG International entities provide no services to clients. All rights reserved.
9Where to manufacture?

Source: Cost of Manufacturing Operations Around the Globe, KPMG LLP, 2020.
Percentile ranks for cost and quality of labor
On all of the secondary factors considered, including quality of labor, the US ranks significantly better than countries that offer lower labor costs, such as Vietnam, China, Mexico, and India. To put it differently, the low ranking of these countries on the Secondary Cost Index reflects the weaker investment climate — for example, the poorer connectivity from limited road, rail, and airline networks; more challenging business operating environments; and lower levels of transparency in government operation and reduced legal protections available to businesses.
The industrialized countries generally rank favorably and similarly across secondary metrics, falling for the most part in the top half of the countries. Among them, however, the US clearly ranks better with respect to at least two factors: quality of labor and ease of doing business. Thus, relative to the other 16 countries considered, the US ranks best on the secondary cost components.
Labor – Cost and qualityAs noted earlier, compensation cost is often the most cited factor for locating manufacturing facilities in Asian countries and jurisdictions such as China, Taiwan, or Vietnam. As the data confirms, these countries do offer among the lowest hourly compensation costs for labor. Further, the hourly compensation costs in the US are among the highest in the world.
As the table on the right shows, a different picture emerges when productivity attributes are considered in addition to the quality of labor. For example, countries with the most favorable cost attributes are not always the ones with the highest real value added per employee. In fact, the table suggests a high degree of positive correlation between costs and productivity.
Thus, it would appear that for manufacturing activities that are more routine in nature and require less advanced skills, where the loss of productivity may be outweighed by lower costs, companies may consider locating their manufacturing facilities in lower costs countries and jurisdictions such as China, Vietnam, or Taiwan; however, in higher value-added manufacturing where the process is more complex or automated and requires highly skilled labor to manage, the US may be considered more favorably as a location.
Countries and jurisdictions
Hourly compensation
costs
Real value added per employee
Vietnam 1 5
India 1 5
Mexico 1 4
China 2 4
Malaysia 2 4
Brazil 2 5
Taiwan 3 3
South Korea 3 3
Japan 3 3
UK 3 2
Canada 3 3
Italy 4 3
Ireland 4 1
France 4 2
US 5 1
Germany 5 2
Switzerland 5 1
The cost of doing business should be viewed in the context of future operating profits. Sectors like automotive and consumer electronics can face high costs, but they can also enjoy high sales value. As such, actual operating profit values are quite high. Making investment decisions requires manufacturers to understand more than just the labor and material costs.
Tomohiro Kabe Director, Supply Chain & OperationsKPMG in Japan
The need for rapid change in response to issues like Brexit and COVID-19 showed manufacturers the connection between a strong data strategy and their ability to manage costs. Those with a robust data management system and a connected enterprise data strategy were able to pivot much faster than their peers. Not surprisingly, we are seeing a significant uptick in activity from manufacturers seeking to enhance their data strategy and create a more connected enterprise.
Simon Jonsson Partner, UK Head of Industrial ProductsKPMG in the UK
© 2021 Copyright owned by one or more of the KPMG International entities. KPMG International entities provide no services to clients. All rights reserved.
10 Where to manufacture?

Our results indicate that countries that placed better on the Secondary Cost Index generally performed better on the overall rankings. Of the top five most competitive economies on the overall rankings, only two — Malaysia and Taiwan — have a better primary than secondary cost score.
In keeping with this trend of lower secondary cost countries scoring better on the CoDB Index, the US placed fifth on the CoDB Index despite being tied with Switzerland for 14th on the Primary Cost Index. This high Primary Cost Index ranking was primarily due to high labor costs. The US was able to compensate somewhat for these unfavorable scores on the Primary Cost Index by placing first in the Secondary Cost Index.
As part of this analysis, we also examined if tax reform had a material impact on the relative standing of the US. In particular, we compared how the US ranks now (post-tax-reform combined federal and local tax rate of 27 percent) relative to the pre-reform with a corporate tax rate of 40 percent (combined federal and state average). The impact on the US’s CoDB Index ranking is quite significant. After tax reform, the US’s competitiveness increased — as evidenced by its current rank of 5 — compared with its previous rank of 11 under pre-reform tax rates.
A closer look at the countries that outperformed the US on the CoDB Index ranking indicates some interesting factors. For example, the US outperformed all of the countries on the Secondary Cost Index due to better labor productivity and business conditions. This implies that the outperformance on the CoDB Index by Canada, Taiwan, South Korea, and Malaysia are all driven by primary cost factors. Specifically, Canada’s rank is driven primarily by its ability to offer lower compensation costs and slightly lower electricity rates while still maintaining Secondary Cost Index rankings that were not far behind the US. South Korea ranked third by offsetting a weaker ranking on the Secondary Cost Index with even lower compensation costs. A sharper version of the trade-off between primary and secondary cost explains the rankings of Taiwan and Malaysia, with Taiwan offering higher primary costs but lower secondary costs.
This study has focused on certain CoDB factors that are commonly considered in manufacturing facility location decisions — at the country level — and the results provide a high-level perspective on the attributes of various countries with respect to these factors. However, the location decision is specific to each company and its consideration of the supply chain and access to markets. The decision may be impacted by the type of industry the company is active in, the type of product,
where customers are, and the company’s overall business strategy. Thus, individual location decisions are significantly more complex than we can address in an analysis such as this.
For instance, for heavy equipment manufacturing, from a transportation point of view, it may be better to locate the facility closer to suppliers and the market, whereas from a production standpoint, it may be more desirable to locate the facility closer to where the desired type of workforce or raw materials might be available. Alternatively, for a specialized precision products manufacturing operation, the firm’s decision may be heavily impacted by the availability of labor with advanced manufacturing skills. In other instances, tax and operating incentives offered by a country may be significant enough to outweigh weakness on other dimensions. As such, the location decision is often guided by unique factors that may go well beyond those we have considered.
Additionally, even within the factors we have considered, the relative importance of these factors to a specific firm may be different than the weights we have considered. Furthermore, it may well be the case that the factors we classify for the purpose of convenience as secondary are in fact primary factors for consideration in a location decision for an individual firm or manufacturing sector. Finally, a number of local factors that go into firm location decisions may or may not be captured in the country-level analysis. For example, labor and rent costs are higher in urban areas relative to more distant suburban or rural areas. Recognizing this, we have developed a Tableau analytic and visualization tool in conjunction with this study that allows the interested reader to alter the weights and reassess the score based on the relative importance of these factors to them. Click here for the Cost of Manufacturing Operations Tool. We also note for
Conclusion
© 2021 Copyright owned by one or more of the KPMG International entities. KPMG International entities provide no services to clients. All rights reserved.
11Where to manufacture?

We also note for the reader that the primary cost factors are measured in US dollars. Since we have compared costs on a US dollar-denominated basis, the results are impacted by the relative strength of the various currencies relative to the dollar. As the foreign exchange rates fluctuate, as they inevitably will, the cost measurements we have relied on would vary and possibly impact the ranking of individual cost components, even if local currency costs do not change.
Finally, we note that the rankings are based on the best historical information available. Such data is mostly available only with a lag, and therefore the impact of recent trade disputes or the market disruptions from COVID-19 are not reflected in the results.
The disruption of the past year has forced many companies to rethink the strength and resilience of their supply chains, which, in turn, is shifting the focus towards micro-supply chain networks and local suppliers. It is expected that the cost equations will change significantly over the coming year as companies adjust their supply chains and markets start to focus on attracting foreign investment.
Frank Li Partner, AdvisoryKPMG China
© 2021 Copyright owned by one or more of the KPMG International entities. KPMG International entities provide no services to clients. All rights reserved.
12 Where to manufacture?
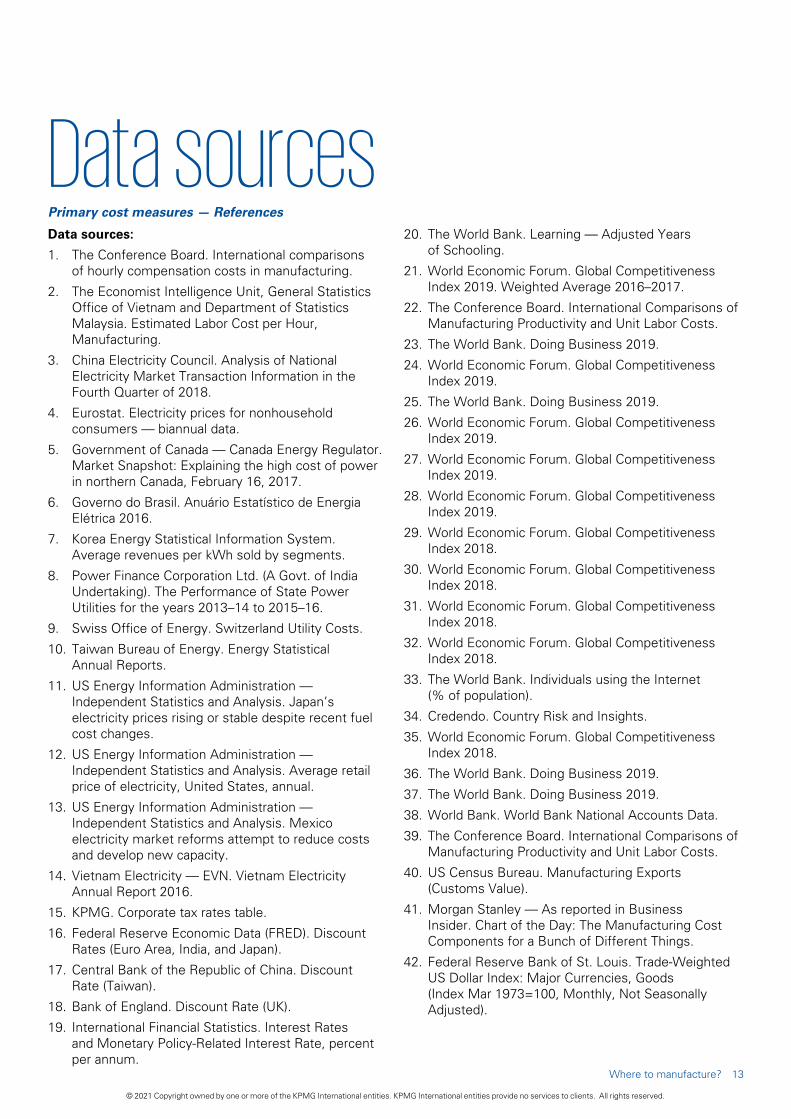
Primary cost measures — References
Data sourcesData sources:
1. The Conference Board. International comparisons of hourly compensation costs in manufacturing.
2. The Economist Intelligence Unit, General Statistics Office of Vietnam and Department of Statistics Malaysia. Estimated Labor Cost per Hour, Manufacturing.
3. China Electricity Council. Analysis of National Electricity Market Transaction Information in the Fourth Quarter of 2018.
4. Eurostat. Electricity prices for nonhousehold consumers — biannual data.
5. Government of Canada — Canada Energy Regulator. Market Snapshot: Explaining the high cost of power in northern Canada, February 16, 2017.
6. Governo do Brasil. Anuário Estatístico de Energia Elétrica 2016.
7. Korea Energy Statistical Information System. Average revenues per kWh sold by segments.
8. Power Finance Corporation Ltd. (A Govt. of India Undertaking). The Performance of State Power Utilities for the years 2013–14 to 2015–16.
9. Swiss Office of Energy. Switzerland Utility Costs.
10. Taiwan Bureau of Energy. Energy Statistical Annual Reports.
11. US Energy Information Administration — Independent Statistics and Analysis. Japan’s electricity prices rising or stable despite recent fuel cost changes.
12. US Energy Information Administration — Independent Statistics and Analysis. Average retail price of electricity, United States, annual.
13. US Energy Information Administration — Independent Statistics and Analysis. Mexico electricity market reforms attempt to reduce costs and develop new capacity.
14. Vietnam Electricity — EVN. Vietnam Electricity Annual Report 2016.
15. KPMG. Corporate tax rates table.
16. Federal Reserve Economic Data (FRED). Discount Rates (Euro Area, India, and Japan).
17. Central Bank of the Republic of China. Discount Rate (Taiwan).
18. Bank of England. Discount Rate (UK).
19. International Financial Statistics. Interest Rates and Monetary Policy-Related Interest Rate, percent per annum.
20. The World Bank. Learning — Adjusted Years of Schooling.
21. World Economic Forum. Global Competitiveness Index 2019. Weighted Average 2016–2017.
22. The Conference Board. International Comparisons of Manufacturing Productivity and Unit Labor Costs.
23. The World Bank. Doing Business 2019.
24. World Economic Forum. Global Competitiveness Index 2019.
25. The World Bank. Doing Business 2019.
26. World Economic Forum. Global Competitiveness Index 2019.
27. World Economic Forum. Global Competitiveness Index 2019.
28. World Economic Forum. Global Competitiveness Index 2019.
29. World Economic Forum. Global Competitiveness Index 2018.
30. World Economic Forum. Global Competitiveness Index 2018.
31. World Economic Forum. Global Competitiveness Index 2018.
32. World Economic Forum. Global Competitiveness Index 2018.
33. The World Bank. Individuals using the Internet (% of population).
34. Credendo. Country Risk and Insights.
35. World Economic Forum. Global Competitiveness Index 2018.
36. The World Bank. Doing Business 2019.
37. The World Bank. Doing Business 2019.
38. World Bank. World Bank National Accounts Data.
39. The Conference Board. International Comparisons of Manufacturing Productivity and Unit Labor Costs.
40. US Census Bureau. Manufacturing Exports (Customs Value).
41. Morgan Stanley — As reported in Business Insider. Chart of the Day: The Manufacturing Cost Components for a Bunch of Different Things.
42. Federal Reserve Bank of St. Louis. Trade-Weighted US Dollar Index: Major Currencies, Goods (Index Mar 1973=100, Monthly, Not Seasonally Adjusted).
© 2021 Copyright owned by one or more of the KPMG International entities. KPMG International entities provide no services to clients. All rights reserved.
13Where to manufacture?
© 2021 Copyright owned by one or more of the KPMG International entities. KPMG International entities provide no services to clients. All rights reserved.
14 Where to manufacture?
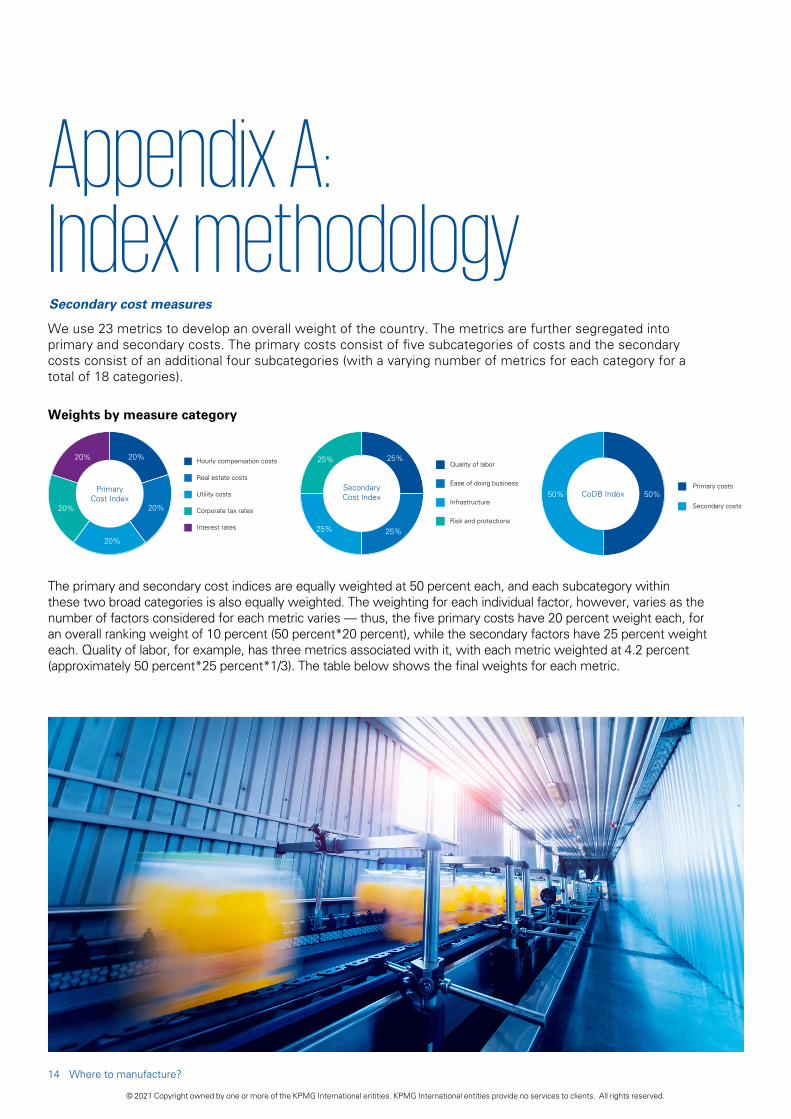
Appendix A:Index methodologySecondary cost measures
We use 23 metrics to develop an overall weight of the country. The metrics are further segregated into primary and secondary costs. The primary costs consist of five subcategories of costs and the secondary costs consist of an additional four subcategories (with a varying number of metrics for each category for a total of 18 categories).
The primary and secondary cost indices are equally weighted at 50 percent each, and each subcategory within these two broad categories is also equally weighted. The weighting for each individual factor, however, varies as the number of factors considered for each metric varies — thus, the five primary costs have 20 percent weight each, for an overall ranking weight of 10 percent (50 percent*20 percent), while the secondary factors have 25 percent weight each. Quality of labor, for example, has three metrics associated with it, with each metric weighted at 4.2 percent (approximately 50 percent*25 percent*1/3). The table below shows the final weights for each metric.
Weights by measure category
Primary costs
Secondary costs
CoDB Index50% 50%
Quality of labor
Ease of doing business
Infrastructure
Risk and protections
Secondary Cost Index
25% 25%
25%25%
20%
Primary Cost Index
Hourly compensation costs
Real estate costs
Utility costs
Corporate tax rates
Interest rates
20%
20%
20%
20%

In addition to the weights assigned for each metric, the methodology for developing the index consisted of the following steps:
— Performance on each metric is ranked using a percentile-based methodology. The top (or bottom from an operating cost perspective based on the metric) 15 percent receives the highest rank, and the lowest (or highest) 15 percent receives a rank of 5. Ranks for real estate costs are shown below as an example. Thus, the cheapest or lowest 15 percentile of real estate costs is rank 1, percentiles between the 15 and 35 percentiles receive a rank of 2 and so on. This is further illustrated in the table below.
— The final scores are calculated by applying the appropriate weights for each metric first at the subcategory level and combined (using weight multiplied by the rank) with the primary and secondary cost scores and ultimately to the overall score. The scores are then ranked for ease of display and comparison.
Percentile rankings by metric
Real estate costs
Ranking From To
1 0.00% 14.99%
2 15.00% 34.99%
3 35.00% 64.99%
4 65.00% 84.99%
5 85.00% 100.00%
© 2021 Copyright owned by one or more of the KPMG International entities. KPMG International entities provide no services to clients. All rights reserved.
15Where to manufacture?
Final weights in overall ranking by metric
# Measure Cost type Subcategory Overall ranking weight
1 Hourly compensation costs Primary 10.0%
2 Real estate costs Primary 10.0%
3 Utility costs Primary 10.0%
4 Corporate tax rates Primary 10.0%
5 Interest rates Primary 10.0%
6 Learning-adjusted years of schooling Secondary Quality of Labor 4.2%
7 Skill set of graduates Secondary Quality of Labor 4.2%
8 Real value added per employee Secondary Quality of Labor 4.2%
9 Days to start business Secondary Ease of Doing Business 4.2%
10 Burden of government regulation Secondary Ease of Doing Business 4.2%
11 Registering property Secondary Ease of Doing Business 4.2%
12 Road Quality Index Secondary Infrastructure 1.0%
13 Railroad quality Secondary Infrastructure 1.0%
14 Airport connectivity Secondary Infrastructure 1.0%
15 Liner Shipping Connectivity Index Secondary Infrastructure 1.0%
16 Electric power losses (% of output) Secondary Infrastructure 1.4%
17 Exposure to unsafe drinking water Secondary Infrastructure 1.4%
18 Reliability of water supply Secondary Infrastructure 1.4%
19 Access to internet/Wi-Fi Secondary Infrastructure 4.2%
20 Political risk Secondary Risk and Protections 3.1%
21 Enforcing contracts Secondary Risk and Protections 3.1%
22 Protecting minority investors Secondary Risk and Protections 3.1%
23 Corruption Perception Index Secondary Risk and Protections 3.1%

The information contained herein is of a general nature and is not intended to address the circumstances of any particular individual or entity. Although we endeavor to provide accurate and timely information, there can be no guarantee that such information is accurate as of the date it is received or that it will continue to be accurate in the future. No one should act on such information without appropriate professional advice after a thorough examination of the particular situation.
© 2021 Copyright owned by one or more of the KPMG International entities. KPMG International entities provide no services to clients. All rights reserved.
KPMG refers to the global organization or to one or more of the member firms of KPMG International Limited (“KPMG International”), each of which is a separate legal entity. KPMG International Limited is a private English company limited by guarantee and does not provide services to clients. For more detail about our structure please visit home.kpmg/governance.
The KPMG name and logo are trademarks used under license by the independent member firms of the KPMG global organization.
Throughout this document, “we”, “KPMG”, “us” and “our” refers to the global organization or to one or more of the member firms of KPMG International Limited (“KPMG International”), each of which is a separate legal entity.
Designed by Evalueserve. Publication name: Where to manufacture? Publication number: 137330-G Publication date: June 2021
Some or all of the services described herein may not be permissible for KPMG audit clients and their affiliates or related entities.
home.kpmg/socialmedia
home.kpmg/industrialmanufacturing
Contacts Stéphane Souchet Global Head ofIndustrial ManufacturingKPMG International+33 (0) 1 55 68 33 [email protected]
Cameron SlappKPMG in Australia +61 2 9335 [email protected]
Tammy BrownKPMG in Canada +1 416 777 [email protected]
Norbert Meyring KPMG China+86 21 22 12 27 [email protected]
Ulrich Ackermann KPMG in Germany+49 711 [email protected]
Vinod Ramachandran KPMG in India+91 22 30 90 19 [email protected]
Jun Okamoto KPMG in Japan+81 33 54 85 [email protected]
Rebecca Shalom KPMG in the UK+44 (0) 207 311 [email protected]
Brian Heckler KPMG in the US+1 312 665 [email protected]