Where is the Poverty–Environment Nexus? Evidence from Cambodia, Lao PDR, and Vietnam
22
Where is the Poverty–Environment Nexus? Evidence from Cambodia, Lao PDR, and Vietnam SUSMITA DASGUPTA, UWE DEICHMANN, CRAIG MEISNER and DAVID WHEELER * The World Bank, Washington, DC, USA Summary. — This paper investigates the poverty–environment nexus at the provincial and district levels in Cambodia, Lao PDR, and Vietnam. The analysis focuses on spatial associations between poverty populations and five environmental problems: deforestation, fragile soils, indoor air pollu- tion, contaminated water, and outdoor air pollution. The results suggest that the nexus is quite dif- ferent in each country. We conclude that the nexus concept can provide a useful catalyst for country-specific work, but not a general formula for program design. Joint implementation of pov- erty and environment strategies may be cost effective for some environmental problems, but inde- pendent implementation may be preferable in many cases as well. Ó 2005 Elsevier Ltd. All rights reserved. Key words — poverty, pollution, basic needs, deforestation, sanitation, natural resources 1. INTRODUCTION During the past few years, the publications of international development agencies have high- lighted the importance of the ‘‘poverty–environ- ment nexus,’’ a set of mutually reinforcing links between poverty and environmental damage (Bojo ¨ et al., 2001; Bosch, Hommann, Rubio, Sadoff, & Travers, 2001; Ekbom & Bojo ¨, 1999). In this nexus, poverty reduction and envi- ronmental protection are complementary goals. For environmentalists, the nexus concept has provided a welcome defense against arguments, based on the ‘‘Environmental Kuznets Curve,’’ that the early stages of development are unavoidably marked by conflicts between pov- erty reduction and environmental protection. 1 Common profession of belief in the nexus has also smoothed uneasy relations between envi- ronmental specialists and traditional project officers in development aid organizations. Numerous studies have suggested that envi- ronmental damage can have particular signifi- cance for the poor. Recent participatory poverty assessments, conducted in 14 develop- ing countries of Asia, Africa, and Latin Amer- ica, reveal a common perception by the poor that environmental quality is an important determinant of their health, earning capacity, security, energy supplies, and housing quality (Brocklesby & Hinshelwood, 2001). Rural stud- ies often observe that poor people’s economic dependence on natural resources makes them particularly vulnerable to environmental degra- dation (Ambler, 1999; Cavendish, 1999, 2000; Kepe, 1999; Reddy & Chakravarty, 1999). Other studies have assessed the health damage suffered by poor households that are directly exposed to pollution of the air, water, and land (Akbar & Lvovsky, 2000; Bosch et al., 2001; Brooks & Sethi, 1997; Mink, 1993; Songsore & McGranahan, 1993; Surjadi, 1993). In addi- tion, environmental disasters and environ- ment-related conflicts may have regressive impacts because the poor are least capable of coping with their effects (Albla-Betrand, 1993; Myers & Kent, 1995). In some cases, poor households them- selves may increase environmental degradation. * The authors would like to thank Jostein Nygard, Giovanna Dore, Piet Buys, Kiran Pandey, and Hua Wang, for their valuable comments and contributions. This research was supported by the World Bank’s Environment Department and its East Asia and Pacific Unit for Environment and Social Development. Final revision accepted: October 11, 2004. World Development Vol. 33, No. 4, pp. 617–638, 2005 Ó 2005 Elsevier Ltd. All rights reserved Printed in Great Britain 0305-750X/$ - see front matter doi:10.1016/j.worlddev.2004.10.003 www.elsevier.com/locate/worlddev 617
-
Upload
susmita-dasgupta -
Category
Documents
-
view
212 -
download
0
Transcript of Where is the Poverty–Environment Nexus? Evidence from Cambodia, Lao PDR, and Vietnam

World Development Vol. 33, No. 4, pp. 617–638, 2005� 2005 Elsevier Ltd. All rights reserved
Printed in Great Britain
0305-750X/$ - see front matterdoi:10.1016/j.worlddev.2004.10.003www.elsevier.com/locate/worlddev
Where is the Poverty–Environment Nexus?
Evidence from Cambodia, Lao PDR, and Vietnam
SUSMITA DASGUPTA, UWE DEICHMANN,CRAIG MEISNER and DAVID WHEELER *
The World Bank, Washington, DC, USA
Summary. — This paper investigates the poverty–environment nexus at the provincial and districtlevels in Cambodia, Lao PDR, and Vietnam. The analysis focuses on spatial associations betweenpoverty populations and five environmental problems: deforestation, fragile soils, indoor air pollu-tion, contaminated water, and outdoor air pollution. The results suggest that the nexus is quite dif-ferent in each country. We conclude that the nexus concept can provide a useful catalyst forcountry-specific work, but not a general formula for program design. Joint implementation of pov-erty and environment strategies may be cost effective for some environmental problems, but inde-pendent implementation may be preferable in many cases as well.
� 2005 Elsevier Ltd. All rights reserved.Key words — poverty, pollution, basic needs, deforestation, sanitation, natural resources
* The authors would like to thank Jostein Nygard,
Giovanna Dore, Piet Buys, Kiran Pandey, and Hua
Wang, for their valuable comments and contributions.
This research was supported by the World Bank’s
Environment Department and its East Asia and Pacific
Unit for Environment and Social Development. Final
revision accepted: October 11, 2004.
1. INTRODUCTION
During the past few years, the publications ofinternational development agencies have high-lighted the importance of the ‘‘poverty–environ-ment nexus,’’ a set of mutually reinforcing linksbetween poverty and environmental damage(Bojo et al., 2001; Bosch, Hommann, Rubio,Sadoff, & Travers, 2001; Ekbom & Bojo,1999). In this nexus, poverty reduction and envi-ronmental protection are complementary goals.For environmentalists, the nexus concept hasprovided a welcome defense against arguments,based on the ‘‘Environmental Kuznets Curve,’’that the early stages of development areunavoidably marked by conflicts between pov-erty reduction and environmental protection. 1
Common profession of belief in the nexus hasalso smoothed uneasy relations between envi-ronmental specialists and traditional projectofficers in development aid organizations.Numerous studies have suggested that envi-
ronmental damage can have particular signifi-cance for the poor. Recent participatorypoverty assessments, conducted in 14 develop-ing countries of Asia, Africa, and Latin Amer-ica, reveal a common perception by the poorthat environmental quality is an importantdeterminant of their health, earning capacity,
617
security, energy supplies, and housing quality(Brocklesby & Hinshelwood, 2001). Rural stud-ies often observe that poor people’s economicdependence on natural resources makes themparticularly vulnerable to environmental degra-dation (Ambler, 1999; Cavendish, 1999, 2000;Kepe, 1999; Reddy & Chakravarty, 1999).Other studies have assessed the health damagesuffered by poor households that are directlyexposed to pollution of the air, water, and land(Akbar & Lvovsky, 2000; Bosch et al., 2001;Brooks & Sethi, 1997; Mink, 1993; Songsore& McGranahan, 1993; Surjadi, 1993). In addi-tion, environmental disasters and environ-ment-related conflicts may have regressiveimpacts because the poor are least capable ofcoping with their effects (Albla-Betrand, 1993;Myers & Kent, 1995).In some cases, poor households them-
selves may increase environmental degradation.

618 WORLD DEVELOPMENT
Poverty-constrained options may induce thepoor to deplete resources at rates that are incom-patible with long-term sustainability (Holden,1996). In such cases, degraded resources precip-itate a ‘‘downward spiral,’’ by further reducingthe income of the poor (Cleaver & Schreiber,1994; Dasgupta & Maler, 1994; Durning, 1989;Ekbom & Bojo, 1999; Mink, 1993; Pearce &Warford, 1993; Prakash, 1997; World Bank,1992; World Commission on Environment &Development, 1987). Rapid population growth,coupled with insufficient means or incentives tointensify production, may induce overexploita-tion of fragile lands on steep hillsides, or inva-sion of areas that governments are attemptingto protect for environmental reasons. Again, adownward spiral can ensue (World Bank, 1992).The existing literature also suggests that the
strength of poverty–environment linkages maybe affected by factors as diverse as economicpolicies, resource prices, local institutions,property rights, entitlements to natural re-sources, and gender relations (Ambler, 1999;Arnold & Bird, 1999; Barbier, 2000; Dasgupta& Maler, 1994; Dutt & Rao, 1996; Ekbom &Bojo, 1999; Eskeland & Kong, 1998; Heath &Binswanger, 1996; Leach & Mearns, 1991;Roe, 1998). This research suggests that the rel-ative strength of links between poverty andenvironment may be very context specific(Bucknall, Kraus, & Pillai, 2000; Chomitz,1999; Ekbom & Bojo, 1999). In a recent theo-retical work, Ezzati, Singer, and Kammen(2001) have demonstrated the implications forthe Environmental Kuznets Curve (EKC). Ina long-run model that allows for many interac-tions between socioeconomic and environmen-tal variables, they show that the conventional,U-shaped EKC describes only one of many po-tential development paths. 2
What does the empirical evidence suggestabout the actual prevalence and importanceof the poverty–environment nexus and comple-mentary problems? Here the actual record issparse, because the requisite data are often dif-ficult to obtain in developing countries. In prin-ciple, household-level studies can adequatelytest whether environmental problems have adisproportionate impact on the poor. In prac-tice, such tests are rare. For example, somestudies have established a link between povertyand consumption of wood fuel, and at least,one credible study has established the relation-ship between indoor combustion and health(Ezzati & Kammen, 2001). However, the re-search also suggests the importance of interven-
ing variables such as cooking practices (indoorvs. outdoor) and fuel choice (e.g., charcoalemits far fewer fine particles than wood). Chil-dren die of waterborne disease at higher rates inpoor households, but again, research points tothe significance of intervening variables suchas water source quality and mother’s education(Filmer & Pritchett, 1997; Merick, 1985). Rig-orous empirical studies that combine local-areaenvironmental variables (deforestation, out-door air quality, water quality, soil erosion,etc.) with standard household surveys are al-most nonexistent. Similarly, very few local-areastudies relate environmental quality to thenumber and characteristics of poor households.In poverty–environment analysis that is rele-
vant for policy, the spatial dimension is criticalfor two reasons: First, most environmentalproblems are inherently geographical. In princi-ple, different environmental problems should beanalyzed at different regional scales. In the caseof pollution, for example, the theoreticallyappropriate scale is affected by the dispersalcharacteristics of the pollutant and medium:Particulate pollution from cement mills mayonly be dangerous in one urban region; acidrain from sulfur emissions may damage forestshundreds of miles from the source; and eutro-phication from fertilizer runoff may affectocean fisheries a thousand miles downstreamfrom the farms that are the source of the prob-lem. In practice, data constraints often dictatethe choice of the scale. In Cambodia, Vietnam,and Lao PDR, for example, appropriate dataare relatively plentiful at the provincial level,scarce at the district level (except in Cambodia),and practically nonexistent for subdistricts.Accordingly, this paper focuses on provincialdata, with extensions to the district level forCambodia. While we readily acknowledge thatmore disaggregated evidence would be desir-able, we believe that even province-level analy-sis provides a useful first approximation forpoverty–environment work.We also recognize the possibility that cross-
country externalities may introduce elementsof the nexus at the regional level, as we havenoted in the previous paragraph. If much of pol-lution’s impact is felt far downwind or down-stream, failure to find a nexus in the local datamay simply mask trans-boundary effects. Forsome pollutants (e.g., acid rain and deforesta-tion from industrial sulfur emissions), this mayindeed be a problem. However, a large bodyof evidence indicates that local impacts predom-inate for pollutants that most heavily affect the
WHERE IS THE POVERTY–ENVIRONMENT NEXUS? 619
poor. The foremost examples are fine particu-late air pollution, which causes the bulk of car-diorespiratory problems, and fecal coliformpollution of water, which is the major cause ofintestinal disease. Most particulate air pollutionsettles locally; locally generated ‘‘plumes’’ of fe-cal coliform pollution generally persist for sev-eral miles downstream, but would presenttrans-boundary problems only in border areas.At the provincial level, a minimum criterion
for potential significance of the nexus is dispro-portionate environmental damage in high-pov-erty areas. Correlation does not necessarilyimply causality, of course, but the lack of timeseries data prevents formal testing of structuralcausation models. 3 Nevertheless, some reason-able inferences from positive correlations arepossible. We can also gain an insight from con-trary cases, in which some of a country’s envi-ronmental problems exhibit no spatialcorrelation with poverty across provinces. Atleast three inferences are possible: The coun-try’s poverty–environment nexus may not in-clude these problems; the government mayalready have addressed them effectively; ortheir part of the nexus may only be operativeat the district or subdistrict level. Data permit-ting, further tests could be run at those levels.Administrative economics provide the second
rationale for spatially disaggregated analysis.An appropriate geographic scale must strikean appropriate balance between the benefits ofdecentralization and the associated costs. Onthe environment side, for example, effective reg-ulation requires local inspection of damagesources (pollution, deforestation, etc.), as wellas more centralized facilities for informationcollection, storage, and analysis. Environmentalmanagement is undoubtedly improved by aknowledge of local conditions, but the marginalcost of administration rises with distance fromadministrative centers, because of deterioratingtransport and communications quality. Gener-ally, province- or district-level administrationstrikes the right balance between headquartersscale economies and the cost of dispersed mon-itoring and enforcement operations.Similar factors govern the choice of adminis-
trative scale for poverty-alleviation programs.Headquarters staffing remains important, butsuch programs also require local monitoringinformation and frequent interaction with cli-ents. By the same logic, province- or district-le-vel administration may be preferable to nationalor subdistrict administration in many cases.
Why are these factors important for analysisof the poverty–environment nexus? From a pol-icy perspective, the nexus is important only if ithas consequences for the allocation and admin-istration of public resources for alleviation ofpoverty and environment problems. If there isno nexus, then optimal policy should treat thetwo sectors as separate, divide the overall bud-get between them by some criteria, and use sep-arate calculations to distribute resourcesamong provincial or district agencies. If pov-erty–environment links are strong, on the otherhand, then optimal policy should treat themjointly in allocating the overall budget. Someresources for environmental improvementshould be allocated to poverty alleviation whenpoverty significantly increases environmentaldegradation, and the converse should holdwhen environmental factors significantly in-crease poverty.In this paper, we use newly available data to
test for the existence of the nexus in Cambodia,Lao PDR, and Vietnam. Our main analyticaltools are georeferenced indicator mapping, cor-relation, and regression analysis. 4 We recog-nize that systematic empirical work is onlybeginning in this area; future work may revealthat the regional scale of our analysis is toobroad, and that the ‘‘true’’ poverty–environ-ment nexus is more localized in nature. It is alsoentirely possible that different dimensions ofthe nexus are best analyzed at different geo-graphical scales. For example, watershedsmay provide the best spatial units for the studyof relationships linking poverty, soil erosion,and deforestation. 5 At present, the availabledata limit us to the broader exercise that is pre-sented here. In addition, our focus on the com-parative incidence of poverty–environmentproblems leads us to focus the exercise at acommon geographical scale.The remainder of the paper is organized as
follows: Section 2 provides an overview of themethods that we employ and relates them tounderlying hypotheses about links betweenpoverty and the environment. Section 3 intro-duces the new regional dataset for Cambodia,Vietnam, and Lao PDR, with particular atten-tion to the data-collection process, coverage,and accuracy. In Section 4, we provide a de-tailed illustration of our approach for Cambo-dia. Section 5 summarizes comparableevidence for Lao PDR and Vietnam, 6 Section6 discusses some causal implications of the re-sults, and Section 7 concludes the paper.

620 WORLD DEVELOPMENT
2. MAPPING THE PROBLEMS
(a) Absolute poverty
For each country, our provincial or district-level absolute poverty indices are determinedby the number of inhabitants whose daily con-sumption expenditure cannot support a foodintake of more than 2,000 calories, plus mini-mal nonfood expenditures. By this measure,the national incidence of absolute poverty is36% in Lao PDR, 40% in Cambodia, and37% in Vietnam. 7 To illustrate, Figure 1 dis-plays the regional distribution of absolute pov-erty in Cambodia.We vary our use of the absolute poverty mea-
sure according to the nature of each environ-mental problem. For example, we employboth the size of the poverty population andthe poverty head-count ratio (or incidence) inour regression analyses of the relationshipslinking poverty to illness from indoor air pollu-tion and polluted water. 8, 9 For our analysis ofdeforestation, we use the density of the povertypopulation per unit area. 10
Even though absolute material poverty pro-vides a useful indicator, we recognize that nosingle measure can capture all the dimensionsassociated with a broader concept of poverty.For an analysis of the poverty–environmentnexus, other relevant factors may include lackof access to common property resources, poorhealth, and low levels of education. For exam-
Figure 1. Cambodia: total poverty population by di
ple, research on China and Indonesia has sug-gested that education reduces pollutiondamage because better-educated communitiesare more willing and able to organize to controlpolluters. 11 As better data become available,more fully specified models should incorporatesuch factors. In this study, the consequences ofour reliance on a single poverty index areambiguous. Exclusion of poverty dimensionsthat are correlated with material poverty mayresult in overestimation of its impact in our cor-relation and regression analysis. On the otherhand, exclusion of these other dimensions alsosuppresses their potentially significant two-way interactions with environmental variables.
(b) Environmental problems
We consider five critical environmental prob-lems, two related to natural resource degrada-tion and three to pollution. The ‘‘Green’’problems are deforestation and soil degrada-tion, whereas the ‘‘Brown’’ problems are in-door air pollution, contaminated water, andoutdoor air pollution.
(i) DeforestationDeforestation serves as a proxy for the loss of
critical ecosystems and biodiversity, as well asincreased risk of soil erosion in steeply slopedareas. To test for a poverty–environment nexusin this context, we map forested areas and ratesof deforestation by province and district. In
strict, 2000. Source: World Food Program, 2001.

WHERE IS THE POVERTY–ENVIRONMENT NEXUS? 621
areas where significant forests remain, we assessthe spatial correlation of poverty and deforesta-tion using maps, graphical scatter plots, andregressions.For the regression analysis, our two principal
variables are the settlement density of the poorpopulation and overall population density. 12
By incorporating both, we can simultaneouslytest the impact of poor and nonpoor house-holds on forest clearing. 13 Insignificance of set-tlement density for the poverty population inthis regression would certainly weaken thenexus argument that poor households clear for-ests more rapidly than others. We cannot testthe converse proposition (exogenously gener-ated deforestation increases poverty) until wehave better information about the dependenceof the poor on forest products. Future researchshould use local data for a more detailed anal-ysis of this potential link.We also test for the impact of commercial
logging by controlling for differences in treespecies. In our three study countries, some areaexperts have suggested that deforestation is sig-nificantly faster in areas dominated by ever-greens, which are the preferred species forcommercial loggers.
(ii) Fragile soilsSteep hillsides under intensive cultivation are
particularly vulnerable to erosion and soil deg-radation without terracing, and the economicreturn to farming steeply sloped areas is gener-ally lower than the return to cultivating alluvialsoils in river valleys. While these observationsare straightforward, their implications for thepoverty–environment nexus depend on localpossibilities for migration. In regions wherepeople are relatively free to migrate to areaswith higher expected returns, we would expectsteeply sloped areas to be more sparsely popu-lated than alluvial plains. If population growthraises the labor intensity of alluvial farming, wewould expect diminishing returns in the low-lands to induce uphill movement by farmers.This movement would be tempered by erosionand soil depletion in the highlands, with a con-sequent drop in the overall marginal productiv-ity of agricultural labor. The remaininghighland farmers should farm larger plots, onaverage, to compensate for poorer soils andto maintain parity in expected income with low-land farmers. Damage to highland soils wouldbe a resource conservation problem for societyas a whole, but would not have a dispropor-
tionate impact on the poorest farmers if theyremained free to migrate.A very different picture would emerge, how-
ever, if marginalized ethnic groups were iso-lated in highland areas by historical patternsof separation and discrimination. In this case,population growth and soil degradation in thehighlands might well create a ‘‘poverty trap’’there. By implication, a potential poverty–envi-ronment nexus exists in regions where poorhouseholds are highly concentrated in steeplysloped areas.
(iii) Indoor air pollutionRecent research has suggested that indoor air
pollution from wood fuels is a major cause ofrespiratory disease in developing countries.Many households use wood or charcoal in Cam-bodia, Lao PDR, and Vietnam, so indoor airpollution may be a significant health problem.Although indoor air monitoring data are notyet available in the region, household surveyshave recorded the use of wood and charcoal.We use regression analysis to test whether pov-erty and wood fuel use are significantly associ-ated, after controlling for area population. Werecognize that our results can only be suggestive,since the impact of wood fuel use depends onwhether burning is indoors or outdoors. Gaug-ing the true magnitude of the problem will re-quire household-level pollution monitoring andhealth assessment. This should be an importanttopic for future research in our focal countries.
(iv) Access to clean water and sanitationSafe water and adequate sanitation are criti-
cal determinants of health status, particularlyfor children. Ingestion of coliform bacteriafrom contaminated drinking water or food isa prime cause of diarrheal disease, which is inturn a major cause of infant mortality in devel-oping countries. Although data for SoutheastAsia remain limited, we use the available infor-mation to assess the spatial relationships link-ing poverty, sanitation, and diarrheal disease.At present, many households in the three coun-tries do not have access to safe water or sanita-tion. A poverty–environment nexus exists if theaffected households are disproportionatelypoor. We use maps, scatter plots, and regres-sions to test for this possibility.
(v) Outdoor air pollutionOutdoor air pollution is primarily an urban
phenomenon, whose severity depends on the

622 WORLD DEVELOPMENT
scale of polluting activities, their pollutionintensity (or pollution per unit of output), andthe characteristics of the urban air shed. Recentresearch has established that exposure to fineparticulates (with diameters of 10 microns(PM10) or less) is the main cause of pollution-related respiratory disease. Until recently, littlewas known about fine-particulate pollution inSoutheast Asian cities. During the past year,however, the World Health Organization andthe World Bank have used a large internationaldatabase to develop a prediction model forPM10 pollution, based on urban population, in-come, fuel use, and local atmospheric charac-teristics (wind, rainfall, temperature, altitude,etc.). 14
We measure the health impact of PM10 pollu-tion using a standard ‘‘dose–response’’ func-tion, based on population exposure studies,that relates the incidence of mortality to theairborne concentration of PM10.
15 For eachurban area in Cambodia, Lao PDR, and Viet-nam, we use the World Bank/WHO model topredict the airborne concentration of PM10,transform the concentration to an estimatedmortality incidence using the dose–responsefunction, and multiply the predicted incidenceby the urban population to obtain estimateddeaths from air pollution. We cannot adjustspecifically for the impact of air pollution onthe poor, because the existing dose–responsefunctions do not distinguish between incomegroups. It seems likely that our approachunderestimates health damage to the poor,who are generally unable to afford health carethat can (at least partially) compensate for theeffect of air pollution.We would, of course, prefer to base our esti-
mates on actual monitoring data. However, toour knowledge, previous environmental studieshave not even attempted to estimate air pollu-tion for cities in the region. We therefore offerthese estimates as a suggestive benchmark forfurther research. Aggregation of the urban-arearesults to the provincial level enables us to testfor a poverty–environment nexus by assessingthe spatial correlation between poverty andhealth damage from outdoor air pollution.
3. REGIONAL DATASETSFOR CAMBODIA, VIETNAM,
AND LAO PDR
Work on the poverty–environment nexus re-quires spatially integrated information, but the
underlying problems have traditionally receivedseparate treatment. The spatial dimension ofpoverty has probably received the most atten-tion. In our three focal countries, for example,poverty mapping has been supported by theWorld Food Program and the World Bank inCambodia, the International Food Policy Re-search Institute (IFPRI) in Vietnam, and theWorld Bank in Lao PDR.Support for spatially oriented work on the
environment has been scattered among agen-cies that have interests in different topics. TheMekong River Commission has supportedwork on deforestation, terrain slopes, erosion,and water quality in our three focal countries.As previously mentioned, the World HealthOrganization and the World Bank have esti-mated air pollution for cities with over100,000 in population as part of an interna-tional program.Various household survey exercises have pro-
vided critical information for the analysis ofhealth damage from water pollution and indoorair pollution. For Cambodia and Vietnam,USAID has sponsored regionally coded Demo-graphic and Health Surveys (DHS) that includedata on intestinal illness, respiratory disease re-lated to air pollution, and the use of biomassfuels that are major determinants of indoorair pollution. Population census data for Cam-bodia provide regionally coded information onhouseholds’ access to safe drinking water andsanitation.When this study began, these critical informa-
tion sources were scattered among internationalagencies, local development research institutes,and government ministries that had sponsoredor participated in the work. Accessing the datainvolved several trips to the three countries bya team of World Bank staff members and con-sultants, including the authors. The WorldBank’s Spatial Analysis Team incorporatedthe information into the spatially integrateddataset that has been used for this paper.Most topical components of the data (e.g.,
poverty incidence, intestinal illness from waterpollution) reflect sophisticated survey and map-ping work by experienced international teams.National population census surveys have alsoemployed standard sampling methods. For thisanalysis, the major problem has not been thequality of the underlying data, but rather theappropriate level of spatial integration. Somegeophysical data (e.g., forest coverage, terrainmaps) have very high levels of spatial disaggre-gation, while the coverage of some household

WHERE IS THE POVERTY–ENVIRONMENT NEXUS? 623
survey data (e.g., the DHS survey for Vietnam)is only sufficient to support reliable estimationat the provincial level. To maintain an inte-grated view, we have analyzed the data at thegreatest common level of disaggregation avail-able in each country. Accordingly, we haveanalyzed the Cambodian data at the district(subprovincial) level, while limiting the exerciseto the provincial level in Lao PDR and Viet-nam.
Figure 2. Cambodia: settlement density of the povert
Figure 3. Cambodia: forested area, 1997. Sourc
4. EVIDENCE FOR CAMBODIA
To provide the most disaggregated view ofthe evidence, we begin with the district-levelanalysis for Cambodia. Figure 1 provides thebest available map of Cambodia’s poverty pop-ulation at the district level: Poor households areconcentrated along an axis that runs northwestto the border with Thailand. Figure 2, whichdisplays variations in the density of the poverty
y population. Source: World Food Program, 2001.
e: Mekong River Commission (MRC), 2001.
624 WORLD DEVELOPMENT
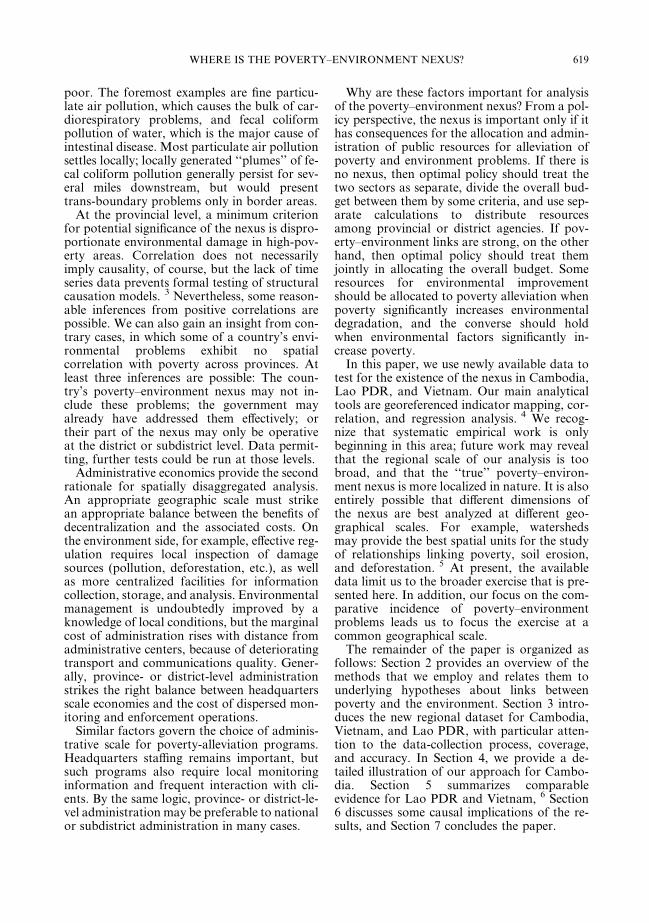
population, suggests that provision of servicesto the poor would have the lowest unit cost inthe southeastern part of the axis.Figures 3 and 4 provide maps of Cambodia’s
forest cover and rate of deforestation for theperiod 1993–97. Figure 4 suggests that defores-tation is a major problem at the margin of thecentral population axis; many contiguous dis-tricts have very high deforestation, and manyareas, one district removed, also have highrates. The other region with rapid deforestationis the sparsely populated northeast. For thecountry as a whole, a comparison of Figures1 and 4 suggests that priority areas for povertyalleviation and forest protection are weakly re-lated because many of the core poverty areas
Figure 4. Cambodia: deforestation rate, 1993–97. S
0
20
40
60
80
100
120
140
0 20 40 60 80Number o
Def
ores
tati
on r
ate
(ran
k)
Figure 5. Cambodia: rank scatter: defore
are already deforested. The scatter diagram inFigure 5 confirms this, showing a nearly ran-dom relationship with a rank correlation of0.15.Our regression results (Table 1) suggest that
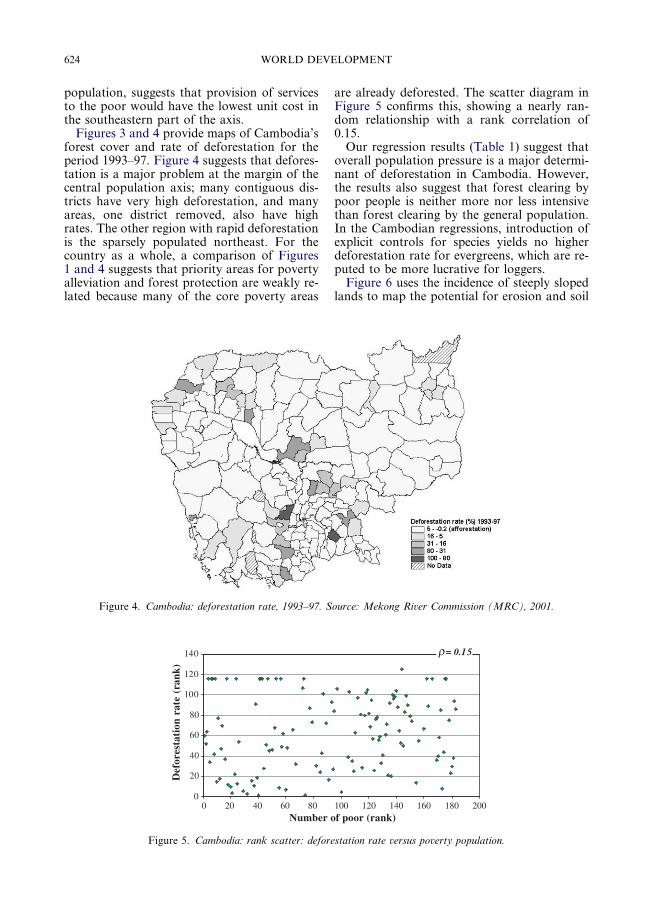
overall population pressure is a major determi-nant of deforestation in Cambodia. However,the results also suggest that forest clearing bypoor people is neither more nor less intensivethan forest clearing by the general population.In the Cambodian regressions, introduction ofexplicit controls for species yields no higherdeforestation rate for evergreens, which are re-puted to be more lucrative for loggers.Figure 6 uses the incidence of steeply sloped
lands to map the potential for erosion and soil
ource: Mekong River Commission (MRC), 2001.
100 120 140 160 180 200f poor (rank)
ρ = 0.15
station rate versus poverty population.

Table 1. Cambodia: population, poverty anddeforestation
Variable Model 1 Model 2 Model 3
Log(Poor/Forest
cover 93)
�0.007 �0.007
Log(Population/
Forest cover 93)
�0.010 �0.011 �0.018**
Evergreen 0.052* 0.018 0.020
Deciduous 0.036
Mixed 0.062**
Constant �0.014 0.030 0.039
N 369 369 369
R2 0.065 0.056 0.052
Dependent variable: Log(Forest cover 1997/Forest cover1993). Evergreen, deciduous, and mixed forest dummyvariables.* Significant at the 10% level.** Significant at the 5% level.
WHERE IS THE POVERTY–ENVIRONMENT NEXUS? 625
depletion in Cambodia. Distinct highland areasare visible in the northeast, southeast, and par-ticularly the southwest regions of the county.The country’s central population axis, on theother hand, is effectively defined by the low-lands. Regions with intermediate topographyare intermediate in settlement as well.Comparison of Figures 1 and 6 suggests a
negative relationship between settlement bythe poor and steeply sloped land: Poor peopleare heavily concentrated in lowland areas andreside at a much lower density in highland
Figure 6. Cambodia: percent of land that is steeply slope
areas. The map shows little evidence of largepoverty populations in steeply sloped areas,suggesting relatively few cases of inability tomigrate because of ethnic segmentation anddiscrimination. The scatter in Figure 7 confirmsthe negative relationship between poverty andsteeply sloped land (simple correlation coeffi-cient: �0.29), and is consistent with a modelof relatively free migration in Cambodia.Figure 8 displays the scatter plot of district-
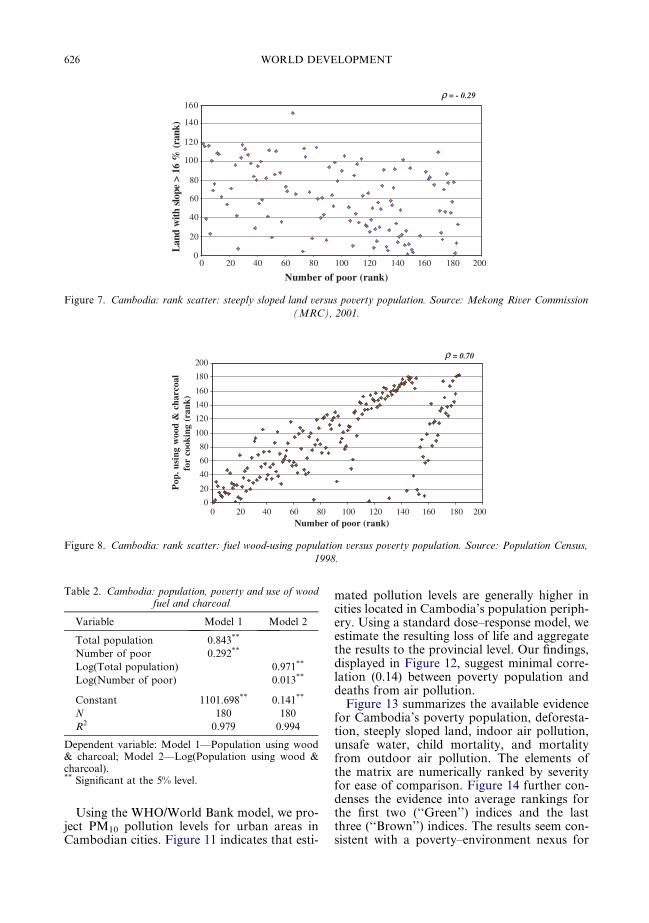
level poverty population versus populationusing fuel wood or charcoal. Obviously, therelationship is very close (the correlation coeffi-cient is 0.70, with much of the remaining varia-tion explained by the plot’s obvious separationinto two separate sets of points). However, theexistence of a true poverty–environment nexusin this context depends on more intensive useof charcoal and wood fuel by poor households.The results in Table 2 do, in fact, indicate a
strong association between poverty and woodfuel use after we control for general populationeffects.Figure 9 suggests a close spatial correlation
between poverty and lack of access to cleanwater. Regression analysis (Table 3) also sug-gests that poor households havemuch less accessto safe water than higher-income households inCambodia. The implications for child mortalityare suggested by Figure 10, which displays theregional distribution of childhood deaths inCambodia. Again, the spatial correlation withthe poverty population is evident.
d. Source: Mekong River Commission (MRC), 2001.
Lan
d w
ith s
lope
> 1
6 %
(ra
nk)
= - 0.29
0 20 40 60 80 100 120 140 160 180 200
Number of poor (rank)
0
20
40
60
80
100
120
140
160 ρ
Figure 7. Cambodia: rank scatter: steeply sloped land versus poverty population. Source: Mekong River Commission
(MRC), 2001.
0
20
40
60
80
100
120
140
160
180
200
Pop
. usi
ng w
ood
& c
harc
oal
f
or c
ooki
ng (
rank
)
= 0.70
0 20 40 60 80 100 120 140 160 180 200Number of poor (rank)
ρ
Figure 8. Cambodia: rank scatter: fuel wood-using population versus poverty population. Source: Population Census,
1998.
Table 2. Cambodia: population, poverty and use of woodfuel and charcoal
Variable Model 1 Model 2
Total population 0.843**
Number of poor 0.292**
Log(Total population) 0.971**
Log(Number of poor) 0.013**
Constant 1101.698** 0.141**
N 180 180
R2 0.979 0.994
Dependent variable: Model 1—Population using wood& charcoal; Model 2—Log(Population using wood &charcoal).** Significant at the 5% level.
626 WORLD DEVELOPMENT
Using the WHO/World Bank model, we pro-ject PM10 pollution levels for urban areas inCambodian cities. Figure 11 indicates that esti-
mated pollution levels are generally higher incities located in Cambodia’s population periph-ery. Using a standard dose–response model, weestimate the resulting loss of life and aggregatethe results to the provincial level. Our findings,displayed in Figure 12, suggest minimal corre-lation (0.14) between poverty population anddeaths from air pollution.Figure 13 summarizes the available evidence
for Cambodia’s poverty population, deforesta-tion, steeply sloped land, indoor air pollution,unsafe water, child mortality, and mortalityfrom outdoor air pollution. The elements ofthe matrix are numerically ranked by severityfor ease of comparison. Figure 14 further con-denses the evidence into average rankings forthe first two (‘‘Green’’) indices and the lastthree (‘‘Brown’’) indices. The results seem con-sistent with a poverty–environment nexus for

Figure 9. Cambodia: population without access to clean water, 1998. Source: Population Census, 1998.
Table 3. Cambodia: population, poverty and access tosafe water
Variable Model 1 Model 2
Total population 0.241**
Number of poor 1.437**
Log(Total population) 0.587**
Log(Number of poor) 0.186**
Constant 3071.133** 2.398**
N 180 180
R2 0.847 0.664
Dependent variable: Model 1—Population without safewater; Model 2—Log(Population without safe water).** Significant at the 5% level.
WHERE IS THE POVERTY–ENVIRONMENT NEXUS? 627
indoor air pollution and water contamination.However, there is no evident relationship be-tween the spatial distributions of poverty anddeaths from outdoor air pollution. Nor doesthere appear to be a significant spatial relation-ship between poverty and either of the Greenindices. On the basis of currently availableevidence, we conclude that the regional pov-erty–environment nexus in Cambodia is largelyconfined to household-level problems associ-ated with contaminated air and water.
5. EVIDENCE FOR LAO PDRAND VIETNAM
Similar evidence for Lao PDR in Figure 15suggests a poverty–environment nexus that issignificantly broader than Cambodia’s. Across
provinces, Figure 15 shows a strong correspon-dence between poverty and environmental deg-radation in all five categories—deforestation,erosion potential, indoor air pollution, contam-inated water, and outdoor air pollution. Theassociation is particularly strong for the lowest-and highest-income provinces. When the envi-ronmental rankings are combined into ‘‘Green’’and ‘‘Brown’’ indices, the association is cleareracross all provinces. We conclude that the re-gional poverty–environment nexus seems verybroad for Lao PDR, so the potential synergybetween poverty alleviation and environmentalpolicies may be very high. The north- andnortheastern regions of the country appear tobe the main locus for action in this context.For Vietnam, the evidence in Figures 16–19
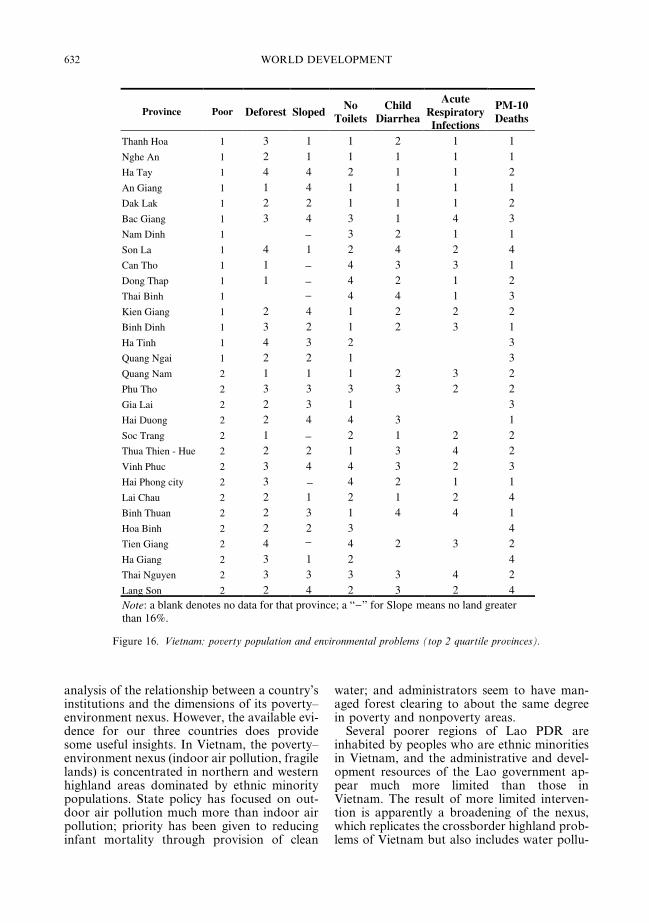
suggests a more limited poverty–environmentnexus. The spatial correlation with the povertypopulation appears negligible for deforestation,very weak for sanitation and diarrhea, and neg-ative for outdoor air population. However, thelarge poverty populations in steeply slopedareas suggest that ethnic separation has openedpotential ‘‘poverty traps.’’ Our evidence alsosuggests a relationship between poverty and in-door air pollution (indexed by cases of acuterespiratory infection).
6. CAUSAL IMPLICATIONS OFHOUSEHOLD-LEVEL RESULTS
Although the lack of time series data pre-vents structural modeling, we believe that

Figure 10. Cambodia: child deaths, 1998. Source: Population Census, 1998.
Figure 11. Cambodia: urban PM-10 air pollution. Source: World Bank Estimates, 2004.
628 WORLD DEVELOPMENT
reasonable inferences about causation are pos-sible for our household-level results. First, weconsider the evidence related to poverty andhouseholds’ use of polluting wood fuels. Inboth Cambodia and Lao PDR, we find astrong, positive relationship between povertyand use of these fuels. At the same time, we finda generally weak relationship between povertyand deforestation. Since use of wood fuels pro-motes deforestation, these asymmetric resultssuggest that poverty contributes strongly tohousehold air pollution, but that fuel wood
use (through deforestation) may not contributestrongly to poverty.Poverty, lack of access to clean water, and
intestinal disease are also highly correlated inCambodia and Lao PDR. In this case, it seemsreasonable to infer two-way causation. Ceterisparibus, poverty limits access to clean waterand sanitation. At the same time, sanitation-re-lated diseases exacerbate poverty by reducingproductivity and imposing significant health-care costs on affected households. However,the weaker relationship between poverty and

0
5
10
15
20
25
0 5 10 15 20 25 30
Number of poor (rank)
Nu
mb
er o
f P
M-1
0 d
eath
s (r
ank
) ρ = 0.14
Figure 12. Cambodia: rank scatter: PM-10 air pollution deaths versus poverty population.
Province Poor Deforest Slope Wood/Charcoal
UnsafeWater
ChildDeaths
PM-10Deaths
Kampong Chaam 1 1 3 1 1 1 3Siem Reab 1 2 2 2 1 1 1Prey Veaeng 1 1 4 1 2 1 3Kampong Thum 1 3 4 2 1 2 2Baat Dambang 1 3 2 1 1 1 1Taakaev 1 1 3 1 1 2 4Kandaal 2 4 4 1 1 1 2Kampong Spueu 2 2 1 2 2 2 3Banteay Mean Chey 2 1 3 2 2 1 1Kampot 2 2 1 2 2 2 4Kampong Chhnang 2 3 2 3 2 2 3Svaay Rieng 2 1 4 2 3 3 4Pousaat 3 4 1 3 2 2 2Kracheh 3 4 3 3 3 3 1Preah Vihear 3 3 2 3 3 3 3Phnom Penh 3 4 4 1 3 3 1Kaoh Kong 3 2 1 3 4 4 2Rotanak Kiri 3 2 1 4 3 3 3Otdar Mean Chey 4 1 3 4 4 4 _
Stueng Traeng 4 3 2 4 4 3 2Mondol Kiri 4 4 1 4 4 4 4Krong Preah Sihanouk 4 2 3 3 3 4 1Krong Kaeb 4 4 4 4 4 4 2Pailin 4 3 2 4 4 4 4
Note: “_” denotes no data for that province.1 1st quartile; 2 2nd quartile; 3 3rd quartile; 4 4th quartile
Figure 13. Cambodia: poverty population and environmental problems.
WHERE IS THE POVERTY–ENVIRONMENT NEXUS? 629
sanitation in Vietnam suggests that publicintervention can break this perverse link. Thecritical difference may lie in the Vietnamesegovernment’s relatively high level of investment
in public health and education (particularly forwomen). Extensive literature has documentedthe significance of these factors in reducing dis-ease and mortality, even where access to clean

Province Poor Green BrownKampong Chaam 1 3 1Siem Reab 1 2 1Prey Veaeng 1 2 1Kampong Thum 1 4 2Baat Dambang 1 2 1Taakaev 1 1 2Kandaal 2 4 1Kampong Spueu 2 1 2Banteay Mean Chey 2 2 2Kampot 2 1 3Kampong Chhnang 2 3 3Svaay Rieng 2 3 2Pousaat 3 3 2Kracheh 3 4 3Preah Vihear 3 3 3Phnom Penh 3 4 2Kaoh Kong 3 1 3Rotanak Kiri 3 1 4Otdar Mean Chey 4 2 4Stueng Traeng 4 2 4Mondol Kiri 4 3 4Krong Preah Sihanouk 4 2 3Krong Kaeb 4 4 4Pailin 4 3 4
Note: Green indicator index (equal weighting): (a) Deforestation rate, (b) slope greater than 16%; Brown indicator index (equal weighting): (a) Number using wood andcharcoal, (b) number of cases of diarrhea, (c) number without access to water and toilets, and (d) number of PM-10 air pollution deaths.
Figure 14. Cambodia: poverty population versus Green/Brown environmental problems.
630 WORLD DEVELOPMENT
water is limited (Merick, 1985; Filmer & Pritch-ett, 1997).
7. SUMMARY AND CONCLUSIONS
In this paper, we have investigated the regio-nal poverty–environment nexus in Cambodia,Lao PDR, and Vietnam. Our analysis has fo-cused on spatial relations between poverty pop-ulations and environmental problems at theprovincial and district levels (see the summaryin Table 4).We identify a potential poverty–environment
nexus in cases where the pattern of regionalsettlement by poor households is strongly asso-ciated with each of five environmental prob-lems: deforestation, fragile soils, indoor airpollution, contaminated water, and outdoorair pollution. Our results suggest that the nexusis quite different in each country. In Cambodia,
it seems largely confined to household-levelproblems associated with indoor air pollution,contaminated water, and lack of access to ade-quate sanitation. Outdoor air pollution, defor-estation, and fragile lands are not significantlyassociated with poverty at the district level.We conclude that poor households in Cambo-dia might benefit most strongly from programsthat jointly address poverty and household-level environmental quality. At the same time,all of Cambodia’s citizens, including the poor,would benefit from more effective measures toreduce the rate of deforestation.Our results suggest a broader poverty–envi-
ronment nexus in Lao PDR, since all fiveenvironmental problems exhibit a spatial corre-lation with poverty. The overlap is particularlystrong in the northern and northeastern regionsof the country. We conclude that the welfare ofthe poor in Lao PDR might be significantlyenhanced by close integration of poverty-allevi-

Province Poor Deforest Sloped Wood/Charcoal
UnsafeWater
ChildDiarrhea
PM-10Deaths
Savannakhet 1 4 4 1 1 1 1Champasack 1 3 4 1 1 1 2Huaphanh 1 2 1 2 1 1 1Luangphrabang 1 1 1 1 1 1 1Oudomxay 1 1 2 3 2 2 _
Saravane 2 3 3 2 2 2 2Khammuane 2 4 3 2 2 1 2Phongsaly 2 1 1 3 3 4 2Xiengkhuang 2 2 1 3 2 3 3Vientiane Municipality 3 1 4 1 4 4 1Vientiane 3 2 2 2 3 3 4Luangnamtha 3 1 2 4 3 3 3Xayabouri 3 2 1 1 1 2 3Bokeo 4 3 3 4 3 3 _
Attapeu 4 4 3 4 4 2 4Borikhamxay 4 4 2 3 4 4 3Sekong 4 3 4 4 4 4 4Xaysomboon 4 4 4 4 4 4 _
Note: a “_” denotes no data for that province.
Figure 15. Lao PDR: poverty population and environmental problems.
WHERE IS THE POVERTY–ENVIRONMENT NEXUS? 631
ation and environmental strategies in all Greenand Brown dimensions. A geographic focus onthe north would appear to be most beneficial.The case of Vietnam is more eclectic than the
other two, suggesting the possibility of a pov-erty–environment nexus for fragile soils and in-door air pollution. We conclude that anappropriate poverty–environment strategy forVietnam might focus on the living conditionsof poor households in steeply sloped areas.In summary, we find little evidence of a gen-
eral poverty–environment nexus in our threestudy countries. Indoor air pollution is the onlycommon issue, and its severity depends onheating and cooking practices that are littlestudied as yet. Our evidence suggests that thenexus concept can provide a useful catalystfor country-specific work, but not a general for-mula for program design. Joint implementationof poverty and environment strategies may becost effective for some environmental problems,but independent implementation may be prefer-able in many cases as well.We recognize that our analysis is far from
exhaustive, and that other environmental prob-lems may warrant close attention. Possible can-didates include depleted and polluted fisheries,and excessive use of pesticides. Future research
should explore these issues more fully. We alsorecognize that sub-district-level analysis mightreveal stronger poverty–environment links, aswell as providing a better guide for spatial tar-geting of regional programs. For this reason,we hope that future research projects will pro-mote more extensive data collection and analy-sis at the local level.In addition, we believe that regional coordi-
nation of poverty–environment programs maybe useful, even in some cases where the pov-erty–environment nexus does not appear to bestrong in all countries. A good example is pro-vided by the links between poverty, access tosafe water, and intestinal disease. As we havenoted, the empirical nexus may be weaker inVietnam because government intervention hasalready been effective. A regional program link-ing Vietnamese experts to counterparts in Cam-bodia and Lao PDR could be very appropriatein these circumstances.Despite these caveats, we believe that our
findings provide some insights for policy mak-ers who are concerned about the poverty–envi-ronment nexus. Our results suggest that thenexus is country specific, and institutional fac-tors may play an important role. Data on morecountries would be required for an in-depth
Province Poor Deforest SlopedNo
ToiletsChild
Diarrhea
AcuteRespiratoryInfections
PM-10Deaths
Thanh Hoa 1 3 1 1 2 1 1Nghe An 1 2 1 1 1 1 1Ha Tay 1 4 4 2 1 1 2An Giang 1 1 4 1 1 1 1Dak Lak 1 2 2 1 1 1 2Bac Giang 1 3 4 3 1 4 3Nam Dinh 1 _ 3 2 1 1Son La 1 4 1 2 4 2 4Can Tho 1 1 _ 4 3 3 1Dong Thap 1 1 _ 4 2 1 2Thai Binh 1 _ 4 4 1 3Kien Giang 1 2 4 1 2 2 2Binh Dinh 1 3 2 1 2 3 1Ha Tinh 1 4 3 2 3Quang Ngai 1 2 2 1 3Quang Nam 2 1 1 1 2 3 2Phu Tho 2 3 3 3 3 2 2Gia Lai 2 2 3 1 3Hai Duong 2 2 4 4 3 1Soc Trang 2 1 _ 2 1 2 2Thua Thien - Hue 2 2 2 1 3 4 2Vinh Phuc 2 3 4 4 3 2 3Hai Phong city 2 3 _ 4 2 1 1Lai Chau 2 2 1 2 1 2 4Binh Thuan 2 2 3 1 4 4 1Hoa Binh 2 2 2 3 4Tien Giang 2 4 _ 4 2 3 2Ha Giang 2 3 1 2 4Thai Nguyen 2 3 3 3 3 4 2Lang Son 2 2 4 2 3 2 4Note: a blank denotes no data for that province; a “_” for Slope means no land greater than 16%.
Figure 16. Vietnam: poverty population and environmental problems (top 2 quartile provinces).
632 WORLD DEVELOPMENT
analysis of the relationship between a country’sinstitutions and the dimensions of its poverty–environment nexus. However, the available evi-dence for our three countries does providesome useful insights. In Vietnam, the poverty–environment nexus (indoor air pollution, fragilelands) is concentrated in northern and westernhighland areas dominated by ethnic minoritypopulations. State policy has focused on out-door air pollution much more than indoor airpollution; priority has been given to reducinginfant mortality through provision of clean
water; and administrators seem to have man-aged forest clearing to about the same degreein poverty and nonpoverty areas.Several poorer regions of Lao PDR are
inhabited by peoples who are ethnic minoritiesin Vietnam, and the administrative and devel-opment resources of the Lao government ap-pear much more limited than those inVietnam. The result of more limited interven-tion is apparently a broadening of the nexus,which replicates the crossborder highland prob-lems of Vietnam but also includes water pollu-

Province Poor Deforest SlopedNo
ToiletsChild
Diarrhea
AcuteRespiratoryInfections
PM-10Deaths
Ben Tre 3 1 _ 4 4Ha Noi city 3 _ 3 1 1 1Hung Yen 3 _ 4 4 3 4Tra Vinh 3 1 _ 1 3 4Long An 3 4 _ 2 2Lao Cai 3 3 1 2 3 4 4Tuyen Quang 3 4 2 3 3 3 4Quang Binh 3 4 3 3 4Ca Mau 3 _ 3 4 3 2Yen Bai 3 3 1 2 3Quang Ninh 3 4 3 4 1Bac Ninh 3 _ 4 1 2 4Lam Dong 3 3 2 2 1 3 2Ninh Binh 3 4 _ 4 3Vinh Long 3 1 _ 4 2 3 3Cao Bang 4 4 2 2 4Phu Yen 4 1 3 1 3Khanh Hoa 4 1 1 1 1Quang Tri 4 3 3 3 2 4 3Ha Nam 4 4 _ 4 4 2 4Bac Lieu 4 _ 2 4 4 3Ninh Thuan 4 3 2 1 3Ho Chi Minh city 4 4 _ 3 2 1Dong Nai 4 3 4 2 1Bac Kan 4 4 2 4 4Kon Tum 4 2 1 3 4Binh Phuoc 4 4 _ 3 4 3 4Tay Ninh 4 1 4 4 3Da Nang city 4 2 3 3 4 1Ba Ria - Vung Ta 4 1 4 2 1Binh Duong 4 1 _ 3 4 4 2Note: a blank denotes no data for that province; a “_” for Slope means no land greater than 16%.
Figure 17. Vietnam: poverty population and environmental problems (bottom 2 quartile provinces).
WHERE IS THE POVERTY–ENVIRONMENT NEXUS? 633
tion, deforestation, and outdoor air pollution.Cambodia’s public resources and administra-tion also appear weakly developed, but povertyamong highland ethnic minority groups is lesssignificant in this society. With no concentra-tion of poverty in ethnic minority regions,externality-related environmental problemssuch as erosion, deforestation, and outdoorair pollution appear to be more evenly distrib-uted across poor and nonpoor areas. However,development administration is weaker than inVietnam, and the government has not yet been
successful in addressing any of the household-level environmental problems that are highlycorrelated with poverty (indoor air pollution,contaminated drinking water, lack of accessto sanitation). In Vietnam, by contrast, a rela-tively successful focus on water and sanitationproblems seems to have reduced the provincialpoverty–environment nexus to indoor air pollu-tion in highland areas where biomass fuels pre-dominate.Even though our results suggest that the pov-
erty–environment nexus can differ substantially

Figure 18. Vietnam: steeply sloped land.
Figure 19. Vietnam: poverty population, 1998. Source: IFPRI, 2001.
634 WORLD DEVELOPMENT
across countries, we are only beginning to studythe sources of these differences. We have sug-gested some reasons why the nexus seems tovary in Cambodia, Lao PDR and Vietnam,but the need for more comparative work is
apparent. Since we have no clear basis for iden-tifying country-specific limitations at this point,it seems advisable to begin future country anal-yses with a broad consideration of potentialpoverty–environment links. Starting with a
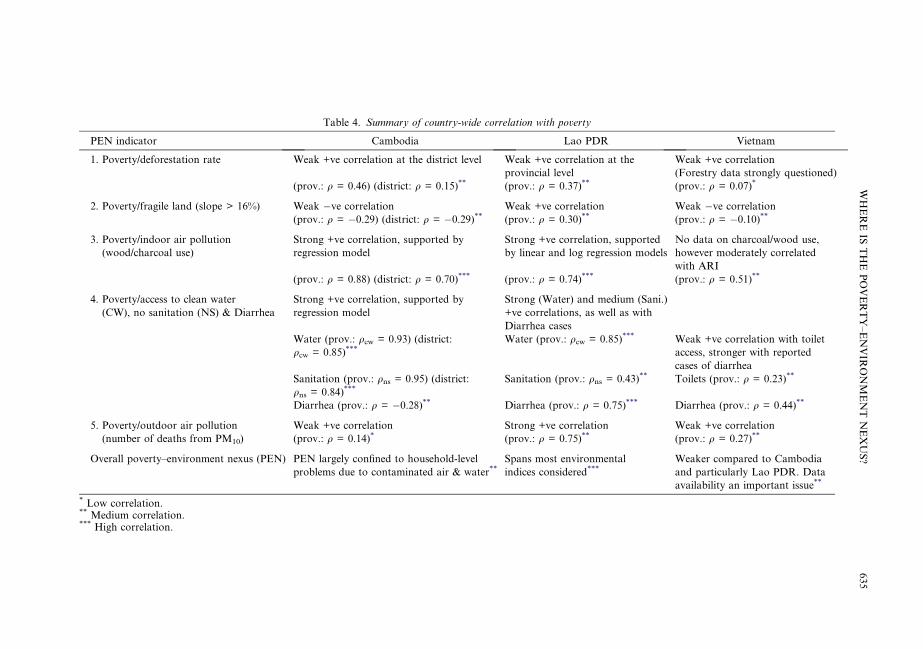
Table 4. Summary of country-wide correlation with poverty
PEN indicator Cambodia Lao PDR Vietnam
1. Poverty/deforestation rate Weak +ve correlation at the district level Weak +ve correlation at the
provincial level
Weak +ve correlation
(Forestry data strongly questioned)
(prov.: q = 0.46) (district: q = 0.15)** (prov.: q = 0.37)** (prov.: q = 0.07)*
2. Poverty/fragile land (slope > 16%) Weak �ve correlation Weak +ve correlation Weak �ve correlation(prov.: q = �0.29) (district: q = �0.29)** (prov.: q = 0.30)** (prov.: q = �0.10)**
3. Poverty/indoor air pollution
(wood/charcoal use)
Strong +ve correlation, supported by
regression model
Strong +ve correlation, supported
by linear and log regression models
No data on charcoal/wood use,
however moderately correlated
with ARI
(prov.: q = 0.88) (district: q = 0.70)*** (prov.: q = 0.74)*** (prov.: q = 0.51)**
4. Poverty/access to clean water
(CW), no sanitation (NS) & Diarrhea
Strong +ve correlation, supported by
regression model
Strong (Water) and medium (Sani.)
+ve correlations, as well as with
Diarrhea cases
Water (prov.: qcw = 0.93) (district:qcw = 0.85)
***
Water (prov.: qcw = 0.85)*** Weak +ve correlation with toilet
access, stronger with reported
cases of diarrhea
Sanitation (prov.: qns = 0.95) (district:qns = 0.84)
***
Sanitation (prov.: qns = 0.43)** Toilets (prov.: q = 0.23)**
Diarrhea (prov.: q = �0.28)** Diarrhea (prov.: q = 0.75)*** Diarrhea (prov.: q = 0.44)**
5. Poverty/outdoor air pollution
(number of deaths from PM10)
Weak +ve correlation Strong +ve correlation Weak +ve correlation
(prov.: q = 0.14)* (prov.: q = 0.75)** (prov.: q = 0.27)**
Overall poverty–environment nexus (PEN) PEN largely confined to household-level
problems due to contaminated air & water**Spans most environmental
indices considered***Weaker compared to Cambodia
and particularly Lao PDR. Data
availability an important issue**
* Low correlation.** Medium correlation.*** High correlation.
WHEREISTHEPOVERTY–ENVIRONMENTNEXUS?
635
636 WORLD DEVELOPMENT
broad ‘‘filter’’ also offers the prospect of morecost-effective approaches because it facilitatescomparison across problems that are frequentlyaddressed separately. In our three countries, for
example, simultaneous attention to fragilelands and indoor air pollution facilitates com-parison of intervention costs and potential ben-efits in the two dimensions. 16
NOTES
1. Extensive research has explored the relationship
between environmental degradation and economic
growth. See particularly the special issues of the Journal
of Environment and Development Economics, 2(4), 1997
and Ecological Economics, 25(2), 1998.
2. See Dasgupta, Laplante, Wang, and Wheeler (2002)
for a related discussion of policy impacts on the EKC in
developing countries.
3. We recognize that structural models will be difficult
to estimate reliability for quite some time, since a
relatively long time series would be necessary to distin-
guish two-way impacts of poverty and environmental
variables from long trends produced by forces such as
demographic change.
4. Henninger and Hammond (2000) make a strong case
for using poverty–environment maps, which afford
unique insights into the importance of spatial relation-
ships.
5. We are indebted to an anonymous reviewer for this
point.
6. We abbreviate the presentation for Lao PDR and
Vietnam to keep the paper’s length tractable, and
because our analytical methods are identical to those
used for Cambodia. For a full presentation and discus-
sion of the evidence for Lao PDR and Vietnam, see
Dasgupta, Deichmann, Meisner, and Wheeler (2004).
7. The minimum consumption and poverty estimates
have been produced by the World Bank for Lao PDR,
the World Food Program for Cambodia, and the
International Food Policy Research Institute for Viet-
nam.
8. See the district-level Model 2 results for Cambodia
in Tables 2 and 3. Our model relates an environmental
problem (H) to the poverty count (P), population (N)
and head-count ratio (P/N) as follows:
logHi ¼ a0 þ a1 logP i
Ni
� �þ a2 log P i þ a3 logNi
¼ a0 þ ða1 þ a2Þ log P i þ ða3 � a1Þ logNi:
We use the latter expression for estimation.
9. For Lao PDR, the available data have also enabled
us to test the effect of the poverty gap (the difference
between actual income and the absolute poverty line for
a representative individual). For each province, we have
estimated the total poverty gap by summing across gaps
for all individuals who are estimated to fall below the
poverty line. However, we find the correlation of this
variable with the poverty count (.96) to be so high that
the poverty count seems sufficient for our analysis.
10. See section (b) for a further discussion of the
deforestation model.
11. For a further discussion, see Dasgupta and Wheeler
(1997) and Pargal and Wheeler (1996).
12. Our regression analysis is based on a model of
deforestation in which the representative individual in a
region’s population clears a hectares of forest annually.Forest loss in the region between period 0 and period t is
therefore represented by Ft � F0 = aN (a < 0 for defor-estation), where F is the forested area and N is the
regional population. Dividing through by forested area
in period 0 and changing to a logarithmic approxima-
tion, we obtain
F t � F 0F 0
¼ aNF 0
) logF t
F 0
� �¼ b0 þ b1 log
NF 0
� �:
To allow for differential poverty effects, we generalize
this expression to
logF t
F 0
� �¼ b0 þ b1 log
NF 0
� �þ b2 log
PF 0
� �þ b3 logX ;
where P is the region’s poverty population and X repre-
sents other factors. In this model, b1 reflects the averagearea cleared by each resident (poor or nonpoor), and b2measures the difference (if any) attributable to poverty.
13. We recognize that the estimated impact of settle-
ment density may be biased by the exclusion of informa-
tion on transport costs and other factors that affect
settlement location, income, and deforestation. However,
our test remains useful if the degree of bias is similar for
poor households and households in general. For a further
discussion, see Cropper, Griffiths, and Mani (1999).
14. See Pandey et al. (forthcoming).

WHERE IS THE POVERTY–ENVIRONMENT NEXUS? 637
15. For a further discussion of the relationship between
outdoor air pollution and health, see Holgate, Samet,
Koren, and Maynard (1999) and WHO (2000).
16. Our thanks to an anonymous reviewer for stressing
this implication of the work.
REFERENCES
Akbar, S. & Lvovsky, K. (2000). Indoor air pollution:Energy and health for the poor. ESMAP Newsletter,No. 1. Washington, DC: World Bank.
Albla-Betrand, J. M. (1993). The political economyof large natural disasters. Oxford: Clarendon Press.
Ambler, J. (1999). Attacking poverty while improvingthe environment: Toward win-win policy options.Background technical paper prepared for theSeptember 1999 Forum of Ministers meeting, underthe UNDP-EC Poverty and Environment Initiative;also in Attacking poverty while improving the envi-ronment: Toward win–win policy options (2001),Poverty and Environment Initiative, New York:UNDP.
Arnold, J. E. M., & Bird, P. (1999). Forest and thepoverty–environment nexus. Paper presented at theUNDP-EC Expert Workshop on Poverty andthe Environment, Brussels, Belgium, January 20–21,1999; also in Attacking poverty while improving theenvironment: Toward win–win policy options (2001),Poverty and Environment Initiative, New York:UNDP.
Barbier, E. (2000). The economic linkages between ruralpoverty and land degradation: Some evidence fromAfrica. Agriculture, Ecosystems and Environment, 82,355–370.
Bojo, J., Bucknall, J., Hamilton, K., Kishor, N., Kraus,C., & Pillai, P. (2001). Environment chapter, povertyreduction strategy papers’ source book. Washington,DC: World Bank.
Bosch, C., Hommann, K., Rubio, G. M., Sadoff, C., &Travers, L. (2001). Water, sanitation and povertychapter, poverty reduction strategy papers’ sourcebook. Washington, DC: World Bank.
Brocklesby, M. A., & Hinshelwood, E. (2001). Povertyand the environment: What the poor say: Anassessment of poverty–environment linkages in partic-ipatory poverty assessments. Swansea, UK: Centrefor Development Studies, University of Wales.
Brooks, N., & Sethi, R. (1997). The distribution ofpollution: Community characteristics and exposureto air toxins. Journal of Environmental Economics andManagement, 32, 233–250.
Bucknall, J., Kraus, C., & Pillai, P. (2000). Poverty andthe environment, environment strategy backgroundpaper. Washington, DC: World Bank.
Cavendish, W. (1999). poverty, inequality and environ-mental resources: Quantitative analysis of ruralhouseholds. Working Paper Series, 99–9. Oxford,UK: Centre for the Studies of African Economies,University of Oxford.
Cavendish, W. (2000). Empirical regularities in thepoverty–environment relationship of African ruralhouseholds. World Development, 28(11), 1979–2003.
Chomitz, K. (1999). Environment–poverty connectionsin tropical deforestation. Discussion notes preparedfor the WDR Summer Workshop on Poverty andDevelopment, Washington, DC, July 6–8, 1999.
Cleaver, K. M., & Schreiber, G. A. (1994). Reversing thespiral: The population, agriculture, and environmentnexus in sub-Saharan Africa. Washington, DC:World Bank.
Cropper, M., Griffiths, C., & Mani, M. (1999). Roads,population pressures, and deforestation in Thailand,1976–1989. Land Economics, 75(1), 58–73.
Dasgupta, S., Deichmann, U., Meisner, C., & Wheeler,D. (2004). The poverty–environment nexus in Cambo-dia, Lao PDR, and Vietnam. Washington, DC: WorldBank Development Research Group.
Dasgupta, S., Laplante, B., Wang, H., & Wheeler, D.(2002). Confronting the environmental Kuznetscurve. Journal of Economic Perspectives, 16(1).
Dasgupta, P., & Maler, K.-G. (1994). Poverty, institu-tions and the environment-resource base. WorldBank Environment Paper, No. 9. Washington, DC:World Bank.
Dasgupta, S.. & Wheeler, D. (1997). Citizen complaintsas environmental indicators: Evidence from China.World Bank Policy Research Department WorkingPaper, No. 1704, January.
Durning, A. B. (1989). Poverty and the environment:Reversing the downward spiral. Worldwatch Paper,No. 92. Washington, DC: Worldwatch Institute.
Dutt, A. K., & Rao, J. M. (1996). Growth, distributionand the environment: Sustainable development inIndia. World Development, 24(2), 287–305.
Ecological Economics. (1998). Special issue: The envi-ronmental Kuznets curve. Ecological Economics,25(2), 143–229.
Ekbom, A., & Bojo, J. (1999). Poverty and environment:Evidence of links and integration in the countryassistance strategy process. World Bank AfricaRegion Discussion Paper, No. 4. Washington, DC:World Bank.
Eskeland, G. S., & Kong, C. (1998). Protecting theenvironment and the poor: A public goods frame-work and an application to Indonesia. World BankPolicy Research Working Paper, No. 1961. Washing-ton, DC: World Bank.
Ezzati, M., & Kammen, D. (2001). Indoor air pollutionfrom biomass combustion as a risk factor for acuterespiratory infections in Kenya: An exposure-re-sponse study. Lancet, 358(9281), 619–624.
Ezzati, M., Singer, B., & Kammen, D. (2001). Towardsan integrated framework for development and envi-ronment policy: The dynamics of environmentalKuznets curves. World Development, 29(8),1421–1434.
638 WORLD DEVELOPMENT
Filmer, D., & Pritchett, L. (1997). Child mortality andpublic spending on health: How much does moneymatter?’’ World Bank Policy Research DepartmentWorking Paper, No. 1864, December.
Heath, J., & Binswanger, H. (1996). Natural resourcedegradation effects of poverty and population growthare largely policy induced: The case of Columbia.Environment andDevelopment Economics, 1(1), 65–83.
Henninger, N., & Hammond, A. (2000). Environmentalindicators relevant to poverty reduction: A strategy forthe World Bank. Washington, DC: World ResourcesInstitute.
Holden, S. T. (1996). Adjustment policies, peasanthousehold resource allocation and deforestation inNorthern Zambia: An overview and some policyconclusions. In O. Stokke (Ed.), Forum for Develop-ment Studies, No. 1, 1997. Flekkefjord: NorwegianInstitute of International Affairs.
Holgate, S., Samet, J., Koren, H., & Maynard, R. (Eds.).Air pollution and health. San Diego, CA: AcademicPress.
Journal of Environment and Development Economics.(1997). Special issue: The environmental Kuznetscurve, Journal of Environment and DevelopmentEconomics, 2(4), 357–515.
Kepe, T. (1999). Environmental entitlements in Mkam-bati: Livelihoods, social institutions and environ-mental change on the wild coast of the Eastern Cape.Research Report, No. 1, Sussex University, Institutefor Development Studies and PLASS (Program forLand and Agrarian Studies), Sussex, UK.
Leach, M., & Mearns, R. (1991). Poverty and environ-ment in developing countries: An overview study.Institute of Development Studies, Sussex University,Sussex, UK.
Merick, T. (1985). The effect of piped water on earlychildhood mortality in urban Brazil, 1970–1976.Demography, 22, 1–14.
Mink, S. (1993). Poverty, population and the environ-ment. World Bank Discussion Paper, No. 189.Washington, DC: World Bank.
Myers, N., & Kent, J. (1995). Environmental exodus—Anemergent crisis in the global arena. Washington, DC:Climate Institute.
Pandey, K. D., Bolt, K., Deichmann, U., Hamilton, K.,Ostro, B., & Wheeler, D. (forthcoming). The humancost of air pollution: New estimates for developingcountries. World Bank Development ResearchGroup Working Paper, Washington, DC.
Pargal, S., & Wheeler, D. (1996). Informal regulation ofindustrial pollution in developing countries: Evi-dence from Indonesia. Journal of Political Economy,104(6), 1314+.
Pearce, D. W., & Warford, J. J. (1993). World with-out end—economics, environment and sustain-able development. New York: Oxford UniversityPress.
Prakash, S. (1997). Poverty and environment linkages inmountains and uplands: Reflections on the ‘‘PovertyTrap’’ thesis. CREED Working Paper Series, No. 12.London: IIED.
Reddy, S. R. C., & Chakravarty, S. P. (1999). Forestdependence and income distribution in a subsistenceeconomy: Evidence from India. World Development,27(7), 1141–1149.
Roe, E. (1998). Taking complexity seriously: Policyanalysis, triangulation and sustainable development.Boston: Kluwer Academic Publishers.
Songsore, J., & McGranahan, G. (1993). Environment,wealth and health: Towards an analysis of intra-urban differentials within the greater Accra Metro-politan Area, Ghana. Environment and Urbanization,5(2), 10–34.
Surjadi, C. (1993). Respiratory diseases of mothers andchildren and environmental factors among house-holds in Jakarta. Environment and Urbanization, 5(2),78–86.
World Bank (1992). World development report 1992—Development and the environment. New York: OxfordUniversity Press.
World Commission on Environment and Development(1987). Our common future, report of the worldcommission on environment and development. Oxford:Oxford University Press.
World Health Organization (WHO) 2000. Guidelines forAir Quality, WHO, Geneva. Available from <http://www.who.int/peh/air/Airqualitygd.htm>.