
Where in the world are “permanently reinvested”...
44
Where in the world are “permanently reinvested” foreign earnings? Jennifer Blouin University of Pennsylvania Linda Krull † University of Oregon Leslie Robinson Dartmouth College January 2012 Abstract: This study uses permanently reinvested earnings (PRE) reported in U.S. multinational corporations (MNCs) financial statements, combined with detailed information on foreign affiliate assets to estimate the location and composition of PRE. We use these estimates to gain an understanding of the motivations for PRE designations, and thus implications of reported PRE for firms’ growth and liquidity, as well as the potential effects of U.S. tax reform. Our analysis suggests that PRE designations are driven by earnings incentives and growth – 94 percent of PRE is located in affiliates that would require recognition of an expected repatriation tax expense, and 60 percent of PRE is in high growth affiliates. While our estimates suggest that most PRE are associated with unrecognized repatriation tax obligations, the existence of some PRE in high tax jurisdictions reduces the potential tax revenue associated with PRE. We also find that, for firms in overall non-binding foreign tax credit positions, a significantly greater proportion of PRE in low-tax jurisdictions is held in cash, relative to high-tax jurisdictions, suggesting liquidity implications arising from the current tax system. † Corresponding Author: Lundquist College of Business, 1208 University of Oregon, Eugene, OR 97403 Phone: (541) 346-3252; email: [email protected] ________________________________________________________________________ The statistical analysis of firm-level data on U.S. multinational companies were conducted at the Bureau of Economic Analysis, Department of Commerce under arrangements that maintain legal confidentiality requirements. The views expressed in this study are those of the authors and do not reflect official positions of the U.S. Department of Commerce. The authors thank Dave Guenther, Mihir Desai (discussant), Allison Koester, Jake Thornock, members of the International Tax Policy Forum, and workshop participants at the National University of Singapore and the 2011 UBCOW conference, for helpful comments. For helpful discussions in the development of this paper, the authors thank eight partners in the national offices of Deloitte & Touche, Ernst & Young, PricewaterhouseCoopers, and KPMG. For financial support, the authors thank the International Tax Policy Forum, and Linda Krull thanks the Lundquist College of Business Finance and Securities Analysis Center.
-
Upload
doannguyet -
Category
Documents
-
view
217 -
download
1
Transcript of Where in the world are “permanently reinvested”...

Where in the world are “permanently reinvested” foreign earnings?
Jennifer Blouin University of Pennsylvania
Linda Krull†
University of Oregon
Leslie Robinson Dartmouth College
January 2012
Abstract: This study uses permanently reinvested earnings (PRE) reported in U.S. multinational corporations (MNCs) financial statements, combined with detailed information on foreign affiliate assets to estimate the location and composition of PRE. We use these estimates to gain an understanding of the motivations for PRE designations, and thus implications of reported PRE for firms’ growth and liquidity, as well as the potential effects of U.S. tax reform. Our analysis suggests that PRE designations are driven by earnings incentives and growth – 94 percent of PRE is located in affiliates that would require recognition of an expected repatriation tax expense, and 60 percent of PRE is in high growth affiliates. While our estimates suggest that most PRE are associated with unrecognized repatriation tax obligations, the existence of some PRE in high tax jurisdictions reduces the potential tax revenue associated with PRE. We also find that, for firms in overall non-binding foreign tax credit positions, a significantly greater proportion of PRE in low-tax jurisdictions is held in cash, relative to high-tax jurisdictions, suggesting liquidity implications arising from the current tax system.
† Corresponding Author:
Lundquist College of Business, 1208 University of Oregon, Eugene, OR 97403 Phone: (541) 346-3252; email: [email protected] ________________________________________________________________________ The statistical analysis of firm-level data on U.S. multinational companies were conducted at the Bureau of Economic Analysis, Department of Commerce under arrangements that maintain legal confidentiality requirements. The views expressed in this study are those of the authors and do not reflect official positions of the U.S. Department of Commerce. The authors thank Dave Guenther, Mihir Desai (discussant), Allison Koester, Jake Thornock, members of the International Tax Policy Forum, and workshop participants at the National University of Singapore and the 2011 UBCOW conference, for helpful comments. For helpful discussions in the development of this paper, the authors thank eight partners in the national offices of Deloitte & Touche, Ernst & Young, PricewaterhouseCoopers, and KPMG. For financial support, the authors thank the International Tax Policy Forum, and Linda Krull thanks the Lundquist College of Business Finance and Securities Analysis Center.

1
1. Introduction
The foreign operations of U.S. multinational corporations (MNCs) continue to generate
interest among investors and policymakers as these firms expand internationally. Investors’
interest arises from the need to assess the value and liquidity of these complex conglomerates.
Policymakers’ interest stems from the ongoing debate about changes to the U.S. international tax
system. However, current accounting standards require MNCs to report remarkably little detail
about their foreign operations. This lack of information presents a striking paradox: 89 percent of
S&P 500 firms operate outside the U.S. and, on average, report material subsidiaries in 19
countries and pre-tax foreign earnings equal to 31 percent of consolidated pre-tax earnings; yet
the only required information about foreign operations is aggregated pre-tax income, tax
expense, sales, long-lived assets, material subsidiary locations, and permanently reinvested
earnings (PRE).1,2
Much of the recent attention directed at MNCs’ overseas operations has focused on the
amount of PRE these firms report in their financial statements. PRE are foreign affiliate earnings
for which a firm has not recognized, in its consolidated financial statements, a residual U.S. tax
expense, if any, due upon repatriation of those earnings.3 MNCs must report the amount of PRE,
along with an estimate of the expected tax liability, in their financial statement footnotes. In
1 We determine that 89 percent of S&P 500 firms have foreign operations at the end of fiscal 2010 by examining whether these firms report foreign sales, foreign pre-tax earnings, or a material foreign subsidiary. Firms with profitable domestic, foreign, and total pre-tax earnings (60 percent of firms) report, on average, 31 percent and 49 percent foreign sales and pre-tax earnings, respectively. Securities and Exchange Commission (SEC) Regulation §210.4-08(h) requires firms to report total domestic and foreign pretax earnings. Financial Accounting Standards Board (FASB) ASC 280 – Segment Reporting (formerly SFAS 131) requires firms to report sales by geographic area. SEC Regulation S-K §229.601 requires firms to list material subsidiaries in Exhibit 21 of the 10-K. 2 MNCs are required to report sales and long-lived assets by geographic segment from a management perspective (i.e., how management organizes segments within the enterprise for making decisions and assessing performance). Hence, segment information is rarely reported by country but instead reported by region, which results in the financial information being difficult to compare across MNCs. 3 We use the terms ‘affiliate’ and ‘subsidiary’ interchangeably throughout the paper. If MNCs defer U.S. cash taxes on foreign affiliate earnings by reinvesting them abroad, they can also defer tax expense recognition for financial reporting if the earnings will remain outside the U.S. indefinitely. We discuss the PRE designation in Section 2.

2
2010, Credit Suisse began a series of reports on corporate taxes (Zion, Varshney, and Cornett
2010; Zion, Varshney, and Burnap 2011), documenting aggregate PRE for S&P 500 firms in the
amount of $1.3 trillion at the end of 2010. The authors describe PRE as “earnings parked
overseas that have so far avoided U.S. taxation” and speculate that high levels of PRE indicate a
less flexible balance sheet because it represents assets that cannot be deployed in the U.S.
without taking a tax hit. They estimate that these earnings are associated with a $360 billion
unrecognized tax liability.4
The Securities and Exchange Commission (SEC) has also begun scrutinizing firms’ PRE
assertions. Mark Shannon, an associate chief accountant in the SEC’s division of Corporate
Finance, reports that the SEC seeks to ensure “that companies are telling consistent stories about
offshore versus domestic liquidity” (Whitehouse 2011). In the context of a U.S. MNC’s liquidity
needs, the SEC is concerned that the disclosures lack details regarding what proportion of a
MNC’s cash is located overseas and the extent of the tax obligation that would be incurred upon
repatriation. Shannon notes that the SEC inquiries have yielded “a lot of revised disclosures.”
In light of the recent attention focused on PRE and foreign operations, the objective of our
study is to provide insight about what PRE represent. Using firms’ SEC 10-K disclosures of PRE
and confidential financial and operating data on MNCs’ foreign affiliates, we estimate the
motivations for designating foreign affiliate earnings as permanently reinvested, in what type of
assets PRE are held, and where they are located.5
First, we analyze attributes of affiliates that are associated with firms’ PRE assertions to
identify motivations for designating earnings as PRE. Existing studies conjecture that MNCs’
4 The authors estimate that the $1.3 trillion of PRE will be subject to a 28 percent repatriation tax rate in the U.S. using the median repatriation tax rate disclosed by 60 firms that provided such an estimate. 5 Confidential data are from legally mandated surveys of U.S. MNCs conducted by the U.S. Bureau of Economic Analysis. See Mataloni (2003) for a detailed discussion of BEA data.

3
designate foreign earnings as PRE when the incremental repatriation tax has a greater impact on
earnings (Graham, Hanlon, and Shevlin 2011; Blouin, Krull, and Robinson 2012). Therefore, we
investigate whether the presence of affiliates in tax havens and low foreign income tax or high
withholding tax jurisdictions is associated with higher levels of PRE. In addition, we consider
whether fluctuating currency exchange rates, which could lead to earnings volatility, and high
growth, which could increase the investment horizon, are associated with MNCs’ PRE levels.
Second, we examine the types of assets in which PRE are held. In particular, we investigate
the conjecture, illustrated in the Credit Suisse study, that PRE is held primarily in foreign cash
rather than investments in long-lived assets. This distinction is important because, if PRE is held
in non-liquid assets, then a repeal of tax laws that allow MNCs to defer U.S. tax on foreign
affiliate earnings until repatriation could cause firms to either sell productive assets or borrow to
avoid such a sale. Third, we study the location of PRE by estimating how much PRE is located in
specific countries. This analysis also allows us to estimate the tax cost of repatriating PRE held
in the form of liquid assets to the United States.
We note two important observations from our analysis. First, we find that a greater
proportion of PRE are located in affiliates operating in countries with either low income tax or
high withholding tax rates (94 percent), relative to affiliates in other countries (6 percent). Nearly
20 percent of PRE is located in ‘Big 7’ tax haven affiliates – those operating in Hong Kong,
Ireland, Lebanon, Liberia, Panama, Singapore and Switzerland. These results are concentrated in
firms that will owe U.S. tax on repatriations and suggest that most, but not all, PRE represent
foreign earnings that have a significant tax cost associated with repatriation to the United States.6
Second, we find that a non-trivial proportion of PRE appears to be held in cash; this proportion is
6 Note that we find a substantial proportion of PRE located in low income tax or high withholding tax jurisdictions even when controlling for growth and/or investment expectations.

4
particularly high in affiliates operating in low income tax or high withholding tax countries (38
percent), relative to those operating in other countries (1 percent). This result implies that U.S.
tax policy has a significant impact on the liquidity of MNCs. However, it also implies that over
half of PRE is held in non-liquid assets.
Our detailed examination of the location and composition of PRE makes two significant
contributions. First, our study helps investors identify and assess the relative importance of
various motivations for designating earnings as PRE, and thus better understand the implications
of PRE for firm value. In practice, a firm may designate earnings as PRE because a) it has no
intention of repatriating the foreign earnings to the U.S. in the foreseeable future, b) it does not
want to induce an undesirable financial statement effect, or c) it is too difficult to estimate the
residual tax liability. Each motivation has a different implication for the earnings potential of
those reinvested earnings, the size of the unrecognized tax cost associated with the repatriation of
those earnings, and/or the agency costs of underinvestment associated with those earnings.
Second, we help policy-makers better estimate the potential revenue impact of changes in
international tax policy. Press reports argue that PRE represents large pools of cash “parked” in
haven countries which represents a significant untapped source of tax revenue. This conjecture
assumes that deferral can be repealed without requiring firms to sell productive assets to pay
their tax obligations. Although some PRE is located in haven jurisdictions or in affiliates with
high levels of cash, our estimates also suggest that some PRE is located in affiliates with
significant operating assets and/or high-tax jurisdictions. By documenting the proportion of PRE
in these locations, we illustrate the need to be cautious when interpreting the effect of PRE on
firm liquidity and tax revenue. It is also important to note that undistributed earnings that are not
PRE also represent a potential source of tax revenue. Because PRE is an accounting construct,

5
firms’ actual tax cost associated with undistributed foreign earnings is not directly related to the
use, or lack thereof, of the PRE designation..
Section 2 provides a background and develops our hypotheses. Section 3 describes our data.
Section 4 describes our empirical specification. Section 5 discusses our main results and Section
6 concludes.
2. Background
The U.S. taxes MNCs’ foreign affiliate earnings when they repatriate the earnings to the U.S.
parent. The amount of tax due at the time of repatriation equals the dividend grossed-up for
foreign taxes paid times the U.S. statutory tax rate minus a foreign tax credit. Generally, the
foreign tax credit equals the amount of foreign income and withholding taxes paid on the
repatriated earnings up to the amount of the U.S. tax liability. If the foreign tax credit is greater
than the U.S. tax liability, the MNC owes no incremental tax on repatriation.7
Financial accounting rules require MNCs to recognize the expected U.S. income and foreign
withholding tax expense related to future repatriation of undistributed foreign earnings in the
period those earnings are generated (FAS 109). However, quantifying the expected U.S. tax on
undistributed earnings abroad is complex and requires estimates and assumptions that are
susceptible to error or manipulation.8
In light of this complexity, Accounting Principles Board Opinion No. 23 (hereafter APB 23)
creates an exception to the general rule described above. This exception (the Indefinite Reversal
Exception) is now defined in FASB ASC 740 - Income Taxes (ASC 740 and formerly FAS 109)
and allows firms to defer recognizing an expense for the expected tax consequences of
7 For simplicity, we ignore the anti-abuse rules generally referred to as Subpart F, which would result in incremental U.S. tax without actual repatriation. 8 http://www2.financialexecutives.org/news/finrep/letters/Dfdtax_Jun14.pdf (last accessed January 7, 2012)

6
repatriation if “sufficient evidence shows that the subsidiary has invested or will invest the
undistributed earnings indefinitely or that the earnings will be remitted in a tax-free liquidation”
(ASC 740-30-25-17).
The Indefinite Reversal Exception operates at the subsidiary level; i.e., a parent firm need not
assert that the undistributed earnings of all foreign affiliates are permanently reinvested to avoid
income tax expense recognition. It can apply the exception to some affiliates and not others. The
exception can also be applied to an affiliate using a year-by-year, or a dollar-by-dollar approach
(BNA 948).9
In addition, the Indefinite Reversal Exception is not an ‘election’ per se, but rather applies if
specific facts and circumstances suggest that the earnings will be reinvested outside the U.S.
indefinitely. The exception further states that:
“A parent entity shall have evidence of specific plans for reinvestment of undistributed earnings of a subsidiary which demonstrate that remittance of the earnings will be postponed indefinitely…Experience of the entities and definite future programs of operations and remittances are examples of the types of evidence required to substantiate the parent entity's representation of indefinite postponement of remittances from a subsidiary.” (ASC 740-30-25-17)
These criteria are sufficiently ambiguous such that identical facts and circumstances could
ultimately lead to different designations of PRE. Krull (2004) documents that PRE reflects
investment and tax incentives but, most notably, finds that amounts reported as PRE are also
used to manage earnings. Thus, an important unanswered question is the extent to which PRE
disclosures communicate relevant tax and investment information that can help investors
evaluate firm performance and liquidity given that firms designate PRE to manage financial
reporting outcomes.
9 The year-by-year approach means that a firm can change its PRE assertion related to undistributed subsidiary earnings from a prior period to the extent that facts change over time. The dollar-by-dollar approach means that a firm can assert a portion of a undistributed subsidiary earnings as PRE, while at the same time anticipating a future distribution of the remaining portion.

7
The facts and circumstances that underlie PRE designations are important to understand as
researchers and policymakers scrutinize PRE in the context of proposals on international tax
reform. Blouin et al. (2012) uses PRE to test whether unrecognized tax consequences of
repatriation in accounting earnings are an important factor in the repatriation decision on MNCs.
The authors’ approach makes an implicit assumption that PRE are primarily located in low tax
jurisdictions and that financial reporting outcomes are the primary factor considered when firms
designate PRE.10 Similar to Zion et al. (2011), Graham et al. (2011) uses PRE as a proxy for
foreign cash to examine the importance of expense deferral in explaining foreign cash.
Somewhat implicit these studies is the notion that PRE represents untaxed earnings, held in the
form of liquid assets, that are available to be immediately repatriated to the U.S.
However, the ability of PRE to aid in evaluating either micro- or macro-level effects of
proposed tax reform depends on the underlying reasons that firms designate PRE. Mott and
Schmidt (2011) scrutinizes recent disclosures of foreign cash and PRE in a sample of 258 firms,
noting that foreign cash balances are, on average, 68 percent of the amount disclosed as PRE and
that there is significant variation across firms. Noting high levels of PRE in recent years,
Graham, Raedy, and Shackelford (2011) conjecture that, conditional on another anticipated tax
holiday, this build-up of PRE may reflect the fact that the American Jobs Creation Act of 2004
(AJCA) used PRE as a factor in determining the amount of dividends that were eligible for the
reduced tax rate. Our study strives to better understand the underlying motivations for
designating PRE to help researchers and policymakers better interpret this accounting figure.
It is important to emphasize that PRE is an accounting, not a tax construct. Specifically, PRE
only affects the timing of expense recognition in the financial statements. It does not affect the
10 Recognizing that other interpretations of PRE, and thus their results, are possible, the authors use alternative measures that do not rely on PRE disclosures and find consistent results.

8
amount or timing of actual tax payments. Moreover, PRE represents more than just undistributed
foreign earnings. The Indefinite Reversal Exception applies broadly to temporary differences
between the tax basis and the financial reporting basis of an investment in the stock of a foreign
affiliate (i.e., an outside basis difference).11 Undistributed earnings of a foreign affiliate increase
the book basis of the shares of the affiliate in the hands of the domestic parent and is the most
common item giving rise to outside basis differences. Other items can give rise to outside basis
differences. For example, the book and tax basis of shares in a newly acquired foreign target
often differ, creating an outside basis difference.12 Because undistributed earnings is the most
common item giving rise to outside basis differences, we refer to amounts for which the firm has
invoked the Indefinite Reversal Exception as permanently reinvested earnings, or PRE.
3. Sample selection and data
We select our sample of U.S. incorporated firms with publicly traded equity from among all
firms appearing in Compustat at any point from 1997 through 2010 (excluding REITs, banks,
and insurance companies). To remain in our sample we require significant foreign operations,
defined as any firm reporting foreign income tax expense (TXTO) exceeding $1 million (in
absolute value) in any single year during that time period. When a firm avails itself of the
Indefinite Reversal Exception, it is required to report in its financial statements the dollar amount
of outside basis differences for which no expected tax consequences of repatriation are
recognized, as well as an estimate of the unrecognized tax liability. The amount of PRE reported
in a firm’s SEC 10-K is cumulative over time and aggregated across all foreign affiliates. We use
11 APB 23 was issued in 1972 and was significantly modified by paragraph 31 of FAS 109. Specifically, FAS 109 expanded the scope of the exception under APB 23. While APB 23 provided an exception only for undistributed foreign earnings of subsidies, FAS 109 provides an exception for all outside basis differences that a domestic parent may have with respect to is shares of a foreign subsidiary. 12 Other transactions that create outside basis differences include share issuances to unrelated investors, subpart F inclusions, stock options, and cumulative translation adjustments (BNA 948, PWC 2010).

9
a text search program to scan 10-K filings of 1,309 firms (13,177 firm-years) that meet our
criteria for disclosures of PRE, using variations on the following search terms: “permanently
reinvested”, “indefinitely reinvested”, “undistributed”, and “unremitted” foreign earnings.13
We combine our PRE data described above with affiliate-level data obtained from the Annual
(Benchmark) Survey of U.S. Direct Investment Abroad conducted by the Bureau of Economic
Analysis (BEA) each year since 1982. Federal law obligates U.S. MNCs to report certain
financial and operating data for both domestic and foreign operations to the BEA. A U.S. MNC
is the combination of a single U.S. entity, called the U.S. parent, and at least one foreign affiliate
in which the U.S. parent holds, directly or indirectly, a 10 percent interest. The amount of data
collected by the BEA varies by year and depends on whether the affiliate meets the applicable
reporting threshold; reporting thresholds in benchmark years (i.e., 1999, 2004) are lower so more
affiliates are required to report.14
In some instances, U.S. MNCs’ ownership structures include tiered ownership (i.e., where
affiliates are owned by other affiliates either instead of, or in conjunction with, the U.S. parent).
To study the location and composition of PRE, we focus on the financial position of the lower-
tier entities and do not attribute the financial positions of a lower-tier entity to its owner. For
instance, when an affiliate is directly (partially or wholly) owned by another affiliate, the assets
of the lower-tier entity are considered in our analysis and the proportion of the upper-tier entity’s
assets attributable to the lower-tier entity are removed from the upper-tier. The BEA data
13 We confirm the accuracy of our dataset constructed using a text search by comparing the PRE amounts to a hand-collected dataset of PRE (from a prior study) consisting of 475 MNCs (3,376 firm-years). There are no differences in PRE across the two datasets. 14 In order to reduce the reporting burden, the BEA requires affiliates to participate if its assets, sales, or net income (loss) exceed $7 million in 1999, $30 million in 2000-2003, $10 million in 2004, and $40 million in 2005-2008. During 2000-2003, and 2005-2008 (i.e., non-benchmark years), most of the financial and operating data that we observe for smaller affiliates not required to participate in the survey is estimated by the BEA.

10
provides information on ownership structures, as well as investment in and income from
affiliates that allow us to make these adjustments.
To conduct our analyses, we also aggregate affiliate-level BEA data to the firm-level. U.S.
MNCs report to the BEA on a fiscal year basis and follow U.S. Generally Accepted Accounting
Principles (GAAP), with the exception of consolidation rules. The BEA requires that the U.S.
MNC use the equity method of accounting for equity investments of more than 50 percent,
whereas GAAP requires consolidation. Thus, to avoid double-counting assets in the
consolidation process, we eliminate intercompany assets in computing worldwide assets.15
When we match our Compustat data with BEA data, this yields a final sample of 917 firms
(5,992 firm-years). In this sample, we find no disclosure regarding PRE in 1,337 firm-years and
thus, do not include these firm-years in our multivariate analysis. The final sample for our study
is an unbalanced panel of 4,655 firm-years (748 firms) from 1998 through 2008. Our 748 MNCs
represent 100,003 affiliate-years.
4. Empirical design
We test for evidence of various motivations for declaring undistributed earnings as PRE by
estimating the following empirical equation at the firm level for our sample of 4,655 firm-years
from 1998 to 2008:
PREi,t = α0 + α1Total Foreign Assetsi,t + α2Characteristic Foreign Assetsi,t + ΣαkYeark + εi,t (1)
15 For example, under the equity method of accounting used for BEA reporting, the total assets of the domestic operation will include the ‘net assets’ or equity investment in all foreign affiliates. Thus, a measure of worldwide assets necessitates that we remove the investment in foreign affiliates from domestic assets, and instead include aggregate total assets of foreign affiliates with domestic assets. This mimics the result that would be achieved if the U.S. MNCs assets were consolidated under GAAP. Total assets computed using BEA data and total assets in Compustat are highly correlated (p = 0.998).

11
Where PRE equals the amount of permanently reinvested earnings reported in a firm’s SEC
10-K filing, Total Foreign Assets equals a firm’s total assets in all foreign affiliates,
Characteristic Foreign Assets equals a firm’s total assets in foreign affiliates with the
characteristic of interest, Year represents year fixed effects, and i and t represent firm and year
subscripts, respectively.16 All continuous variables are scaled by worldwide assets.17
We examine four affiliate characteristics which we describe in more detail in Sections 4.1 to
4.4: tax status, haven status, currency volatility, and growth. The coefficients in Equation (1)
estimate the increase in PRE as assets in affiliates with these characteristics increase. For
example, when we examine tax status, Characteristic Foreign Assets equals a firm’s total assets
in foreign affiliates that would generate a tax liability upon repatriation of earnings (i.e., affiliates
with tax due), either in the form of a residual U.S. income tax, a foreign withholding tax, or both.
In this case, α1 in Equation (1) represents the change in PRE as assets in affiliates with no tax
due increases by one dollar, and α2 represents the change in PRE per dollar of assets in affiliates
with tax due, incremental to the change per dollar of assets in affiliates with no tax due. The total
change in PRE per dollar of assets in affiliates with tax due is represented by α1 + α2.
As noted above, we cannot observe the amount of PRE in each affiliate. Therefore, we
interpret these coefficients as the average amount of PRE associated with assets in affiliates with
and without the characteristic of interest. 18
4.1. Affiliates anticipated having tax due upon repatriation
Several existing studies that investigate PRE focus on its earnings implications because
designating foreign subsidiary earnings as PRE will, in many cases, increase financial statement
16 Results of estimating Equation (1) are similar when we also include a control for size and indicator variables that correspond to parent industry. 17 Unless otherwise noted, all variables are computed using BEA data. 18 We also estimate the association between PRE and foreign equity and find consistent results.

12
earnings (Krull 2004; Blouin et al. 2012; Graham et al. 2011). However, the decision to
designate undistributed foreign earnings as PRE has financial reporting consequences only when,
in expectation, there is a tax consequence of repatriation. Said another way, a firm cannot
influence financial reporting outcomes with PRE designations unless the firm expects to pay
U.S. income taxes, foreign withholding taxes, or both, upon repatriation of foreign earnings.
Anecdotally, MNCs strongly favor the Indefinite Reversal Exception because it avails them of
the ability to consistently report higher earnings and lower effective tax rates, all else equal. A
tax director of a Fortune 500 firm described the Indefinite Reversal Exception like “crack, once
you start using it, it’s hard to stop.”
Because PRE designations only affect earnings when there is an expected repatriation tax
obligation, MNCs may implement a simple rule whereby they designate earnings as PRE when
there is an expected tax consequence to repatriation and do not designate earnings as PRE
otherwise.19 If this is the case, we would expect that PRE is located primarily in subsidiaries that
will generate a tax (income and/or withholding) obligation upon repatriation.
However, a lack of earnings implications does not preclude MNCs from designating earnings
in affiliates without a repatriation tax obligation as PRE. In fact, firms may designate earnings in
these affiliates as PRE for at least two reasons. First, MNCs often operate multiple affiliates as a
coordinated business because they operate in the same geographic region or product line; these
affiliates can be located in different countries and face a wide range of different foreign income
and withholding tax rates. In this case, firms will often reinvest earnings of affiliates without
19 This would be possible in a world where audit firms were not particularly stringent in their documentation requirements for firms invoking the Exception. Although there is no evidence on this, anecdotally, permanent reinvestment assertions are a top review issue for the PCAOB. AU Section 9326 was revised for audits of fiscal years beginning after December 15, 2010 to require that audit documentation include “support for applying the indefinite reversal criteria, including specific plans for reinvestment of undistributed foreign earnings.”

13
repatriation tax obligations concurrently with the earnings of affiliates with repatriation tax
obligations and make the permanent reinvestment assertion jointly for a group of affiliates.
Second, if a firm does not have intentions to repatriate the earnings of an affiliate with no
repatriation tax obligation, it incurs no financial reporting cost by designating its earnings as
PRE. While firms with multiple subsidiaries do have the ability to cross-credit; i.e. use high
taxed foreign earnings to offset low-taxed foreign earnings, cross-crediting does not necessarily
change the financial reporting outcome associated with the PRE designation.20 The expected tax
obligation generated upon repatriation of low taxed earnings requires recognition of a deferred
tax expense/liability, while the expected tax credit generated upon repatriation of high-taxed
earnings can only be recognized as a deferred tax benefit/asset if the firm has plans to repatriate
the earnings in the foreseeable future.21 Thus, the role of each affiliate’s tax status in the PRE
decision is unclear.
To investigate the role of affiliate tax status on PRE designations, we identify affiliates that
will owe taxes upon repatriation by estimating both U.S. repatriation taxes and foreign
withholding taxes. If an affiliate’s average income tax rate is less than 0.35, it will generate a
U.S. tax obligation upon repatriation. If an affiliate’s average income tax rate is greater than 0.35
and it has a positive withholding tax rate, it will generate a withholding tax obligation with no
corresponding foreign tax credit. For each firm, we sum assets in affiliates that face either an
20 If a MNC repatriates earnings from more than one country, it can use tax credits generated in high tax countries to offset taxes on repatriations from low-tax countries. Therefore, the incremental tax rate on repatriation can be thought of as the difference between the U.S. income tax rate and the average foreign income tax rate and withholding rate paid on repatriated earnings. 21 We thank our accounting firm contacts for discussing this issue with us at length. As outlined in paragraph 34 of FAS 109, a deferred tax asset (DTA) cannot be recognized on outside basis differences (e.g., undistributed earnings) unless the temporary difference will reverse in the “foreseeable future” (often interpreted in practice to mean within 12 months). Tax credits expected to be generated upon repatriation are often referred to in practice as ‘unborn foreign tax credits’ and this guidance is applied. Based on our discussions, the requirement to recognize a DTA is much more stringent than the requirement to recognize a deferred tax liability (DTL). A firm with both a high tax and low tax subsidiary that does not designate earnings as PRE would be required to recognize a DTL but not able to recognize a DTA unless it had specific plans to repatriate the high tax earnings within 12 months.

14
average income tax rate less than the U.S. statutory tax rate of 35 percent or an average income
tax rate greater than the U.S. statutory tax rate of 35 percent and a positive withholding tax rate.
We label this sum TaxDue Foreign Assets.22
4.2. Use of havens
Existing research documents that MNCs use tax planning strategies, such as tiered ownership
in low and high tax jurisdictions (Altshuler and Grubert, 2003) and investment in tax havens
(Dyreng and Lindsay, 2009 and Hines and Rice, 1994), to avoid or defer U.S. tax on foreign
affiliate earnings. Tax haven countries are a subset of low tax countries that provide companies
opportunities for tax avoidance. Therefore, investments in tax havens result in low-taxed foreign
earnings which will generally result in a U.S. tax liability when repatriated, and require an
estimate of the repatriation tax expense on the financial statements unless the firm invokes the
Indefinite Reversal Exception.
In addition, foreign affiliate earnings invested in tax havens to avoid or defer U.S. tax can
meet the technical definition of PRE under the Indefinite Reversal Exception, i.e. if based on past
experience funds invested in these strategies are not repatriated, the firm can justifiably make a
PRE assertion. Thus, we expect that tax planning strategies are another motivation for
designating foreign earnings as permanently reinvested and investigate the importance of tax
haven presence in PRE decisions.
We focus on what Hines and Rice (1994) distinguish as large tax havens termed the ‘Big 7’
havens.23 To study the effect of Big 7 haven subsidiaries on PRE designations we calculate the
22 We use the withholding rate that would be applicable between the affiliate and its direct owner. 23 Hines and Rice (1994) highlight that economies of tax havens differ considerably noting that the Big 7 havens – Hong Kong, Ireland, Lebanon, Liberia, Panama, Singapore and Switzerland – account for 80 percent of the tax haven population, 89 percent of tax haven GDP, and are the “locus of most physical activity undertaken by U.S. haven affiliates” (pg. 153). In Section 6.1, we consider ‘Dot’ havens – havens that have smaller economies.

15
sum of each firm’s assets in affiliates located in Big 7 tax havens and label this variable B7
Foreign Assets.
4.3. Currency volatility
Another factor that can affect PRE is foreign currency translation of the foreign tax credit.
Since many foreign affiliates of U.S. firms operate in foreign currencies, it is necessary to
translate dividend payments and foreign taxes paid into U.S. dollars to calculate U.S. repatriation
taxes. However, the dividend and the foreign tax credit are translated into U.S. dollars at
different points in time. The foreign tax credit is translated based on the exchange rate in effect
when the foreign taxes were paid (see Moore 2011). The dividend, however, is translated based
on spot rates in effect at the time of the repatriation. Therefore, fluctuation in currency rates
generates variation in repatriation tax obligations and any associated accounting expense
recognition. By designating undistributed foreign earnings as PRE, MNCs are able to mitigate
potential volatility in earnings attributable to the repatriation tax accrual.
However, Dodonova and Khoroshilov (2007) develop a model showing that firms facing
exchange rate volatility have incentives to repatriate income sooner. The authors model the
foreign currency translation of foreign tax credits as the U.S. government de facto holding
foreign currency put options against U.S. firms with foreign affiliates that, when combined with
exchange rate volatility, reduces their foreign after-tax rate of return.
To investigate the role of currency volatility on PRE designations, we define affiliates with
high currency volatility as those whose local (real) exchange rate volatility against the U.S.
dollar over the previous 12 months is greater than the median for all affiliates.24 We define FX
Foreign Assets as total assets in affiliates with high foreign currency volatility.
4.4. Growth opportunities 24 We obtain exchange rate data from Global Financial Data at https://www.globalfinancialdata.com .

16
The criteria for designating earnings as PRE state that MNCs must have sufficient evidence
“that the subsidiary has invested or will invest the undistributed earnings indefinitely or that the
earnings will be remitted in a tax-free liquidation.” MNCs can use their past experience,
forecasted future operations, and repatriation patterns as evidence to support a PRE assertion
with respect to foreign earnings. In addition, existing research finds that U.S. investment abroad
is increasing in expected growth (e.g., Desai, Foley, and Hines 2007), and that firms will reinvest
abroad, rather than repatriate to the U.S., when the foreign after-tax return is greater than the
domestic after-tax return (Hartman 1985). This research suggests that MNCs will reinvest more
in affiliates with higher growth. As growth increases, the expected length of their investment
likely increases as well, improving the MNCs ability to make a PRE assertion. Thus, we
investigate whether growth opportunities are an important motivation for designating foreign
affiliate earnings as PRE.
To investigate the effect of growth on PRE designations, we define high growth affiliates as
those with total investment in R&D and capital expenditures greater than the median for all
subsidiaries in year t. For each firm, we calculate GR Assets as total assets in high growth
affiliates.
5. Results
5.1 Descriptive statistics
In Table 1 Panel A we present descriptive statistics on the sample that we use in our analysis
as well as the 1,337 zero-PRE MNC observations noted in Section 3. MNCs that report PRE
greater than zero are significantly larger, and have significantly greater foreign assets as a
fraction of total assets than firms with no PRE. The estimated repatriation tax rate (which is the
estimated cash outflow firms would incur upon repatriation) for firms with PRE is significantly

17
lower than the rate on zero-PRE firms, which suggests the existence of some reason for using the
Indefinite Reversal Exception beyond simply minimizing MNCs’ reported tax expense. The
mean withholding taxes on repatriations is 3.7 percent for the PRE firms, which suggests that
withholding taxes are a non-trivial component of firms’ repatriation tax obligations. In addition,
Panel A reports that mean PRE is about $1.0 billion and that PRE represents 11% of worldwide
assets.
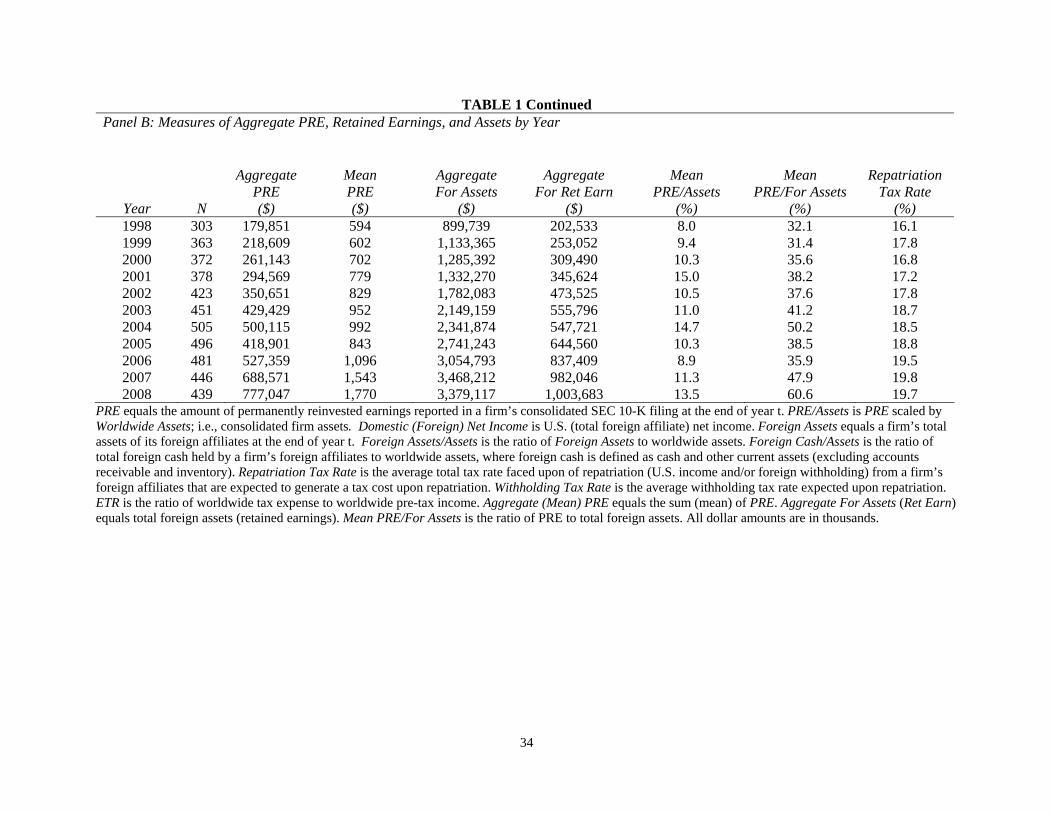
In Table 1 Panel B, we report several measures of PRE over our sample period. Aggregate
PRE for our sample grows from $180 billion in 1998 to $777 billion in 2008. The only drop in
aggregate PRE occurs in 2005, from $500 billion to $419 billion, which is likely attributable to
the AJCA, which permitted firms a temporarily reduced tax cost associated with the repatriation
of foreign earnings. Although aggregate PRE has not grown as quickly as aggregate foreign
assets, mean PRE appears to have increased precipitously in the post-AJCA period. Finally,
consistent with declining foreign income tax rates, the Repatriation Tax Rate has increased over
our sample period.
5.2. Analysis of motivations for PRE designations
Table 2 reports the results of estimating the effect of affiliate characteristics on the proportion
of foreign assets designated as permanently reinvested. Specifically, Panels A through D report
the results of estimating Equation (1) for the four affiliate characteristics of interest (tax status,
haven status, currency volatility, and growth).
Panel A reports the results of estimating Equation (1) using TaxDue Foreign Assets (as
Characteristic Foreign Assets). The coefficient on Total Foreign Assets is 0.1815 which suggests
that 18 percent of assets in affiliates with no tax due are designated as PRE. The coefficient on
TaxDue Foreign Assets suggests that 29 percent (0.1815 + 0.1059) of assets in affiliates with tax

18
due are designated as PRE. This proportion is not significantly different than the proportion for
affiliates with no tax due (t=-1.00). However, the mean foreign assets in affiliates with tax due
represents 90 percent of total foreign assets (mean foreign assets in affiliates with tax due as a
percentage of worldwide assets is 0.3014 and mean foreign assets as a percentage of worldwide
assets is 0.3344). When we use these respective means to estimate the amount of PRE in
affiliates with and without tax due, we find that PRE in affiliates with tax due is 8.66 percent of
worldwide assets [0.3014*(0.1815+0.1059)] and PRE in affiliates with no tax due is 0.6 percent
of worldwide assets. These estimates suggest that 94 percent of PRE is located in affiliates with
tax due [8.66/(0.60+8.66)] and 6 percent of PRE is located in affiliates with no tax due
[0.60/(0.60+8.66)]. This result provides evidence that a large proportion of PRE are located in or
associated with earnings in low income tax or high withholding tax affiliates, and would likely
trigger a U.S. repatriation tax or foreign withholding tax upon repatriation.25
Panel B reports results of estimating Equation (1) using B7 Foreign Assets. This test
estimates the effect of assets in Big 7 haven affiliates on PRE relative to assets in non-Big 7
haven affiliates. If assets invested in Big 7 affiliates are tied up in complex tax planning
strategies, then assets in Big 7 haven affiliates should have a more positive effect on PRE than
assets in other affiliates. Consistent with this expectation, the coefficient on B7 Foreign Assets is
0.1222 and is significantly different from zero. This result suggests that a higher proportion of
assets in Big 7 haven affiliates is designated as PRE than in non-Big 7 haven affiliates. Using the
mean foreign assets in all affiliates and Big 7 haven affiliates to interpret these coefficients, we
find that PRE located in non-Big 7 haven affiliates equals 7.65 percent of worldwide assets
25 We also estimate Equation (1) defining Characteristic Foreign assets as the sum of assets in affiliates with an average tax rate less than 0.35 (LT Foreign Assets). We find that the coefficient on LT Foreign Assets is -0.0525 (t=-0.97) and 74 percent of PRE is located in low tax affiliates. When we define Characteristic Foreign Assets as the sum of assets in affiliates with a positive withholding tax rate (WH Foreign Assets) the coefficient on WH Foreign Assets is 0.1087 (t=2.44) and 54 percent of PRE is located in positive withholding tax affiliates.

19
[(0.3344 - 0.0424)*0.2620], and PRE located in Big 7 haven affiliates equals 1.63 percent of
worldwide assets [0.0424*(0.2620 + 0.1222)]. Thus, our estimates suggest that about 18 percent
of PRE is located in Big 7 tax havens. Yet, only 5 percent of our sample’s worldwide assets are
located in Big 7 tax haven countries (untabulated). This latter observation is consistent with
firms making the PRE designation for tax and/or earnings purposes.
We repeat these analyses in Panels C and D, using FX Foreign Assets and GR Foreign Assets
respectively, to test the significance of the association between assets in high currency volatility
and high growth affiliates. In Panel C, we report the effect of assets in high currency volatility
affiliates on PRE designations. Although earnings incentives would predict a positive association
between currency volatility and PRE designations, we find that the coefficient on FX Foreign
Assets is negative and significant. Consistent with Dodonova and Khoroshilov (2007), this result
suggests that firms are less likely to designate foreign earnings as PRE if they are in an affiliate
with high currency volatility, because the firm is more likely to repatriate the income sooner.
Alternatively, high currency volatility may be correlated with politically or economically
unstable economies in which U.S. multinationals have little expectation of making long-term
investment commitments. Our interpretation of these coefficients suggests that about 27 percent
of PRE is located in affiliates with high currency volatility.26
Panel D reports the results of using GR Foreign Assets to estimate Equation (1). A positive
coefficient on GR Foreign Assets is consistent with firms’ designating more subsidiary earnings
as PRE when the firm has profitable investment opportunities abroad. Consistent with this
assertion, we find that the coefficient on GR Foreign Assets is significantly greater than the
26 As sensitivity tests we define FX Foreign Assets as assets in affiliates with a change in the exchange rate over the last three years and five years greater than the median change for sample and find similar results.

20
coefficient on Total Foreign Assets. Further, this coefficient suggests that 60 percent of PRE is
located in affiliates with high growth.
5.3. Binding versus non-binding foreign tax credit positions
The tests in Table 2 investigate whether affiliate characteristics affect firms’ decisions to
designate foreign affiliate earnings as PRE. However, we measure PRE at the firm level. While
an individual affiliate characteristic can affect PRE decisions, affiliate earnings often travel
through chains of ownership before they reach the ultimate U.S. parent. In addition, in
calculating the overall U.S. tax liability, firms can use foreign tax credits from high taxed entities
to offset the U.S. tax liability on low-taxed entities and can carry forward unused foreign tax
credits.
As a result, some MNCs face foreign tax rates that, on average, are higher than the U.S. rate.
These firms effectively have “extra” U.S. credit for their foreign tax payments (binding MNCs)
and thus, the foreign tax credit (FTC) generally eliminates the repatriation tax. In contrast, other
MNCs face foreign tax rates that, on average, are lower than the U.S. rate and these firms are
said to be in a non-binding FTC position. The parent firm’s overall tax status can affect the
ultimate U.S. tax liability on foreign affiliate earnings and the financial statement effect of the
tax liability.
Thus, MNCs’ in different FTC positions – binding versus non-binding – may place
differential focus on the motivations for designating PRE outlined above. To study the role of
firms’ FTC positions on PRE motivations, we partition our sample based on whether it is in a
binding FTC position or not and then re-estimate Equation (1) for each affiliate characteristic.
Table 3 reports the results of partitioning our estimation of Equation (1) by the firms’ FTC
positions. Consistent with MNCs making PRE assertions for earnings incentives, we find that the

21
association between TaxDue Foreign Assets and B7 Foreign Assets and PRE levels, reported in
Panels A and B, respectively, is concentrated in the sample of MNCs facing non-binding FTC
constraints.27 This result is consistent with firms facing non-binding FTC positions placing more
weight on earnings and tax motivations for designating PRE because they likely have a greater
unrecognized repatriation tax expense.
Results in Panel C suggest that the role of currency volatility in PRE designations is not
associated with the MNC’s FTC position. In Panel D, while growth appears to affect PRE
designations of firms in both binding and non-binding FTC positions, the coefficient on GR
Foreign Assets is 0.1356 for binding firms and 0.0624 for nonbinding firms. The results in
Panels A, B, and D suggest that growth plays a larger role and taxes play a lesser role in PRE
designations for binding FTC firms, relative to non-binding FTC firms.
5.4. Competing motivations
As we are curious as to whether there is any dominant characteristic that explains PRE, we
further explore firms’ motivations for designating earnings as PRE using the following equation:
PREi,t = α0 + α1Total Foreign Assetsi,t + α2TaxDue Foreign Assetsi,t + α3B7 Foreign
Assetsi,t + α4FX Foreign Assetsi,t + α5GR Foreign Assetsi,t + ΣαkYeark + εi,t (2)
All variables in Equation (2) are defined as in Equation (1). Equation (2) differs in that it allows
each motivation to compete, thus testing whether each motivation is significant, after controlling
for the other.
27 When we define Characteristic Foreign Assets using LT Foreign Assets (assets in affiliates with an average tax rate less than 0.35) the coefficient on LT Foreign Assets is 0.0699 (t=1.49) for non-binding FTC firms and -0.2445 (t=-2.92) for binding FTC firms. These results suggest that 88 (32) percent of PRE is in low tax affiliates for non-binding (binding) firms. When we define Characteristic Foreign Assets using WH Foreign Assets (assets in affiliates with a positive withholding tax rate) the coefficient on WH Foreign Assets is 0.0879 (t=1.88) for non-binding FTC firms and 0.1923 (t=2.04) for binding FTC firms. These results suggest that 51 (66) percent of PRE is in positive withholding tax affiliates for non-binding (binding) firms.
22
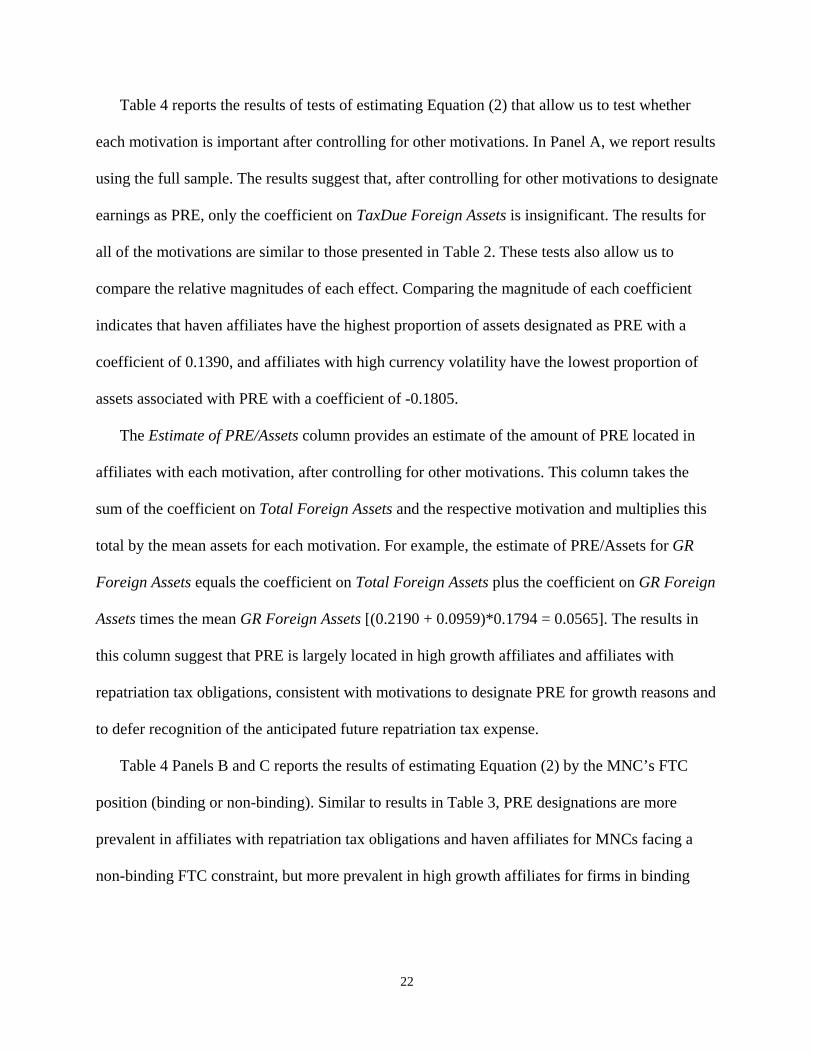
Table 4 reports the results of tests of estimating Equation (2) that allow us to test whether
each motivation is important after controlling for other motivations. In Panel A, we report results
using the full sample. The results suggest that, after controlling for other motivations to designate
earnings as PRE, only the coefficient on TaxDue Foreign Assets is insignificant. The results for
all of the motivations are similar to those presented in Table 2. These tests also allow us to
compare the relative magnitudes of each effect. Comparing the magnitude of each coefficient
indicates that haven affiliates have the highest proportion of assets designated as PRE with a
coefficient of 0.1390, and affiliates with high currency volatility have the lowest proportion of
assets associated with PRE with a coefficient of -0.1805.
The Estimate of PRE/Assets column provides an estimate of the amount of PRE located in
affiliates with each motivation, after controlling for other motivations. This column takes the
sum of the coefficient on Total Foreign Assets and the respective motivation and multiplies this
total by the mean assets for each motivation. For example, the estimate of PRE/Assets for GR
Foreign Assets equals the coefficient on Total Foreign Assets plus the coefficient on GR Foreign
Assets times the mean GR Foreign Assets [(0.2190 + 0.0959)*0.1794 = 0.0565]. The results in
this column suggest that PRE is largely located in high growth affiliates and affiliates with
repatriation tax obligations, consistent with motivations to designate PRE for growth reasons and
to defer recognition of the anticipated future repatriation tax expense.
Table 4 Panels B and C reports the results of estimating Equation (2) by the MNC’s FTC
position (binding or non-binding). Similar to results in Table 3, PRE designations are more
prevalent in affiliates with repatriation tax obligations and haven affiliates for MNCs facing a
non-binding FTC constraint, but more prevalent in high growth affiliates for firms in binding

23
FTC positions. Once again, PRE assertions are not disparately affected by the MNC’s FTC
position in highly volatile currency jurisdictions.
6. Additional analyses
6.1 Types of tax havens
Next, we examine the effect of tax status and haven status in more detail. This analysis is
motivated by interest in PRE in the context of discussions about corporate tax reform (see
Section 1). A common perception in the business press and policy debates is that U.S. tax law
encourages investment in offshore tax havens (Miller 2011), and that PRE signals the extent to
which this conjecture may be true by conveying information about the undistributed earnings
that have not yet been taxed by the U.S. (Zion et al. 2011). We target the role of anticipated
repatriation tax costs and tax planning strategies involving offshore tax havens in PRE
designations by estimating Equation (1) using alternative definitions of a tax haven.
Table 5 Panel A defines affiliates’ tax haven status based on the 34 tax haven countries
defined in Hines and Rice (1994). Panel B separates these 34 havens into Big 7 tax havens and
all other havens which we label DOT havens. DOT havens are those with relatively small
economies (many of them island communities), whereas Big 7 havens are those with more
significant economies in terms of population, land area, and GDP. Overall, the results indicate
that affiliate assets in DOT havens and Big 7 havens exhibit very different proportions and levels
of PRE. In fact, on average, a presence in DOT havens decreases a firm’s level of PRE. We
conjecture that MNCs find it difficult to substantiate PRE designations in DOT havens because
there is very little active business in these locations to support such an assertion.
6.2 Asset composition

24
Undistributed foreign earnings can be reinvested in either operating assets or financial assets.
The distinction is important for two reasons. First, the tax revenue implications of PRE depend
on the extent to which firms with significant amounts of PRE hold liquid assets (i.e., cash and
cash equivalents) that can be repatriated without the need to sell productive assets used in an
active trade or business. Second, PRE’s asset composition has implications for firm value. De
Waegenaere and Sansing (2008) derives the valuation implications of future repatriation tax
consequences and infers that firm value should only impound repatriation tax liabilities when
PRE is invested in financial assets. Bryant-Kutcher, Eiler and Guenther. (2008) finds empirical
support for the predictions of the De Waegenaere and Sansing (2008) model.28
We are interested in understanding the decision to hold operating versus financial assets
because of the implications for international tax policy and MNC liquidity. If a significant
proportion of PRE is in non-financial assets, then these earnings are likely to remain reinvested
in perpetuity. Should policymakers consider the repeal of deferral, transition rules requiring the
immediate taxation of reinvested earnings could have adverse consequences to MNCs if the
MNCs must either sell productive assets or borrow to pay any resulting tax obligation. However,
if PRE is in liquid assets, then as illustrated by the recent SEC inquiries into the location of
MNCs’ cash balances, investors may be concerned about the cost firms must incur to access their
cash.
To examine the asset composition of PRE, we estimate the following regression equation:
PREi,t = β0 + β1Total Foreign Assetsi,t + β2Foreign Cashi,t + ΣβkYeark + εi,t (3)
Foreign Cash equals total foreign cash and cash equivalents (i.e., financial assets). All other
variables are defined in Equation (1).
28 Bryant-Kutcher et al. (2008) confirms the Collins, Hand and Shackelford (2000) finding that firms’ value is affected when the firm discloses the estimated tax liability on PRE.

25
We also examine the asset composition of PRE in affiliates with the various characteristics
described in Sections 4.1 to 4.4 to further understand motivations for PRE. In particular, we are
interested in understanding whether the asset composition of PRE varies by the extent of MNCs’
expected repatriation obligations. Similarly, investigating the association between asset
composition and growth aids in our understanding of whether high growth affiliates build up
cash or operating assets. To investigate the asset composition of PRE jointly with affiliate
characteristics, we estimate the following regression equation:29
PREi,t = β0 + β1Non-Cash Foreign Assetsi,t + β2Foreign Cashi,t
+ β3 Characteristic Non-Cash Foreign Assetsi,t
+ β4 Characteristic Foreign Cashi,t + ΣβkYeark + εi,t (4)
Characteristic Foreign Cash (Characteristic Non-Cash Foreign Assets) equals Foreign Cash
(Non-Cash Foreign Assets) assets summed across a firm’s affiliates with the characteristic of
interest.
We study the same four characteristics we examine in Equation (1): affiliates with
repatriation tax obligations (TaxDue), Big 7 tax haven affiliates (B7), affiliates with high
currency volatility (FX), and high growth affiliates (GR). When Characteristic Foreign Cash
equals TaxDue Foreign Cash, β2 in Equation (4) represents the change in PRE as cash assets in
affiliates with no tax due increase by one dollar, and β4 represents the change in PRE per dollar
of cash assets in affiliates with tax due, incremental to the change per dollar of cash assets in
affiliates with no tax due. The total change in PRE per dollar of cash assets in affiliates with tax
due is represented by β2 + β4. This equation allows us to test whether cash (non-cash) assets in
affiliates with tax due have a significantly different effect on PRE than cash (non-cash) assets in
29 We disaggregate Total Foreign Assets into Non-Cash Foreign Assets and Foreign Cash in Equation (4) to facilitate the interpretation of the coefficients.

26
affiliates with no tax due, and also allows us to observe the relative magnitudes of the effects of
cash versus non-cash assets.
Table 6 reports the results of estimating Equations (3) and (4) that investigate the types of
assets in which firms invest PRE. We compare cash versus non-cash assets. For each
comparison, we also estimate whether the proportion of PRE invested in each asset category
varies along our four affiliate characteristics. The results generally suggest that a higher
proportion of cash is designated as PRE than non-cash assets. For example, in Panel A, the
coefficient on Total Foreign Assets is 0.2492 and the coefficient on Foreign Cash is 0.3419
(0.2492 + 0.0927). However, the % of PRE column suggests that 58% of PRE is held in the form
of non-cash assets, and 42% of PRE is held in cash. Thus, our estimates suggest that over half of
PRE is held in non-cash assets.
Panels B and C suggest that the proportion of PRE held in cash does not vary with the tax
attributes of the affiliate. However, in Panel E the coefficient on non-cash assets in high growth
affiliates is 0.2531 (0.2471 + 0.0060) and the coefficient on cash in high growth affiliates is
0.5327 (0.2500 + 0.2827). This result is consistent with high growth affiliates holding more cash
to have available for investments.
In Table 7 we estimate Equations (3) and (4) for the non-binding and binding FTC partitions.
In Panel A we find that non-binding firms designate a significantly higher proportion of foreign
cash as PRE than non-cash foreign assets whereas binding firms do not. Foley et al. (2007) find
that firms with higher repatriation taxes hold more cash. Consistent with this notion, our result
further suggests that this cash is designated as PRE. This same pattern is apparent in Panel B.
Non-binding FTC firms designate a significantly higher proportion of cash as PRE in tax due

27
affiliates than in no tax due affiliates, whereas as binding FTC firms do not. However, Panels C,
D, and E do not exhibit any notable differences across binding and non-binding FTC firms.
6.3 Country and industry location
A natural extension from the previous analyses is to investigate the specific countries and
industries in which PRE are located. As mentioned above, investors are clearly interested in
understanding the potential tax liabilities associated with cash abroad. Furthermore, information
regarding country and industry location of PRE could inform policymakers about the revenue
consequences of any change in U.S. international tax policy as well as the impact of changes in
other countries’ tax policy. Although admittedly descriptive, we believe that our analysis
provides information regarding PRE that has never been revealed.
In order to provide descriptive evidence on the countries where PRE is located, we estimate
the following regression:
PREi,t = ΣδnCountryn Assetsi,t + εi,t (5)
Where Country Assets equal a firm’s total foreign assets in each individual country in which the
firm’s affiliates operate. All other variables are defined in Equation (1).
We also provide descriptive evidence on how the use of PRE varies across industries by
estimating the following regression:
PREi,t = ΣδnIndustryn Assetsi,t + εi,t (6)
Where Industry Assets reflect a firm’s total foreign assets in various industries represented by the
firm’s affiliates. Note that our industry summations use the industry membership of the affiliate,
so our industry analysis captures variation in PRE across industries regardless of the extent of

28
firms’ industrial diversification.30 The coefficient δn in Equations (5) and (6) represents the
change in PRE as assets in country n and industry n, respectively, increase by one dollar.
In Table 8, we present the results of estimating Equations (5) and (6). In Panel A, we report
the estimated country location of PRE. We separately tabulate the coefficients and estimates of
PRE in 17 countries where U.S. MNCs have significant foreign assets, and combine all other
countries into ‘Other’. The coefficient on Country Assets estimates the change in PRE for each
dollar of assets in each country. Since PRE is a component of assets, these coefficients can be
interpreted as the proportion of assets in each location designated as PRE and allow us to
estimate the amount of PRE in each jurisdiction.
Panel A reports that the UK and Canada have the highest percent of PRE. It is interesting to
note that both countries have historically had high statutory income tax rates, but yet the
Indefinite Reversal Exception is asserted in these countries.
We also estimate how much PRE is held in cash in each country and the tax obligation that
would be necessary to repatriate cash designated as PRE.31 These estimates are also reported in
Panel A. As suggested by the estimates of PRE held in cash, the greatest average repatriation tax
obligation is in the UK followed by Ireland and the Netherlands.
In Table 8 Panel B, we investigate the industry location of PRE. The largest industry for PRE
is “Wholesale trade” followed by “Services”. The former industry group includes firms that sell
any type of good, but whose role is to simplify flows of products, payments, and information by
acting as intermediaries between a manufacturer and the final customer whereas services
30 The BEA surveys capture 4-digit NAICS codes for each affiliate and our industry groups align with those that the BEA uses to report international statistics. 31 We estimate PRE held in cash in each country using the following regression: PREi,t = ΣδnCountryn Cash Assetsi,t + ΣγnCountryn Non-Cash Assetsi,t where Countryn Cash Assets equals the sum of cash held in Country n and Countryn Non-Cash Assets equals the sum of non-cash assets held in country n. We interpret the coefficients on Countryn Cash Assets to estimate the amount of PRE held in cash in each country.

29
includes software business. Finally, Other Manufacturing (which primarily includes textile
manufacturers) and Chemical (which includes pharmaceutical companies), and Other are the
next largest industries for PRE. Note that Chemical companies were among the largest
repatriating firms under the AJCA.
7. Conclusion
U.S. firms continue to expand their operations abroad at a rapid pace – at the end of 2010, 89
percent of S&P 500 firms conducted business outside the U.S. – yet the only required
information in firms’ publicly available financial statements are foreign pre-tax earnings, taxes,
PRE in aggregate, sales and long-lived assets by geographic area, and a list of material
subsidiaries and their locations. The value relevance of the information contained in many of
these reported amounts has been studied extensively. One particular disclosure about foreign
operations is receiving significant interest in current debates on corporate tax reform – aggregate
permanently reinvested earnings (PRE). Motivated by the potential importance of PRE in tax
policy debates, and the fact that we know very little about its meaning and implications for firm
value, we conduct a detailed study of the location and composition of PRE.
PRE are foreign affiliate earnings for which a firm has not recognized a residual U.S. tax
expense, if any, due upon repatriation of those earnings. In practice, firms only report the
aggregate amount of PRE across all foreign affiliates and seldom report the expected tax liability
associated with its repatriation to the United States. This aggregate number makes it difficult, if
not impossible, for investors to understand the implications of PRE for firm value and liquidity,
or for policy-makers to understand the implications of PRE regarding the effects of corporate tax
reform. The common perception in the business press and policy debates is that PRE is
informative about all undistributed earnings that have not yet been taxed by the U.S., suggesting

30
that PRE are located primarily in low-tax and haven jurisdictions. However, there is no evidence
of this to date.
Our study combines amounts reported as PRE with confidential affiliate-level data collected
on legally mandated federal surveys of U.S. MNCs to learn the location and composition of PRE.
We make two key observations. First, we find that most (approximately 94 percent) but not all
PRE is located in low tax jurisdictions. Second, we find that a significantly higher proportion of
PRE is held in the form of cash in low-tax, relative to high-tax jurisdictions. Overall, our analysis
suggests that PRE has multiple implications for firm value. Some portion of PRE appears to
represent high levels of cash held by affiliates in low-tax jurisdictions, while other portions
represent non-cash assets in high growth affiliates. Thus, we urge researchers and policymakers
to exercise caution when using PRE to assess implications of corporate tax reform.

31
References Altshuler, R. and H. Grubert (2003), ‘Repatriation taxes, repatriation strategies, and
multinational financial policy’. Journal of Public Economics 87, 73-107. Blouin, J. and L. Krull (2009), ‘Bringing it home: A study of the Incentives Surrounding the
Repatriation of Foreign Earnings Under the American Jobs Creation Act of 2004’. Journal of Accounting Research 47, 1027-1059.
Blouin, J., L. Krull and L. Robinson (2012), ‘Is U.S. multinational repatriation policy influenced
by reporting incentives?’ The Accounting Review, forthcoming. Bryant-Kutcher, L. L. Eiler and D. Guenther (2008). ‘Taxes and financial assets: Valuing
permanently reinvested earnings’. National Tax Journal 61(4): 699-721. Bureau of National Affairs (BNA) Tax Management Foreign Income Portfolio No. 948, U.S.
Tax-Related Accounting Issues of Multinational Corporations. Collins, J., J.R.M. Hand and D. Shackelford (2000). ‘Valuing deferral: The effect of permanently
reinvested earnings on stock prices.’ In: J. Hines (ed): International Taxation and Multinational Activity, University of Chicago Press, 143-172.
Desai, M., F. Foley and J. Hines (2003). ‘Chains of ownership, regional tax competition, and
foreign direct investment.’ In Foreign Direct Investment in the Real and Financial Sector of Industrial Countries, edited by Heinz Herrmann and Robert Lipsey, Heidelberg: Springer Verlag, pp. 61-98.
Desai, M., F. Foley and J. Hines (2007), ‘Dividend policy inside the multinational firm’.
Financial Management 36(1): 5-26. De Waegenaere, A., and R. Sansing, 2008. Taxation of international investment and accounting
valuation.’, Contemporary Accounting Research 25(4): 1045-66. Dodonova, A., and Y. Khoroshilov, 2007. Income repatriation decision for multinational
corporations: Tax issues. Journal of Accounting and Public Policy, 26(3): 376-384. Dyreng, S. and B. Lindsey (2009), ‘Using financial accounting data to examine the effect of
foreign operations located in tax havens and other countries on U.S. multinational firms’ tax rates’. Journal of Accounting Research 47, 1283-1316.
Dyreng, S., B. Lindsey, K. Markle and D. Shackelford (2011). Taxes and the clustering of
foreign subsidiaries. Duke University working paper. Financial Accounting Standards Board, Accounting Standards Codification 740 – Income Taxes,
Norwalk, CT.
32
Financial Accounting Standards Board, Accounting Standards Codification 280 – Segment Reporting, Norwalk, CT.
Foley, F., J. Hartzell, S. Titman, and G. Twite. 2007. ‘Why do firms hold so much cash? A tax-
based explanation.’ Journal of Financial Economics 86: 579-607. Graham, J., M. Hanlon, and T. Shevlin (2011). ‘Real effects of accounting rules: Evidence from
multinational firms’ investment location and profit repatriation decisions.’ Journal of Accounting Research 49(1): 137-185.
Graham, J., J. Raedy, and D. Shackelford, 2011. ‘Research in accounting for income taxes’,
Journal of Accounting and Economics, forthcoming. Hartman, D. (1985), ‘Tax policy and foreign direct investment’. Journal of Public Economics 26,
107-121. Hines, J. and E. Rice (1994). ‘Fiscal paradise: Foreign tax havens and American business.’
The Quarterly Journal of Economics 109(1), 149-183. Krull, L. (2004). ‘Permanently reinvested foreign earnings, taxes, and earnings management’.
The Accounting Review, 79(3), 745-767. Mataloni, R. 2003. U.S. Multinational Companies: Operations in 2001. Survey of Current
Business: 85-105.
Miller, D., 2011. ‘Unintended consequences: How U.S. tax law encourages investment in offshore tax havens.’ NYU School of Law working paper.
Moore, A. (2011). ‘Do repatriation taxes affect firms’ dividend behavior? Evidence from exchange rate based tax changes’. University of California at Berkeley working paper.
Mott, D., and A. Schmidt (2011). ‘Accounting issues: Show us the foreign cash!’, J.P. Morgan
North America Equity Research (September 12, 2011). PricewaterhouseCoopers (2010). ‘Deferred taxes on foreign earnings: A road map’.
http://www.pwc.com/us/en/tax-accounting-services/publications/deferred-taxes-foreign-earnings.jhtml.
Whitehouse, T. (2011), ‘SEC squinting at overseas earnings’. Compliance Weekly (June 14, 2011). Zion, D., A. Varshney, and C. Cornett (2010). ‘Taxes going up.’, Credit Suisse Equity Research
(February 5, 2010) Zion, D. A. Varshney, and N. Burnap (2011). ‘Parking earnings overseas’. Credit Suisse Equity
Research (April 26, 2011).

33
TABLE 1 Descriptive Statistics
Panel A: Descriptive Statistics for Firms with and without PRE PRE > 0; N=4,655 PRE = 0; N=1,337
Variable Mean Std Deviation Mean Std Deviation PRE 997.6904*** 3,292.3700 N/A N/A PRE/Assets 0.1095*** 0.1320 N/A N/A Worldwide Assets 12926.8109*** 626909.6070 7049.3700 278744.0310 Domestic Net Income 476.8669*** 2775.9284 188.3550 2016.5783 Foreign Net Income 227.1819*** 862.0576 44.3259 123.2746 Foreign Assets 5060.6161*** 21447.7079 1040.0418 2524.8760 Foreign Assets/Assets 0.3348*** 0.2575 0.2487 0.3212 Foreign Cash/Foreign Assets 0.1145*** 0.1192 0.0704 0.1109 Repatriation Tax Rate 0.1839*** 0.0774 0.1927 0.0999 Withholding Tax Rate 0.0371*** 0.0210 0.0415 0.0249 ETR 0.3652 0.2857 0.3595 0.2730
34
TABLE 1 Continued Panel B: Measures of Aggregate PRE, Retained Earnings, and Assets by Year
Year
N
Aggregate PRE ($)
Mean PRE ($)
Aggregate For Assets
($)
Aggregate For Ret Earn
($)
Mean PRE/Assets
(%)
Mean PRE/For Assets
(%)
Repatriation Tax Rate
(%) 1998 303 179,851 594 899,739 202,533 8.0 32.1 16.1 1999 363 218,609 602 1,133,365 253,052 9.4 31.4 17.8 2000 372 261,143 702 1,285,392 309,490 10.3 35.6 16.8 2001 378 294,569 779 1,332,270 345,624 15.0 38.2 17.2 2002 423 350,651 829 1,782,083 473,525 10.5 37.6 17.8 2003 451 429,429 952 2,149,159 555,796 11.0 41.2 18.7 2004 505 500,115 992 2,341,874 547,721 14.7 50.2 18.5 2005 496 418,901 843 2,741,243 644,560 10.3 38.5 18.8 2006 481 527,359 1,096 3,054,793 837,409 8.9 35.9 19.5 2007 446 688,571 1,543 3,468,212 982,046 11.3 47.9 19.8 2008 439 777,047 1,770 3,379,117 1,003,683 13.5 60.6 19.7
PRE equals the amount of permanently reinvested earnings reported in a firm’s consolidated SEC 10-K filing at the end of year t. PRE/Assets is PRE scaled by Worldwide Assets; i.e., consolidated firm assets. Domestic (Foreign) Net Income is U.S. (total foreign affiliate) net income. Foreign Assets equals a firm’s total assets of its foreign affiliates at the end of year t. Foreign Assets/Assets is the ratio of Foreign Assets to worldwide assets. Foreign Cash/Assets is the ratio of total foreign cash held by a firm’s foreign affiliates to worldwide assets, where foreign cash is defined as cash and other current assets (excluding accounts receivable and inventory). Repatriation Tax Rate is the average total tax rate faced upon of repatriation (U.S. income and/or foreign withholding) from a firm’s foreign affiliates that are expected to generate a tax cost upon repatriation. Withholding Tax Rate is the average withholding tax rate expected upon repatriation. ETR is the ratio of worldwide tax expense to worldwide pre-tax income. Aggregate (Mean) PRE equals the sum (mean) of PRE. Aggregate For Assets (Ret Earn) equals total foreign assets (retained earnings). Mean PRE/For Assets is the ratio of PRE to total foreign assets. All dollar amounts are in thousands.

35
TABLE 2 Location of PRE Based on Affiliate Characteristics
Variable Coeff. t-stat Variable
Mean Estimate of PRE/Assets % of PRE
Panel A: Affiliates with Tax Due upon Repatriation Intercept 0.0010 0.14 Total Foreign Assets 0.1815 1.77 0.3344 0.0060 6 TaxDue Foreign Assets 0.1059 1.00 0.3014 0.0866 94 R2= 0.3095
Panel B: Affiliates Located in Big 7 Havens Intercept 0.0010 0.14 Total Foreign Assets 0.2620 10.42 0.3344 0.0765 82 B7 Foreign Assets 0.1222 1.86 0.0424 0.0163 18 R2= 0.3115
Panel C: Affiliates with High Currency Volatility Intercept 0.0058 0.94 Total Foreign Assets 0.3427 12.47 0.3344 0.0643 73 FX Foreign Assets -0.1847 -5.50 0.1469 0.0232 27 R2= 0.3348
Panel D: High Growth Affiliates Intercept -0.0037 -0.53 Total Foreign Assets 0.2448 8.69 0.3344 0.0379 40 GR Foreign Assets 0.0776 2.33 0.1794 0.0578 60 R2= 0.3122
Table 2 reports the results of estimating Equation (1) for 4,655 firm-years from 1998 to 2008. PRE equals the amount of permanently reinvested earnings reported in a firm’s consolidated SEC 10-K filing at the end of year t. PRE/Assets is PRE scaled by worldwide assets. Total Foreign Assets equals a firm’s total assets of its foreign affiliates at the end of year t. TaxDue Foreign Assets in Panel A equals a firm’s total assets in foreign affiliates (excluding any investment in other affiliates) that would generate a tax consequence upon repatriation of earnings, either in the form of a residual U.S. income tax, a foreign withholding tax, or both. B7 Foreign Assets in Panel B equals a firm’s total assets in foreign affiliates (excluding any investment in other affiliates) located in any of the Big 7 tax havens per Hines and Rice (1994) at the end of year t (i.e., Hong Kong, Ireland, Lebanon, Liberia, Panama, Singapore and Switzerland). FX Foreign Assets in Panel C equals a firm’s total assets in foreign affiliates (excluding any investment in other affiliates) whose coefficient of variation in local exchange rates against the U.S. dollar over the previous 12 months is greater than the median for all affiliates in the sample as of the end of year t. GR Foreign Assets in Panel D equals a firm’s total assets in foreign affiliates (excluding any investment in other affiliates) whose investment in research and development and property, plant and equipment during year t are greater than the median for all affiliates in the sample during year t. All variables are divided by Assets. Estimate of PRE/Assets for Total Foreign Assets equals the coefficient times mean Total Foreign Assets minus the mean of the other variable included in the model (e.g. the mean of TaxDue Foreign Assets). Estimate of PRE/Assets for all other variables equals the mean of the variable of interest times the sum of the coefficient on Total Foreign Assets and the coefficient on the variable of interest. % of PRE equals the percent of PRE explained by foreign assets located in subsidiaries with/without the characteristic of interest. For example, the % of PRE in high tax affiliates is equal to 0.006/(0.006 + 0.0866) = 0.06. The % of PRE in tax due affiliates is 0.0866/(0.006 + 0.0866) = 0.94.

36
TABLE 3 Location of PRE Based on Affiliate Characteristics and FTC Position
Firms in Overall Non-binding FTC Positions N = 3,365
Firms in Overall Binding FTC Positions N = 1,290
Variable Coeff. t-stat
Variable Mean % of PRE Coeff. t-stat
Variable Mean % of PRE
Panel A: Affiliates with Tax Due upon Repatriation Intercept 0.0060 0.73 -0.0056 -0.45 Total Foreign Assets 0.0672 1.11 0.3468 2 0.3078 2.00 0.3020 18 TaxDue Foreign Assets 0.2197 3.15 0.3209 98 -0.0245 -0.14 0.2506 82 R2= 0.3058 0.3234
Panel B: Affiliates Located in Big 7 Havens Intercept 0.0041 0.49 -0.0066 -0.51 Total Foreign Assets 0.2504 10.09 0.3468 78 0.2961 5.68 0.3020 98 B7 Foreign Assets 0.1451 2.19 0.0518 22 -0.1776 -1.25 0.0177 2 R2= 0.3060 0.3271
Panel C: Affiliates with High Currency Volatility Intercept 0.0096 1.21 0.0003 0.03 Total Foreign Assets 0.3332 12.13 0.3468 72 0.3698 5.86 0.3020 79 FX Foreign Assets -0.1742 -4.90 0.1546 28 -0.2343 -3.36 0.1266 21 R2= 0.3241 0.3633
Panel D: High Growth Affiliates Intercept 0.0006 0.07 -0.0110 -0.88 Total Foreign Assets 0.2470 8.55 0.3468 42 0.2194 4.02 0.3020 31 GR Foreign Assets 0.0624 1.72 0.1809 58 0.1356 2.49 0.1754 69 R2= 0.3014 0.3404
Table 3 reports the results of estimating Equation (1) by firms’ overall FTC positions. Non-binding FTC represents firm-year observations where, presuming repatriation of all foreign earnings, the MNC has insufficient FTCs available to reduce its repatriation tax burden to zero. Binding FTC represents firm-year observations where, presuming repatriation of all foreign earnings, the MNC has sufficient FTCs available to eliminate its repatriation tax burden. All other variables are defined in Table 2.

37
TABLE 4 Location of PRE Based on Competing Affiliate Characteristics
Panel A: Full Sample; N = 4,655
Variable Coeff. t-stat Variable Mean Estimate of PRE/Assets
Intercept 0.0025 0.40 Total Foreign Assets 0.2190 2.16 0.3344 TaxDue Foreign Assets 0.0689 0.74 0.3014 0.0868 B7 Foreign Assets 0.1390 2.36 0.0424 0.0152 FX Foreign Assets -0.1805 -5.03 0.1469 0.0057 GR Foreign Assets 0.0959 3.12 0.1794 0.0565 R2 = 0.3492
Panel B: Firms in Overall Non-binding FTC Positions; N = 3,365
Variable Coeff. t-stat Variable Mean Estimate of PRE/Assets
Intercept 0.0069 0.89 Total Foreign Assets 0.1340 2.16 0.3468 TaxDue Foreign Assets 0.1475 2.31 0.3209 0.0903 B7 Foreign Assets 0.1527 2.57 0.0518 0.0149 FX Foreign Assets -0.1628 -4.74 0.1546 -0.0044 GR Foreign Assets 0.0834 2.52 0.1809 0.0393 R2 = 0.3416
Panel C: Firms in Overall Binding FTC Positions; N = 1,290
Variable Coeff. t-stat Variable Mean Estimate of PRE/Assets
Intercept -0.0049 -0.50 Total Foreign Assets 0.3273 2.15 0.3020 TaxDue Foreign Assets -0.0198 -0.14 0.2506 0.0771 B7 Foreign Assets -0.1064 -0.83 0.0177 0.0039 FX Foreign Assets -0.2270 -3.42 0.1266 0.0127 GR Foreign Assets 0.1217 2.24 0.1754 0.0788 R2 = 0.3802
Table 4 reports the results of estimating Equation (2) for the full sample and by firms’ overall FTC positions. Non-binding FTC represents firm-year observations where, presuming repatriation of all foreign earnings, the MNC has insufficient FTCs available to reduce its repatriation tax burden to zero. Binding FTC represents firm-year observations where, presuming repatriation of all foreign earnings, the MNC has sufficient FTCs available to eliminate its repatriation tax burden. All other variables are defined in Table 2.

38
TABLE 5 Location of PRE in Tax Due and Haven Affiliates
Variable Coeff. t-stat Variable Mean Estimate of PRE/Assets % of PRE
Panel A: All Havens Intercept 0.0012 0.16 Total Foreign Assets 0.2705 10.78 0.3344 0.0737 80 Haven Foreign Assets 0.0321 0.61 0.0618 0.0187 20 R2= 0.3070 Panel B: DOT versus Big 7 Havens Intercept -0.0036 -0.52 Total Foreign Assets 0.2832 11.26 0.3344 0.0784 83 DOT Foreign Assets -0.3488 -3.94 0.0152 -0.0010 -1 Big 7 Foreign Assets 0.1258 1.96 0.0424 0.0173 18 R2= 0.3261 Panel C: TaxDue, DOT, and Big 7 Havens Intercept -0.0029 -0.41 Total Foreign Assets 0.2134 2.01 0.3344 0.0070 7 TaxDue Foreign Assets 0.0770 0.70 0.3014 0.0875 82 DOT Foreign Assets -0.3399 -4.01 0.0152 -0.0019 -2 Big 7 Foreign Assets 0.1193 1.90 0.0424 0.0141 13 R2= 0.3278
Table 5 reports the results of estimating Equation (1) using alternative definitions of a tax haven country. Haven Foreign Assets in Panel A equals a firm’s total assets in its affiliates (excluding any investment in other affiliates) operating in a tax haven jurisdictions defined in Hines and Rice (1994) (i.e., Big 7 plus DOT havens). DOT Foreign Assets in Panel B and Panel C equals a firm’s total assets in its affiliates (excluding any investment in other affiliates) operating in small or island haven countries (i.e., Bahamas, Barbados, Bermuda, Belize, Netherlands Antilles, Grenada, UK Islands – Caribbean, St. Kitts and Nevis, UK Islands – Atlantic, Dominica, St. Lucia, St. Vincent and the Grenadines, Anguilla, Antigua and Barbuda, Andorra, Cyprus, Gibralter, Liechtenstein, Luxembourg, Malta, Monaco, Bahrain, Jordan, Macau, Maldives, and Vanuatu and Marshall Islands). All other variables are defined in Table 2.

39
TABLE 6 Asset Composition of PRE
Variable Coeff. t-stat Variable Mean % of PRE Panel A: All Affiliates Intercept 0.0093 1.21 Total Foreign Assets 0.2492 9.66 0.3344 58 Foreign Cash 0.0927 2.00 0.1144 42 R2 = 0.3802
Panel B: Affiliates with Tax Due upon Repatriation Intercept 0.0060 0.77 Non-Cash Foreign Assets 0.2476 2.56 0.2198 6 Foreign Cash 0.0898 0.53 0.1144 1 TaxDue Non-Cash Foreign Assets 0.0180 0.18 0.1975 55 TaxDue Foreign Cash 0.2615 1.39 0.1033 38 R2= 0.3264
Panel C: Affiliates Located in Big 7 Havens Intercept 0.0044 0.58 Non-Cash Foreign Assets 0.2578 9.12 0.2198 53 Foreign Cash 0.2900 6.56 0.1144 29 B7 Non-Cash Foreign Assets 0.1313 1.46 0.0229 9 B7 Foreign Cash 0.1135 1.11 0.0192 8 R2= 0.3283
Panel D: Affiliates with High Currency Volatility Intercept 0.0090 1.29 Non-Cash Foreign Assets 0.3083 9.70 0.2198 43 Foreign Cash 0.4237 7.27 0.1144 30 FX Non-Cash Foreign Assets -0.1464 -3.42 0.0956 17 FX Foreign Cash -0.2614 -3.11 0.0504 9 R2= 0.3520
Panel E: High Growth Affiliates Intercept 0.0068 0.91 Non-Cash Foreign Assets 0.2471 7.31 0.2198 23 Foreign Cash 0.2500 4.96 0.1144 15 GR Non-Cash Foreign Assets 0.0060 0.15 0.1259 32 GR Foreign Cash 0.2827 3.15 0.0534 29 R2= 0.3341
Table 6 Panel A reports the results of estimating Equation (3). Table 6 Panels B-E reports the results of estimating Equation (4). Foreign Cash equals a firm’s total foreign cash assets held by all of its foreign affiliates. Non-cash equals a firm’s total foreign assets held by all of its foreign affiliates other than cash assets (excluding any investment in other affiliates). TaxDue Foreign Cash, B7 Foreign Cash, FX Foreign Cash, and GR Foreign Cash equal a firm’s foreign cash held by its tax due, Big 7 haven, high currency volatility and high growth affiliates, respectively. TaxDue Non-Cash Foreign Assets, B7 Non-Cash Foreign Assets, FX Non-Cash Foreign Assets, and GR Non-Cash Foreign Assets equal a firm’s total non-cash foreign assets held by its tax due, Big 7 haven, high currency volatility and high growth affiliates, respectively. Other variables are defined in Table 2.

40
TABLE 7 Asset Composition of PRE Based on FTC Position
Firms in Overall Non-binding FTC Positions N = 3,365
Firms in Overall Binding FTC Positions N=1,290
Variable Coeff. t-stat Variable
Mean % of PRE
Coeff. t-stat Variable
Mean % of PRE Panel A: All Affiliates Intercept 0.0214 2.21 -0.0110 -0.86 Total Foreign Assets 0.2420 8.42 0.3468 57 0.2676 5.93 0.3021 63 Foreign Cash 0.0929 1.79 0.1223 43 0.0831 0.75 0.0939 37 R2= 0.3000 0.3246 Panel B: Affiliates with Tax Due upon Repatriation Intercept 0.0201 2.15 -0.0167 -1.24 Non-Cash Foreign Assets 0.1244 1.58 0.2240 2 0.3687 2.54 0.2089 15
Foreign Cash -0.0481 -0.38 0.1223 0 0.2616 0.99 0.0939 5 TaxDue Non-Cash Foreign Assets 0.1379 1.59 0.2067 56 -0.0903 -0.59 0.1734 53
TaxDue Foreign Cash 0.4060 2.82 0.1131 42 0.0558 0.18 0.0777 27 R2= 0.3213 0.3510
Panel C: Affiliates Located in Big 7 Havens Intercept 0.0155 1.64 -0.0155 -1.20 Non-Cash Foreign Assets 0.2430 7.91 0.2240 50 0.3013 6.21 0.2089 67
Foreign Cash 0.2799 6.29 0.1223 29 0.3152 2.90 0.0939 30 B7 Non-Cash Foreign Assets 0.1740 1.81 0.0278 12 -0.3181 -1.80 0.0099 0
B7 Foreign Cash 0.1158 1.12 0.0236 10 -0.0343 -0.12 0.0077 2 R2= 0.3211 0.3546

41
TABLE 7 CONT’D
Panel D: Affiliates with High Currency Volatility Intercept 0.0217 2.42 -0.0089 -0.85 Non-Cash Foreign Assets 0.3091 8.86 0.2240 43 0.2902 5.63 0.2089 44
Foreign Cash 0.3831 6.08 0.1223 29 0.6075 4.21 0.0939 40 FX Non-Cash Foreign Assets -0.1662 -3.38 0.0995 16 -0.0801 -1.11 0.0853 22
FX Foreign Cash -0.1704 -1.86 0.0542 13 -0.7146 -3.67 0.0407 -5 R2= 0.3372 0.4108
Panel E: High Growth Affiliates Intercept 0.0193 2.05 -0.0129 -1.05 Non-Cash Foreign Assets 0.2442 7.06 0.2240 24 0.2526 3.78 0.2089 21
Foreign Cash 0.2650 4.83 0.1223 18 0.1323 1.57 0.0939 6 GR Non-Cash Foreign Assets -0.0001 0.00 0.1249 31 0.0131 0.17 0.1283 36
GR Foreign Cash 0.2232 2.42 0.0555 27 0.5837 2.86 0.0479 36 R2= 0.3198 0.3835
Table 7 reports the results of estimating Equations (3) and (4) by firms’ overall FTC position. Non-binding FTC represents firm-year observations where, presuming repatriation of all foreign earnings, the MNC has insufficient FTCs available to reduce its repatriation tax burden to zero. Binding FTC represents firm-year observations where, presuming repatriation of all foreign earnings, the MNC has sufficient FTCs available to eliminate its repatriation tax burden. All other variables are defined in Tables 2 and 6.

42
TABLE 8 Country and Industry Location of PRE
Panel A: Estimated Country Location of PRE
Country Coeff. t-stat Mean PRE % of PRE Mean Cash PRE Cash Tax on PRE Cash
UK 0.2589 5.33 172.63 16 373.23 67.99 13.02 Canada 0.2601 7.74 126.12 12 270.27 9.17 1.30 Netherlands 0.2410 3.62 77.07 7 422.75 43.35 9.40 Ireland 0.4215 4.76 74.94 7 961.13 62.48 16.20 Germany 0.3404 6.97 113.73 11 292.44 34.69 5.80 Belgium 0.3597 8.95 47.36 4 417.08 11.83 2.14 France 0.2740 9.68 65.05 6 147.13 7.64 1.19 Switzerland 0.2114 2.68 41.72 4 281.58 0.00 0.00 Bermuda 0.2575 5.03 11.27 1 948.42 0.00 0.00 Australia 0.1905 2.73 20.66 2 116.68 1.72 0.25 Luxemburg 0.0015 0.03 0.09 0 447.33 0.00 0.00 Japan 0.2948 13.09 49.58 5 159.02 6.70 0.83 Singapore 0.1400 3.21 22.18 2 254.37 1.41 0.33 Italy 0.5237 4.30 56.02 5 139.47 29.96 3.72 Mexico 0.5218 10.58 69.25 6 119.90 21.03 2.96 Hong Kong 0.1262 8.16 16.10 2 109.15 3.23 0.70 Caribbean 0.3195 1.94 14.67 1 453.08 13.25 4.00 Other 0.0904 3.08 88.04 8 553.46 18.43 3.64 R2= 0.5600

43
TABLE 8 CONT’D
Table 8 Panel A reports the results of estimating Equation (5). PRE equals the amount of permanently reinvested earnings reported in a firm’s consolidated SEC 10-K filing at the end of year t. PRE/Assets is PRE scaled by worldwide assets. Each Country is a firm-level variable and equals a firm’s total assets in foreign affiliates (excluding any investment in other affiliates) that operate in that country. Mean PRE equals the country coefficient times the mean foreign assets/worldwide assets for the country times mean worldwide assets. % of PRE is Mean PRE for that country divided by total PRE explained by assets. Mean Cash equals the average cash in the foreign country held by foreign affiliates of U.S. MNCs. PRE Cash equals an estimate of the mean amount of PRE held in cash in each country. Tax on PRE Cash equals an estimate of the mean amount of tax each firm would pay to repatriate the PRE held in cash in each country. Table 8 Panel B reports the results of estimating Equation (6). Each Industry is a firm-level variable and equals a firm’s total assets in foreign affiliates (excluding any investment in other affiliates) that operate in that industry. Mean PRE equals the industry coefficient times the mean foreign assets/worldwide assets for the industry times mean worldwide assets. % of PRE is Mean PRE for that industry divided by total PRE explained by assets. All dollar amounts are in millions.
Panel B: Industry Location of PRE
Industry Coeff. t-stat Mean PRE % of PRE Petroleum 0.2707 5.84 44.31 5 Food 0.3081 5.74 38.30 4 Chemical 0.2427 6.13 94.10 10 Primary & Fabricated Metal Manufacturing 0.3798 9.61 57.46 6 Industrial Machinery and Equipment 0.2387 5.02 78.25 8 Electronic and Other Electric Equipment Manufacturing 0.1462 6.41 79.26 8 Transportation Equipment Manufacturing 0.2457 7.19 38.24 4 Other Manufacturing 0.1327 2.28 95.10 10 Wholesale Trade 0.2365 11.65 171.75 17 Fire 0.1553 4.21 93.46 10 Services 0.1820 5.05 96.71 10 Other 0.2961 9.52 95.43 10 R2= 0.5206


![[PPT]Introduction to Corporate Finance - John Wiley & Sons · Web viewThe IRR assumes intermediate cashflows are reinvested at IRR…NPV assumes they are reinvested at WACC This difference,](https://static.fdocuments.in/doc/165x107/5aefd30e7f8b9a572b8ea789/pptintroduction-to-corporate-finance-john-wiley-sons-viewthe-irr-assumes-intermediate.jpg)