
Where does my data go? Preparation of files for the assessments of IOTC stocks and use of data for...
13
Where does my data go? Preparation of files for the assessments of IOTC stocks and use of data for the assessments of IOTC species Mauritius, 18-20 March 2014 Compliance Workshop: Collection and reporting of Fisheries data to IOTC Sponsored by BOBLME-IOC- SmartFish-IOTC
-
Upload
virgil-walters -
Category
Documents
-
view
219 -
download
0
Transcript of Where does my data go? Preparation of files for the assessments of IOTC stocks and use of data for...
Where does my data go?Preparation of files for the assessments of IOTC stocks and use of data for the assessments of
IOTC species
Mauritius, 18-20 March 2014Compliance Workshop: Collection and reporting of Fisheries data to IOTC
Sponsored by BOBLME-IOC-SmartFish-IOTC

Building blocks of Tuna stock assessments
• Catch-and-effort data• Landed (Nominal) catch (sale slips; sampling)• Discard levels (observers; logbooks)• Effort (logbooks; sampling)• Size/age composition (sampling; tagging)
• Abundance trends• Fishery CPUE (fine-scale operational data from
logbooks)• [Size/age/sex composition (logbooks; sampling;
tagging)]
• Exploitation rates (tagging)
• Life history information• Longevity/natural mortality (tagging; otoliths)• Growth (tagging; otoliths)• Maturation (biological samples)
Spatial and seasonal patterns
Routine Data
Collection
Data Collection
through specific projects
(updated regularly)
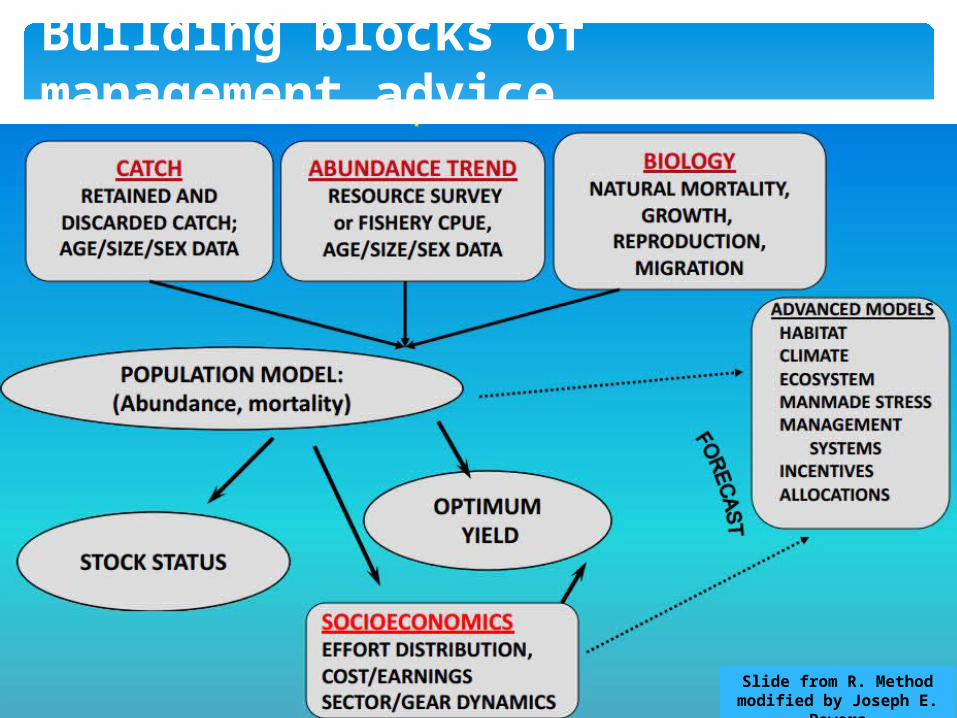
Building blocks of management advice
Slide from R. Method modified by Joseph E.
Powers
Input files prepared for the assessments
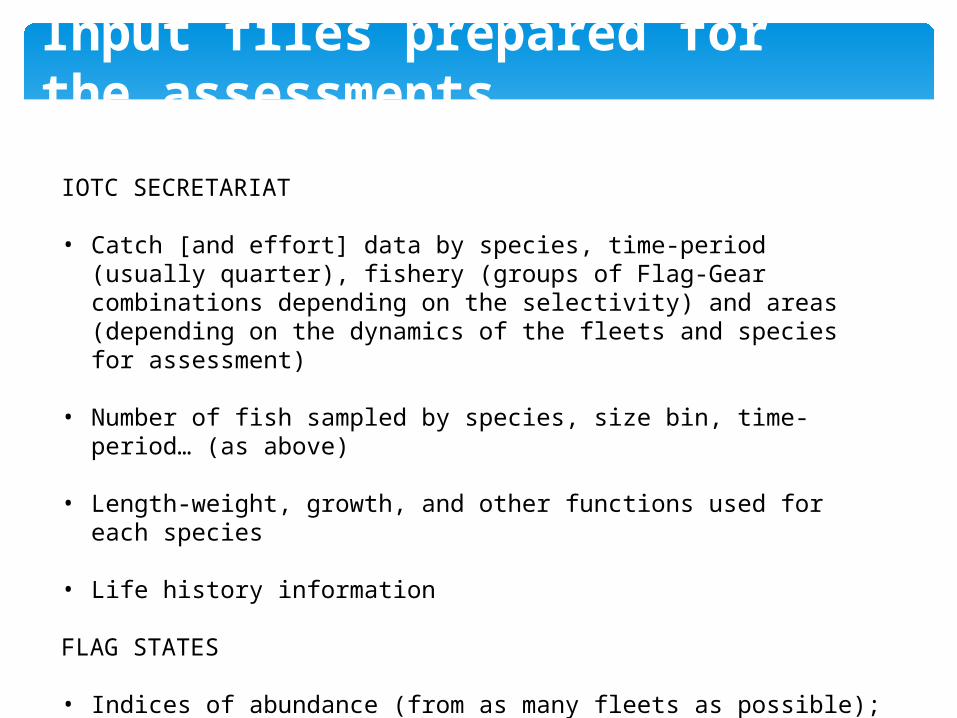
IOTC SECRETARIAT
• Catch [and effort] data by species, time-period (usually quarter), fishery (groups of Flag-Gear combinations depending on the selectivity) and areas (depending on the dynamics of the fleets and species for assessment)
• Number of fish sampled by species, size bin, time-period… (as above)
• Length-weight, growth, and other functions used for each species
• Life history information
FLAG STATES
• Indices of abundance (from as many fleets as possible); estimated using fine-scale operational data (logbooks)
Example of BET input files
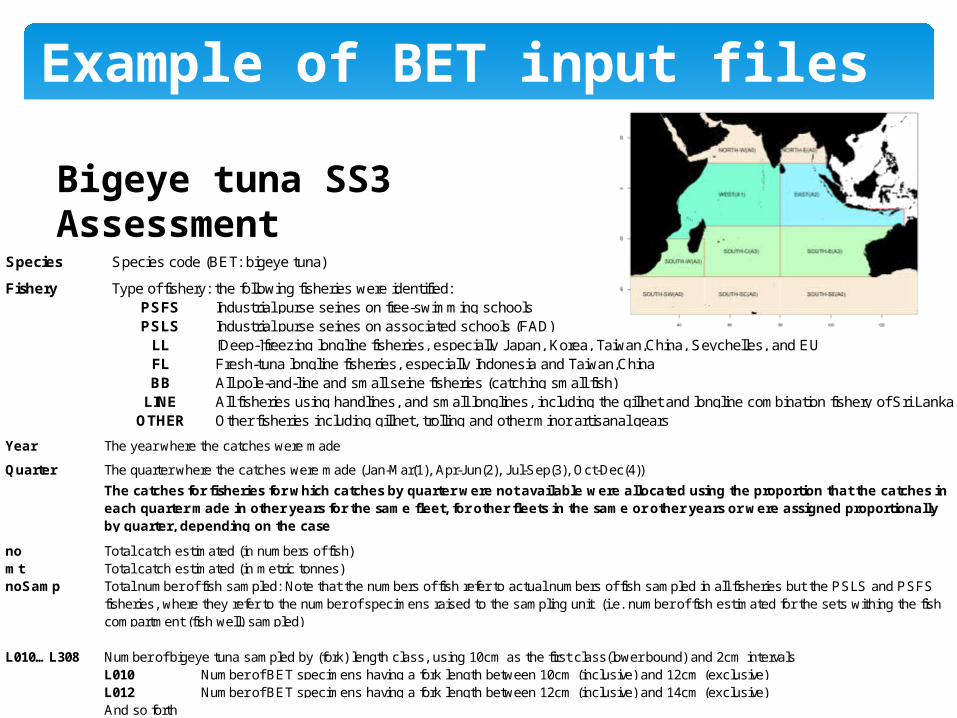
Bigeye tuna SS3 Assessment
Species Species code (BET: bigeye tuna)
Fishery Type of fishery: the following fisheries were identified:PSFS Industrial purse seines on free-swimming schoolsPSLS Industrial purse seines on associated schools (FAD)
LL [Deep-]freezing longline fisheries, especially Japan, Korea, Taiwan,China, Seychelles, and EUFL Fresh-tuna longline fisheries, especially Indonesia and Taiwan,ChinaBB All pole-and-line and small seine fisheries (catching small fish)
LINE All fisheries using handlines, and small longlines, including the gillnet and longline combination fishery of Sri LankaOTHER Other fisheries including gillnet, trolling and other minor artisanal gears
Year The year where the catches were made
Quarter The quarter where the catches were made (Jan-Mar(1), Apr-Jun(2), Jul-Sep(3), Oct-Dec(4))
no Total catch estimated (in numbers of fish)mt Total catch estimated (in metric tonnes)noSamp
L010…L308 Number of bigeye tuna sampled by (fork) length class, using 10cm as the first class(lower bound) and 2cm intervalsL010 Number of BET specimens having a fork length between 10cm (inclusive) and 12cm (exclusive)L012 Number of BET specimens having a fork length between 12cm (inclusive) and 14cm (exclusive)And so forth
The catches for fisheries for which catches by quarter were not available were allocated using the proportion that the catches in each quarter made in other years for the same fleet, for other fleets in the same or other years or were assigned proportionally by quarter, depending on the case
Total number of fish sampled: Note that the numbers of fish refer to actual numbers of fish sampled in all fisheries but the PSLS and PSFS fisheries, where they refer to the number of specimens raised to the sampling unit (i.e. number of fish estimated for the sets withing the fish compartment (fish well) sampled)
Steps in the preparation of datasets
10
SF aggregated per Species, Fleet, Gear Type, Grid and time interval
12
SF data assigned per Species-Fleet-Gear-School Type-Year-Quarter-SF Grid ( EC PS Areas for PS, 10*20 degrees Areas for all
other gears)
11
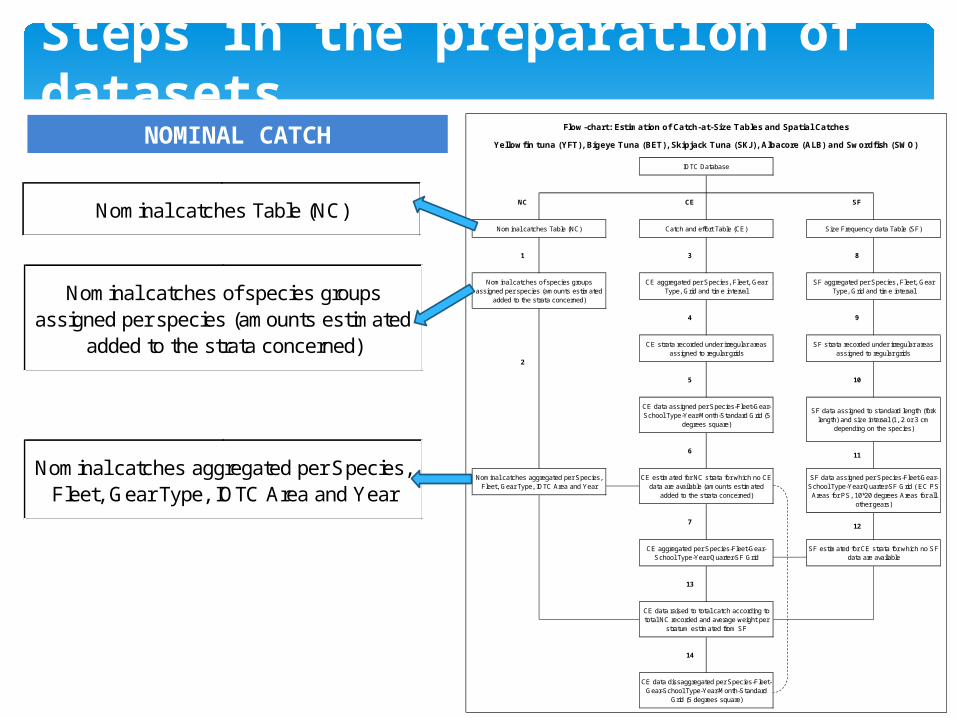
Flow-chart: Estimation of Catch-at-Size Tables and Spatial Catches
Yellowfin tuna (YFT), Bigeye Tuna (BET), Skipjack Tuna (SKJ), Albacore (ALB) and Swordfish (SWO)
SF data assigned to standard length (fork length) and size interval (1, 2 or 3 cm
depending on the species)
Nominal catches of species groups assigned per species (amounts estimated
added to the strata concerned)
Size Frequency data Table (SF)
CE strata recorded under irregular areas assigned to regular grids
5
2
Nominal catches Table (NC)
CE data raised to total catch according to total NC recorded and average weight per
stratum estimated from SF
3
4
SF
1
CE data dissaggregated per Species-Fleet-Gear-School Type-Year-Month-Standard
Grid (5 degrees square)
13
14
CE aggregated per Species-Fleet-Gear-School Type-Year-Quarter-SF Grid
6
7
CE estimated for NC strata for which no CE data are available (amounts estimated
added to the strata concerned)
CE aggregated per Species, Fleet, Gear Type, Grid and time interval
8
9
SF estimated for CE strata for which no SF data are available
SF strata recorded under irregular areas assigned to regular grids
Nominal catches aggregated per Species, Fleet, Gear Type, IOTC Area and Year
IOTC Database
Catch and effort Table (CE)
NC CE
CE data assigned per Species-Fleet-Gear-School Type-Year-Month-Standard Grid (5
degrees square)
NOMINAL CATCH
Nominal catches Table (NC)
Nominal catches of species groups assigned per species (amounts estimated
added to the strata concerned)
Nominal catches aggregated per Species, Fleet, Gear Type, IOTC Area and Year
10
SF aggregated per Species, Fleet, Gear Type, Grid and time interval
12
SF data assigned per Species-Fleet-Gear-School Type-Year-Quarter-SF Grid ( EC PS Areas for PS, 10*20 degrees Areas for all
other gears)
11
Flow-chart: Estimation of Catch-at-Size Tables and Spatial Catches
Yellowfin tuna (YFT), Bigeye Tuna (BET), Skipjack Tuna (SKJ), Albacore (ALB) and Swordfish (SWO)
SF data assigned to standard length (fork length) and size interval (1, 2 or 3 cm
depending on the species)
Nominal catches of species groups assigned per species (amounts estimated
added to the strata concerned)
Size Frequency data Table (SF)
CE strata recorded under irregular areas assigned to regular grids
5
2
Nominal catches Table (NC)
CE data raised to total catch according to total NC recorded and average weight per
stratum estimated from SF
3
4
SF
1
CE data dissaggregated per Species-Fleet-Gear-School Type-Year-Month-Standard
Grid (5 degrees square)
13
14
CE aggregated per Species-Fleet-Gear-School Type-Year-Quarter-SF Grid
6
7
CE estimated for NC strata for which no CE data are available (amounts estimated
added to the strata concerned)
CE aggregated per Species, Fleet, Gear Type, Grid and time interval
8
9
SF estimated for CE strata for which no SF data are available
SF strata recorded under irregular areas assigned to regular grids
Nominal catches aggregated per Species, Fleet, Gear Type, IOTC Area and Year
IOTC Database
Catch and effort Table (CE)
NC CE
CE data assigned per Species-Fleet-Gear-School Type-Year-Month-Standard Grid (5
degrees square)
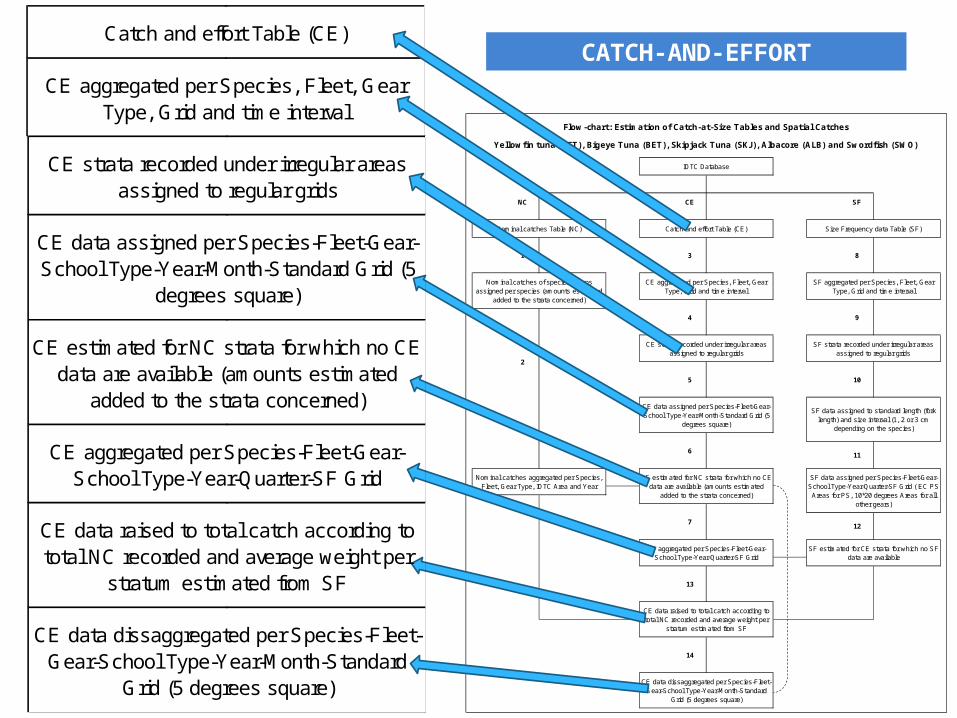
Catch and effort Table (CE)
CE aggregated per Species, Fleet, Gear Type, Grid and time interval
CE strata recorded under irregular areas assigned to regular grids
CE data assigned per Species-Fleet-Gear-School Type-Year-Month-Standard Grid (5
degrees square)
CE estimated for NC strata for which no CE data are available (amounts estimated
added to the strata concerned)
CE aggregated per Species-Fleet-Gear-School Type-Year-Quarter-SF Grid
CE data raised to total catch according to total NC recorded and average weight per
stratum estimated from SF
CE data dissaggregated per Species-Fleet-Gear-School Type-Year-Month-Standard
Grid (5 degrees square)
CATCH-AND-EFFORT
Steps in the preparation of datasets (cont.)
10
SF aggregated per Species, Fleet, Gear Type, Grid and time interval
12
SF data assigned per Species-Fleet-Gear-School Type-Year-Quarter-SF Grid ( EC PS Areas for PS, 10*20 degrees Areas for all
other gears)
11
Flow-chart: Estimation of Catch-at-Size Tables and Spatial Catches
Yellowfin tuna (YFT), Bigeye Tuna (BET), Skipjack Tuna (SKJ), Albacore (ALB) and Swordfish (SWO)
SF data assigned to standard length (fork length) and size interval (1, 2 or 3 cm
depending on the species)
Nominal catches of species groups assigned per species (amounts estimated
added to the strata concerned)
Size Frequency data Table (SF)
CE strata recorded under irregular areas assigned to regular grids
5
2
Nominal catches Table (NC)
CE data raised to total catch according to total NC recorded and average weight per
stratum estimated from SF
3
4
SF
1
CE data dissaggregated per Species-Fleet-Gear-School Type-Year-Month-Standard
Grid (5 degrees square)
13
14
CE aggregated per Species-Fleet-Gear-School Type-Year-Quarter-SF Grid
6
7
CE estimated for NC strata for which no CE data are available (amounts estimated
added to the strata concerned)
CE aggregated per Species, Fleet, Gear Type, Grid and time interval
8
9
SF estimated for CE strata for which no SF data are available
SF strata recorded under irregular areas assigned to regular grids
Nominal catches aggregated per Species, Fleet, Gear Type, IOTC Area and Year
IOTC Database
Catch and effort Table (CE)
NC CE
CE data assigned per Species-Fleet-Gear-School Type-Year-Month-Standard Grid (5
degrees square)
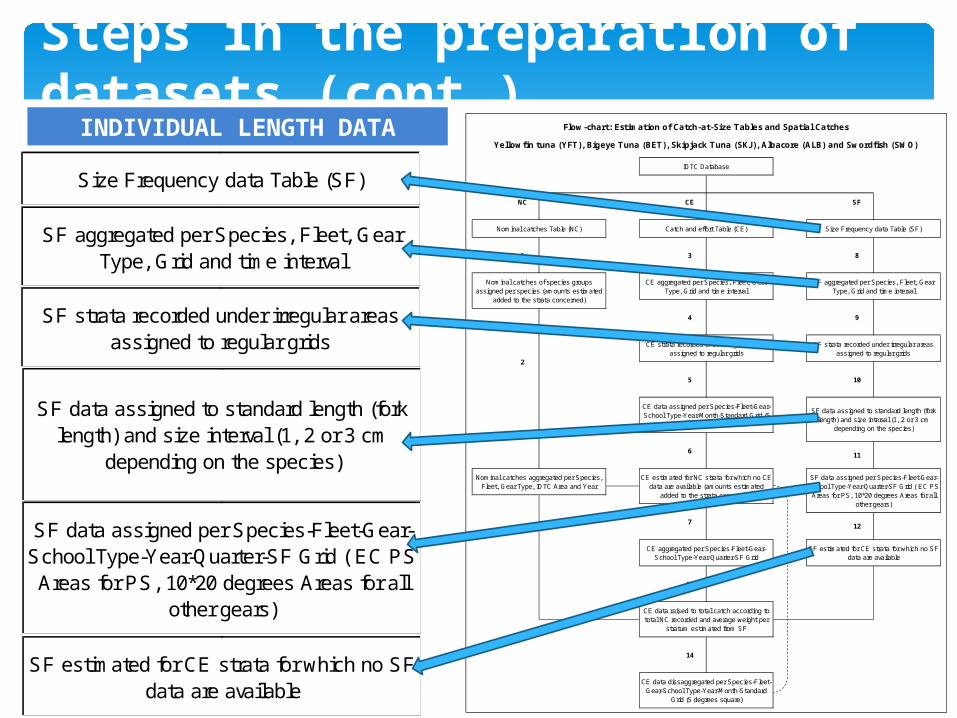
INDIVIDUAL LENGTH DATA
Size Frequency data Table (SF)
SF aggregated per Species, Fleet, Gear Type, Grid and time interval
SF strata recorded under irregular areas assigned to regular grids
SF data assigned to standard length (fork length) and size interval (1, 2 or 3 cm
depending on the species)
SF data assigned per Species-Fleet-Gear-School Type-Year-Quarter-SF Grid ( EC PS Areas for PS, 10*20 degrees Areas for all
other gears)
SF estimated for CE strata for which no SF data are available
-100
-75
-50
-25
0
25
50
75
100
1973
1976
1979
1982
1985
1988
1991
1994
1997
2000
2003
2006
2009
2012
8
6
4
2
0
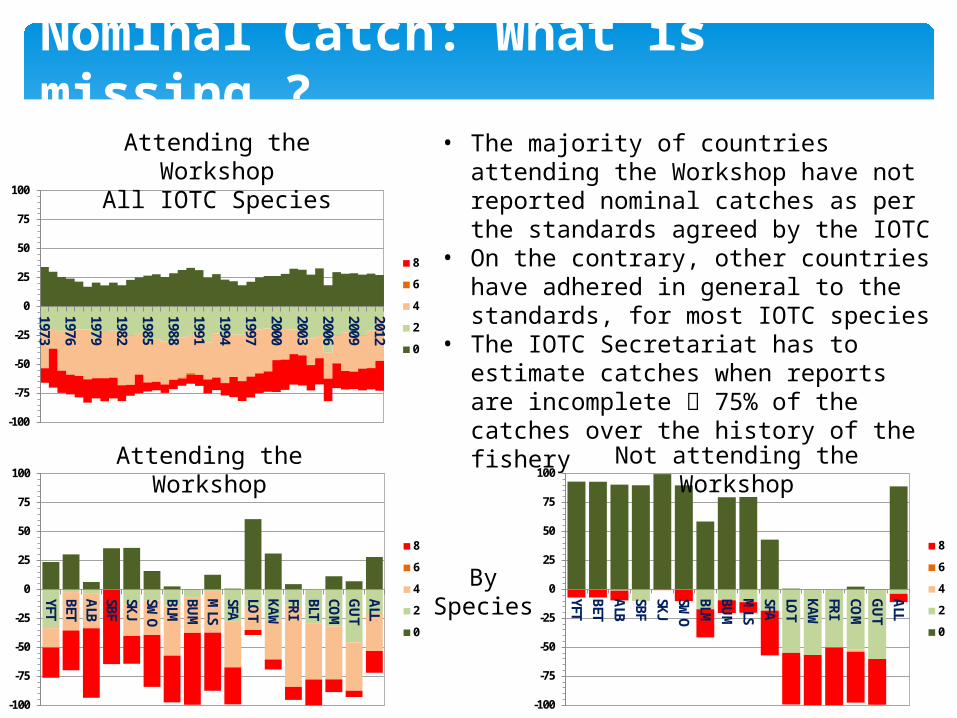
Nominal Catch: What is missing ?
-100
-75
-50
-25
0
25
50
75
100
YFTBETALBSBFSKJSW
OBLMBU
MM
LSSFALO
TKAWFRIBLTCO
MG
UT
ALL
8
6
4
2
0
-100
-75
-50
-25
0
25
50
75
100
YFTBETALBSBFSKJSW
OBLMBU
MM
LSSFALO
TKAWFRICO
MG
UT
ALL
8
6
4
2
0
• The majority of countries attending the Workshop have not reported nominal catches as per the standards agreed by the IOTC
• On the contrary, other countries have adhered in general to the standards, for most IOTC species
• The IOTC Secretariat has to estimate catches when reports are incomplete 75% of the catches over the history of the fishery
Attending the Workshop
Attending the WorkshopAll IOTC Species
Not attending the Workshop
By Species

-100
-75
-50
-25
0
25
50
75
100
YFTBETALBSBFSKJSW
OBLMBU
MM
LSSFALO
TKAWFRICO
MG
UT
ALL
8
6
4
2
0
-100
-75
-50
-25
0
25
50
75
100
YFTBETALBSBFSKJSW
OBLMBU
MM
LSSFALO
TKAWFRIBLTCO
MG
UT
ALL
8
6
4
2
0
Catch-and-Effort: What is missing ?• The majority of countries attending the
Workshop have not reported catch-and-effort data at all (red)
• Where reported, catch and effort is not by the standards in most cases (light green)
• On the contrary, levels of reporting for other countries are higher with data reported by the standards in most cases
• Levels of reporting have only slightly improved over time and remain very low
Attending the Workshop Not attending the Workshop
By Species
-100
-75
-50
-25
0
25
50
75
100
1973
1976
1979
1982
1985
1988
1991
1994
1997
2000
2003
2006
2009
2012
8
6
4
2
0
Attending the WorkshopAll IOTC Species
-100
-75
-50
-25
0
25
50
75
100
YFTBETALBSBFSKJSW
OBLMBU
MM
LSSFALO
TKAWFRICO
MG
UT
ALL
8
6
4
2
0
-100
-75
-50
-25
0
25
50
75
100
YFTBETALBSBFSKJSW
OBLMBU
MM
LSSFALO
TKAWFRIBLTCO
MG
UT
ALL
8
6
4
2
0
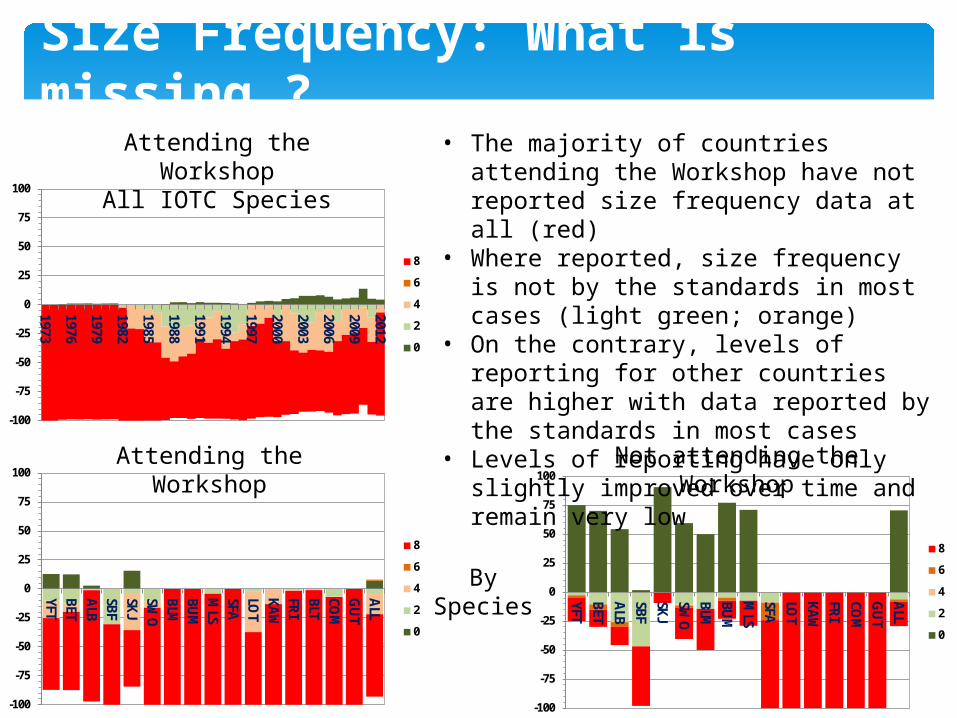
Size Frequency: What is missing ?• The majority of countries attending the
Workshop have not reported size frequency data at all (red)
• Where reported, size frequency is not by the standards in most cases (light green; orange)
• On the contrary, levels of reporting for other countries are higher with data reported by the standards in most cases
• Levels of reporting have only slightly improved over time and remain very low
Attending the Workshop Not attending the Workshop
By Species
-100
-75
-50
-25
0
25
50
75
100
1973
1976
1979
1982
1985
1988
1991
1994
1997
2000
2003
2006
2009
2012
8
6
4
2
0
Attending the WorkshopAll IOTC Species

Conclusion
The quality of the management advice depends on the quality of the data that
feeds the assessment and the uncertainty associated to the results;
If data completeness and quality does not improve we have to live with what we have and take more conservative actions to ensure that IOTC stocks are
safe
THANK YOU FOR
YOUR ATTENTION
Mauritius, 18-20 March 2014Compliance Workshop: Collection and reporting of Fisheries data to IOTC
Sponsored by BOBLME-IOC-SmartFish-IOTC
www.iotc.org


![IOTC-2010-S14-CoC17-Add1[E] -FLEET DEVELOPMENT PLANS](https://static.fdocuments.in/doc/165x107/6256a751b3b41667710c2012/iotc-2010-s14-coc17-add1e-fleet-development-plans.jpg)

![IOTC-2013-CoC10-09[E] - Summary report on Compliance ...](https://static.fdocuments.in/doc/165x107/61c1040e8e517a15db6ce0a1/iotc-2013-coc10-09e-summary-report-on-compliance-.jpg)
![PROGRESS REPORT OF THE IOTC SECRETARIAT: …3€“2017–SCAF14–03[E] Page 1 of 15 PROGRESS REPORT OF THE IOTC SECRETARIAT: 2016 Submitted by: IOTC Secretariat, Last updated: 8](https://static.fdocuments.in/doc/165x107/5adc6b8d7f8b9aa5088b7f13/progress-report-of-the-iotc-secretariat-3-2017scaf1403e-page-1-of.jpg)


![IOTC-2019-CoC16-CR22 [E/F] IOTC Compliance Report for ...](https://static.fdocuments.in/doc/165x107/6214caf0ffbb9d3c4c0d3d74/iotc-2019-coc16-cr22-ef-iotc-compliance-report-for-.jpg)
![IOTC-2019-S23-PropC[E] PROPOSAL ON ESTABLISHING A ...](https://static.fdocuments.in/doc/165x107/61eb4489da85421c764a71bd/iotc-2019-s23-propce-proposal-on-establishing-a-.jpg)