Where Desert Meets Technology: Findings from ICT in...
139
ADB TA No. 6278-REG Contract No: COCS/60-026 RTI Project No 0210103 Innovative Information and Communication Technology in Education and Its Potential for Reducing Poverty in the Asia and Pacific Region Where Desert Meets Technology: Findings from ICT in Education Initiatives in Rural Schools in Mongolia December 2007 Appendix 8 of Final Report Carmen Strigel Lkhagvasuren Ariunaa Sukhbaatar Enkhjargal
Transcript of Where Desert Meets Technology: Findings from ICT in...

ADB TA No. 6278-REG Contract No: COCS/60-026 RTI Project No 0210103
Innovative Information and Communication Technology in Education and Its Potential for Reducing Poverty in the Asia and Pacific Region
Where Desert Meets Technology: Findings from ICT in Education Initiatives in Rural Schools in Mongolia
December 2007
Appendix 8 of Final Report
Carmen Strigel Lkhagvasuren Ariunaa Sukhbaatar Enkhjargal
Project Number: TA No. 6278-REG December 2007 Appendix 8 of Final Report
Mongolia: Innovative Information and Communication Technology in Education and Its Potential for Reducing Poverty in the Asia and Pacific Region: “Where Desert Meets Technology: Findings from ICT in Education Initiatives in Rural Schools in Mongolia” (Financed by the Poverty Reduction Cooperation Fund, Asian Development Bank) Prepared by Carmen Strigel Lkhagvasuren Ariunaa Sukhbaatar Enkhjargal RTI International 3040 Cornwallis Road Research Triangle Park, NC 27709-2194 USA For Asian Development Bank ATTN: Jouko Sarvi Principal Education Specialist Capacity Development and Governance Division Regional and Sustainable Development Department 6 ADB Avenue, Mandaluyong City 1550 Metro Manila, Philippines RTI International is a trade name of Research Triangle Institute.
Technical Assistance Consultant’s Report
This consultant’s report does not necessarily reflect the views of ADB or the Governments concerned, and ADB and the Governments cannot be held liable for its contents.

iii
CONTENTS
Page
I. EXECUTIVE SUMMARY .....................................................................................................1 A. Background of the Study ...........................................................................................1 B. Study Findings ...........................................................................................................2 C. Recommendations.....................................................................................................4
II. COUNTRY CONTEXT .........................................................................................................6
III. EDUCATION SYSTEM CONTEXT ......................................................................................8 A. General Aspects ........................................................................................................8 B. Teacher Development .............................................................................................12 C. Education Administration .........................................................................................13 D. Current Status of ICT in Education ..........................................................................15
IV. SEDP AND IIREM PROJECTS OVERVIEW .....................................................................18 A. Second Education Development Project .................................................................18 B. ICT for Innovating Rural Education in Mongolia ......................................................19
V. STUDY ACTIVITIES ..........................................................................................................24 A. Study Overview........................................................................................................24 B. Training and Equipment Procurement .....................................................................25
VI. STUDY SCHOOLS CONTEXT ..........................................................................................29 A. IIREM Schools .........................................................................................................29 B. SEDP Schools .........................................................................................................31 C. Control Schools .......................................................................................................32
VII. STUDY METHODOLOGY..................................................................................................33 A. Research Design .....................................................................................................33 B. School Selection ......................................................................................................34 C. Participant Selection ................................................................................................35 D. Instruments ..............................................................................................................36 E. Limitations of the Study............................................................................................38
VIII. STUDY FINDINGS AND DISCUSSION.............................................................................39 A. Overview of Data Analysis .......................................................................................39 B. Overview of the Respondents..................................................................................40 C. Findings on Research Question 1............................................................................41
1. Teacher Pedagogical Support ........................................................................ 41 2. Teaching Practice and Evaluation/Assessment .............................................. 42 3. Teacher Efficacy ............................................................................................. 49 4. Teacher Lesson Planning and Material Production ........................................ 52 5. Teacher Collaboration..................................................................................... 55 6. Teacher Job Satisfaction and Attendance ...................................................... 58 7. Teacher Use of Equipment and Materials....................................................... 62
D. ICT-Related Dimensions..........................................................................................71

iv
1. ICT Environment ............................................................................................. 71 2. Reported Access to ICT.................................................................................. 76 3. Purpose of Computer Use and Source of Capacity ........................................ 80 4. Policies and Strategies at the School ............................................................. 82 5. Resources and Guidance on ICT.................................................................... 84 6. Attitude Toward ICT ........................................................................................ 85 7. Teachers’ Levels of Technology Adoption ...................................................... 94 8. School System Support of ICT........................................................................ 98 9. School ICT Financing, Servicing, and Procurement ....................................... 99 10. Parent Engagement and ICT ........................................................................ 101
E. Findings on Research Question 2..........................................................................102 1. Findings from Questionnaires and Focus Groups......................................... 102 2. Discussion of Findings .................................................................................. 107
IX. STUDY CONCLUSIONS AND RECOMMENDATIONS...................................................109 A. Conclusions Related to Research Question 1 .......................................................109 B. Overview of ICT-Related Aspects..........................................................................111 C. Conclusions Related to Research Question 2 .......................................................115 D. Recommendations for Future Research................................................................116 E. Recommendations for Future ICT in Education Initiatives.....................................116 F. Synthesis ...............................................................................................................118
X. REFERENCES.................................................................................................................121
XI. AUTHORS........................................................................................................................124
APPENDIX 1: MONGOLIA’S PROGRESS TOWARD ACHIEVING THE MILLENNIUM DEVELOPMENT GOALS.................................................................................................126
APPENDIX 2: LITERATURE REVIEW ON ICT IN EDUCATION IN MONGOLIA ...................128
List of Exhibits
Exhibit 1. Structure of the Mongolian Education System .............................................................9 Exhibit 2. Objectives of the Master Plan to Develop Education of Mongolia in 2006–
2015 ....................................................................................................................11 Exhibit 3. Location of Study Schools in Mongolia ......................................................................30 Exhibit 4. Mongolia – School Sample and Respondents Overview ...........................................37 Exhibit 5. Teachers’ Responses to “The whole class repeats sentences that I say first”...........43 Exhibit 6. Teachers’ Responses to “Students explain how they have gone about solving
a problem” ...........................................................................................................44 Exhibit 7. Teachers’ Responses to Question of How They Use Results of Student
Assessments .......................................................................................................45 Exhibit 8. Teachers’ Responses to “How much can you use a variety of assessment
strategies?”..........................................................................................................46

v
Exhibit 9. Teachers’ Responses to “The procedures for teacher performance evaluation are satisfactory” ...................................................................................................47
Exhibit 10. Teachers’ Responses to “How much can you do to motivate students who show low interest in school work?” ......................................................................50
Exhibit 11. Teachers’ Responses to “To what extent can you craft good questions for your students?”....................................................................................................50
Exhibit 12. Teachers’ Responses to “How much can you do to control disruptive behavior in the classroom?” ................................................................................51
Exhibit 13. Teachers’ Responses on Time Spent on Lesson Planning per Week .....................52 Exhibit 14. Exemplary Use of Visual Aids in a Mathematics Class............................................53 Exhibit 15. Teachers’ Responses to “How many hours per month do you, on average,
work together with other teachers on education-related issues?” .......................56 Exhibit 16. Teachers’ Responses to “What are the three activities you most often do
together with other teachers?”.............................................................................57 Exhibit 17. Teachers’ Responses to “I could not imagine doing another job” ............................59 Exhibit 18. Teachers’ Responses to the Statement “This school is very dynamic; I have
lots of opportunities to bring myself in” ................................................................60 Exhibit 19. Teachers’ Responses to “This school receives good support from the
community” ..........................................................................................................60 Exhibit 20. Training Managers’ Assessment of Their Teachers’ Attendance.............................61 Exhibit 21. Students’ Responses to How Often Their Teachers Use Science Models in
Their Classes ......................................................................................................64 Exhibit 22. Teachers’ Responses to “How often do you use a computer in your
classroom teaching?” ..........................................................................................64 Exhibit 23. Students’ Responses to “How often does your teacher use a computer in
class?” .................................................................................................................65 Exhibit 24. Students’ Assessment of Their Teachers’ Ability to Manage Transitions and
Technology Use in Classroom Teaching.............................................................66 Exhibit 25. Teachers’ Responses on the Availability and Use of Cassette or CD Players
in Classroom Teaching........................................................................................67 Exhibit 26. Teachers’ Responses on the Availability and Use of TVs in Classroom
Teaching..............................................................................................................68 Exhibit 27. Teachers’ Responses on the Availability and Use of Radios in Classroom
Teaching..............................................................................................................68 Exhibit 28. Diesel Generator Provided to Selected Schools under IIREM.................................72 Exhibit 29. All Principals’ Estimate of Number of Computers and Functioning Computers
in Their Schools...................................................................................................73 Exhibit 30. Principals’ Technology Inventory at Their Schools ..................................................75 Exhibit 31. Teachers’ Responses to the Question “Where do you use a computer for
your work?”..........................................................................................................77

vi
Exhibit 32. Students’ Responses to Where They Access Computers .......................................78 Exhibit 33. Teachers’ Responses on What They Use Computers For.......................................80 Exhibit 34. Students’ Responses Concerning the Purpose for Which They Use a
Computer.............................................................................................................81 Exhibit 35. Teachers’ Responses to the Statement “I feel confident using technology in
my teaching”........................................................................................................86 Exhibit 36. Teachers’ Responses to the Statement “I believe ICT offers new
opportunities for professional development”........................................................87 Exhibit 37. Teachers’ Responses to “I think there are health risks to exposing students
and myself to computers” ....................................................................................87 Exhibit 38. Teachers’ Responses to the Statement “I think ICT is too costly to be a valid
tool in education” .................................................................................................88 Exhibit 39. Students’ Responses to “I enjoy doing things on a computer” .................................91 Exhibit 40. Students’ Responses to “I will be able to get a good job if I learn how to
use a computer” ..................................................................................................92 Exhibit 41. Teachers’ Self-Reported Level of Technology Adoption..........................................94 Exhibit 42. Road to Jinst ..........................................................................................................103 Exhibit 43. Challenges of Isolation...........................................................................................103 Exhibit 44. Telecommunications Office in Buutsagaan............................................................104 Exhibit 45. Soum School Library..............................................................................................105 Exhibit 46. Soum School Hallway ............................................................................................105 Exhibit 47. Drivers and Barriers to Effective ICT Integration into Teaching and Learning ......113
vii
Abbreviations
ADB Asian Development Bank APDIP Asia–Pacific Development Information Programme DANIDA Danish International Development Assistance DMC developing member country ECD Education and Culture Department (Mongolia) ESDP Education Sector Development Program GDP gross domestic product HDI human development index HIES Household Independent Expenditure Survey ICT information and communication technology IDRC International Development Research Center of Canada iEARN International Education and Resource Network IRB Institutional Review Board IIREM ICT for Innovating Rural Education in Mongolia IT information technology JICA Japan International Cooperation Agency LCD liquid crystal display LSMS Living Standard Measurement Survey MCC Millennium Challenge Corporation MDG Millennium Development Goal MECS Ministry of Education, Culture and Science (Mongolia) MFOS Mongolian Foundation for Open Society MIDAS Mongolian Information Development Application Scheme MNT Mongolian togrog (monetary unit) MUST Mongolian University of Science and Technology NGO nongovernmental organization NSO National Statistical Office RETA Regional Technical Assistance RTI Research Triangle Institute SEDP Second Education Development Project (Mongolia) SOP standard operating procedure SWOT strengths, weaknesses, opportunities, threats TVET technical and vocational education and training TEDP Third Education Development Project (Mongolia) TOT trainer of trainers UNDP United Nations Development Programme UNESCO United Nations Educational, Scientific and Cultural Organization UPS uninterruptible power supply

viii
Acknowledgments
In completing this study, we were greatly assisted by many in Mongolia and elsewhere, whose support we would like to acknowledge here. We thank:
Mr. Batbold, Director, General Education Department; and Mr. Bandii, Director, Project Management Unit, Second Education Development Project (SEDP), Ministry of Education, Culture and Science
Mr. Batjargal, General Director, National Information Technology Park
Mr. Batsukh, Director, Education and Culture Department, Bayankhongor; and Mrs. Tsevelmaa, Mr. Jambaldorj, and Mr. Batbajar
All principals, training managers, teachers, students, and parents from the 12 participating schools—most notably, the principals of School No. 2 and School No.1, Mr. Tsend-Auysh and Mr. Enkhbayar; and the training manager of School No. 2, Mr. Tseren, for their organizational contributions and support to trainings under this study
The trainer team for this study, Mr. Amarjargal, Mr.Ya. Erkhembayar, Mr. E. Munkhbat, and Ms. Nyamaa, as well as driver-technician and photographer Mr. Sh. Erdenepurev
The ICT for Innovating Rural Education in Mongolia (IIREM) project team, especially Ms. Ayush, who also served as translator for the international team under this study
The ADB staff in Manila and in the Mongolia Resident Mission for their support in the implementation of this study.

I. EXECUTIVE SUMMARY
A. Background of the Study 1. With the aim of providing developing member countries (DMCs) with better guidance for using information and communication technology (ICT) effectively in education, the Asian Development Bank (ADB) funded a 21-month Regional Technical Assistance (RETA) in Bangladesh, Nepal, Mongolia, and Samoa. The RETA researched approaches to using ICT in education that succeed in improving teaching and learning and also are sustainable given the region’s development challenges. The study was implemented by RTI International in partnership with iEARN-USA. Titled “Innovative Information and Communication Technology in Education and Its Potential for Reducing Poverty in Asia and the Pacific Region,”1 the program commenced in April 2006. Study findings from all four countries were shared at an International ICT for Education Conference that took place 16–18 October 2007 at ADB headquarters in Manila, Philippines.
2. The study’s aims were (i) to highlight promising models of ICT integration and best practices, (ii) to identify drivers and barriers to successful ICT integration, and (iii) to share lessons learned, with a specific focus on rural and remote areas. The study combined policy analysis, program evaluation, and small-scale activities. Countries were chosen by ADB, based on geographic and demographic characteristics, provided their perspectives and country context. The study linked with existing education projects in each of the four participating countries that already featured ICT elements. The RETA was structured along three technical components:
(i) Policy and strategy component (regional), (ii) e-Resources component (Mongolia and Samoa), and (iii) e-Teacher Training component (Nepal and Bangladesh).
3. In Mongolia, specifically, the study was to piggyback onto the ADB-funded ICT for Innovating Rural Education in Mongolia (IIREM) project (2004–2006), and the Second Education Development Project (SEDP; 2002–2007), described in more detail in Chapter IV below; and to implement study components (i) Policy and Strategy and (ii) e-Resources. In this context, the study as such was not an extension or follow-on for either IIREM or SEDP, but rather focused on strengthening and complementing investments already made, while studying the existing approaches and lessons learned.
4. With this goal in mind, the study team conducted a number of activities in Mongolia, guided by a site assessment and needs analysis. These included (i) a 1-week intensive training program for teachers and training managers, as well as representatives from the Education and Culture Department (ECD), in August 2006; (ii) moderate procurement of equipment and software for SEDP schools; (iii) 2-day follow-on training interventions at each IIREM and SEDP school in the study, in October 2006; and (iv) a 4-day training for trainers with 3-day follow-on regional trainings, in April 2007. Applying a three-group research design, 12 schools were sampled for participation in the study: four schools that had participated in the IIREM project, four schools that received computer equipment under SEDP, and four schools that were sampled as control schools. The control schools had not participated in either IIREM or SEDP or in activities organized under this study until data collection took place. Study activities are described in more detail in Chapter V below. 1 Referred to as “the study” from here forward.

2
B. Study Findings 5. Following study activities, data were collected in each of the 12 participating schools including a total of 57 teachers, 13 training managers,2 11 principals, and 125 students. In addition, the study included 71 parents, 70, students and 70 teachers in focus group discussions, to address the following two main research questions:
(1) Are there differences to be noted on indicators of teaching quality in schools that featured an e-resources initiative compared to schools that did not?
(2) Do e-resources address specific needs or challenges of rural/remote schools?
6. Concerning Research Question 1, a number of indicator dimensions of teaching quality have been investigated, including (i) teacher pedagogical support, (ii), teaching practice and evaluation/assessment, (iii) teacher efficacy, (iv) teacher lesson planning and material production, (v) teacher collaboration, (vi) teacher job satisfaction and attendance, and (vii) access and use of equipment and materials. Data were compared between the two implementation groups (IIREM and SEDP) and the control group, as well as just between the two implementation groups. The following key findings were derived from data analysis:
• Classroom observations take place more often in schools that participated in e-resources initiatives than in schools that did not.
• Teachers in schools that participated in e-resources initiatives are more satisfied with the procedures for teacher performance evaluation than teachers in schools that did not.
• Teachers in schools that participated in e-resources initiatives use visual aids more often in their teaching than teachers in schools that did not.
• Teachers in schools that participated in e-resources initiatives spend considerably less money on materials to produce teaching and learning aids than their peers in schools that did not participate in such initiatives.
• Teachers in schools that participated in e-resources initiatives are considerably more capable of preparing electronic teaching and learning aids than those in schools that did not.
• Teachers in schools that participated in e-resources initiatives spend considerably more time working with each other on education-related issues than those in schools that did not.
• Teachers in schools that participated in e-resources initiatives exchange teaching and learning materials more often with their peers than those in schools that did not.
• Teachers in schools that participated in e-resources initiatives are more likely to engage in collaboration and exchange with teachers in other schools than those in schools that did not.
2 Training managers are deputy principals with the responsibility of being the pedagogical leader at schools.

3
• Teachers in schools that participated in e-resources initiatives are significantly more satisfied with their jobs compared to teachers in schools that did not.
• Teachers in schools that participated in e-resources initiatives make use considerably more often of a variety of equipment and materials in their teaching (library books, cassette recorders, science models, TV, computers, and educational software) than teachers in schools that did not.
• There were no significant differences on any of the dimensions under investigation between the two implementation groups (IIREM and SEDP).
7. In conclusion, regarding Research Question 1, therefore, study outcomes indicate that there are indeed differences to be noted on teaching quality between schools that participated in e-resources initiatives and schools that did not. On some dimensions, teachers from schools that participated in e-resources initiatives showed more positive results than their peers (teacher collaboration, teacher job satisfaction and teacher use of equipment and materials), while on others there were no significant differences (teaching practice, teacher efficacy). However, on none of the dimensions did teachers from control schools show significantly more positive results. Therefore, there is good reason to believe that the e-resources initiatives under investigation have had a positive impact on teaching quality.
8. Complementing research on these dimensions of teaching quality, specific ICT-related dimensions have been investigated at the school level. Such dimensions include issues of the ICT environment, access to ICT, financing and procurement related to ICT, resources and guidance on ICT, policies and strategies related to ICT, and attitudes to ICT. On the basis of the results from research question one and this analysis, a list of drivers and barriers to effective ICT integration at the teacher level, school level, and system level has been drawn up. For an overview of drivers and barriers, see Exhibit 47 in Section IX.B, Overview of ICT-Related Aspects.
9. In addressing Research Question 2, study participants identified the following challenges facing their schools in their rural and remote locations,
• Lack of electricity and appropriate infrastructure
• Lack of information and communication
• Lack of teaching and learning materials
• Inadequate learning environment
• Insufficient professional staff and teacher capacity
• Lack of community and parent engagement
10. Study findings show that e-resources can positively affect a number of these challenges, most notably the lack of information, lack of teaching and learning materials, and insufficiency in teacher capacity.
11. In conclusion, regarding Research Question 2, study outcomes indicate that e-resources can address challenges of rural schools such as lack of teaching and learning materials and lack of information. The value of e-resources, just in the form of providing schools with

4
electronic teaching and learning aids and educational software, however, can be dramatically increased when provision of such materials is accompanied by (i) familiarization with the resources, (ii) training on using a computer to make them work, (iii) access to appropriate equipment for their use, and (iv) models of e-resource integration with instructional practices. As was clearly the case with the control schools in the study, without such accompanying elements, the resources are not being used as tools for teaching and learning in the classroom, nor as tools for self-study and professional development. Embedded in systemic and holistic initiatives, however, such as those under investigation in this study, e-resources have the potential to contribute to addressing a variety of challenges for remote rural schools in Mongolia. These include teacher capacity, the learning environment, and student motivation.
12. Findings and conclusions to both research questions considered together, coupled with the lack of any significant differences between the IIREM and SEDP groups in the study on any of the indicators investigated, indicate that the design and implementation of the activities under this study were successful in bringing about positive change on teaching quality. Building on lessons learned under IIREM, and the momentum this project created, the combination of equipment package, professional development, and education system support was shown to be successful. The equipment package provided under this study, modeled on IIREM, was moderate: one laptop, one liquid crystal display (LCD) projector and one digital camera per school. The professional development program was integrated and phased, and while building basic computer skills, focused on the pedagogic integration of ICT into classroom teaching. The professional development approach featured direct training of a number of champion teachers at the school level, who then acted as multipliers (or school-based training units) for their peers. Professional development was organized as intensive off-site activities blended with regional and school-based interventions. Including training managers, the pedagogical leaders at the school level, and representatives of the Education and Culture Department,3 in all activities also showed to be critical. Capacity building for these actors focused on the organizational integration of ICT into school management and pedagogical leadership and support, and thereby complemented investments at the teacher level.
13. Detailed findings are presented in Chapter VIII.
C. Recommendations 14. Based on the study findings and conclusions, recommendations for future research—but also for future activities in areas of ICT and education—are being made. Key among them are:
• Future efforts should build on the momentum that pilot initiatives such as IIREM have generated, in framing ICT integration as a discussion about educational development objectives with specific pedagogic goals, rather than as a discussion about technology.
• Equipment packages such as the one provided under IIREM (a package consisting of one laptop, one projector, and one digital camera), which have proven to affect teaching quality, should be promoted.
• Basic computer skills are critical to build the necessary familiarization and rapport between teachers and technology, a precondition for ICT use in classroom teaching and other purposes. However, integrating computer skills training from the outset with explicit models for ICT use in teaching and learning seems to be more appropriate than isolating computer skills training from teachers’ daily needs and practices. Professional
3 The ECDs are branches of the Ministry of Education, Culture and Science (MECS) that serve at the regional level.

5
development under future initiatives, as well as in formal pre-service and in-service training programs, needs to focus more deeply on the relationships among pedagogy, curriculum, and technology.
• Future initiatives need to acknowledge and strengthen the role of training managers as pedagogical leaders at their schools. Training managers need to have the capacity to function as role models for their teachers, to give methodological feedback on effective integration of ICT to enhance student learning, and to train teachers in this regard. At the same time, they need the capacity to link elements of student assessment, instructional practice, and teacher evaluation. Investments done under this study in this area need to be strengthened and scaled up to other schools.
• More appropriate solutions for hardware maintenance and servicing have to be found, especially in soum4 schools. Given an increased focus on technical and vocational education and training (TVET) in upcoming education reform approaches, such as under the Third Education Development Project (TEDP) and the proposed activities supported by the Millennium Challenge Corporation (MCC), there may be a possible opportunity for public-public partnership in this regard and for strengthening of regional capacity in areas of computer repair, networking, and maintenance. In addition, alternative models need to be explored.
• A specific recommendation is to strengthen investments already made and to maximize existing capacity in the IIREM and SEDP schools that participated in this study. It would be critical to provide these schools with one or two more laptop computers each to increase access to appropriate technologies for teachers, so that use of ICT in teaching and learning can take place more frequently. This would allow these schools to continue being frontrunners in innovating teaching practice with ICT.
15. This report acknowledges the many factors that influence the teaching and learning environment in schools and the effectiveness of ICT-in-education initiatives. The report therefore aims to provide a comprehensive picture of the environment in which those initiatives took place, including country context (Chapter II) and education system context (Chapter III). It also contains an overview of the ICT inputs—the specific activities and provisions made under IIREM, SEDP (Chapter IV), and this study (Chapter V)—and gives some contextual information for each participating school in Chapter VI. Chapter VII is an overview of the study methodology applied, and as indicated above, in Chapter VIII, the report outlines and discusses the findings from the study. This is followed by Chapter IX, an elaboration of the conclusions and recommendations for future research that are listed immediately above. The recommendations are followed in the same chapter by a synthesis of the applicability of lessons learned and recommendations in a regional context, and an overview of knowledge this study adds to existing experiences on ICT in education in the country. The report ends with a complete list of references, some information about the authors of this report, a reference copy of the 2006 Millennium Development Goals for Mongolia, and a more detailed literature review on ICT in education in Mongolia.
4 A soum is a subnational administrative unit.

6
II. COUNTRY CONTEXT
16. Mongolia is a landlocked country, located between the People’s Republic of China and Russia. It has a territory of 1.5 million square kilometers and a population of 2.8 million. The population of the country is widely dispersed, with about 41% residing in the rural areas, 37% residing in the capital city of Ulaanbaatar, and the remaining 22% living in the smaller towns of Darkhan, Erdenet, and Baganuur. Mongolia’s administrative territorial system features 21 aimags, 336 soums, and over 1,500 baghs.5
17. Mongolian (Khalkha Mongolian) is the dominant national language of Mongolia, spoken by 90% of the population.6 Mongolian uses Cyrillic script. In addition to a variety of dialects, there are also other languages spoken in Mongolia, including the Kazakh and Tuvan languages in the western part of the country.
18. The gross domestic product (GDP) of Mongolia in purchasing power parity (as opposed to direct currency conversion) per capita was $2,056 in 2004.7 The share of official development assistance of GDP in 2007 was 21.7%, which makes Mongolia one of the most aid-dependent countries in the world. With a human development index (HDI) of 0.691, according to the 2006 United Nations Development Programme (UNDP) Human Development Report 2006 (see footnote 7), Mongolia ranks 116th out of 177 countries on the HDI scale. The country does have a relatively high adult literacy rate, which was at 97.8%, according to the same report. Mongolia’s annual population growth rate was at 1.1% in 2006.8 Economic growth has steadily increased in recent years, with a growth in GDP of 8.4% in 2006 (page 296 of footnote 8). However, according to a recent report from the Government of Mongolia, 36% of the population lives below minimum living standards.9 In 2006, minimum living standards were between 34,800 Mongolian togrog (MNT; $29) and MNT39,000 ($33) per month in the rural areas, and MNT42,800 ($36) per month in Ulaanbaatar.10 A high unemployment rate—3.2% of the workforce in 2006—contributes to issues of poverty (page 295 of footnote 8). In reality, however, this figure may be significantly higher.11
19. Throughout the past 10 years, Mongolia has spent on average 20% of the annual state budget on education. Total education expenditure has increased by MNT53 billion ($44.6 million) since 1996 (page 7 of footnote 9). In 2006, public education expenditure was 5.6% of GDP (footnote 7). Foreign official development assistance to the educational development of Mongolia has been increasing steadily and has reached MNT115.7 billion ($98.2 million) over the past 7 years, which is 16.5% of the GDP (page 7 of footnote 9).
20. Appendix 1 provides an overview of Mongolia’s progress toward achieving the Millennium Development Goals (MDGs), to complement some of the general country-context information provided in this chapter.
5 Aimag – second biggest administrative unit of Mongolia after capital city Ulaanbaatar, similar to a “province”;
soum – third biggest administrative unit of Mongolia, similar to a “district”; bagh – the smallest, similar to a “village.” 6 Wikipedia. 2007. Mongolia. Available: http://en.wikipedia.org/wiki/Mongolia. 7 UNDP. 2006. Human Development Report. Available: http://hdr.undp.org/hdr2006/statistics. 8 ADB. 2007. Key Indicators. Manila. 295. 9 MECS. 2006. Master Plan to Develop Education of Mongolia in 2006-2015. Ulaanbaatar. 8. 10 From Mongolia National Statistical Office. Available: http://www.nso.mn/eng/index.php. 11 European Union. 2007. Mongolia-European Community. Strategy Paper 2007-2013. Ulaanbaatar. Available:
http://www.europa.eu/external_relations/mongolia/spmipa/sp_mongolia_en_23-02-2007.pdf.

7
21. Telecommunications. There are 14 Internet service providers in Mongolia, four mobile phone operators, more than 70 companies working in the software development industry, and over 80 companies in computer and information technology (IT) equipment trade. The number of users of mobile phones had increased to 774,90012 as of December 2006. This means more than 25% of the population has a mobile phone. The number of Internet users has increased since 2003, but not at the same rate as mobile phone usage has. There are an estimated 10,880 Internet users in the country (page 47 of footnote 12).
22. Currently, a domestic call on the mobile phone costs approximately MNT75 per minute ($0.06), and a landline call about MNT10 ($0.008). A call from the capital to the provinces, however, costs about MNT120–200 ($0.10–0.17). The monthly charge for a 64 kilobyte Internet connection is approximately MNT17,590–29,300 ($15–25).
23. In 2000, the Government of Mongolia ratified the national ICT Vision 2010 (see details in Section III.D), as a tool to spur ICT development in the country. The vision addresses issues such as the “government-legislation framework, business-economy framework and people-society framework,”13 and provided the starting point for a number of activities and programs. In line with this, the telecommunications infrastructure in the country also has been improving significantly over the past several years.
24. E-Mongolia. The Information and Communications Technology Authority, which was established in November 2004, has worked intensively in the development of the E-Mongolia program, which was approved by the Government of Mongolia on October 14, 2005. The E-Mongolia program outlines a medium-term (2005–2012 years) development policy from the government, as well as measures to be undertaken for its implementation. The program aims “to establish the information society and the foundation for knowledge-based society in Mongolia by enhancing extensive application of ICT in all society sectors,”14 with the vision to become one of the top 10 developed countries in Asia by the year 2012. The program outlines a number of initiatives to be achieved by the Government of Mongolia in collaboration and cooperation with the private sector, nongovernmental organizations (NGOs), and the international community. Those initiatives are in areas of e-Government, e-Commerce, e-Industry, e-Education, e-Citizen, and e-Health, and include programs such as “Affordable Internet,” “One home–One computer,” “IT Literacy for All,” and “Mobile Phone for Every Herdsman,” as well as services in areas such as telemedicine or infrastructural projects—for example, having the shortest Euro-Asia fiber optical cable run though Mongolia.
12 Ariunaa, Lkhagvasuren et al. 2006. Information and Communications Technology Development in Mongolia –
2006. White paper. Unpublished draft. Ulaanbaatar. 27. 13 UNESCO. 2003. Meta-Survey on the Use of Technologies in Education. Bangkok. 111. 14 From Invest in Mongolia. Available: http://www.investmongolia.com/forum/projects/tusul77.pdf.

8
III. EDUCATION SYSTEM CONTEXT
A. General Aspects 25. The Mongolian education system has been undergoing significant changes since the democratic transition period in the 1990s. During the 70 years of socialist governance, Mongolia followed the Russian education system model, a 10-year school system. Starting in 2004, Mongolia instituted an 11-year school system in better accordance with international standards, and it is about to begin a 12-year system in general educational schools in the near future.
26. The social, political, and economic changes that occurred in Mongolia starting at the end of the 1980s have caused a high school dropout rate, especially in the countryside. Currently, some 9,032 children aged 7–15 are considered school dropouts.15 Of these, 8,333, or 92%, are children in rural areas. Children aged 12–15 are the age group most likely to drop out of school—about 6,253 children belong to this category (footnote 15). Furthermore, 3,448 children who are eligible to study in the primary schools and 2,065 children eligible to study at secondary schools had not enrolled at all during the last academic year, and are left outside the formal school system.16
27. Private sector involvement in education is growing year by year. Before the 1990s, during the socialist period, education at all levels was free of charge and state-run. Today, there are 139 private secondary schools and 125 private higher education institutions in addition to public schools. There are also established international schools in the country, specifically several branches of foreign institutions and Chinese and Russian schools.
28. There are a total of 724 schools throughout the country, 585 of which are public. There are three types of schools: primary schools (75), secondary schools (252), and high schools (397).
29. The number of pupils enrolling in first grade in the 2005–2006 academic year was 55,679 (footnote 15), of which 17,665 were in urban and 38,014 in rural public schools. It is estimated that a slightly lower number, a total of 51,604 children, were enrolled in the academic year 2006–2007. The basic education enrollment rate for children aged 7–15 was 95.4%.
30. Student-teacher ratios vary between the urban and rural areas, as well as among the different types of schools. In urban areas, the teacher-student ratio on average is 1:24; in the rural areas it is 1:25. As for primary schools (grades 1 to 5), the student-teacher ratio is 1:33; secondary schools (grades 6 to 9), 1:21; and high school (grades 10 to 11), 1:20. A total of 556,876 pupils study at general education schools, of which 186,186 are in the urban areas and 370,690 are in the rural areas. The number of full-time teachers at the schools is 22,628, of which 7,666 are in urban schools and some 14,962 are in rural schools.
31. The current Mongolian education system structure consists of formal education, nonformal education (continuous education), and informal education. General education is considered formal education. General education is structured with 3 years at the preschool level, 5 years at primary school, 4 years at secondary school, and 2 years at high school. This
15 MECS. 2006. Statistical Data 2006. Ulaanbaatar. 16 Speech made by Mr. Enkhtuvshin, Minister of Education, Culture and Science. Ulaanbaatar. 2007. Available:
http://www.mecs.pmis.gov.mn/images/anhdugaar%20zuvulguun/Minister%20s%20Speech05.02.pdf.
9
may be followed by 4 to 5 years of diploma and bachelor’s degree education and 1 to 2 years of postgraduate education.
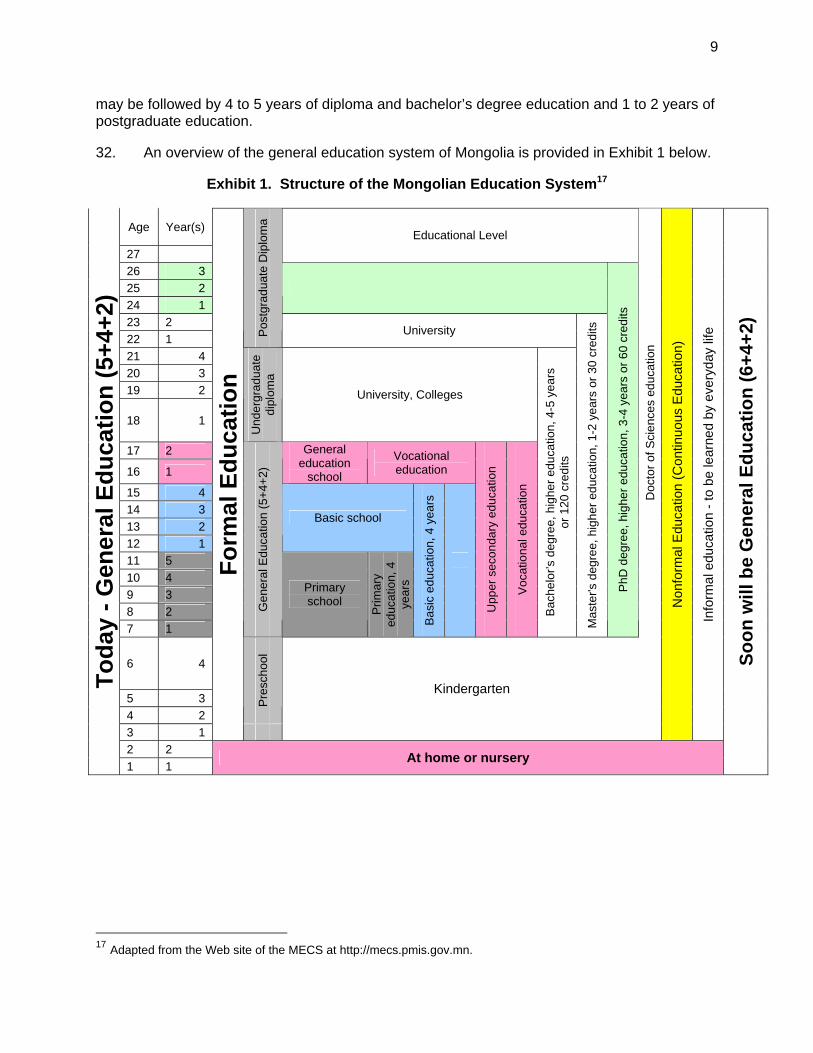
32. An overview of the general education system of Mongolia is provided in Exhibit 1 below.
Exhibit 1. Structure of the Mongolian Education System17
Age Year(s)
27 Educational Level
26 3 25 2 24 1
23 2 22 1 Po
stgr
adua
te D
iplo
ma
University
21 4 20 3 19 2
18 1
Und
ergr
adua
te
dipl
oma
University, Colleges
17 2
16 1
General education
school
Vocational education
15 4 14 3 13 2 12 1
Basic school
11 5 10 4 9 3 8 2 7 1
Gen
eral
Edu
catio
n (5
+4+2
)
Primary school
Prim
ary
educ
atio
n, 4
ye
ars
Bas
ic e
duca
tion,
4 y
ears
Upp
er s
econ
dary
edu
catio
n
Voca
tiona
l edu
catio
n
Bac
helo
r’s d
egre
e, h
ighe
r edu
catio
n, 4
-5 y
ears
or
120
cre
dits
Mas
ter's
deg
ree,
hig
her e
duca
tion,
1-2
yea
rs o
r 30
cred
its
PhD
deg
ree,
hig
her e
duca
tion,
3-4
yea
rs o
r 60
cred
its
Doc
tor o
f Sci
ence
s ed
ucat
ion
6 4
5 3 4 2
Pre
scho
ol
3 1
Form
al E
duca
tion
Kindergarten N
onfo
rmal
Edu
catio
n (C
ontin
uous
Edu
catio
n)
Info
rmal
edu
catio
n - t
o be
lear
ned
by e
very
day
life
2 2
Toda
y - G
ener
al E
duca
tion
(5+4
+2)
1 1 At home or nursery
Soon
will
be
Gen
eral
Edu
catio
n (6
+4+2
)
17 Adapted from the Web site of the MECS at http://mecs.pmis.gov.mn.

10
33. When Mongolia switched to an 11-year school system in 2005–2006, it also introduced new curriculum standards that changed the primary and the high school syllabus significantly. According to the new curriculum, there are six subjects in grades 1–3, ten subjects in grades 4–5, 18 subjects in grades 6–9, and nine subjects in grades 10–11. In addition, the curriculum for grade 9–10 students is divided into three components, including compulsory courses, elective courses, and professional orientation subjects. This aims to help students better align their course selections with their personal interests and their future career plans. Furthermore, the curriculum was changed to make it more flexible and pragmatic, allowing for 25% of curriculum hours to be managed directly by each school, so as to organize locally relevant subjects and courses.
34. In 2006, the “Master Plan to Develop Education of Mongolia in 2006–2015” was developed, following from previous education sector strategies and plans under the leadership of the Ministry of Education, Culture, and Science with support from partners and in consultation with national education stakeholders. The Master Plan is supposed to function as a roadmap to achieving two strategic goals in 2015: (i) reducing poverty and social inequality by making Mongolia’s education more accessible and inclusive, and (ii) improving the quality of education to reflect the needs and challenges of a contemporary society.18 The document has six chapters:
• Introduction of master plan;
• Current socioeconomic and educational status of Mongolia;
• Policy and strategic framework of master plan;
• Midterm action plan 2006–2010;
• Estimations of needs and required funds; and
• Management and monitoring/evaluation of the master plan.
35. As outlined, the plan presents policy and strategic objectives per the two main goals cited above. Exhibit 2 (from page XI of footnote 9) below outlines some of the key objectives per area of education.
18 Statement by the Ministry of Education, Culture and Science at the Second Government of Mongolia – External
Partners Technical Meeting. October 9–10, 2006, Ulaanbaatar, Mongolia. Available: http://site-resources.worldbank.org/ MONGOLIAEXTN/Resources/E_Education_Draft_Action_plan_Englsih_by_GoM.pdf.

11
Exhibit 2. Objectives of the Master Plan to Develop Education of Mongolia in 2006–2015

12
36. Hand-in-hand with the introduction of new curriculum standards came a focus on new pedagogical approaches and teaching methods. The Mongolian education system had previously emphasized rote memorization with teacher-centered, lecture style classrooms and chalk and blackboard as the dominant media. Recent initiatives and efforts aim to move learning and teaching styles toward more constructivist and student-centered approaches, including critical thinking, problem solving, group discussions, independent work, and self- or peer-assessments.
37. Nonformal education is of great importance in Mongolia. The government has therefore established the National Center for Nonformal Education and Distance Education,19 with branches in each district (so called Enlightenment Centers). The aim of these centers is to support dropout children, offer literacy programs for illiterates (adult and child), and organize lifelong-learning programs. One of the most recognized projects in this field was the United Nations Educational, Scientific and Cultural Organization (UNESCO)-funded Gobi Women’s Project, which combined printed materials and public radio programs to reach herder women with information on livestock rearing techniques, family care (family planning, health, nutrition, and hygiene), income generation, and basic business skills.20
B. Teacher Development 38. The tertiary institutions such as the Mongolian State University of Education, the Teacher Training College, the University of the Humanities, and the National University of Mongolia are key providers of Mongolian pre-service teacher education. A total of 34,286 teachers are working at all levels of educational institutions, of which 78% are female, and 30% are under 29 years old (footnote 16). The Government of Mongolia, taking into consideration the teacher shortages in the rural areas, pays the tuition fees of some of those students who are willing to work in the countryside upon graduation.
39. In order to get certification, teachers have to receive at least a university degree, which is equivalent to 4 years of higher education. In 2002, a compulsory, 96-hour computer course was introduced for all teacher training institutions. The percentage of professional teachers with accredited teaching certificates in 200621 was on average 98% to 99.1% in urban areas and 97.4% in rural areas.22
40. The MECS is tasked directly with issues of policy, strategic planning, and organization of in-service teacher training. Partners such as ADB, World Bank, Japan International Cooperation Agency (JICA), and others considerably contribute to in-service teacher development through a variety of programs and projects.
41. In the 2007–2008 academic year, a new national system for teacher performance evaluation was to come into action. According to this system, teachers will be assessed every 5 years against the following criteria:
• Theoretical knowledge 19 National Center for Nonformal Education and Distance Education. Available: http://www.nfde.mn/english/
index.html. 20 UNESCO. 2004. The Gobi Women’s Project. Available: http://www.unesco.org/education/educprog/lwf/
doc/portfolio/case1.htm. 21 For more details, see UNESCO, http://www.unesco.org/education/educprog/lwf/doc/portfolio/case1.htm. 22 There is an extreme shortage of professional informatics teachers, especially in rural areas. Due to a ban on
employing teachers without formal certifications, schools in small, remote soums are even more affected by these shortages than others. Section VIII.E, Findings on Research Question 2, provides more insight.

13
• Methodology
• Students’ level of understanding and knowledge of the subject taught by the particular teacher
• The level of participation in the schoolwork
• The level of collaboration with parents and pupils
• The level of English language knowledge
• The level of ICT knowledge
• Ethics
42. Based on the result of the evaluation, teachers are given their teaching license for the next 5 years. Currently, teacher performance is evaluated at the school level by training managers (see more information on their role in paragraphs 49, 50 below). In addition, regional teacher evaluations are carried out by the Education and Culture Departments annually; teachers in selected grades and schools undergo tests, mostly on subject-matter knowledge. The school-level teacher performance evaluations and the regional standardized evaluations combined are the criteria for teacher promotion.
43. Student assessment is standardized for specific grades. Previously, standardized end-of grade exams had been administered in grades 4, 8 and 10. With the move to an 11-year school system, as explained above, this practice also changed for the academic year 2005–2006, and standardized exams are now administered after grades 5, 9 and 11. ECDs are responsible for some standardized student assessments at the regional level; for other student assessments, schools are directly responsible themselves. A national-level “general exam” is organized after grade 11 for all graduates by the Education Evaluation Center in June each year. Results of this exam determine student enrollment in tertiary education.
44. ECDs at the regional level are also responsible for organizing the regional “Olympiads.” Every year, special national Olympiads take place in several subject areas such as mathematics, physics, Mongolian language, foreign language, biology, geography, arts, and others. The Olympiads are organized on several levels: school, region (several soums), aimag, and national level. Winners at each level qualify to participate in the next higher level Olympiads, and get medals starting at aimag level and higher. Winners of national Olympiads qualify to participate in international Olympiads and earn the right to enroll in national universities in related subjects without having to pass the enrollment exam. In addition, they receive a 2-year tuition scholarship from the government. Olympiads also play a role for teachers, and are used as an important criterion in teacher performance evaluations, often already anchored in their contracts.23
C. Education Administration 45. According to the Education Law, MECS is the main administrative body of education in Mongolia on behalf of the government. It is represented by ECDs in each aimag and in 23 At the beginning of every school year, each teacher signs a contract with the school. The contract covers elements
such as teacher outputs in terms of her/his students’ achievement and number of hours teaching, and includes an understanding about not being absent, about the professional development to be undertaken, and issues of incentives and school responsibilities.

14
Ulaanbaatar. The ministry is responsible for developing and implementing long- and medium-term plans and strategies, visions, and programs; and for monitoring their implementation. MECS is also responsible for issues of norms and standards for educational institutions and for enforcement of the education law. MECS coordinates and provides professional assistance for formal and nonformal education for citizens and is organizing retraining programs. Relevant for this study, the ECD of Bayankhongor aimag consists of a monitoring and research division and a training division. The monitoring and research division is responsible for monitoring student and teacher performance and research-related issues, as well as for handling administrative duties such as accounting, budgeting, statistics, and finance. The training division features methodologists for specific subject matters, such as mathematics and informatics, foreign languages, natural sciences, and Mongolian language, as well as primary education and nonformal education.
46. All administrative levels (aimag, soum, bagh) are governed by peoples’ representatives or assemblies, so called khurals, and a governor. The governor acts as the executive administrator.24 Khurals are responsible for approving the school budgets and monitoring their implementation. Governors of soums, aimags, and Ulaanbaatar city and its districts are responsible for organizing activities to implement the education law in educational institutions of their territory. They are also in charge of creation, renovation, and termination of educational institutions where necessary, in consultation with the ECD. They issue licenses, support school staff and management, conduct monitoring and reporting, and can recruit and release principals of a school with the agreement of the ECD.
47. All schools have a school board and steering committee. The school board’s nine to 11 members are selected from among the teaching staff, students, parents, and other local organizations for the duration of 3 years. Selection and appointment take place at the school meeting. The school board is responsible for preparing proposals for appointing a principal and other organizational matters and plans.25
48. The majority of the steering committee (51–60%) is made up of representatives from the government (ECD), or, for private schools, of the schools’ investors. The rest of the committee members can be teacher or student representatives selected at teacher and student meetings. The steering committee’s work supports the implementation of school development plans. They are responsible for the following: approving and/or changing school bylaws, programs, and school development plans; determining school structure, staffing, and overall salary funds; developing investments and schedules of school budget allocations; defining school tuition fees (if applicable) and dorm fees; and monitoring and auditing school reports (footnote 25).
49. Day-to-day school management is the responsibility of the principal and training manager(s) (deputy principal). The principal is responsible for recruiting and releasing teachers and other staff; issuing orders in accordance with other legal documents; making decisions on student retention and graduation; contracting with other entities; developing the school development plan and implementing it; monitoring overall school performance; developing and managing school budgets; and improving the learning environment.26
24 “The aimag governor is nominated by the local khural and appointed by the prime minister. The soum and bagh
governors are nominated by their khurals but appointed by the governor at the next highest level of government. Citizens directly elect their aimag and soum khurals.”
25 Source: Education Law. The Education law was approved in 3 May 2002, and amended in 08 Dec. 2006. Available: http://www.mongoleducation.mn/modules.php?ss=4&id=3
26 Law on Primary and Secondary Education.

15
50. Most of the schools have two to three training managers who are responsible for primary, secondary, and higher grades. In smaller schools, one training manager may be in charge of secondary grades and above. The training managers are responsible for overseeing and supporting day-to-day teaching activities, from scheduling school lessons, to organizing re-training/professional development of teachers, to monitoring teacher and student performance and preparing and providing necessary statistical and other data to supervising organizations. The training managers’ overall responsibility is to ensure implementation of educational standards and the national curriculum at the school.
D. Current Status of ICT in Education 51. In a recent reform effort under the Second Education Development Project, MECS has revised the textbook procurement process. Schools now have the opportunity to select the textbook they like best from a list of titles preapproved by the Ministry. Printing companies and authors are chosen via a public tender process organized by MESC. Moreover, during the past 2 years, about half (footnote 16) of the Mongolian school textbooks were rewritten. However, there still are issues with textbooks and textbook shortages, and the reform has also generated some new challenges for schools and parents. Some of these are presented as findings from interviews and case studies in Chapter VIII, Study Findings and Discussion, below. Complementing textbooks and other teaching and learning aids, the ICT for Innovating Rural Education in Mongolia project developed/identified and disseminated 15 CDs, electronic teaching aids, or educational software to all schools of Mongolia. Additional electronic titles were rewritten/developed by MECS directly, notably the e-textbook for English for grades 5 and 9. For history, “The Millennium Great Khaan Chingis” DVD was developed and distributed to all schools on the occasion of the 800-year Chingis Khaan state celebration in 2006.
52. The main document to guide ICT in education of Mongolia is the ICT in Education Vision 2010, ratified by MECS in 2001. This Vision document is made up of four key components:27
• training: full utilization of ICT in each educational level’s curriculum and contents in order to introduce opportunities provided by ICTs and gain knowledge and skills to use it;
• hardware: supply of hardware allows the conduct of training according to different level of modern ICT development and provides possibilities of free access to information;
• teaching staff: supply of teaching staffs which have the capabilities to develop themselves in terms of their own knowledge and skills in line with rapid development of ICT;
• information ware: creation of possibilities of available and accessible information service by establishing educational information database and network.
53. The development of the vision went hand in hand with the allocation of budgetary funds and implementation plans. Related to this, in 2002, Resolution No. 256 was approved by MECS, stating that the subject of informatics shall be taught not only at the high school level, but also at the secondary school level, starting in grade 5. Seventy hours of informatics instruction was therefore added to the basic education level. The informatics curriculum includes areas of
27 Cited from Choijoovanchig, Lhaichin, Sambuu Uyanga, and Mendee Dashnyam. 2007. The Informatics Olympiad
in Mongolia. In Olympiads in Informatics. 2007. Vol. 1, 31–36. Institute of Mathematics and Informatics. Vilnius. 31f.

16
Information Management, Computer (computer and application skills), Algorithms (understand and develop algorithms), Modeling (understand and develop models), and Information Technology (Internet, e-mail). In 2006, MECS approved a new and updated vision, the ICT in Education Vision 2015 via Ministerial Order No. 450 of 2006. The new vision better addresses integration of ICT into education, and aims to reduce the number of students per computer, to train teachers in e-learning methodology, to establish e-schools, and to provide primary and secondary schools with professional informatics teachers.
54. By 2000, there was on average one computer per 341 pupils in Mongolian schools. By 2007 this number had decreased by four times to an estimated 94 pupils per computer (footnote 16). Instrumental in some of this change were donor-funded projects, such as SEDP and IIREM (both ADB-funded), described in more detail below in Chapter IV, SEDP and IIREM Projects Overview, as well as the project Sakura (funded by JICA) and others as seen below.
55. The following are among a number of initiatives that have contributed to ICT development in education in the country:28
• Education Sector Development Program (ESDP). Under the ADB-funded ESDP, selected Mongolian schools were provided with computers.
• Knowledge Network. This initiative was started by the Internet and Information Center NGO with funding from the International Development Research Center (IDRC). The network “aimed at connecting schools to the Internet and developing a Knowledge Web Centre to provide electronic learning resources to teachers and students through a web site.”29
• mongoleducation.mn. This Education Portal Website is hosted by the Mongolian Foundation for Open Society (MFOS) at http://www.mongoleducation.mn.
• iEARN Mongolia. iEARN Mongolia was started in 1999 with support from the Open Society Institute and MFOS. The initiative aims to use the Internet to promote international teacher and student collaboration and to foster teacher subject matter knowledge through wider access to information and knowledge.
• ThinkQuest Mongolia. With the Mongolia Development Gateway as its partners, ThinkQuest, an international scheme for student competitions on educational resources, is being implemented in Mongolia.
• Sakura Project. “The JICA-funded project aims on bridging the digital divide, the economic gap in Mongolian education sector that prohibits access to technology and ICT education. Upon 5 years of implementation of the project 628 network-connected PCs have been installed in 64 secondary schools in rural areas of Mongolia by the end of 2006.”30 In addition, “within the framework of the project, manuals were developed using Linux OS and the Star Office package and training was provided to teachers and students on their use” (footnote 13).
28 For a more comprehensive list of ICT-related initiatives in Mongolia, see Uyanga, Sambuu. 2005. The Usage of
ICT for Secondary Education in Mongolia. Ulaanbaatar. Available: http://ijedict.dec.uwi.edu/viewarticle.php?id= 140&layout=html.
29 Quoted from the UNESCO Bangkok website. Available: http://www.unescobkk.org/index.php?id=1583&type=98. 30 Quoted from Mongolia University of Science and Technology website. Available: http://www.must.edu.mn/emust/
?select=news&news_id=11.

17
• Mongolian Information Development Application Scheme (MIDAS). MIDAS was funded by UNDP’s Asia–Pacific Development Information Programme (APDIP) and MFOS. “The MIDAS NGO was formed with the objective of working from the grassroots up to policy-making level, and mobilizing key ICT stakeholders in Mongolia. Its aim is to support the Mongolian government in creating an intellectually-geared society, and developing information and communications technology (ICT) in Mongolia.”31
56. Throughout past projects, however, Mongolia has been paying more attention to the computerization of schools and strengthening the informatics curriculum implementation. Recently, more efforts are under way to address further issues of ICT in education, specifically in areas of integrating ICT with teaching and learning; and ICT to support information, communication, and training in remote areas.
57. Projects to date, policies, and action plans have contributed to considerable ICT development. For instance, all aimag centers and some soums are connected via broadband fiber optic cable. More than a dozen aimag centers also feature videoconferencing facilities, mainly used to train government personnel but also rented out to other actors, including the private sector. The installation of the videoconferencing system was supported by ADB under the “Capacity Building for Civil Servants” program. However, there are still major challenges to ICT in education. Language barriers are still critical in Mongolia.32 There are few Mongolian-language educational materials available, especially not on the Internet, and there are few educational websites. The IT infrastructure in schools is still insufficient and expensive for schools. In 2007, therefore, MECS adopted further ICT-related policies to ensure successful implementation of the e-Mongolia program and the ICT in Education Vision 2015. The order stipulates the following:33
• To renew educational statistics related to ICT hardware and teaching staff
• To monitor the implementation of the E-Mongolia initiative and the ICT in Education Vision 2015 on a yearly basis and report on it
• To enhance Internet connectivity to scientific and educational institutions and reduce cost of connectivity while improving the quality of connection
• To connect all institutions into an academic network
• To study the possibility of creating an educational library network
• To establish an e-school at the Mongolian University of Science and Technology (MUST), which will address issues of distance learning
• To establish a computer maintenance center at MUST, which will serve all public educational organizations
• To develop requirements for computer labs for tertiary education institutions
31 Quoted from UNDP APDIP website. Available: http://www.apdip.net/projects/mn-midas-1. 32 For a discussion on issues of ICT, refer to Appendix 7 of the RETA Final Report, the Policy and Strategy Report. 33 MESC. 2007. Order No. 183 of 2007. June 5, 2007. Ulaanbaatar.

18
• To develop a proposal for procuring cheap but appropriate computer and supporting equipment for schools and to support computer skills training for teachers as a unified management policy
• To provide ICT teachers for tertiary education institutions and organize retraining for them
• To connect Technical and Vocational Education and Training institutions to the Internet and develop websites to advertise professions and schools
• To increase ICT hardware, speed of Internet connection, ICT knowledge of teachers and students, and their skills to use it in each educational organization at each level
58. The World Bank-funded Rural Education and Development project is disseminating e-books to schools and promoting the use of the International Children’s Digital Library34 by adding Mongolian books to the repository. Finally, the Third Education Development Project, a loan by ADB to the Government of Mongolia, plans to establish an ICT in education model project including 30 schools.
IV. SEDP AND IIREM PROJECTS OVERVIEW
A. Second Education Development Project 59. SEDP Introduction. Upon completion of the Education Sector Development project (implemented 1996–2001), the SEDP was launched in December 2002 and was to be implemented through December 2007 with assistance from ADB. The objective of SEDP is “to promote human development through universal access to education.” A secondary objective is to reduce income and deprivation by improving access to quality preschool and basic education in poorer rural and urban communities.”35 The project features three main components, namely (i) school and kindergarten development, (ii) quality improvement, and (iii) education management.
60. Specific objectives of the project (from page 13 of footnote 35) focused on:
• improving access to services (kindergartens and schools), including children with disabilities;
• improving the quality and relevance of education services;
• improving the efficiency and effectiveness of education management; and
• enhancing the efficiency of public resource allocation for education services by reducing recurrent financing requirements for operation and maintenance of education facilities, expansion of the textbook rental scheme, and improved accountability in education management.
34 International Children’s Digital Library. Available: http://www.icdlbooks.org. 35 ADB. 2002. Report and Recommendation of the President to the Board of Directors on a Proposed Loan to
Mongolia for the Second Education Development Project. ADB RRP: MON 31231. Manila. ii.

19
61. With regard to ICT, SEDP has provided high-level research on a wide array of ICT in education issues and associated areas, such as informatics and school IT infrastructure. The project has not necessarily focused on e-resources or micro-level ICT integration in the classroom. SEDP also has focused on 11-grade secondary schools, which tend to be in more-populated areas and have higher student numbers—one of the most determining factors of school affluence (per capita education financing system).
62. SEDP Activities. Selected ICT-specific project activities included:
• Strengthening the Computer and Information Technology School of the Mongolian State University of Education
• Strengthening the capacity of informatics teachers, ECD methodologists (ECD staff specializing in instructional practice), and national teacher trainers for informatics
• Conducting research and surveys on computer skills among principals, school administrators, and teachers, and collecting data on the computer infrastructure in secondary schools
• Conducting a monitoring and evaluation analysis on the ICT in Education Vision 2010
• Developing research papers and first recommendations on integrating ICT into the English curriculum and classroom; developing a teacher guidebook for ICT in English
• Researching ICT integration according to the new primary and secondary education standards, and researching the theory and methodologies of ICT development and integration in secondary schools and training institutions
• Providing up to six computers (and sometimes printers) to more than 100 educational institutions across the country; computers were given mostly to 11-grade schools, aiming to strengthen the informatics instruction in secondary schools.
B. ICT for Innovating Rural Education in Mongolia 63. IIREM Introduction. Parallel to SEDP, and in order to pilot the development of replicable model(s) for using ICT in education featuring education content development, modern pedagogic approaches, and information to poor rural schools and communities, IIREM was successfully implemented from 2004 to 2006. It was targeted to (i) empower rural teachers in basic education to innovate and improve teaching practices and foster a student-centered active learning environment; (ii), enhance school management and system equity, efficiency, and transparency; and (iii), increase opportunities for high-quality and locally relevant nonformal education and build new school-community linkages.36
64. Unlike the mainstream approach of supporting urban communities with a particular focus on informatics skills and institutionalization as done under other initiatives, the IIREM project used a pro-equity model particularly addressing the growing internal digital divide and information poverty in rural areas of Mongolia. The project provided, in addition to teacher and principal training, a minimalist set of ICT tools (equipment), coupled with educational materials. IIREM focused more on the “soft components,” in particular capacity building for educators,
36 Cited from ADB. 2004. Grant Assistance to Mongolia for Information and Communication Technology (ICT) for
Innovating Rural Education. ADB JFICT: MON 36245. Manila. 1.

20
content development, and building of support networks to connect rural teachers and head teachers, ECDs, and communities, as well as monitoring and evaluation.
65. The IIREM project covered 37 soum schools in seven aimags, as well as four aimag center schools, four Ulaanbaatar schools, and the ECDs of four of the aimags. It directly involved over 500 teachers and over 240 students in dorms. The soum schools were selected on the basis of the following criteria: (i) schools in remote location from the aimag center (at least 100 km distance); (ii) soum schools with limited supply of electricity; and (iii) soum schools with eight or nine grades of education (not 10- or 11-grade schools).
66. The following activities were conducted under IIREM: (i) equipment provision; (ii) capacity building for teachers, head teachers, and education officials in innovation to improve local education; (iii) generation of information resources and theme/subject-specific content; and (iv) building of support networks to connect rural teachers and head teachers, ECDs, and communities.
67. Equipment provision to schools. The soum schools in the Bayankhongor aimag were provided with one laptop, one digital camera, one LCD projector, and some of them with diesel power generators. Laptops with batteries, and the backup batteries provided by IIREM, allowed teachers to charge the laptops when power was on and still use them when power was off. Digital cameras were provided to schools so that the teachers could take pictures and images to use in classroom demonstrations, and the LCD projector allowed teachers to more effectively present the photos, computer-generated materials, and educational software resources to the students and smoothly integrate ICT into classroom teaching. In a few selected schools, including two of the schools participating in this study, a laptop was also given to students living in the school dormitory as an activity entitled “dorm project,” which aimed to build students’ level of familiarity and comfort with technology.
68. One school in the Bayankhongor aimag center, the largest in the province, was selected as an IIREM mentor school. It was provided with three laptops, one digital video camera, and one LCD projector. Because the mentor school teachers were mandated to regularly conduct training for soum school teachers, and considering that the soum schools didn’t have many computers (and had limited electricity), the laptops could be used during those trainings. Also, as it was foreseen that the laptops might break, the laptops of aimag mentor schools were also designated as backups for soum schools while theirs were being repaired. The digital video camera was supplied to mentor schools so that they could record achievements of teachers at soum schools integrating ICT into teaching practice, and share the video with teachers of other soum schools. The role of the mentor school teachers was to mentor soum school teachers in integrating ICT into their teaching practices. However, considering that the aimag mentor schools teachers were also just starting to use ICT and to apply it in their teaching practices, the LCD projector and laptops were supplied to mentor schools so that teachers there could also try using the equipment, explore applications, develop content, and use educational software.
69. The ECD of the Bayankhongor aimag was supplied with one laptop, so that it could be used for training in soum schools along with the laptops from aimag mentor schools.
70. Capacity Building. In total, 120 hours of training were conducted for trainers from mentor schools:
• 40 hours of training for teachers of soum schools on the use of computers, equipment, and applications (such as spell checker for English language teachers, Excel math

21
functions for mathematics teachers, Power Point presentations for teachers to introduce subject topics), etc.
• 40 hours of training to assist soum school teachers with developing content with ICT, as well as using ICT for communicating with teachers of other soums, aimags, and Ulaanbaatar mentor schools. The training included making Power Point presentations; taking photos and integrating them into presentations; and using communication skills specifically related to writing, sending and receiving e-mails, etc.
• 40 hours of training to assist soum school teachers with skills in integrating ICT with teaching methodology, introducing concepts, and practicing standard operating procedures (SOPs; described in more detail in paragraph 75 below). This training was conducted together with ECD methodologists, who could provide pedagogical support and guidance.
71. Also about 120 hours of training were conducted for teachers of soum schools in Bayankhongor. The training for soum school teachers was conducted by trainers from the mentor school using the content of the training they received.
72. A total of 40 hours of training was conducted for principals of soum and aimag center schools in Bayankhongor. The content of the training included the use of computers, the use of the equipment provided, application of the equipment in teaching and learning, and use of software and tools for school administration.
73. Generation of E-Resources. A total of 15 software titles and applications were distributed to teachers as a support tool for their subject teaching. The software and applications included:
• Human—basics of healthy living (set of PowerPoint presentation slides)
• Apple—first 1,000 words in English (picture dictionary)
• ABC e-book—interactive ABC e-book for kids
• Polynom—graphs of polynomial functions)
• Physics—optics (interactive software includes labs, self-testing, and testing)
• Physics—electricity (interactive software with multimedia supports)
• Biology—multimedia lessons on biology
• Technology—introductory technology lessons with interactive exercises
• Chemistry—multimedia lessons with some animation demonstrations
• Chemistry—software with labs, videos, and interactive element tables
• School management database system
• Interactive PowerPoint lessons

22
• History—teachware with flexible content changed by teachers themselves
• Test database
• Mongolian spell checker—Anguuch
74. In addition, nine CDs were created and distributed to schools. The CDs showed teaching practices of teachers in Ulaanbaatar, aimag, and soum schools, featuring integration of ICT into subjects such as history, geography, mathematics, English language, and literature, plus presentations developed by teachers in soum schools.
75. In order to guide teachers in content development and to promote effective use of the e-mail network, a number of SOPs were developed and adopted by IIREM schools. SOPs addressed the following:
• Development of innovative teaching practices
• Self-sustainable data collection and documentation
• Continuous information and content dissemination
• Classification of content
• Maintenance of e-mail based network
• Training content
• Conversion of Web pages into text format and transmission to soum schools
76. Support Networks. E-mail accounts were created for each school participating in the IIREM project and all e-mail addresses were disseminated to schools. This way, soum school teachers were able to send e-mails to each other. With the support of SOPs for developing innovative teaching practices, classification of content, and continuous information and content dissemination, the teachers of the soum schools of Bayankhongor aimag were able to develop subject-specific content. Via the network, teachers could not only share their own ideas, but also get content developed by teachers of the same subject to use in their teaching—or improve the content—and then provide comments and suggestions to others on how to integrate these materials into teaching.
77. Lessons Learned from IIREM. The following lessons learned from IIREM were especially relevant for this study:37
• Most of the school principals mentioned that cooperation and team spirit increased among soum teachers during the project. The project supported the attitude to work as a team and a professional group.
• The teachers benefited from e-mail as a means of communicating with teachers from other soum, aimag center, and Ulaanbaatar schools, exchanging subject-specific content and sharing experiences and practices.
37 Partly cited from IIREM. 2006. ICT for Innovating Rural Education of Mongolia: Final Report and Policy
Recommendations. ADB TA JFICT 9044. Ulaanbaatar. 9–12.

23
• The concept of mentor schools was applied in the IIREM project, where the aimag mentor schools and Ulaanbaatar mentor schools teachers were able to provide not only support and guidance to soum schools teachers in developing teaching materials, but also mentorship on methodological integration.
• Although the project was planning to use the faculty/student teams to create e-mail-based content, after pilot testing, the focus of project activities shifted to ECDs and mentor schools. This proved a more viable model than was anticipated in the beginning, with the regular support provided by methodologists of ECDs and teachers of mentor schools to soum school teachers.
• Tasks of Ulaanbaatar mentor school teams to develop content for classroom settings did not match well with equipment provided (desktop computers). Many materials produced (e.g., PowerPoint presentations) could not be employed and tested before dissemination; thus, the inputs of Ulaanbaatar mentor school teachers were sought on the integration of teaching methodology with ICT.
• As a lesson learned during implementation of this project, models for building capacity to develop interactive digital contents (teachware) and tools appropriate for classroom use or to support teachers in creating curriculum-related, student-centered learning experiences must be professionalized. Incubator models to develop the Mongolian market for educational software should be supported by appropriate procurement standards.
• The SOPs were found to be important for classification, codification, and sorting of information, content materials, e-mail, and other tools deployed by the IIREM project.
• The involvement of methodologists from ECDs was shown to be viable and most effective for linking the use of ICT applications to pedagogical claims. In some cases they could enhance their influence on school management to improve capacity and motivation of soum school trainers.
• There was consensus that stakeholder commitment in IIREM activities (particularly at the aimag center and soum level) can be sustained if some basic policy support is given (at first for using parts of existing budgets for recurrent expenditures for advice and communication).
• Provision of ready-to-go education software, along with the provision of custom-made and developed software and applications to be used in teaching and learning (see list in paragraph73 above), enhanced the capacities built through teachers using ICT in classrooms and integrating it into teaching practices.
• The CD-ROMs with videos of lessons taught by teachers, which were distributed to all teachers, gave ideas to other teachers on how to apply ICT knowledge and skills in their teaching practices.
• Using ICT equipment helped teachers to save time preparing their teaching materials and at the same time served as a tool for self-learning and professional development for teachers.

24
• Integrating ICT with teaching methodology helped teachers deliver content to students in an easy, understandable, and more visual way and facilitated student learning.
V. STUDY ACTIVITIES
A. Study Overview 78. Mongolia, Bangladesh, Samoa, and Nepal were the participating countries in this study. Based on the nature of existing ADB education projects in each of these countries, activities of the e-Resources component were conducted in Mongolia and Samoa, while the e-Teacher Training component was implemented in Nepal and Bangladesh. Initiatives in Mongolia and Samoa featured development and use of electronic teaching and learning materials to better reach remote areas of the country with up-to-date educational resources. These e-resources, for the purpose of this study, included a broad array of electronic teaching and learning aids, such as e-books, education software, and other learning resources, including websites, “Learning Objects,”38 courses, or simulations. In study countries, this specifically included educational software programs, productivity software and encyclopedias developed for Mongolia, and the Learning Objects developed under SchoolNet in Samoa. To test the approaches and initiatives taken under the existing projects in these countries, and provide appropriate policy guidance to DMCs on future ICT initiatives in education, this study linked with these projects, identified best practices, analyzed critical conditions that are either drivers or barriers to successful integration, and highlighted and documented promising models of ICT integration that not only have an impact on teaching and learning, but are also feasible and sustainable given the region’s development challenges. The study, through the Policy and Strategy component, also investigated the demand for ICT in education applications, the critical linkages between science and technology, and the relevant policy frameworks, both in the participating countries and in the wider Asia and Pacific region.
79. As described in the Executive Summary, the study featured three technical components: (i) the Policy and Strategy component, (ii) the e-Resources component, and (iii) the e-Teacher Training component. In each of the four countries, the implementation of Policy and Strategy featured a variety of meetings with key ICT in education stakeholders, most notably with ministry representatives, the private sector, and representatives from education institutions, as well as discussions with local and international experts in the field. Implementation of the other component featured the following activities:
• A site assessment
• A study kickoff workshop/expert forum
• A variety of professional development activities
• Moderate ICT resource upgrading
• Qualitative and quantitative data collection
38 For the purpose of this study, Learning Objects are defined as follows: “A Learning Object is an electronic resource
that purposefully combines digital assets, such as a pictures, video or audio snippets, bits of text, or smaller web-delivered applications to communicate a specific concept or message, and therewith has an explicit learning objective inscribed to it.”

25
• Data analysis
• Results reporting and sharing through country-level study reports and the International ICT for Education Conference in Manila in October 2007
80. Specifically, the Mongolia component of the study aimed at analyzing and complementing interventions and approaches implemented by the IIREM project and SEDP. Activities were to focus on the approaches around the development and use of the electronic teaching and learning materials. Findings of the study are presented in Chapter VIII, Study Findings and Discussion, below.
81. Planning of study activities and design of the case studies in Mongolia were informed by a site assessment conducted in May 2006. During the site assessment, education stakeholders and IIREM and SEDP participants were interviewed, schools visited, and possible activities discussed. An “Expert Forum on the ADB-Funded ‘Study of Technology in Education to Reduce Poverty—Asia and the Pacific’” was conducted. The expert forum gathered some 30 national ICT in education and education sector stakeholders in Ulaanbaatar for a day of intensive discussions and sharing. During the forum, the study, its proposed activities, and the research design were discussed. Participants included school principals as well as representatives from various government agencies, academia, the private sector, and donor agencies. The kickoff workshop not only discussed common terminologies but also facilitated exchange of various stakeholders’ experiences, lessons learned, ideas, suggestions on ICT in education in general, and the IIREM project and SEDP in particular.
B. Training and Equipment Procurement 82. The study based its planning of activities, such as professional development and equipment provision, on five key elements: (i) study objectives; (ii) lessons learned and best practices from other national, regional, and international ICT in education initiatives and related research; (iii) the outcomes of the site assessment, including (iv) information on IIREM and SEDP activities and possible areas to strengthen and complement their impact; and (v) the availability of financial resources for this part of the study. The final set of activities implemented were the following:
• One-week intensive training in August 2006: Training No. 1
• Moderate procurement of ICT hardware and software for SEDP schools
• School-based follow-up training in October 2006: Training No. 2
• Regional follow-up training and training of trainers in April 2007: Training No. 3
83. Training No. 1. This first training intervention was organized right before the start of the academic year, during teachers’ vacation, and took place August 14–20, 2006, in the Uvgunjargalant Children’s Camp, in the Bayankhongor aimag of Mongolia. Thirty-three participants from seven schools and three representatives from the ECD attended the training. Each school sent a team of one training manager and three teachers to the training. Schools were asked to send one primary school teacher, one teacher of humanities, and one teacher of natural sciences. Before the training started, participants were informed in detail about the objectives of the study, the study components, and the specific activities and events in Mongolia. Participants received and signed an informed consent form to indicate their decision to participate in this study. A training baseline assessment was conducted at the outset of the

26
program for both teachers and education administrators, capturing data on their backgrounds, ICT skills, knowledge, and attitudes. The training was roughly organized for three different groups of participants: teachers from IIREM schools, SEDP teachers, and training managers and ECD representatives. Every IIREM school served as a mentor to a SEDP school, acknowledging the stronger experience IIREM schools and teachers had in issues of ICT in education. Selected sessions, such as review of IIREM final activities and monitoring results, were only offered for IIREM teachers, while SEDP teachers were attending more basic computer training. A number of sessions, such as those on management of ICT at the school level, standards of teacher computer competency, and evaluation of effective ICT integration into classroom teaching were offered especially for ECD and training managers. At the conclu-sion of the training, participants submitted a training evaluation and were given certificates for their participation. In summary, the following activities were part of the 6-day, 46-hour training:
• Training on basics of equipment use;
• Training on software;
• Presentations on ICT in education and experiences of the IIREM project;
• Student-focused lesson planning and learning experience design;
• Participants working in subject matter groups on developing lesson plans and learning experiences integrating PowerPoint presentations developed under IIREM;
• Presentation on the IIREM teachers’ network;
• Presentation and analysis of the 15 education software programs developed under IIREM;
• Participants working in subject matter groups on developing lesson plans and learning experiences integrating elements of these software programs;
• Group presentation of lesson plans and their discussion; and
• Session on evaluation of electronic teaching and learning aids and identification of a set of shared evaluation criteria.
84. The training was considered a success by participants, who felt that their skills and knowledge had improved considerably because of the training organized under this study, and the collaboration and the information sharing with their peers. This feedback was derived from participants’ training evaluation sheets. Upon returning to their schools, participants were required to each train two other teachers in both use of the equipment and technology and the pedagogical considerations addressed during the training.
85. Procurement of ICT Equipment and Software for the SEDP Schools. The study supplied ICT equipment to the four SEDP schools modeled on the approach taken under IIREM. Each participating SEDP school received a laptop computer with a spare battery, mouse and keyboard, one LCD projector, and one digital camera with memory stick as well as respective protective bags, an uninterruptible power supply (UPS) device, and surge protectors. In terms of software components, schools received self-study software in the Mongolian language on Windows Explorer, Word, Excel, and PowerPoint, as well as a fast typing tutor for the Mongolian language. Under IIREM, each school in the country had already received the set of 15 IIREM
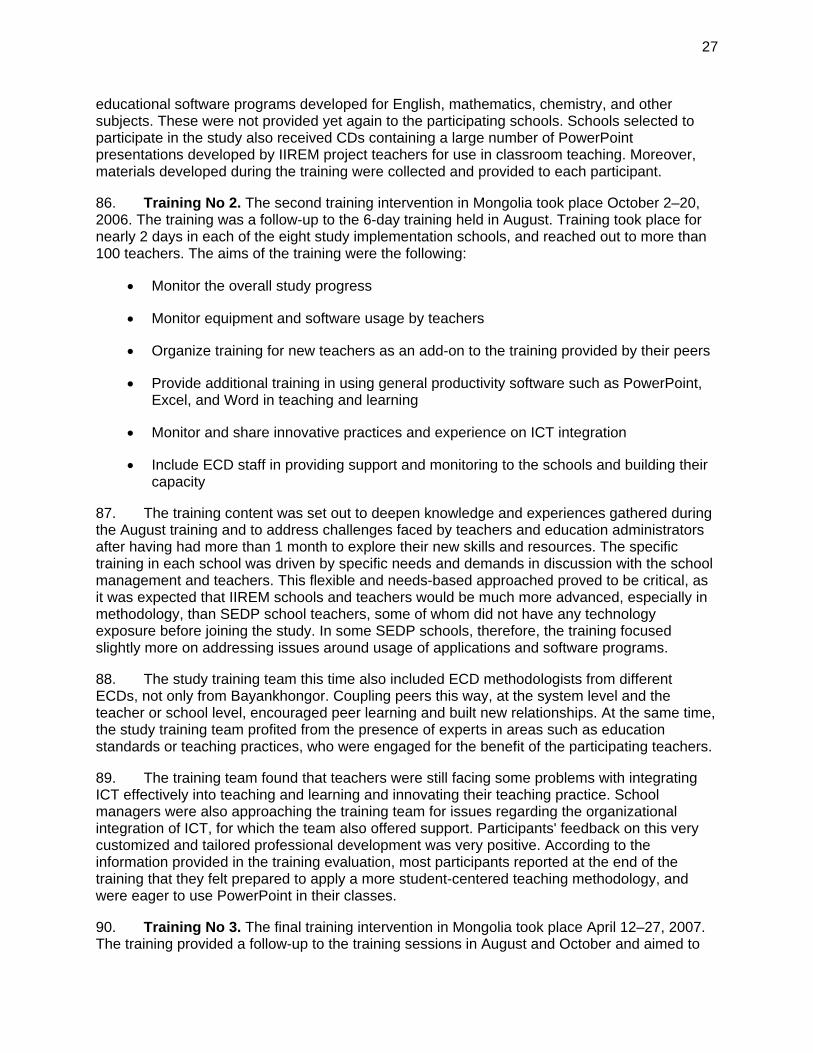
27
educational software programs developed for English, mathematics, chemistry, and other subjects. These were not provided yet again to the participating schools. Schools selected to participate in the study also received CDs containing a large number of PowerPoint presentations developed by IIREM project teachers for use in classroom teaching. Moreover, materials developed during the training were collected and provided to each participant.
86. Training No 2. The second training intervention in Mongolia took place October 2–20, 2006. The training was a follow-up to the 6-day training held in August. Training took place for nearly 2 days in each of the eight study implementation schools, and reached out to more than 100 teachers. The aims of the training were the following:
• Monitor the overall study progress
• Monitor equipment and software usage by teachers
• Organize training for new teachers as an add-on to the training provided by their peers
• Provide additional training in using general productivity software such as PowerPoint, Excel, and Word in teaching and learning
• Monitor and share innovative practices and experience on ICT integration
• Include ECD staff in providing support and monitoring to the schools and building their capacity
87. The training content was set out to deepen knowledge and experiences gathered during the August training and to address challenges faced by teachers and education administrators after having had more than 1 month to explore their new skills and resources. The specific training in each school was driven by specific needs and demands in discussion with the school management and teachers. This flexible and needs-based approached proved to be critical, as it was expected that IIREM schools and teachers would be much more advanced, especially in methodology, than SEDP school teachers, some of whom did not have any technology exposure before joining the study. In some SEDP schools, therefore, the training focused slightly more on addressing issues around usage of applications and software programs.
88. The study training team this time also included ECD methodologists from different ECDs, not only from Bayankhongor. Coupling peers this way, at the system level and the teacher or school level, encouraged peer learning and built new relationships. At the same time, the study training team profited from the presence of experts in areas such as education standards or teaching practices, who were engaged for the benefit of the participating teachers.
89. The training team found that teachers were still facing some problems with integrating ICT effectively into teaching and learning and innovating their teaching practice. School managers were also approaching the training team for issues regarding the organizational integration of ICT, for which the team also offered support. Participants' feedback on this very customized and tailored professional development was very positive. According to the information provided in the training evaluation, most participants reported at the end of the training that they felt prepared to apply a more student-centered teaching methodology, and were eager to use PowerPoint in their classes.
90. Training No 3. The final training intervention in Mongolia took place April 12–27, 2007. The training provided a follow-up to the training sessions in August and October and aimed to

28
present an opportunity for teachers and training managers from the eight IIREM and SEDP study schools to discuss their achievements and success stories, exchange best practices, and learn from each other. The training was organized in two parts: a 4-day joint workshop, held in the aimag center of Bayankhongor; and succeeding 3-day regional trainings for one or two schools at a time in the regions.
91. The 4-day aimag center training focused on the sharing of experiences and good practices and included not only teachers, but also school mangers and representatives from the Bayankhongor ECD. In a first part, school representatives presented practices introduced by this study in their schools. Participants worked in groups, within the three core curriculum areas of primary education, social sciences, and natural sciences, and held discussions on specific needs, challenges, and achievements of using ICT in subject-matter teaching. Participants conducted a short strengths, weaknesses, opportunities, and threats (SWOT) analysis of using ICT in teaching and learning in their specific area. Groups presented their work, including conclusions and recommendations, to the plenary for feedback. The second part of the training focused on Internet research and resources for teaching and learning, and featured web information sessions on finding and using information from online resources. Participants developed skills on how to assess web-based resources, and shared good practices in browsing and searching the Internet. Each curriculum area group then developed a list of keywords, which can be used by teachers to find valuable information in accordance with their needs and the curriculum. Some examples of Mongolian educational websites such as www.mongoleducation.com, www.asuult.net, www.elearning.mn, and others were examined, in addition to international educational websites and teaching resources such as thinkquest.org, iearn.org, and teachers.net. Participants spent time to search, find, and present other helpful educational websites on teaching and learning with technology. Finally, as a third component of the training, participants were introduced to the basics of local area networks. Sessions focused on networking, file sharing among network participants, and password protection and security policies.
92. The 3-day regional trainings focused on demonstration and development of hands-on skills in using word processing and spreadsheet applications for classroom management and classroom teaching. The trainings featured sessions specifically designed for the subgroups in primary education, social sciences, natural sciences, including a biology class demonstration of a model for student-centered learning experience (lesson planning) design (introduced to participants during Training No. 1) on the water cycle, integrating ICT. Participants learned how to use spreadsheets to develop graphs and tables and how to develop teaching aids and resources using word processing applications. Each participating teacher developed a number of resources for classroom teaching in her/his field. Continuing training in the use of the digital camera and images to strengthen visual aspects of teaching and learning aids was also conducted. Regional trainings concluded with participants sharing their experiences on teaching with ICT in a smaller group and discussing their newly acquired skills to shape ICT usage by distilling specific strategies for ICT integration in the classroom. Subgroups also presented their achievements and lessons learned from the training, discussed future activities, and expressed their demand for building further capacity in using ICT for teaching and learning.
93. This final training activity provided a critical follow-up for the two previous trainings. It was clear at that training that the time in between had allowed teachers to foster their computer skills and at the same time explore and innovate their teaching practice beyond basic use of presentations to substitute for blackboard write-ups. Also, the gap in initial capacity between IIREM and SEDP teachers was visibly closing, with SEDP teachers catching up with their peers, especially when it came to familiarity with the technology.

29
VI. STUDY SCHOOLS CONTEXT
94. The team selected four schools from IIREM, four schools from SEDP, and four control schools in the Bayankhongor aimag for participation in the study. See Exhibit 3, below, for a map of the country, indicating the Bayankhongor aimag. All participating schools were public schools. It is important to note that all IIREM and control soum schools were 9-grade schools. Therefore they, on average, have considerably fewer students than 11-grade schools. Given the per-capita school funding model in Mongolia, 9-grade schools therefore have significantly less resources available than 11-grade schools. In addition, as indicated in Chapter III, Education System Context, above, funding levels per child are different among the three levels (primary, secondary, and high) and increase toward the higher grades, which further contributes to the fact that 11-grade schools, in general, are more affluent than 9-grade schools. All participating SEDP schools were 11-grade schools. IIREM soum schools had an average of 401 students per school, SEDP schools 652 students, and participating soum control schools, which are also all 9-grade schools, 438 students. Ideally, for study purposes, SEDP schools selected also should have been 9-grade schools; however, SEDP had been nearly exclusively supporting 11-grade schools, and no 9-grade SEDP schools were available to include into the sample. More detail on the selection process is provided in Chapter VII, Study Methodology, below.
A. IIREM Schools 95. School No. 2, Nomgon of Bayankhongor aimag. This school functioned as the mentor school under the IIREM project. The school has 3,327 students and 102 teachers. One of the main strategic objectives of the school is the use of ICT in education. The school’s computer lab has 14 computers and each pedagogical unit has one PC at its disposal. The school had also received three laptop computers under IIREM for teachers to use. In the near future, the school will be connected to the Internet via fiber optic cables. In 2000, the school participated in a project funded by the Soros Foundation and took part in a series of trainings on innovative teaching. According to the results of student standardized exams, the school is among the top schools in the aimag in overall scores (with a 60.9% average score exceeding the aimag average of 58.7%),and in the middle for scores in mathematics (58%) and Mongolian language (60.3%).39 This school is an 11-grade school. The school management strongly supports ICT in education in every way, and some of the teachers from participating IIREM and SEDP schools are among the most active in innovating and exploring new teaching methodologies with ICT.
39 The aimag average was 59.2% in mathematics, and 58.2% in Mongolian language. The aimag-wide average score
across all tested grade 11 subjects was 58.7%.

30
Exhibit 3. Location of Study Schools in Mongolia40
96. Secondary School of Bumbugur Soum of Bayankhongor Aimag. The school is a 9-grade school, located about 100 km from the aimag center. It has 474 students and 21 teachers. Eight students in the soum are considered to be dropouts. Student achievement at this school is very high, with students scoring an average of 79.9%41 in the last grade 9 final exams. The soum has no electricity, but uses the diesel generator supplied by IIREM. Half of the teachers participating in the study were former IIREM teachers; the other half came on board for this study, but were supported by their peers. The average age among participating teachers was quite young, about 27 years old. The school was one of the most engaged schools under IIREM. Due to a change of school principal at the beginning of this study, however, the teachers’ engagement had wavered a bit. There seem to have been issues with priorities, e.g., on utilization of the diesel generator. Meanwhile, however, these issues have been solved. The core team of study teachers at Bumbugur school has trained not only its own peers, but also teachers of other schools in the neighboring soum of Baacagaan. They hosted Baacagaan soum teachers at their school and organized training for them. The Bumbugur school has nine computers, but only three of them function. The school does not have Internet, and even the telecommunication office’s line does not support dial-up connection. Therefore, the school’s teachers used to travel to the aimag center in order to exchange e-mails. The school administration aims to increase the number of computers and integrate ICT in classroom teaching.
40 Based on UN Map Mongolia, Map No. 3721 Rev. 3, January 2000. 41 Nine-grade secondary schools and 11-grade high schools have different exams; therefore, results from
participating 9-grade soum schools are not comparable to those of the three participating aimag centers or any of the SEDP schools.
Bayankhongor province
Ulaanbaatar

31
97. Secondary School of Jinst Soum of Bayankhongor Aimag. Jinst is a 9-grade school located about 90 km to the south of the aimag center. The school was the smallest in the study, with 287 students and 18 teachers. The school, however, has some of the most engaged teachers—regional ICT in education “champions.” Nearly all teachers of this school learned to use ICT in education and started to collect their e-materials on CDs. The school has 14 functioning computers, an LCD projector, a digital camera, and the diesel generator provided by IIREM. There are five students considered to be dropouts in this soum. The school’s students scored 79.1% in the last grade 9 final exams. While many of the schools’ younger teachers participated in IIREM, some of the older teachers, and the older training manager, became very engaged under this study as well. The school’s teachers, as in Bumbugur, have been active in sharing their knowledge, experience, and training at the neighboring soum high school in Bogd.
98. Secondary School of Baacagaan Soum of Bayankhongor. The school is a 9-grade school located about 110 km to the southwest of the aimag center. It has 444 students and 24 teachers. The school experienced difficulties under IIREM, some of them due to inappropriate management decisions. Instead of focusing on a few core teachers, the school tried to introduce all of its teachers at once to ICT; however, only one laptop was available to share. With 24 teachers sharing a laptop, individual exposure was extremely limited, and impact on teacher capacity and teaching practice was therefore low. In addition, due to former debts, the school had financial difficulties. However, the school now has a new principal. Study participants from Baacagaan were on average a bit older than those from other participating schools. Average student achievement was 74.3% in the last grade 9 final exam. The school has five computers in the computer lab, but out of the total of six computers at the school, only three are functioning. The school’s informatics teacher functioned as the trainer of trainers for its peers under this study. Five students were reported as dropouts in this soum.
B. SEDP Schools 99. School No. 1, Nomyn Dalai of Bayankhongor Aimag. The school is an 11-grade high school including secondary and primary grades. The school is the only school in the aimag center with a student dormitory. The school has 2,476 students and 102 teachers. It recently celebrated its 50-year anniversary. Overall, the school seems to have teachers who are notably strong in teaching methodology. School No. 1 has 24 computers, 20 of which are functioning. Five of the computers, a printer, and some related equipment (switch, UPS) were provided to the school under SEDP in 2004. The school management opened a new computer room for teachers and a special computer room for teachers participating in the study. They also established another team of teachers with a focus on ICT in education, who were sharing and learning together with the teachers who were directly participating in this study. Students’ achievements according to the state exams were a little bit lower than aimag average, at 57.8%.42 Results in mathematics were 59% and in Mongolian language 57.2%. The school has an engaged informatics teacher. The school’s training manager used to be the informatics teacher for the school, and is very engaged, helping other teachers with technology.
100. High School of Bayancagaan. This school, established in 1940, has 36 teachers and 917 students, and is located about 170 km from the aimag center. As an 11-grade high school, this school offers primary, secondary, and high school levels. The school functions as a regional center school for the Amarbuyant region, which covers the Bayan-Under and Shinejinst soums. The soum administration was reported to be very supportive of this study. The participating teachers were of varying ages, but on average had very low initial computer skills. The school 42 The aimag average was 59.2% in mathematics, and 58.2% in Mongolian language. The aimag-wide average score
across all tested grade 11 subjects was 58.7%.

32
has seven computers, but only two of them are functioning. Six teachers reported they have computers at home, some of whom had bought their computer after participating in the training conducted under this study in August 2006. Student achievement at this school was a bit higher than the aimag average at 63% in mathematics and 60% in Mongolian languages, with an average score of 60.3%. The informatics teacher has limited computer knowledge. There are nine students considered dropouts.
101. High School of Jargalant. Jargalant school has 702 students and 29 teachers, and is an 11-grade school. The school has big solar panels, which supply electricity for the computer lab. The school is located about 170 km from the aimag center. The solar panels were temporarily broken during the implementation of the study, however. The school has 14 computers, seven of which function. There seem to have been a few issues at the beginning of the study, when the project-supplied laptop was mainly used by the school management for different purposes, rather than by the teachers who were supposed to use it for capacity building and teaching. The soum public telecommunications office is comparatively bigger than that in other soums and the telephone line functions well. However, dial-up connection was not supported by this line. After the second training conducted under this study, which took place directly at the school, some organizational issues had been resolved, and the school administration and teachers seemed to make significant progress in using and integrating ICT. There were several teachers who had comparatively good computer skills to start with. The school reported 11 dropout students. Student achievement at the school was 57% in mathematics and 60% in Mongolian languages. These results are, compared to the aimag average, slightly higher in Mongolian language and slightly lower in mathematics; the school’s average score of 57.6% being slightly below the aimag average.
102. High School of Buucagaan. The 11-grade school has 602 students and 29 teachers, and is located 170 km from the aimag center. The school administration is attentive and has created a pleasant environment for study. The school uses a diesel generator to generate power and does not have an Internet connection. During the IIREM project, the school was very actively engaged and was eager to participate. Teachers from this school voluntarily participated in one of the ICT in education training activities. The school currently reports 10 dropout students. The school has 13 computers, but only two seem to function. Five computers, a printer, and related accessories had been provided to the school under SEDP in 2003. Student achievement in mathematics was 59.7% and 61% in Mongolian language, which is slightly higher than the aimag average. The school’s average score is 59.3%. The school has a plan to promote ICT integration into education for all teachers of the school using handouts provided under this study and participating teachers as trainers of trainers.
C. Control Schools 103. School No. 3, Erdenemandal High School of Bayankhongor Aimag. The school is an 11-grade high school, including secondary and primary grades, located in the aimag center. It has 2,748 students and 107 teachers. The school has 18 computers, of which 15 are operational. Ten computers were provided to Erdenemandal through the Aimag Wide Area Network project of Mongolian Foundation for Open Society (Soros Foundation). Overall achievement according to the state exams was just a little below the aimag average, at 58.3%. The results in history, math, and geography were slightly higher than the aimag average.
104. Secondary School of Bayan-Under. The school offers 9 grades. It has 23 teachers and 576 students. It is located 276 km from the aimag center. The school has nine computers and all of them are operational. All computers are located in teachers’ rooms. The school participated in a Danish International Development Assistance (DANIDA) education project and

33
received extensive support from DANIDA on issues of teaching methodology. In the teachers’ rooms, teachers work on development of training plans, materials, and visual materials to be used in the classroom.
105. Secondary School of Khureemaral. Khureemaral is a 9-grade school located in the Khangai region. It has 19 teachers and 355 students. The school is located approximately 210 km from the aimag center, Bayankhongor. The school has two buildings: one for primary education and the one for secondary education. It has a two-story dormitory, but most of it is not used. The school has 12 computers, 11 functional—10 of which are located in the computer room with the remaining one used by an accountant. The school uses a diesel generator and wind power to generate electricity.
106. Secondary School of Zag. Zag is a 9-grade school at a distance of about 200 km from the aimag center. It has 20 teachers and 383 students. The school has a double shift of classes, one in the morning and one in the afternoon. The school has 14 computers, out of which eight are working. Currently, the school gets its electricity from the Baidrag soum. However, because the soum has one diesel generator as the main source of electricity, electricity for the school is restricted to 4 hours daily. It is supplied from October through May. The soum is to be connected to the central electricity system in 2008. Most of these eight computers are located in the computer room, and a few are used by the training manager, the school’s social worker, and the math teacher.
VII. STUDY METHODOLOGY
107. The study aimed to provide an account and documentation of lessons learned, good practices, and successful approaches to integrating ICT into education. Early discussions, classroom observations, and focus groups in a number of IIREM schools in Bayankhongor indicated that teachers and school management observed a variety of changes in areas of teaching and among teachers. They reported an increased level of collaboration, increased focus and time spent on lesson planning, increased alternatives for classroom management, and new forms of student engagement, as well as increased production, improvement, and information research related to teaching and learning materials. Because of an early decision to focus evaluation of outcomes on teachers, these observations led to an interest in exploring a variety of variables and indicators that international research has attributed to teaching quality, including some of those mentioned above. Research questions were designed in this regard. As outlined below, research questions focused on e-resource initiatives, which was the original task of this study component. However, given the low weight ultimately assigned to electronic teaching and learning materials in both projects in Mongolia, especially under SEDP, the study also included elements of ICT integration that go beyond a focus on electronic teaching and learning materials. The following two research questions guided this study:
108. (1) Are there differences to be noted on indicators of teaching quality in schools that featured an e-resource initiative compared to schools that did not?
109. (2) Do e-resources address specific needs or challenges of rural/remote schools?
A. Research Design 110. Via a quasi-experimental (control/implementation) research design, the study aimed to find out if the e-resource initiatives in general had a positive impact on selected indicators of education quality, specifically in areas of teaching. Via in-depth case studies in implementation
34
schools, the study identified specific components or experiences from these initiatives that were perceived as successful by the school manager, teachers, students, and parents. Information was also collected to explain the presence or absence of differences between control and implementation schools and to catalogue drivers and obstacles to ICT integration into teaching and learning. Via the case studies, the study identified and described changes and issues in implementation schools that were not captured in the control/implementation research component.
111. The three-group study design featured one control group and two implementation groups, each group including four schools. The implementation groups differed only in the time they had had specific ICT equipment at the schools and the amount of training they received on using it and integrating it into their classrooms. The first group (implementation), called IIREM group, is characterized by participation in both IIREM training and the professional development and training activities conducted under this study, as outlined in Chapter IV, SEDP and IIREM Projects Overview and Chapter V, Study Activities, above.43 These four schools, therefore, have had equipment since November 2005 (from page 7 of footnote 37). IIREM teachers had training on the use of the equipment throughout 2005 and 2006. The second group (implementation), called SEDP group, is characterized by participation only in SEDP and study activities. To clarify, participation in SEDP activities does not necessarily mean that teachers actively participated in any interventions, but it does mean that they came from schools that benefited from SEDP, mainly via the provision of a few computers for their computer rooms. As described in Chapter V, Study Activities, above, this group participated in activities of this study (Training Nos. 1–3) and received the same set of equipment the IIREM schools had received. The control group schools did not receive any training or equipment under this study in advance of data collection.
112. The study primarily focused on selected teachers in the 12 study schools and used data collected from students, parents, and school managers to triangulate results and to provide more in-depth insights.
B. School Selection 113. Schools in Mongolia were selected via stratified sampling (aimag location, ADB project school, distance from aimag center). The aimag of Bayankhongor, with the aimag capital (Bayankhongor), was selected for a number of reasons. First, Bayankhongor is one of the most challenged aimags in the country when it comes to communication and road infrastructure. It is also considered one of the poorest in the country, with a large part of the population being herders. In addition, the aimag is about 680 km away from Ulaanbaatar, so despite being remote and rural, it is reachable within a one-day car ride (10–12 hours) from the capital. The isolated location of the schools in this aimag was another reason for its selection. In addition, the mix of IIREM, SEDP, and control schools that was possible to sample from this aimag’s 25 schools further matched study purposes.
43 Some IIREM teachers have been trained directly by the IIREM team, most notably teachers from the aimag center
school in Bayankhongor, and teachers at the soum levels who functioned as trainers of trainers (TOTs) for their peers. These early trainings, in October 2004 and March 2005, mainly focused on the use of the hardware and software provided, along with some tips on how to use it for instruction in subject matter classes. In March 2006, however, IIREM organized a final training in Ulaanbaatar, which was attended by selected teachers from some of the IIREM schools in the study. This training focused on methodology of ICT integration, and therefore more on the pedagogical aspects of ICT in teaching and learning.

35
114. Location. All schools needed to be from the same province, to control for study group differences due to geographic locations and issue of system level support (schools in each province are supported by a province-level ECD).
115. ADB project schools. Due to limitations on the total number of schools in the province, and the number of ADB project schools per province, the study was only able to include a total of 12 schools. Four schools for each group were to be included; that is, four schools from the IIREM project, four schools from the SEDP project, and four schools selected as control schools.
116. Distance. Three of the schools in each category need to be located between 90 km and 230 km by road from the aimag center to facilitate data collection and support. One school per category was to be located in the provincial capital.
117. With these criteria in hand, the study team stratified the schools by project category, selected the three urban schools, and then randomly selected three rural schools from each category. The final list of schools is the following:
• Four schools from the IIREM project: Nomgon school of Bayankhongor aimag center (School #2), Baatsagaan soum, Bumbugur soum, Jinst soum
• Four schools from SEDP: Nomun Dalai complex school of Bayankhongor aimag center (School #1), Buutsagaan soum, Bayantsagaan soum, Jargalant soum
• Four control schools: Erdenemandal school of Bayankhongor aimag center (School #3), Bayan-Ondor soum, Zag soum, Hureemaral soum
C. Participant Selection 118. Originally three teachers from each of the SEDP and IIREM schools were selected by their principals to participate in the initial professional development activities of the study. The following criteria were applied to teacher selection in each of the eight implementation schools.
1. Subject matter (one teacher from humanities, one teacher from science, one teacher from primary education)
2. Teachers have to have been part of the IIREM interventions at their schools (SEDP did not include teacher-level activities, therefore there was no such criterion for SEDP teacher selection)
3. No teacher should be a teacher of informatics or specialized computer studies classes
4. Teachers should have at least basic computer skills
5. Teachers should be known for their willingness to try out new teaching practices and their interest in professional development
119. These three “champion” teachers from each of the eight implementation schools were invited to participate in the 6-day training in August 2006. Following the training, they were tasked with training another two teachers each in their schools. The October 2006 and April 2007 trainings then also included these teachers.
36
120. For data collection, the study team selected participating teachers by convenience—that is, among teachers who were available on the day of data collection, as long as they had been part of study activities directly or indirectly (through training by the three champion teachers).
121. In advance of data collection, principals had asked all participating teachers in their schools to nominate five students in each of their classes to be part of the study. The principal, with guidance by the researcher team, then sought written parental consent for study participation. From all students available (some of the students had left school early, before the official closing date) and with permission to attend, the researcher team made the final selection for participation in interviews and focus groups. Researchers aimed to achieve a balance between gender and grade level when selecting students within and across the schools. While the adult respondents were asked for permission orally, all participating students were given written permission by a parent, following RTI Institutional Review Board (IRB)44 procedures for protection of human subjects in research.
122. The principal was then asked to help invite some four to six parents to the school on the day of data collection, to participate in a parent focus group.
123. In each of the 12 schools, therefore, the team aimed to select up to 20 respondents: six teachers for individual interviews, nine to 12 students for individual interviews, the school principal, and the training manager. In the eight implementation (IIREM and SEDP) schools, additional focus groups with parents, students, and teachers (four to six of each) were conducted, and school managers participated in extended interviews. Exhibit 4, below, outlines the final number of respondents who participated in individual interviews.
D. Instruments 124. Instruments were developed, drawing on extensive research on internationally available tools, especially on selected dimensions of teaching quality. Given the complexity of the dimensions under investigation, as described in more detail in the following chapter (Chapter VIII), instruments contained a large number of items. However, only three to four questions were open-ended; the remainder provided either answer categories or five- to nine-point scales. The following instruments were developed for the study and applied in study schools:
• Teacher questionnaire. This questionnaire included items on background, training, and professional development, as well as pedagogical support, teaching practice and evaluation/assessment, efficacy, lesson planning and material production, collaboration, job satisfaction and attendance, and access to and use of equipment and materials. It asked questions on ICT-related dimensions, such as attitudes, access, and skills regarding ICT. Finally, it included open-ended questions on school challenges related to its remote location.
44 IRBs must be utilized by all organizations that conduct research involving human subjects. RTI International, as a
US research institute, is required to adhere to the rules outlined in the Code of Federal Regulations. Key criteria of the IRB in evaluating research are the following: (i) The protocol must be evaluated to see if it is scientifically sound and worthwhile, (ii) risks must be minimized to the extent possible, (iii) subjects must be selected in an equitable manner, (iv) informed consent is required, (v) privacy and confidentiality must be protected, and (vi) the study must be adequately monitored. The protocol of this study has been evaluated and approved by the IRB.

37
Exhibit 4. Mongolia – School Sample and Respondents Overview
Schools 1. Teacher questionnaires
2. Student questionnaires
3. Training manager questionnaires
4. School manager questionnaires
1. Erdenemandal, of Bayankhongor aimag School #3 6 11 2 1
2. Bayantsagaan 5 12 1 0 3. Hureemaral 5 9 0 1 4. Jinst 4 12 1 1 5. Nomun dalai complex
school, of Bayankhongor aimag, School #1 6 12 1 1
6. Zag 2 9 1 1 7. Bumbugur 6 9 2 1 8. Baidrag/Jargalant 1 9 1 1 9. Baatsagaan 3 10 1 1 10. Buutsagaan 7 9 1 1 11. Bayn-Undur 6 12 1 1 12. Nomgon of Bayankhongor
aimag, School #2 6 11 1 1 Total = 206 57 125 13 11 Legend: Control IIREM SEDP
• Student questionnaire. The student questionnaire included general background questions; items on teacher methodology, teacher and student use of equipment and materials, and teacher attendance; and attitudes, access, and skills regarding ICT.
• School principal questionnaire. This questionnaire included general background items, questions on school infrastructure, personal and teachers’ use of ICT and related capacity, availability and teacher use of other resources and materials, and questions on ICT financing and procurement, as well as items on the relationship between ICT and education quality. The principal questionnaire also queried the nature of support from the education system at large and principals’ attitude toward ICT. Finally, it included open-ended questions on school challenges related to its remote location.
• Training manager questionnaire. The training manager questionnaire featured questions on general background; teachers’ and teaching practice at the school; items on teaching methods, teacher evaluation practices, and teacher program and lesson planning; and teacher collaboration, motivation, and enthusiasm. The questionnaire asked about challenges related to the school’s remote location, as well as availability and teachers’ use of equipment and materials for teaching and learning. The questionnaire surveyed training managers’ attitudes, access, and skills regarding ICT, as well as teachers’ practice with ICT.

38
125. Furthermore, the study featured a student focus group guide and a teacher focus group guide, focusing on extracting more detailed and qualitative information on a number of dimensions from the questionnaires. A parent focus group guide provided insight into parents’ assessment of quality education, and their knowledge about ICT in general and IIREM or this study in particular. It also queried them on the importance they attribute to the use of ICT in education for their children.
E. Limitations of the Study 126. It is challenging in an educational setting to control the many interrelated variables and factors that affect the impact of an education innovation, such as introducing ICT into teaching and learning. To isolate a clear causal relationship between “input” and “impact” in this context is extremely difficult. Although measuring clear outputs such as number of lessons taught with ICT or number of minutes Internet is used per week may have been easier, the study aimed to explore more comprehensively what early outcomes there may be with regard to selected dimensions. Such dimensions were teacher collaboration, teacher motivation and engagement, program and lesson planning, access to and use of teaching materials, attitudes toward ICT, and others. The complexity of the dimensions also contributed to the fact that questionnaires for interviews—especially with teachers, training managers, and principals—were rather long. However, in practice, interview time with training managers, teachers, and students averaged 35–40 minutes; interview time with the principals did not exceed 60 minutes.
127. Additional limitation concerning the instruments was that the final instruments, as they were applied, could not be tested with a comparable set of teachers in our target region. Given the travel distances and the timeframe of the study, this was not feasible. However, several elements of the questionnaires had already been used in similar form to guide the study site assessment, which included visits to six schools in the same region, and they also were used as part of the study training evaluations. There were two items each in the teacher and training manager questionnaire for which the meaning of a specific question did not seem to have been clear, and data derived were not conclusive (these instances are noted in the presentation of findings in the next chapter (VIII)).
128. Results of the data analysis between implementation and control groups have to be read with care. The overall sample size of 12 participating schools was rather small, and outcomes cannot be generalized to all schools in Mongolia. The 12 schools, however, were selected randomly, once key criteria including remote location and participation/nonparticipation in IIREM or SEDP had been met. Second, the groups were not entirely isolated. There is a rather positive tendency to collaborate and interact, especially among rural schools in the country. A certain “contamination” between groups may therefore have occurred, and could not be controlled for in the study design. For example, the research team found out that a participating IIREM school had actually supported a participating SEDP school on several occasions by sending teachers to share their experiences with ICT and to provide training to the school.
129. At the time of data collection—end of May 2007—the schools were just closing for vacation, following a period of intense examinations. Some staff and students had left schools even ahead of this date. Therefore, it was not always possible to get the targeted number of respondents in each school. In addition, some principals and training managers were traveling between aimag center and soum to finalize results of the grade 9 graduation exams and enroll grade 9 graduates in the schools in the aimag center. The study team was able to interview some of the principals and training managers directly in the aimag center, however, which contributed to achieving inclusion of all key respondent groups as intended.
39
VIII. STUDY FINDINGS AND DISCUSSION
130. Data collection was conducted from May 30 to June 11, 2007. The team visited the three participating aimag center schools and the nine soum schools in the Bayankhongor aimag. As indicated in Exhibit 4, above, interviews were conducted with a total of 206 respondents. In addition, focus group discussions were held with over 71 parents, 70 students, and 70 teachers at participating schools.
A. Overview of Data Analysis 131. In regard to Research Question 1, “Are there differences to be noted on indicators of teaching quality in schools that featured an e-resource initiative compared to schools that did not?,” data analysis was conducted on two levels: first, responses to individual questions or sections of the questionnaire were analyzed in detail, comparing findings from implementation schools (IIREM and SEDP groups) with the control group to explore possible differences; second, responses by the two implementation groups (IIREM and SEDP) were compared. This second analysis aimed to identify differences between the two groups that may be explained by one group (IIREM) having received more training and having had longer time with the equipment than the other (SEDP). In general, data analysis focused on describing the responses of study participants. Where appropriate, statistical significance of the differences observed was investigated.
132. To answer Research Question 1, and focusing on the teacher as the unit of assessment, some general dimensions of teaching quality have been explored.
• Teacher pedagogical support
• Teacher teaching practice and evaluation/assessment
• Teacher efficacy
• Teacher lesson planning and material production
• Teacher collaboration
• Teacher job satisfaction and attendance
• Teacher access to and use of equipment and materials
133. In addition, a number of ICT-specific dimensions have been researched, not only for teachers, but also for students, training managers, principals, and the school as a whole. These dimensions are:
• School ICT environment
• Attitudes, access, and ICT skills
• School system support
• School financing and procurement
• Parent engagement and ICT

40
134. To answer Research Question 2, personal interviews and focus groups were conducted in SEDP and IIREM schools, and data from those two sources analyzed.
B. Overview of the Respondents 135. Teachers. Originally 58 teachers were interviewed for the study: 19 from IIREM schools, 19 from SEDP schools, and 20 from the four control schools. One IIREM teacher interviewed, however, turned out to be a computer studies teacher. This entry has subsequently been excluded from the data analysis as one criterion for selection was that study teachers were not supposed to be specialized in computer studies. Overall, 25% of the participants were men, 75% women. In the control group, however, only 10% of participating teachers were male, compared to 39% and 26% for IIREM and SEDP, respectively.
136. Reviewing levels of experience showed that participating IIREM teachers were the least experienced, with 72% of them having taught for less than 10 years; 53% of SEDP teachers and 60% of control group teachers reported a similar amount of years in their profession. Six percent of IIREM teachers had more than 20 years of teaching experience, compared to 20% from SEDP and 30% of control group teachers.
137. Many of the participating teachers received some ICT-related training during their university studies, but the focus was mostly on the provision of basic computer skills. Fifty-seven percent of control school teachers did not receive any such professional development during their pre-service training compared to 25% of SEDP and 21% of IIREM teachers.45 All participating IIREM and SEDP teachers confirmed having received ICT-related training during in-service professional development, which should be the case due to their participation in the study. More than 80% of control school teachers, however, reported not having received any in-service training on ICT-related topics at all. In-service professional development, according to responding teachers, did focus on both computer skills and the methodological integration of ICT into teaching and learning.
138. Training Managers. The study also included responses from 13 training managers, five from IIREM schools and four each from SEDP and control schools. With a rather large in-group variance, IIREM and SEDP training managers had been in their positions for 5 years on average, control school training managers for about 6 years. Only two out of the five training managers from IIREM schools were still teaching, compared to three out of four SEDP and all control school training managers. Two of the training managers from control schools and SEDP schools and one IIREM school training manager had a doctorate degree; all other training managers had at least a 4-year university degree, if not a master’s degree. Except for one in each of the three groups, all of them had gotten some basic ICT-related pre-service training while at university. All except one also had participated in ICT-related in-service training. Most of the IIREM and SEDP training managers who participated in the study received a combination of both computer skills and methodological skills on ICT integration. Control school training managers’ courses mostly were on computer skills, with a few also mentioning methodological skills.
45 A possible explanation for this large amount of control school teachers not having received any ICT-related training
during pre-service education may be their age. ICT-related training only had to be included in teachers’ pre-service professional development in recent years, specifically starting in 2002 with the adoption of the new education law, which means that many of the older teachers were never exposed to ICT during their own education. This may also make them less likely candidates for in-service professional development, compared to their younger counterparts.

41
139. Principals. Eleven principals were interviewed, of whom four were from IIREM schools, three from SEDP schools, and four from control schools. All principals at IIREM and control schools were male, as were all except one principal at a SEDP school. The respondents had been working as principals on average for at least 7 years in IIREM and control schools and for 10 years in SEDP schools. Only one IIREM school principal was still teaching. None of the SEDP school principals was teaching in addition to the management role. Notably, all control school principals except for one were teaching between 1 and 10 hours a week. All principals from all three groups graduated in the early 1980s and had about the same number of years of teaching experience. Fifty percent of IIREM principals had a university degree, and 50% master’s degrees. All principals of SEDP schools had a master’s degree. Seventy-five percent of control school principals had a university degree, and one had a master’s degree.
140. Students. There were 125 students across the 12 schools participating in the study. Out of these, 74 were female (56%) and 51 were male (44%). Students were evenly divided among the IIREM, SEDP, and control schools.
C. Findings on Research Question 1 141. In the sections below, findings on the different dimensions of teaching quality and ICT are presented in order to answer Research Question 1: “Are there differences to be noted on indicators of teaching quality in schools that featured an e-resource initiative compared to schools that did not?”
1. Teacher Pedagogical Support
142. In the study, most of both IIREM and control group teachers report that their training manager or principal observes their classes at a frequency of a few times per year. In SEDP schools this practice is more common, with more than half of the teachers interviewed reporting classroom observations on a monthly basis. A large proportion of control school teachers, 40%, report classroom observations take place only once a year or never. This makes classroom observations significantly less likely in control schools compared to the other schools. Only 11% of IIREM teachers and about 16% of SEDP teachers state that their principals or training managers observe their classes once a year or less. In none of the participating schools are classes observed more regularly than once a month.
143. SEDP teachers report most frequent review of lesson plans, etc., by training managers and principals. Nearly half of them say that such reviews take place once a week or more often, compared to 16% of IIREM and 30% of control school teachers. Principals and training managers in IIREM schools mostly tend to review teachers’ documentation a few times per month. Most of the responding control school teachers report review once a month.
144. Teachers across all three groups agree that if they have pedagogical difficulties and need support, they mostly turn to other teachers at their schools and confer casually with them to get assistance. Nearly two-thirds of IIREM teachers prefer this source for assistance. One-third of SEDP and control group teachers, compared to only 17% of IIREM teachers, also turn to their training managers for support.
145. Summary. Classroom observations and review of lesson plans and documentation are important tools to provide teachers with feedback, as well as pedagogical support. Data analysis shows that classes of teachers in control schools are significantly less likely to be observed by their training managers or principals than classrooms of IIREM and SEDP teachers and for most of them does not take place more than once a year. Furthermore, control school teachers’

42
lessons plans and other documentation are reviewed considerably less frequently than those of the participating IIREM and SEDP teachers—for the majority of them, less than once a month. At the same time, teachers from all three groups mostly turn to their colleagues for support and guidance on specific challenges or questions they face. Data from this dimension suggest that control school teachers receive considerably less pedagogical support than their peers in schools that participated in e-resource initiatives.
146. Discussion. It is not surprising that most IIREM teachers turn to peers for support. This confirms outcomes of interviews, focus groups, and casual discussions with teachers. It is uncertain whether this strong teacher-to-teacher support system and the rather limited use of training managers for assistance have anything to do with ICT initiatives carried out at those schools. However, if there is a linkage, then a possible explanation may be that during IIREM, training managers were not involved in activities. For any issues or assistance with ICT in education, IIREM teachers only had their peers to draw on in addition to the project team. Training managers were included in activities of this study, however, and training sessions were conducted specifically for them (many together with teachers). Also, trainings under this study addressed issues of organizational integration of ICT into schools, standards of ICT competencies for teachers and administrators, and evaluation of teaching practice with ICT. Training on basic computer skills was provided for all training managers, and especially for teachers from SEDP schools (participating IIREM teachers already had basic computer skills and were assisting their SEDP counterparts in these sessions). Data shows that SEDP school teachers who started their professional development and ICT engagement together with their training managers during this study are more likely to turn to them for assistance. This interview question, however, did not specify assistance for ICT, but instead addressed pedagogical issues in general; there are certainly a great number of factors that influence teachers’ practices and behavior in this regard. At the same time, it is rather striking that more than double the amount of SEDP and control school teachers report turning to their training managers for support than IIREM teachers do. This may be an area where future research can shed some more light, given the critical position training managers have in the day-to-day teaching and learning practices at Mongolian schools.
147. Pedagogical support and the role of school management in relation to ICT integration are discussed in more detail in Section VIII.D.5, Resources and Guidance on ICT.
2. Teaching Practice and Evaluation/Assessment
148. Teaching Practice. In order to gain more insight into teaching methodology and instructional practices, teachers were presented with a set of statements to respond to, some of which exemplify rather traditional, teacher-centered teaching methods, others indicating a more student-centered and constructivist approach. A comparison of findings did not yield any significant differences between teachers. Training managers and students of the participating schools had also been asked to assess their teachers’ frequency of utilization of each of the methods presented. Findings were compared. While responses on specific questions may vary and sometimes training managers’ and students’ responses did not exactly map with teachers’ self-assessment, overall, the patterns established by the teachers was confirmed: there were no significant differences between teachers of the three groups on this dimension. This indicates that there are no significant differences in teaching methods utilized between those teachers who participated in the e-resource initiatives under investigation and those who did not.
149. As stated, the overall pattern and results did not yield any significant differences, but responses to some individual statements differed. Responses to the statement “The whole class

43
repeats sentences that I say first,” for example, are very varied, not only between groups, but also within groups. Most teachers state that they use this method only every few days in their classrooms. However, 40% of control school teachers and a third of IIREM teachers tend to have their students repeat sentences that they say first at least once a day or even every class. Only 16% of SEDP teachers use this method once a day; more than 60% of them use it never or only a few times per year. One-third of the control school teachers use this method this rarely, and 6% of IIREM teachers. Their students however, do not entirely agree with teachers’ self-assessments: more than 40% of IIREM students, compared to 19% of SEDP and 37% of control school students, say that their teachers use this method less than a few times per year. Responses from teachers, however, indicate that SEDP teachers consider themselves much less likely to apply this rather traditional teaching method in their classroom than IIREM and control school counterparts. Exhibit 5 provides an overview of the teachers’ responses (IIREM n=18, SEDP n=19, control n=20).
Exhibit 5. Teachers’ Responses to “The whole class repeats sentences that I say first”
6%
0%
22%
39%
22%
11%
21%
42%
5%
16% 16%
0%
30%
0%
20%
10%
15%
25%
0%
5%
10%
15%
20%
25%
30%
35%
40%
45%
Never (1) A few times ayear (2)
Once or twicea month (3)
Every fewdays (4)
Once a day(5)
Every class(6)
Q24
IIREM SEDP Control
150. Second, details of the statement “Students explain how they have gone about solving a problem” were analyzed (see Exhibit 6; IIREM n=18, SEDP n=19, control n=20). Thirty-nine percent of teachers on average state that they apply this method in every one of their classes. IIREM teachers equally utilize this method “every class” or “every few days.” Most of the responding SEDP teachers apply this teaching method in every one of their classes, and only some use it every few days. Control school teachers mostly let their students explain every few days how they have gone about solving a problem. A fifth of control school teachers use the method once a day and an equal number of responses was recorded for every class. The results show a significant difference between teachers who participated in e-resources initiatives and those who did not. The difference is extremely pronounced due to the responses of the SEDP teachers, who make use of this method most often. This means that there is good reason to believe that teachers who participated in e-resources initiatives are significantly more likely to let students explain how they have gone about solving a problem than control school teachers. There is no significant difference between responses of IIREM and SEDP teachers.
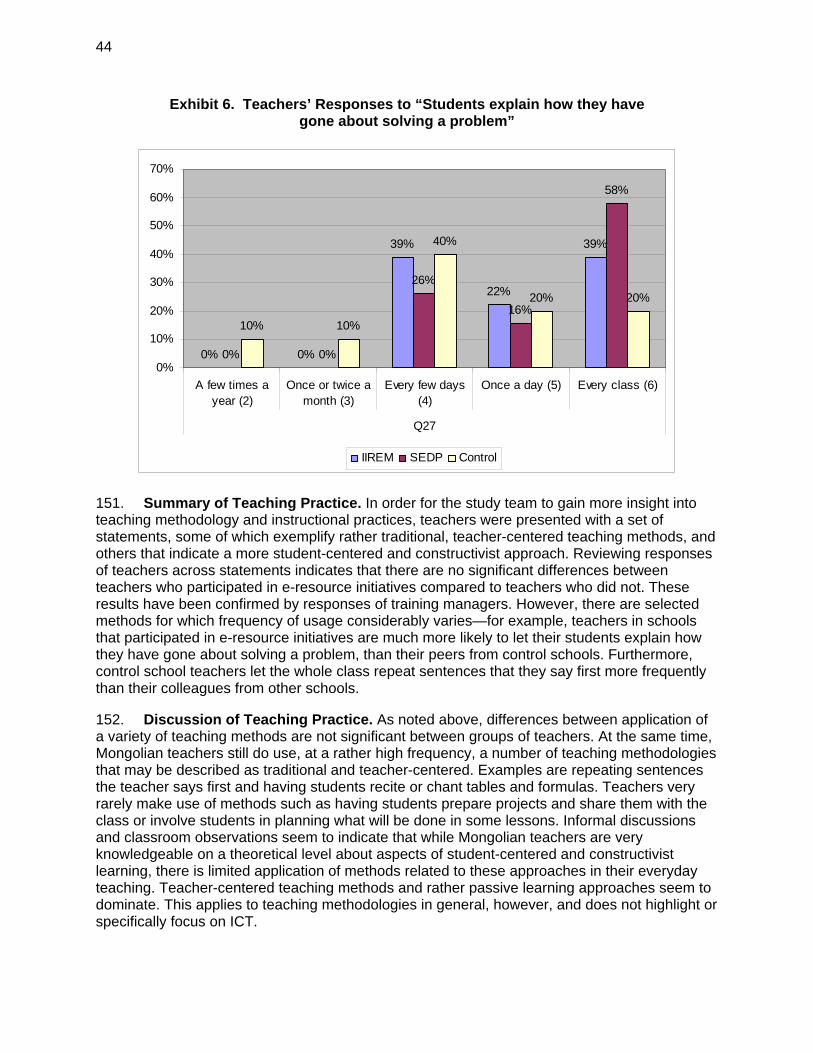
44
Exhibit 6. Teachers’ Responses to “Students explain how they have gone about solving a problem”
0% 0%
39%
22%
39%
0% 0%
26%
16%
58%
10% 10%
40%
20% 20%
0%
10%
20%
30%
40%
50%
60%
70%
A few times ayear (2)
Once or twice amonth (3)
Every few days(4)
Once a day (5) Every class (6)
Q27
IIREM SEDP Control
151. Summary of Teaching Practice. In order for the study team to gain more insight into teaching methodology and instructional practices, teachers were presented with a set of statements, some of which exemplify rather traditional, teacher-centered teaching methods, and others that indicate a more student-centered and constructivist approach. Reviewing responses of teachers across statements indicates that there are no significant differences between teachers who participated in e-resource initiatives compared to teachers who did not. These results have been confirmed by responses of training managers. However, there are selected methods for which frequency of usage considerably varies—for example, teachers in schools that participated in e-resource initiatives are much more likely to let their students explain how they have gone about solving a problem, than their peers from control schools. Furthermore, control school teachers let the whole class repeat sentences that they say first more frequently than their colleagues from other schools.
152. Discussion of Teaching Practice. As noted above, differences between application of a variety of teaching methods are not significant between groups of teachers. At the same time, Mongolian teachers still do use, at a rather high frequency, a number of teaching methodologies that may be described as traditional and teacher-centered. Examples are repeating sentences the teacher says first and having students recite or chant tables and formulas. Teachers very rarely make use of methods such as having students prepare projects and share them with the class or involve students in planning what will be done in some lessons. Informal discussions and classroom observations seem to indicate that while Mongolian teachers are very knowledgeable on a theoretical level about aspects of student-centered and constructivist learning, there is limited application of methods related to these approaches in their everyday teaching. Teacher-centered teaching methods and rather passive learning approaches seem to dominate. This applies to teaching methodologies in general, however, and does not highlight or specifically focus on ICT.

45
153. Future support initiatives, therefore, may need to strengthen this critical aspect and help teachers to better translate their theoretical knowledge on student-centered learning into practical models for their classrooms—whether they focus on or integrate ICT or not.
154. Student Evaluation/Assessment. Responses of teachers regarding how they are using results from student assessments yielded the following results. Most IIREM teachers use results to group students by ability, and, to a lesser extent, to improve their teaching methods. SEDP teachers report using such results primarily for informing parents or the school about the child’s progress, in addition to grouping students by ability. Both IIREM and SEDP teachers use results of student assessments to improve their teaching methods. Among control school teachers, however, responses were more evenly spread. These teachers state that they use results from student assessments primarily to give marks, and secondarily to inform parents or the school about the child’s progress. Control school teachers use results to a lesser extent for improving their teaching practice. More control school teachers mention using results to decide about students’ retention and promotion than IIREM or SEDP counterparts. Exhibit 7, below, provides an overview of the responses given (more than one response was possible; IIREM n=18, SEDP n=19, control n=20).
Exhibit 7. Teachers’ Responses to Question of How They Use Results of Student Assessments
IIREM SEDP Control Q 127 – Answers counts counts counts
Giving marks 3 7 11Informing parents or the school about the child's progress 7 12 9Preparing the next lesson 3 2 2Improving my teaching methods 9 10 8Deciding about student retention and promotion 3 3 6Grouping students by ability 14 12 8Other – to encourage and support a student 1 2 0
155. Drawing on another data point, a statement from the teacher efficacy scale was selected and analyzed. Teachers were asked to respond to the level to which they think they can use a variety of assessment strategies. While most of teachers across groups responded rather optimistically, stating that they have quite a bit of control or ability, more than a third of control school teachers rate themselves on a lower level. According to them, they have only some or very little ability in this area. Exhibit 8, below, illustrates this point (IIREM n=18, SEDP n=18, control n=20).

46
Exhibit 8. Teachers’ Responses to “How much can you use a variety of assessment strategies?”
6% 6%
56%
6%
28%
0%
16%
63%
0%
21%
11%
21%
58%
0%
11%
0%
10%
20%
30%
40%
50%
60%
70%
Very little (3) Some (5) Quite a bit (7) (8) A great deal (9)
Q50
IIREM SEDP Control
156. Summary. Participating teachers report several different ways of using results from student assessments. Least likely among them is using results to prepare the next lesson or to decide about student retention. A great many teachers use results to group students by ability. While differences are not significant among the three groups of teachers, control school teachers use results to a lesser extent for improving their teaching practice. More significantly, however, control school teachers feel less confident about their capacity to employ a variety of assessment strategies, compared to their counterparts in IIREM and SEDP schools.
157. Discussion of Student Evaluation/Assessment. Results in this area are rather interesting and may require further, more detailed, and focused research. It is interesting to note that teachers from control schools are more likely to choose using results for “giving marks” and “informing parents or the school about the child’s progress,” over other, possibly more reflective approaches, such as using student assessment results to improve their own teaching methods. Such approaches are more commonly used by IIREM and SEDP teachers. Assessment and evaluation of students and related practices play an important role in the teaching and learning process. While during the study, participating IIREM and SEDP teachers needed to reflect intensively on their own teaching practice and methods,46 none of the ICT initiatives in the country, as of yet, has addressed issues of student evaluation and assessment in relation to the use of ICT in teaching and learning. Given the findings on this subdimension on teaching quality, it may be informative to investigate this aspect further.
158. Teacher Evaluation and Assessment. Training managers were asked about their evaluation practices of teachers. All training managers except one (SEDP) confirmed that they conduct annual performance appraisals at their schools. Most of the participating training managers use the teacher performance criteria developed by the ECD, but they feel that these 46 The focus of these reflective activities, however, was directed to didactic and pedagogic considerations related to
use of ICT in the classroom.

47
are outdated. Training managers and teachers have similar views of what seem to be the characteristics of a good teacher. For most of the training managers in IIREM and control schools, this is mainly the following: student grades, experience, and the teacher getting along well with everyone. For training managers in SEDP schools, student marks do not seem to play such an important role. Their responses were mainly getting along well with everyone and having experience. One SEDP and one control school training manager also believe that seniority plays a role. Teachers in IIREM schools mainly believe that experience and getting along well are the two main criteria. SEDP teachers think experience and students’ marks are most important. Control school teachers, however, first state experience, then seniority and getting along well with everybody. Control school teachers are, therefore, much more convinced than their counterparts from e-resources initiatives that seniority plays a role in teacher performance evaluation.
159. Drawing on the findings of a related statement from the teacher job satisfaction subscale, teachers in control schools are much less satisfied with the procedures for teacher performance evaluation than their peers from SEDP or IIREM schools. Thirty-nine percent of control school teachers do not find performance evaluation procedures at their school satisfactory. Only 33% of control school teachers think they are satisfactory, compared to 44% of IIREM teachers and 56% of SEDP teachers, who not only agree but even strongly agree that procedures of teacher performance evaluation at their schools are satisfactory. Exhibit 9, below, illustrates the teachers’ responses (IIREM n=18, SEDP n=18, control n=18).
Exhibit 9. Teachers’ Responses to “The procedures for teacher performance evaluation are satisfactory”
0%
22%
33%
44%
0%0%
28%
17%
50%
6%6%
33%28%
33%
0%0%
10%
20%
30%
40%
50%
60%
Stronglydisagree (1)
Disagree (2) Undecided (3) Agree (4) Strongly Agree(5)
Q77
IIREM SEDP Control
160. To provide more contextual and qualitative insights into how school managers define not only a good school, but also a good teacher, principals’ responses in this area were sought. Responses between groups vary only moderately. The following were some of the principals’ responses on how they would define a good teacher:
• Can deliver the required education
• Provides 100% of knowledge to the students

48
• Has a heart for students
• Has good methodological skills
• Has good communication skills
• Is always on time and follows teachers’ rules
• Shows initiative; is an active teacher
161. Responses from principals were sought with regard to how they would define a good school. The following were cited as elements of a good school by principals from IIREM, SEDP, and control schools.
• High-quality education is delivered to students
• Teachers can teach in a favorable environment with good spirit
• Teachers are taking initiative and are willing to learn new things
• There is good teamwork among teachers and good democracy
• The school is not just a place where tables and chairs are collected, but a place where the doors are open for everyone to see that students are developing
• There is a favorable environment for students to study
• School output is of good quality
• Students are knowledgeable and are meeting standards
• Teachers perform as professionals
• The school has good support from the community and NGOs
• Students are creative and have good communication skills
162. Summary of Teacher Evaluation/Assessment. Qualitative definitions of a “good teacher” by school principals do not differ very much between groups, and neither do training managers’ accounts of criteria of teacher performance evaluations. Training managers mainly state “student grades,” “getting along well with everyone,” and “experience” as the three main criteria playing a role in such evaluations. Teachers in control schools, however, are more likely to state that “seniority” plays a role in teacher performance evaluations than their peers from IIREM and SEDP schools. In addition, teachers from control schools are significantly less satisfied with the procedures of teacher performance evaluation at their school than IIREM or SEDP teachers.
163. Discussion of Teacher Evaluation/Assessment. The way teacher performance is evaluated and the criteria applied can be an important incentive for promoting innovation and change among teachers and in schools. Dissatisfaction with the existing system of teacher performance evaluation, coupled with the fact that innovation is not being valued and appreciated in a school, are clear barriers to ICT integration. This may hamper teachers in

49
control schools, who seem to share this experience, in their attempts to apply new tools, approaches, and practices in their teaching.
164. During the study, extensive discussions were conducted with training managers from IIREM and SEDP schools about evaluating teaching practice that incorporates ICT. Prior to this were individual interviews with selected training managers that indicated teachers earn a favorable evaluation just for the use of ICT in teaching, without discriminating how well ICT is actually being integrated into pedagogy and lesson objectives and whether it was appropriate given the availability of other teaching and learning aids. Most of the training managers interviewed apply the ECD criteria, specifically the “use of materials and products” criteria. Discussions with some training managers showed that they did not feel that there should a separate criterion for assessing ICT in education. In their opinion, it should be treated the same way as the use of other teaching and learning aids. At the same time, training managers also feel that the existing ECD criteria, in general, need updating. The discussion on approaches to evaluate effective use of ICT in teaching and learning is still ongoing.
165. It is clear from international experience that the way ICT is being used and how frequently47 makes an impact on how teachers perceive its value for teaching and learning. Such lessons learned should be taken into account when guidelines are being formulated for teachers, and when students are being assessed and teachers’ practice is being evaluated. Further initiatives should therefore raise awareness and focus on addressing the links among approaches to integrating ICT effectively into teaching practice, student learning objectives, student assessment, and teacher performance evaluation.
3. Teacher Efficacy
166. As part of the study, teachers rated their efficacy on a validated set of 12 statements,48 choosing values ranging from 1 = “nothing/not at all” to 9 = “a great deal.” The instrument captured teachers’ feedback on three subscales: efficacy in student engagement, efficacy in instructional practices, and efficacy in classroom management. Responses across groups were summed and means compared. The study did not yield significant differences in participating teachers’ self-reported efficacy. Teachers across all three groups had, on average, a similar sense of how well they are able to control certain situations and difficulties in their classrooms and with their students.
167. Regarding efficacy in student engagement, most of the teachers in all three groups felt that they have at least some influence in motivating students who show low interest in school work. Most IIREM teachers think they have some influence, while most SEDP and control group teachers think they actually have “quite a bit” of influence. All teachers selected values of 5 and higher. See Exhibit 10 below for an overview of responses to this statement (IIREM n=18, SEDP n=19, control n=20).
47 Ramboll Management. 2006. E-Learning Nordic 2006 – Impact of ICT on Education. Copenhagen. 41: “The study
shows the great potential of ICT. One of the results indicates that the pupils and teachers who experience the greatest impact from ICT are also the ones who use ICT the most often. The same results are found among teachers who integrate a greater number of different technologies.”
48 Tschannen-Moran, M., and A. Woolfolk Hoy. (2001). Teachers’ Sense of Efficacy Scale. Short Form. Available: http://www.coe.ohio-state.edu/ahoy/TSES.pdf2.pdf.
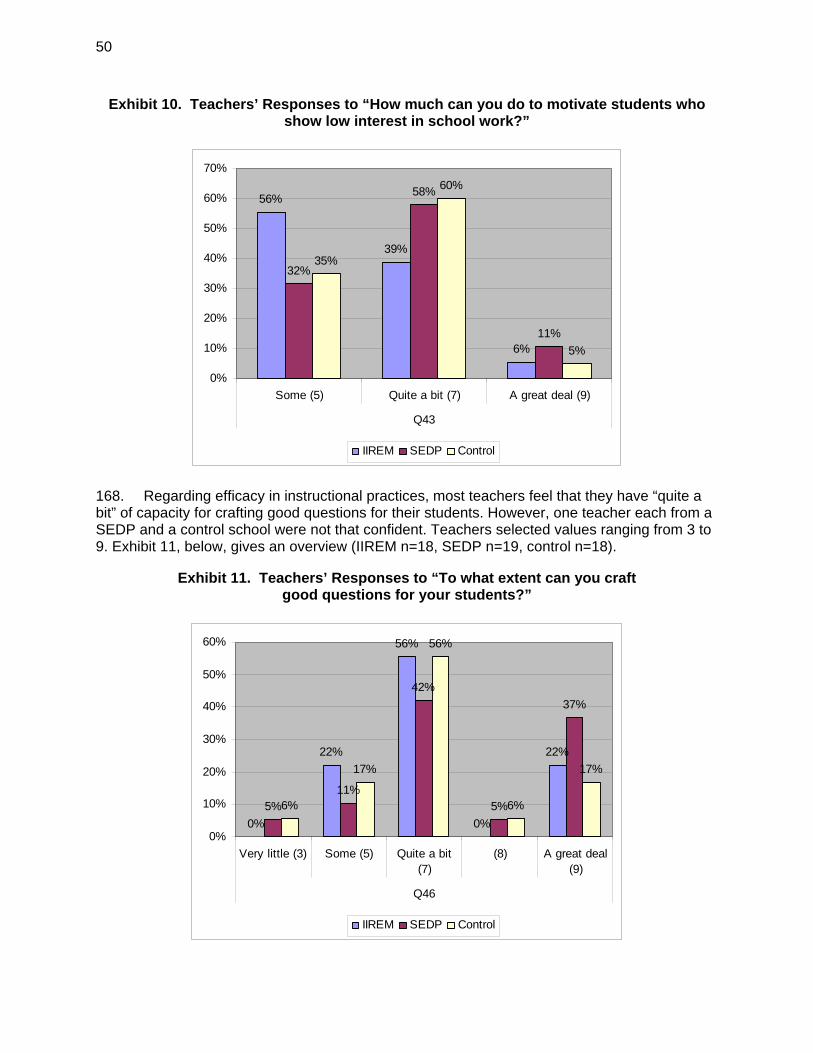
50
Exhibit 10. Teachers’ Responses to “How much can you do to motivate students who show low interest in school work?”
56%
39%
6%
32%
58%
11%
35%
60%
5%
0%
10%
20%
30%
40%
50%
60%
70%
Some (5) Quite a bit (7) A great deal (9)
Q43
IIREM SEDP Control
168. Regarding efficacy in instructional practices, most teachers feel that they have “quite a bit” of capacity for crafting good questions for their students. However, one teacher each from a SEDP and a control school were not that confident. Teachers selected values ranging from 3 to 9. Exhibit 11, below, gives an overview (IIREM n=18, SEDP n=19, control n=18).
Exhibit 11. Teachers’ Responses to “To what extent can you craft good questions for your students?”
0%
22%
56%
0%
22%
5%11%
42%
5%
37%
6%
17%
56%
6%
17%
0%
10%
20%
30%
40%
50%
60%
Very little (3) Some (5) Quite a bit(7)
(8) A great deal(9)
Q46
IIREM SEDP Control

51
169. Regarding efficacy in classroom management, the statement “How much can you do to control disruptive behavior in the classroom?” did not yield any major differences between groups. All teachers chose values of 5 (some) or more. Exhibit 12 below illustrates the results by group (IIREM n=18, SEDP n=19, control n=20).
Exhibit 12. Teachers’ Responses to “How much can you do to control disruptive behavior in the classroom?”
28%
50%
22%26%
32%
42%
20%
35%
45%
0%
10%
20%
30%
40%
50%
60%
Some (5) Quite a bit (7) A great deal (9)
Q42
IIREM SEDP Control
170. Summary. As part of the study, teachers rated their efficacy on a validated set of 12 statements. The instrument captured teachers’ feedback on three subscales: efficacy in student engagement, efficacy in instructional practices, and efficacy in classroom management. Data analysis shows that while answers to individual statements may vary between groups, overall participating teachers have a similar sense of how well they are able to control certain situations and difficulties in their classrooms and with their students. Therefore, there were no significant differences observed on teacher efficacy between teachers who participated in e-resource initiatives and teachers who did not.
171. Discussion. Teacher efficacy was one of the indicators to be explored in the study. The findings derived from the participating teachers are not necessarily surprising, but seem to indicate that the “inputs” of the e-resources or ICT initiatives at large have not made any difference on this specific dimension of teaching. The indicator was selected because a part of the training under this study also dealt with issues of classroom management with regard to technology integration (see paragraph 208, in Section VIII.C.7, Teacher Use of Equipment and Materials, below, for student evaluations of teachers’ capacity to integrate ICT smoothly into a lesson). However, training so far has not, or not yet, penetrated into the more complex aspects of teacher efficacy as measured by this instrument.

52
4. Teacher Lesson Planning and Material Production
172. Across all groups, most participating teachers reported spending more than 15 hours per week on lesson planning. IIREM teachers comparatively spend most time lesson planning, with 61% reporting more than 12 hours a week and only 23% less than 9 hours per week. Half of the participating control school teachers report spending more than 12 hours per week on lesson planning. Some 40% of them, however, report spending less than 9 hours. SEDP teachers spend the least time on lesson planning compared to their peers. Only 37% of them report a level of more than 12 hours per week, and some 42% spend less than 9 hours per week on lesson planning. Training managers are slightly more conservative in their estimate of time spent by their teachers on lesson planning. Most of the IIREM training managers believe that their teachers spend on average less than 9 hours per week on this, with just one training manager estimating that the teachers in her school invest more than 15 hours. SEDP training managers do not think that their teachers spend more than 12 hours on lesson planning; most even estimate a time investment of less than 4 hours. In control schools, most training managers think that their teachers spend about 9 to12 hours on lesson planning. Exhibit 13, below, provides an overview of the teachers’ responses to this issue (IIREM n=18, SEDP n=19, control n=20).
Exhibit 13. Teachers’ Responses on Time Spent on Lesson Planning per Week
173. Across the three different groups, all teachers report that they do develop lesson plans for nearly all the lessons that they teach. While most of the teachers across all three groups confirm that there are standards at their schools as to what lesson plans need to contain, some 16% of IIREM teachers, 21% of SEDP teachers, and 10% of control school teachers were not aware of standards. More detailed analysis shows that only a portion of the teachers who confirm existence of standards actually say that there are standards concerning the elements of a lesson plan; others report that they are using content standards within their subjects for guidance. Given that these are two entirely different issues, the question, as it has been asked, may not have been clear to respondents. Those teachers who did confirm existing standards for
0%
17%
6%
17%
33%
28%
0%
21% 21% 21%
11%
26%
0%
10%
30%
10%
20%
30%
0%
5%
10%
15%
20%
25%
30%
35%
0 hours 1-4 hours 5-8 hours 9-12 hours 12-15 hours More than 15hours
Q56
IIREM SEDP Control
12-15 hours

53
lesson planning, mentioned lesson goal/objective, time allocations, activities, methods, and assessment. In general, training managers confirmed the existence of standards for lesson planning, but then also detailed content standards for specific subject matter. None of the respondents mentioned the use of teaching and learning aids as being part of their lesson plans or standards. However, on the next question, “Do lesson plans capture information on the use of teaching and learning aids in the lesson?,” they almost unanimously replied affirmatively. This was also confirmed from data collected from training managers.
174. Training managers from the three different school groups do differ in their assessment of their teachers’ quality of preparation for their classes. When presented with a set of rubrics, indicating four levels, “very good,” “good,” “satisfactory,” and “minimal,” 60% of IIREM training managers think that their teachers’ preparation in general is good; the remaining 40%, however, think that it is just satisfactory. SEDP training managers are the most optimistic: 25% think that their teachers are very good in their preparation for their classes; half of them rate teachers good. Only one SEDP training manager thinks that teachers’ preparation is “satisfactory” at his school. Training managers of control schools are the most pessimistic: half of them find the lesson plans of their teachers only satisfactory and one of them thinks they are good. 175. The general use of visual aids, as used in Exhibit 14, such as colored chalk, posters, models, or visual organizers, is common in most classes of participating teachers; 47% of SEDP teachers reported using these sorts of tools in every one of their classes, compared to 28% of IIREM teachers and 31% of control school teachers. In each of the three groups, most teachers reported weekly usage of visual aids. Training managers differ in their assessment of teachers’ practices on this issue. According to them, teachers in control schools are considerably less likely to use visual aids in the course of their lessons; 50% think that this happens less than a few times per year. IIREM school training managers are the most positive about this, with 60% of them estimating usage of once a day or even every class, compared to only 25% of SEDP and control schools. The responses of the training managers, therefore, vary considerably from those of their teachers. Responses from students confirm the general picture provided by the training managers, not by teachers, despite responses varying strongly within groups. Nearly 40% of control school students say that their teachers do not use visual aids more than a few times per year, compared to 24% of SEDP and 17% of IIREM students. At the same time, 50% of IIREM students state that their teachers use visual aids at least three to four times per week or even more often. This is compared to 31% of SEDP and 27% of control school teachers. The overall picture therefore seems to indicate that teachers who participated in e-resources initiatives use any type of visual aid more often in their teaching than teachers from control schools.
176. On average, teachers spend about 9 to 12 hours per week preparing visual aids for lessons. There are no significant differences on this issue between teachers who participated in e-resources initiatives and those who did not. Training managers of SEDP schools, however, believe that their teachers use much less time than that per week, some 1–4 four hours only. In
Exhibit 14. Exemplary Use of Visual Aids in a Mathematics Class
54
order to prepare teaching and learning materials for their classes, all of the teachers have to use their personal money to buy needed resources. Their schools do not provide for items such as cardboard, paper, pens, colors, and similar items. Teachers from IIREM schools spend on average about MNT8,294 ($7) on this, and teachers from SEDP schools about MNT8,628 ($7.29). However, teachers from control schools spend considerably more money on such materials than their peers in IIREM and SEDP schools, an average of MNT12,211 ($10.31). Given that a basic monthly salary of teachers in schools may be between MNT85,200 ($72) and MNT115,00049 ($97), this represents a considerable percentage of their monthly salaries; for some control school teachers nearly a seventh. Data indicate, therefore, that there is a significant difference in the amount of money teachers spend on materials to develop learning and teaching aids for their teaching: Teachers who did not participate in e-resources initiatives spend significantly more of their personal money on such materials than teachers who did.
177. More than 40% of control school teachers state that they are not able to prepare electronic teaching and learning aids at all. A third of the control school teachers, however, say that they have the skills to do so, but they don’t really prepare such resources. Responses of IIREM and SEDP teachers are significantly different compared to the control group. A small group of IIREM teachers record time investments of over 15 hours per week on preparing electronic resources. Most of the IIREM and SEDP teachers, however, spend an estimated 1–8 hours on this task per week. There are no considerable differences between SEDP and IIREM teachers on the amount of time they spend on such task.
178. Summary. There are some differences to be observed in the time dedicated to lesson planning among the different schools, with IIREM teachers investing most, and SEDP teachers least of their time per week on this task. Training managers across the three groups estimate a lower level of time investment compared to teachers’ estimates. SEDP teachers report spending least amount of time in the preparation of teaching and learning materials, but the three groups do not differ significantly on this item. They do differ significantly, however, in the amount of money they spend on the raw materials necessary to develop teaching and learning aids. IIREM and SEDP teachers spend about 30% less per month than control school teachers on items such as cardboard, paper, colors, etc. For selected control school teachers, the amount they spend may be up to a seventh of their basic monthly salaries.
179. The use of visual aids in teaching varies considerably among the groups of teachers, with SEDP teachers reporting making use of such tools more frequently than their IIREM and control school counterparts. According to students and training managers, teachers in schools that participated in e-resource initiatives are more likely to use visual aids in their teaching and teachers from schools that did not.
180. As was expected given their participation in the project, there are also significant differences in the time teachers spend on developing electronic teaching and learning materials. Teachers who participated in e-resource initiatives are much more likely to spend time in developing electronic teaching and learning resources than those who did not. Comparing IIREM to SEDP teachers in this regard did not yield any considerable differences.
181. Discussion. Data indicate that the three groups do not differ considerably in the overall amount of time they spend on lesson planning and in the development of traditional teaching and learning materials. They do, however, differ considerably in the amount of time they spend on preparing electronic teaching and learning materials. It is not certain, however, whether
49 Not including possible allowances in addition to basic salaries.
55
teachers considered “lesson planning” as an activity different from the development of teaching and learning materials to be used in lessons. Comparing the times stated, this seems to be the case. However, it cannot be said with certainty that the time stated for the preparation of materials needs to be added to the time stated for lesson planning to yield an overall account of time invested in preparing classroom teaching per week. Anecdotal evidence from interviews with IIREM teachers suggest that there was a considerable time investment, compared to before, in the early stages of the project, which has now somewhat balanced out. As stated above, the most common ICT integration practice at the moment among participating schools is the preparation and utilization of electronic presentations during classroom teaching. In the early months of the project, therefore, IIREM teachers, having virtually no electronic teaching and learning materials to draw on in addition to the productivity software coming with the laptops, invented and developed their own materials from scratch. This required a rather large investment of time and effort. Over the months, however, teachers have gained more practice, more experience, and more familiarity both with the program and also with the nature and format of the presentations. This process has become much more efficient. In spite of that, IIREM teachers reported that because they tend to share these materials with other teachers, they are paying much more attention to their work and take more care in its preparation, because it is so “visual.” IIREM teachers have taken a lot of pride in sharing materials not only with their peers, but also with parents. Later IIREM trainings therefore have strongly focused on this specific use of ICT and e-resources (see footnote 37), promoting good practices. With teachers in more than 36 schools engaging rather enthusiastically in the production of presentations that help them guide and “enhance” their lessons, a large body of resources has been developed for all subject matters. The study provided a forum for IIREM teachers to share not only their experiences and best practices with SEDP counterparts, but also such materials. The similar (or even less) amount of time that less-experienced teachers in SEDP schools now seem to need to invest in the development of electronic teaching and learning materials may therefore stem from the fact that they can draw on a huge amount of resources already available. There may be reason to believe that the training provided to SEDP teachers under this study was sufficient to give these teachers enough capacity to use, manipulate, and develop electronic resource materials. In addition to sharing initial IIREM lessons learned on this issue, this may have allowed them to leapfrog a certain amount of experience gathering, accelerating their learning curve. It may be prudent, however, to gather some of the materials developed from IIREM and SEDP teachers and the lesson plans/methodological considerations on their integration into the classroom, to see whether there are any quality differences, and if there are indeed new materials being developed by SEDP teachers.
5. Teacher Collaboration
182. Increased collaboration among teachers who participated in e-resource initiatives has been a clear outcome, according to the focus groups and interviews, not only with teachers but also with training managers and school principals. This has also been found in IIREM monitoring and evaluation activities (see page 13 of footnote 37). The study tried to explore whether these results also hold when comparing responses from these teachers to those in control schools in a structured manner. Below are the findings from that part of the data collection and analysis.
183. First of all, the study investigated if there is a dedicated space for teacher collaboration in participating schools. Results show that there is a teacher room in three of the four IIREM and three of the four SEDP schools. Responses from one control school are not quite clear, where some teachers think there is such a room and others think there is not. However, in the other three control schools, such a facility is clearly available.

56
184. Participating teachers were also asked how many hours they spend on average per month working with other teachers on education-related issues. Findings from this aspect of the study clearly confirm the more anecdotal information so far: participation in the e-resource initiatives has an effect on the amount of time teachers spend working with each other. Exhibit 15, below, provides an overview of the responses given (IIREM n=18, SEDP n=19, control n=20). Notably, 40% of control school teachers report working never or less than 5 hours per month with other teachers, compared to only 11% of IIREM and 26% of SEDP teachers. On average, IIREM teachers spend most hours working with their peers. The data indicate a strong within-group variation, which is more pronounced among control school teachers; there are some control group teachers who work very little or not at all with other teachers, and other control group teachers who report spending even more than 15 hours per month working with peers. This heterogeneity within groups is also to be seen in the responses of the training managers. In spite of that, 60% of training managers from IIREM schools, compared to only 25% from SEDP and control schools, think that their teachers work more than 15 hours per month in collaboration with others.
Exhibit 15. Teachers’ Responses to “How many hours per month do you, on average, work together with other teachers on education-related issues?”
0%
11%
28%
22%
11%
28%
0%
26%
16%
21% 21%
16%
5%
35%
10% 10%
20% 20%
0%
5%
10%
15%
20%
25%
30%
35%
40%
0 hours 1-4 hours 5-8 hours 9-12 hours 12-15 hours More than 15hours
Q61
IIREM SEDP Control
185. In terms of key activities teachers tend to do together, findings across all groups indicate both “lesson planning” and “school events” as the two top areas of collaboration. However, data significantly differs when comparing responses on “teaching and learning material development.” IIREM and SEDP teachers chose this activity among their top three, whereas for control school teachers this is the activity they are least likely to engage in together. Data analysis yielded a notable difference on “professional development and training” for another group: only two SEDP teachers mentioned this activity as one of their top three collaborative activities. Exhibit 16 maps responses to this question (more than one response was possible; IIREM n=18, SEDP n=19, control n=20).

57
Exhibit 16. Teachers’ Responses to “What are the three activities you most often do together with other teachers?”
IIREM SEDP Control Q 62 – Answers counts counts counts
Lesson planning 10 12 13Teaching and learning material development 12 11 5School events 13 11 10Parent/community activities 5 5 7Professional development and training 8 2 9
186. Training managers agree with their teachers in their general assessment of what activities teachers tend to collaborate on most often in their schools. For IIREM training managers, the top two were teaching and learning materials development and school events, mirroring responses of their teachers. SEDP training managers stated mostly professional development and lesson planning, which is different from the responses of their teachers. Finally, training managers of control schools think that the activities most often conducted in collaboration with other teachers are lesson planning and professional development.
187. When asked specifically how often teachers exchange teaching and learning materials with other teachers, 50% of control school teachers report doing this once a year or never. This is compared to only 11% of IIREM and 32% of SEDP teachers. On this item there are significant differences to be observed between teachers who participated in e-resource initiatives and those who did not. Teachers who participated in e-resource initiatives are much more likely to exchange teaching and learning materials with their peers. This difference is confirmed by training managers in the respective schools, with 40% of IIREM training managers, 50% of SEDP training managers, and only 25% of control school training managers estimating that their teachers share lesson materials once every 2 weeks or more often.
188. Finally, interschool collaboration and exchange was investigated, with 35% of control group teachers, 11% of SEDP teachers, and only 6% of IIREM teachers stating that they never participate in exchange visits with teaching staff in other schools. Nearly three-quarters of IIREM teachers state that they conduct exchange visits at least once every 6 months, or more often, compared to 47% of SEDP and 30% of control school teachers. This is a significant difference in favor of IIREM teachers who have more opportunities to engage with other schools.
189. Summary. Control school teachers on average spend less time working with other teachers compared to teachers who participated in e-resource initiatives. When they do, they prefer to work on issues of lesson planning and school events, and comparatively little on issues of teaching and learning material development. Most notably, is it significantly less common for teachers from control groups to exchange such materials with each other, compared to teachers who participated in the e-resource initiatives; collaboration with the aim of teaching and learning preparation, therefore, is less dominant among control school teachers. In addition, teachers who participated in such initiatives seem to have much more exchange with other schools. More than a third of control school teachers have this chance only once a year or less..
190. Discussion. Results of the data analysis clearly confirm that e-resource initiatives did have a strong effect on teachers’ collaboration and teaching and material-sharing behavior. This even transcends the boundaries of individual schools. In interviews, teachers specified that engagement in e-resource activities had especially fostered collaboration with teachers outside

58
their methodology group; for example, a physics teacher reported having started to work with the English teacher in his school to research resources on the Internet—they had never had much contact before. He was drawing on help from somebody who had the language skills to navigate the web and help him find graphics, pictures, simulations, and texts for his classes. In addition, site visits and interviews also confirmed a surprisingly large spillover effect of e-resource initiatives: teachers from a participating school went to another school and consulted on issues of ICT integration. Such behavior was observed under IIREM. Given that this was not something explicitly encouraged or initially planned, there is reason to believe that other aspects of the IIREM project brought about this change. A number of possible explanations could be the following:
• Mentor School Concept. IIREM instituted a training approach that focused on direct training of a selected number of teachers from schools that are based in the regional aimag centers. Aimag center schools have better access to communication infrastructure and are usually better equipped with ICT (for more information refer to Section VIII.D.1, ICT Environment). These schools and teachers then became mentors and trainers of trainers (TOTs) for their peers and were tasked with training another set of TOTs, this time from village schools in their region. These soum school TOTs then cascaded the training down to their peers in their schools. In the weeks and months that followed, any teacher who needed help or a resource from the Internet could contact the mentor school teachers and ask for support. Aligning a cascading training approach with the mentor school approach linked schools that to date had not had much exchange. To compensate for some of the shortcomings of cascading training, including the possible loss of important information or deliberations on the content of the training during its implementation, IIREM consultants went regularly directly to each school to provide follow-up and quality control.
• Teacher E-mail Network. Originally, IIREM had hoped to be able to provide each participating school with at least dial-up Internet connectivity to encourage collaboration and exchange with the mentor schools. However, this turned out to be much more complicated than originally assumed, leaving some of the remoter schools without connectivity. However, with creativity, as described in footnote 60 below, teachers still managed to participate and share their presentations, electronic resources, questions, and answers with their peers—something that they never had a chance to do in this form and frequency before.
• Resource Sharing Among Schools. Hand in hand with teachers leveraging the IIREM electronic mailing lists in building up their network, IIREM also initiated communication and collaboration by collecting and sharing resources, such as videos from lessons and example presentations, among schools. Teachers were able to see who developed a certain presentation and, if they found it useful or had questions, would very often try to contact this other teacher directly via email.
6. Teacher Job Satisfaction and Attendance
191. Teacher Job Satisfaction. Presenting a set of statements illustrative of teacher motivation, engagement, and satisfaction with their jobs, the study aimed to formalize anecdotal evidence from earlier focus groups. Results from the latter indicated that teachers who participated in e-resource initiatives felt both challenged and inspired by it, and indicated an increase in satisfaction and motivation for their work (see page 14 of footnote 37). To capture this dimension, statements presented to teachers addressed areas such as: support from
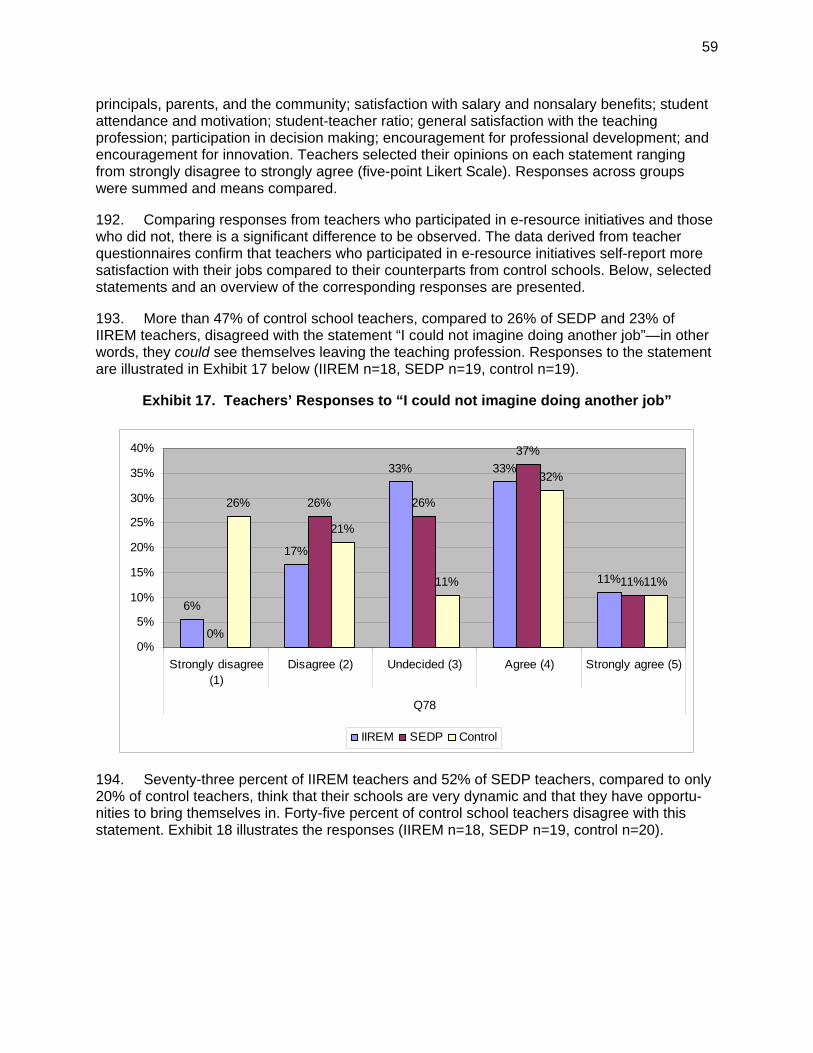
59
principals, parents, and the community; satisfaction with salary and nonsalary benefits; student attendance and motivation; student-teacher ratio; general satisfaction with the teaching profession; participation in decision making; encouragement for professional development; and encouragement for innovation. Teachers selected their opinions on each statement ranging from strongly disagree to strongly agree (five-point Likert Scale). Responses across groups were summed and means compared.
192. Comparing responses from teachers who participated in e-resource initiatives and those who did not, there is a significant difference to be observed. The data derived from teacher questionnaires confirm that teachers who participated in e-resource initiatives self-report more satisfaction with their jobs compared to their counterparts from control schools. Below, selected statements and an overview of the corresponding responses are presented.
193. More than 47% of control school teachers, compared to 26% of SEDP and 23% of IIREM teachers, disagreed with the statement “I could not imagine doing another job”—in other words, they could see themselves leaving the teaching profession. Responses to the statement are illustrated in Exhibit 17 below (IIREM n=18, SEDP n=19, control n=19).
Exhibit 17. Teachers’ Responses to “I could not imagine doing another job”
6%
17%
33% 33%
11%
0%
26% 26%
37%
11%
26%
21%
11%
32%
11%
0%
5%
10%
15%
20%
25%
30%
35%
40%
Strongly disagree(1)
Disagree (2) Undecided (3) Agree (4) Strongly agree (5)
Q78
IIREM SEDP Control
194. Seventy-three percent of IIREM teachers and 52% of SEDP teachers, compared to only 20% of control teachers, think that their schools are very dynamic and that they have opportu-nities to bring themselves in. Forty-five percent of control school teachers disagree with this statement. Exhibit 18 illustrates the responses (IIREM n=18, SEDP n=19, control n=20).

60
Exhibit 18. Teachers’ Responses to the Statement “This school is very dynamic; I have lots of opportunities to bring myself in”
0%
17%11%
56%
17%
0%
32%
16%
47%
5%5%
40%35%
10% 10%
0%
10%
20%
30%
40%
50%
60%
Stronglydisagree (1)
Disagree (2) Undecided (3) Agree (4) Strongly agree(5)
Q84
IIREM SEDP Control
195. In areas of community support, 50% of control school teachers do not think that their schools receive good support from the community. This is compared to 28% of IIREM and only 11% of SEDP teachers (see Exhibit 19; IIREM n=18, SEDP n=19, control n=20).
Exhibit 19. Teachers’ Responses to “This school receives good support from the community”
0%
28%
11%
50%
11%
0%
11%
32%
42%
16%20%
30%
15%
30%
5%
0%
10%
20%
30%
40%
50%
60%
Stronglydisagree (1)
Disagree (2) Undecided (3) Agree (4) Strongly agree(5)
Q91
IIREM SEDP Control

61
196. Teacher Attendance. Teachers were asked to rate their attendance on a scale of “excellent,” “very good,” “good,” “satisfactory,” or “unsatisfactory.” The majority of teachers rated their attendance as either excellent or very good. There were no significant differences among the groups, except for 95% of SEDP teachers rating themselves excellent on this scale, compared to a bit more moderate statements by IIREM and control school teachers. Their training managers see this issue a bit differently, as outlined in Exhibit 20 below (IIREM n=4, SEDP n=4, control n=4). Most notably, half of the training managers from control schools rate the attendance of their teachers only as satisfactory, compared to 20% of IIREM and none of the SEDP training managers.
Exhibit 20. Training Managers’ Assessment of Their Teachers’ Attendance
0%
75%
0%
20%
0%
25%
50%
25%
0% 0%
25%
0%
25%
50%
0%0%
10%
20%
30%
40%
50%
60%
70%
80%
Excellent Very good Good Satisfactory Unsatisfactory
Q60
IIREM SEDP Control
197. Summary. Data analysis shows that there is a significant difference between teachers who participated in e-resources initiatives and those who did not in the area of teachers’ satisfaction with their jobs. Teachers who were part of such initiatives are more likely to agree to statements that exemplify satisfaction with their jobs than teachers in schools that were not part of e-resource initiatives. While SEDP teachers show the highest mean score on this dimension, there were no significant differences between the IIREM and the SEDP group to be observed.
198. Although there were hardly any differences in teachers’ self-assessment of the quality of their attendance, there was some difference in their training managers’ evaluation. Most training managers from control schools rated their teacher’s attendance worse than training managers from IIREM and SEDP schools assessed that of their teachers.
199. Discussion. While there was anecdotal evidence that teacher satisfaction increased with participation in e-resource initiatives, it is encouraging to see that this hypothesis still held after more structured evaluation and assessment. There seem to be some clear differences among teachers’ ability to bring themselves in, the way innovation is being valued at schools, and the support teachers are getting from principals and communities between teachers who

62
participated in e-resources initiatives and teachers who did not. There were no significant differences between IIREM and SEDP teachers on this scale. Given these results, there is reason to believe that by participating in this study, SEDP teachers seem to have developed a level of satisfaction similar to that of their peers from IIREM schools that had been participating in e-resources initiatives for a longer period of time.
7. Teacher Use of Equipment and Materials
200. The study set out to provide further insight into what sort of materials teachers in general are able to draw on in their schools to provide a contextual base for the role of ICT and e-resources in schools. The study also investigated how frequently such materials were being used by teachers in their classes, for professional development or lesson planning. Aspects of this dimension are also linked to issues of program and lesson planning, specifically the capacity and investment to develop and use self-made, nonelectronic and electronic teaching and learning materials and visual aids. These aspects are covered in Section VIII.C.4, Teacher Lesson Planning and Material Production, above.
201. Most teachers across the three groups state that they have both a teacher’s guide for all of their grades and subjects and up-to-date textbooks for their students. A few teachers, however, mention that such materials are expensive and rather difficult to find, therefore raising issues of availability. For specific subjects, however, a teacher’s guide or student textbook is not available. Some teachers state that it is difficult for students to get up-to-date textbooks in time for the beginning of the school year, especially in remote schools. Cost of the textbooks, which according to the latest textbook reform has to be borne by parents,50 also seems to affect availability of these resources at the beginning of the school year. More than two-thirds of IIREM and control school teachers, and one third of SEDP school teachers, state this to be a problem. However, overall, nearly all participating students report having a textbook for each of their subjects. Most principals, however, clearly state that there are difficulties with getting up-to-date textbooks for their students in time. The control schools seem to have more difficulties than the others, with SEDP school principals reporting the least. Challenges are varied, and are mostly due to the schools’ remote location.51 Some challenges are:
• It is difficult to get books to the schools.
• It is difficult to contact the publishing companies, whose representatives come to the aimag center only irregularly.
• Principals find it difficult to make appropriate choices from among the textbook titles.
• Prices for the textbooks are higher in rural areas than in Ulaanbaatar.
202. All of the teachers (as did their students) mentioned that there is a library in their schools; however, on average they estimate that about 40–50% of the books are unusable due to old age, irrelevance to the curriculum, or damage. Estimates are similar across groups. Training managers interviewed confirm their teachers’ assessment. Study participants also agree that only about a third of the books are being used regularly by teachers for preparing or
50 A cost of 50,000 MNT ($42) for the textbooks of a child in 11th grade had been estimated for the last academic
year. About 27% of the population, however, had to be given vouchers, because they fell below the Mongolian poverty line and would not be able to bear those costs.
51 A more detailed discussion concerning challenges of rural schools and the role and potential of ICT and e-resources in this regard can be found in Section VIII.E, Findings on Research Question 2.

63
teaching their lessons. Despite those conditions being similar across the three groups, it is the IIREM teachers who state they most often use the books for lesson planning, professional development, and/or teaching; more than 47% of responding IIREM teachers use them daily, compared to 11% of the responding SEDP and 5% of the responding control school teachers . Most of the responding SEDP teachers make use of the books monthly, but control school teachers even less than that; most of the responding teachers state that they tend to use these books only once every 6 months. Data analysis shows therefore that existing library books are considerably more used for education purposes by teachers who participated in the e-resources initiatives, compared to teachers who did not.
203. Researching the availability and usefulness of biology, chemistry, and physics models, the data indicate that most participating schools have such items in their inventory. Such models are available at all IIREM schools and nearly all SEDP schools. However, a large percentage of control school teachers, 40%, mentioned that they don’t have such resources at their schools. The training managers from all schools, on the other hand, confirmed availability of such items. On average, IIREM teachers state that about 43% of models they have are not usable because they are damaged/irrelevant to the curriculum. This is compared to about 40% of the models in SEDP schools and only 25% of the models in control schools. Thus, teachers from IIREM and SEDP schools estimate a considerably larger percentage of the science models they have at their schools are unusable, compared to teachers from control schools. Training managers from all three groups estimate that about 45% of the models are not usable. Most of the responding teachers reported never making use of these models for lesson planning, professional development, and/or teaching, and very few of them—just one or two teachers in each group— make use of them every few days. Training managers’ feedback was very different on this item, and indicates that usage varies considerably from school to school rather than from group to group. There were no significant differences between groups to be seen from their replies. Students’ responses confirmed that IIREM teachers are more likely to use such models in their teaching, compared to SEDP or control school teachers. Exhibit 21 illustrates the students’ responses to this question (IIREM n=42, SEDP n=42, control n=41).
204. Answers of teachers vary when asked about how often teachers make use of computers in classroom teaching. Exhibit 22 below provides an illustration (n=57). In sum, all of the teachers confirm that their schools have computers. There are significant differences to be seen in their usage, however, between teachers who participated in e-resources initiatives and teachers who did not. Not one IIREM or SEDP teacher stated that he/she did not know how to use a computer, compared to 25% of teachers in control schools. IIREM principals estimated that about 88% of their teachers can operate a computer, compared to an estimate of 54% for SEDP and 60% for teachers in control schools. Similarly, IIREM principals believe that more than 65% of all of their teachers have enough confidence to use a computer in their classroom teaching, compared to an estimate of about 50% of SEDP teachers, and less than 15% of teachers from control schools. A large majority, 70%, of control school teachers interviewed stated that while they know how to use a computer, they don’t use one for classroom teaching. Among SEDP teachers who have been part of e-resources initiatives, still more than a fourth responded the same way. Results are most obvious for IIREM teachers, where nearly 40% of them use a computer in classroom teaching at least once every 2 weeks (compared to 21% of SEDP teachers and 5% of control school teachers).

64
Exhibit 21. Students’ Responses to How Often Their Teachers Use Science Models in Their Classes
10%
5% 5% 5%
12%
17%
29%
19%
5%
10%
12%
19%
17% 17%
14%
7%
12%
10%
12%
10%
7%
20%
22%
7%
0%
5%
10%
15%
20%
25%
30%
I don’t think wehave any models
like that
Never Once a year A few times ayear
Once a month Once a week 3-4 times/week Daily
IIREM SEDP Control
Exhibit 22. Teachers’ Responses to “How often do you use a computer in your classroom teaching?”
0%6%
0%
22%
11%
22%17% 17%
6%0%0%
26%
5%0%
16%
32%
11%
0%
11%
0%
25%
70%
0% 0% 0% 0% 0% 0%5%
0%0%
10%20%30%40%50%60%70%80%
I don'tknow howto use a
computer
Know howto use, butdon't use
forclassroomteaching
Once ayear
Once every6 months
Once every6-8 weeks
Everymonth
Once everytwo weeks
Once aweek
Every fewdays
Our schooldoes nothave a
computer
Q117
IIREM SEDP Control

65
205. Students’ overall results confirm the pattern of teachers’ responses: 60% of IIREM students state that their teachers use a computer at least once a week, compared to 42% of SEDP and only 6% of control school students. Exhibit 23, below, illustrates the students’ responses (IIREM n=42, SEDP n=42, control n=41). There is a significant difference in computer use between teachers who participated in an e-resources initiative and teachers who did not. Teachers who participated in e-resources initiatives are more likely to use a computer for classroom instruction. In addition, there are considerable differences between IIREM and SEDP teachers, indicating that IIREM teachers tend to use computers more frequently in their classrooms than their SEDP counterparts. These patterns were confirmed by the schools’ training managers. More than 60% of IIREM training managers believe that their teachers use computers at a level of once a month or more often, compared to 50% of SEDP and none of control school training managers.
Exhibit 23. Students’ Responses to “How often does your teacher use a computer in class?”
206. Most teachers, even in control schools, were also well aware that their school does have educational software available.52 However, a few control group teachers, mostly from two control schools, did not seem to know that their school does have such resources. Similarly, three out of the four training managers from control schools also stated that their school does not have any software like that. Participating IIREM and SEDP teachers, on the other hand, were well informed about what is available at their schools in terms of such electronic teaching and learning materials, and so were their training managers. Control school teachers who did know that their schools had such items available mainly named a touch-typing program, and a 52 For background information, it is important to know that the availability of educational software in Mongolian
schools should more or less be similar. Under IIREM, about 15 education software titles had been developed and subsequently, by request of MECS, distributed to all schools in the country.
7%
2%
12%
5%
14%
36%
14%
10%
2%
26%
10% 10% 10%
33%
7%
2%
34% 34%
12%
5%
7%
2% 2% 2%
0%
5%
10%
15%
20%
25%
30%
35%
40%
I don’t think wehave a computer
to use in myclassroom
Never Once a year A few times ayear
Once a month Once a week 3-4 times/week Daily
IIREM SEDP Control

66
few mentioned the electronic dictionary. IIREM teachers also make most use of the software: nearly 45% of responding IIREM teachers say they use these tools every 2 weeks or even more frequently for professional development, lesson planning, and/or teaching (compared to only about 17% of the responding SEDP and control school teachers). Among responding control school teachers, 24% stated that they did not know how to use such software, and the same proportion of the responding control school teachers did know how to use such software, but reported not using it for educational purposes.
207. Among students, 54.7% of responding IIREM students, compared to 38% of responding SEDP and 18% of responding control school students, state that their teachers use educational software at least once a week in classes. These results confirm the overall patterns of responses from teachers. As a result, data analysis yielded significant differences between teachers who participated in e-resources initiatives and those who did not. Teachers who participated in such initiatives were both better informed and more likely to use such resources in their teaching. Teachers from IIREM schools make use of these resources more frequently than their SEDP counterparts.
208. Students were asked how well their teachers are able to manage the transitions and the technology. Responses clearly indicate that most IIREM students consider their teachers very capable and well prepared for the use of technology in classroom teaching, and do not lose any time with it, more so than do responding students from other groups. Responding students from control schools are not as confident about their teachers’ capacity as their peers from IIREM and SEDP schools. Exhibit 24, below, illustrates student responses (IIREM n=41, SEDP n=36, control n=24).
Exhibit 24. Students’ Assessment of Their Teachers’ Ability to Manage Transitions and Technology Use in Classroom Teaching
61%
22%15%
2%
36%31%
25%
8%
46%
8%13%
33%
0%10%20%30%40%50%60%70%
Yes, the teacher isvery capable and well
prepared - she/heloses no time whenusing technology in
the classroom
Yes, the teacher ispretty capable. It takesa bit of time to get the
computer andtechnology started, but
less than 5 minutes
Not so much, it takesmore than 5 minutes
each time the teachersuses a computer
Not very much. Ittakes more than 10
minutes each time toget everything started,
and there are oftenproblems and things
don't work
Q36
IIREM SEDP Control

67
209. The study also investigated the availability and use of other ICT, such as radio, TV, and cassette players in participating schools, to provide better contextual information on the application of computer and electronic teaching and learning resources in classrooms. In terms of availability and use of cassette recorders, TV, or radio, results are rather interesting. Exhibits 25–27 (IIREM n=18, SEDP n=19, control n=20 for all), below, provide an overview of the availability and use of these three tools by group.
Exhibit 25. Teachers’ Responses on the Availability and Use of Cassette or CD Players in Classroom Teaching
0% 10% 20% 30% 40% 50% 60% 70%
Never (1)
Once a year (2)
Once every 6 months (3)
Once every 6-8 weeks (4)
Every month (5)
Once every 2 weeks (6)
Once a week (7)
Every few days (8)
Daily (9)
Our school does not have (10)
Use
of C
asse
ttes
or C
D P
laye
rs in
the
Cla
ssro
om
Q12
2
IIREM SEDP Control

68
Exhibit 26. Teachers’ Responses on the Availability and Use of TVs in Classroom Teaching
0% 10% 20% 30% 40% 50% 60% 70%
Never (1)
Once a year (2)
Once every 6 months (3)
Once every 6-8 weeks (4)
Every month (5)
Once every 2 weeks (6)
Once a week (7)
Every few days (8)
Daily (9)
Our school does not have (10)U
se o
f TV
s in
the
Cla
ssro
om
Q12
3
IIREM SEDP Control
Exhibit 27. Teachers’ Responses on the Availability and Use of Radios
in Classroom Teaching
0% 10% 20% 30% 40% 50% 60% 70%
Never (1)
Once a year (2)
Once every 6 months (3)
Once every 6-8 weeks (4)
Every month (5)
Once every 2 weeks (6)
Once a week (7)
Every few days (8)
Daily (9)
Our school does not have (10)
Use
of R
adio
s in
the
Cla
ssro
om
Q12
4
IIREM SEDP Control

69
210. About 60% of control school teachers state that they never use either cassette recorders, TV, or radio in their classroom teaching. Another 20% of them say that they do not have a cassette player at their school. Based on their responses, a fourth do not have TV, and 35% do not have a radio. About 55–60% of control school teachers say that they never use these technologies in classroom teaching, although they may be available at their schools. IIREM teachers are more likely to use a cassette player or TV in the classroom compared to their SEDP and control school counterparts. More than a third of the IIREM teachers report using a cassette recorder at least once every 2 weeks, and 22% of them use a TV at least once every 2 weeks (compared to none of the control or SEDP school teachers). Use of radio by IIREM and SEDP teachers is similar across the two groups, but in general much less frequent than using TV. Only some 11% of IIREM and SEDP teachers use radio at a level of every 2 weeks or more. Most teachers do not make (or cannot make53) use of this technology in the classroom. Comparing teachers’ responses to those of their training managers, a similar pattern emerges: training managers in IIREM and SEDP schools say that their teachers use a cassette recorder, TV, and radio in classroom teaching more frequently than training managers from control schools. Radio, however, is not used, or is not available as a viable tool for classroom teaching according to training managers. Students’ responses from all schools are very similar across all three groups. Most students state that their teachers in general use any of the three tools rather rarely—less than once a year.
211. When asked about the frequency with which teachers use a digital camera to develop teaching and learning materials, most IIREM and SEDP teachers state monthly use, with some individual teachers using this tool even more frequently. Both groups of schools had been provided with such a technology as part of either IIREM or this study. At control schools, only 40% of teachers report that their school has a digital camera. At the time of data collection, according to the principals’ ICT inventory (see Section VIII.D.1, ICT Environment), none of the control schools had a digital camera. Thus, answers from teachers from control schools on this item were not conclusive. Notably, SEDP teachers use the digital cameras more often to develop such materials compared to their IIREM counterparts. More than 63% of them report monthly usage, or even more frequently, compared to 45% of IIREM teachers. Their training managers agree. SEDP training managers report teachers’ use of the digital camera to develop teaching and learning materials at 100% at least once a month, compared to 80% at IIREM and none at control schools.54
212. Finally, teachers were queried about the use of Internet to share information and teaching materials with other teachers. Sixty percent of responding control school teachers, 42% of responding SEDP school teachers, and only one IIREM teacher stated that their school does not have Internet access. A fifth of the responding control school teachers responded that they do not know how to use the Internet, another fifth mentioned that while they know how to use it, they do not use the Internet to share information and teaching materials with others. Over 44% of IIREM school teachers also mention that while they know how to use the Internet, they don’t do so for these kinds of purposes. This makes SEDP teachers considerably more likely to use the Internet to share information and teaching materials with other teachers than their IIREM or control school counterparts.55 Training managers’ responses are a bit more varied.
53 This clearly also depends on whether and what sort of programming is available. 54 None of the control schools actually had a camera at the time of data collection. See Section VIII.D.1 for an ICT
inventory across the three groups of schools. 55 This may also be related to the fact that principals from two out of three SEDP schools interviewed indicate that
their school has an Internet connection. For IIREM and control schools, it was one school out of four. See Section VIII.D.1, ICT Environment.

70
According to them, it is the IIREM teachers who more frequently share information and teaching materials with their peers using the Internet, compared to their SEDP and IIREM counterparts. This was also confirmed by participating principals. More than two-thirds of IIREM principals state that their teachers use the Internet for such purposes at least once every 6–8 weeks, if not more often.56
213. Summary. Teachers in all three schools are able to draw on resources, such as teachers’ guides and student textbooks, or books in their libraries. The general availability of student textbooks and teachers’ guides seems to be appropriate across all three groups of teachers. However, many of the participating teachers report problems stemming from their students not having their textbooks in time for the start of the school year. Principals confirmed this challenge, outlining a number of reasons and highlighting their school’s remote location and textbook affordability for parents as key among them.
214. In addition, a large proportion of the books and science models available in all schools is not usable for teachers because these materials are damaged, too old, or not relevant to the curriculum.
215. IIREM teachers’ statements indicate that of the three groups, they make the most use of library books, cassette recorders, TV, computers, and education software for lesson planning, professional development, or teaching. Control schools, according to their teachers, seem to be less well equipped, not only in terms of new media such as computers, but also in terms of more traditional technology, such as radio, cassette recorders, and TV, as well as traditional science models. For several of these items, however, their training managers’ replies did not confirm the lack or shortage reported by their teachers.
216. When these tools are known to be available, teachers in control schools tend to make less use of them for educational purposes than their counterparts from schools that participated in the e-resources initiatives. Triangulating results confirms this pattern, and both training managers and students agree with their teachers’ assessment. Comparing usage between IIREM and SEDP teachers, data suggest that the latter make considerably less use of most of the items under discussion, except for the digital camera, to develop teaching and learning materials.
217. Discussion. Findings here are rather interesting in regard to study objectives. Among participating teachers, the IIREM teachers are most likely not only to use ICT, but also to make more varied use of a variety of tools and technologies in their classroom teaching, including books, science models, cassette recorders, TV, and computer. Their responses regarding making use of books from the library stand out. It does not seem as if introduction of ICT has in any way reduced, but rather increased, the usage of other technologies, resources, and tools available to teachers. The differences between control and SEDP teachers on the one hand, and between SEDP and IIREM teachers on the other, in terms of frequency of use of a variety of other technologies and tools, such as books and cassette recorders, are significant. ICT and participation in e-resources initiatives do not seem to oust traditional technologies and tools, but rather to stimulate their use in lesson planning, professional development, and production of teaching and learning resources. Even if tools are available at control schools, most teachers don’t seem to make use of them for educational purposes. There also seems to be a link between the time teachers have participated in e-resources initiatives and the amount of related
56 It is important to note that only four schools report having Internet access at all: the three aimag center schools
(one from each group) and one additional SEDP school. See Section VIII.D.1 for more information.

71
training they received, and the extent of their usage of such other tools. SEDP school teachers make considerably less frequent use of most of these tools, compared to their IIREM counterparts. Possible explanations include the level of familiarity IIREM teachers have been able to develop with the technology, which may lead to increased use of computers and educational software, and to a stronger inclination to complement these new technologies with existing technologies. Interviews with teachers, as well as the ICT inventory, show that while there are a few desktop computers available at all of the schools, real access for subject-matter teachers is limited, mainly due to issues of electricity (for details, see Section VIII.D.1, ICT Environment). In order to use computers and education software in classroom teaching, therefore, teachers are restricted to the laptop/LCD package that was provided under IIREM and this study. With nine to 10 teachers in each school who participated in training being eager to use this package for their classes, the availability is clearly limited. Many teachers mentioned that they would like to use the laptop more often, but they only really get access to it bi-weekly. This clearly affects the frequency with which teachers can use ICT in their classrooms. These data, gathered from interviews during the site assessment for this study, were later confirmed by findings from the formal data collection phase. Most IIREM and SEDP teachers make use of the new technology about every 2 weeks. With recent training highlighting the use of appropriate visual aids and technology to support student learning, teachers may turn to other tools and technologies available in their schools to enhance students’ learning experience. SEDP teachers may still be largely focused on the laptop/LCD project equipment package they received during this study. However, as data indicate, they may also be increasing use of other materials.
D. ICT-Related Dimensions
1. ICT Environment
218. Electricity. Electricity has been named by participating schools as one of the major challenges to effective ICT integration. This is, according to principals, a problem especially for those schools in the soums, none of which are connected to the central electricity network. All three schools in the aimag center are connected and have 24 hours of electricity per day. IIREM soum schools on average have some 5.5 hours of electricity per day, compared to 3.5 hours in SEDP and about 5.7 hours in control schools. According to their principals, two of the IIREM soum schools usually have electricity for a few hours in the late morning and afternoon, and so does one of the two responding SEDP schools. The other SEDP school, like three of the four control schools, has electricity some time between 7 and 11 p.m. All participating schools, except for one (solar), mainly rely on diesel generators57 supplemented with wind energy; one of them also supplements with solar energy (another SEDP school). Exhibit 28, below, shows a photo of such a diesel generator. Diesel for a soum school in Bayankhongor costs about MNT930 ($0.80) per liter, with a liter providing about 1 hour of electricity. Schools usually receive their allocations in September for the start of the winter. However, depending on how well they manage and how cold the winter becomes, it can happen that the soum runs out of diesel by February or April. They either have to find resources to buy additional diesel, or stop having electricity all together.
57 Under IIREM, 21 participating schools received a diesel generator. Some of these schools were part of this study
as well.

72
Exhibit 28. Diesel Generator Provided to Selected Schools under IIREM
219. Discussion - Electricity. It is obvious that having the electricity on during evening and night hours does not conform to the school and class schedule. During the site assessment, several schools mentioned that they were the only institution in the soum village that had a generator. In these cases, other institutions and the village at large also depended on the school generating power to have light and heat during the dark, cold evening hours, especially in winter. Representatives from several schools indicated that other actors are exerting a considerable amount of pressure, and schools therefore conform to this general demand and are operating the diesel generator outside normal school hours. Nonetheless, students (who either live in the school dorm or in the village) come to the school during those times to attend informatics class or to use the equipment. Clearly, however, this excludes any opportunity for regular subject-matter teachers to use any ICT in their classroom teaching, unless it is battery powered. This was one of the main reasons the laptops provided under IIREM and this study have proven to be so valuable and such an innovation at these schools.
220. ICT Inventory. Only 75% of IIREM schools, 67% of SEDP schools, and half of the control schools actually have a working telephone line for the school.
221. Concerning the availability of computers: the IIREM aimag center school has the most computers of all participating schools, in total some 32 of them, 31 functioning/working. The SEDP aimag center school has 24 computers, four of them, however, not functioning. There are 18 computers available in the control school in the aimag center, but only 15 of them are operational. Soum schools in contrast have on average only 11 computers, with some eight of them functioning. In both of the SEDP soum schools, the situation is especially dire. The schools have a total of 14 and 13 computers respectively, but their principals state that only seven (50%) and two (6.5%) are functioning. A similar situation is described by the principal in one of the control soum schools, where there are 14 computers, but only eight of them actually operate. Exhibit 29 is an overview, by group, of the average number of computers, compared to functioning computers, available at participating schools in the aimag center and soum. In the soums, according to principals’ responses, control schools have more functioning computers available, compared to their IIREM and SEDP counterparts.

73
Exhibit 29. All Principals’ Estimate of Number of Computers and Functioning Computers in Their Schools
32
10
31
8
24
14
20
5
18
1215
9
0
5
10
15
20
25
30
35
Computers in aimagcenter school
Average computers insoum schools
Functioningcomputers in aimag
center school
Average functioningcomputers in soum
schools
Q21,22
IIREM SEDP Control
222. In all participating schools, it is mostly the principals (except for the one that is not able to operate a computer), school administration, teachers, and students that have access to the computers (their self-reported sites of access being outlined in the section below). In one SEDP and one control school, however, also parents and the community are allowed to use the equipment.
223. All schools have the majority of their computers situated in the school’s computer lab. In addition, most (except in one control school) also have some computers distributed among the school administration. The highest number of computers in a lab, a total of 14 computers, can be found in the IIREM aimag center school. The majority of participating schools do not have their computers networked, even in the computer room. Except for two of the three SEDP schools and one control school, the computer labs are not specifically secured, other than being lockable like any other classroom in the school, according to the principals. All schools, however, have at least one printer if not more. Those schools that have one printer usually have it in the computer lab; those with more also feature a printer in the principal’s office or with other administrative staff. Most of the schools do not have any limit on printing. Some of them state that the lack of a constant supply of electricity works as a “limiting” factor to some extent, and therefore no other measures to limit printouts in order to contain costs are required. At the IIREM aimag center school, however, the principal does restrict printing to work-related documents and material. In all participating IIREM schools, the computers in the lab are positioned along the walls, facing the room. That is also the case in most of the SEDP schools, except for one, where the machines are organized in rows back to back to each other. In half the control schools, however, the computers are organized in rows, facing the front; in the other half along the walls, facing the room. Otherwise, there are no significant differences in availability of a computer network or printers or the way rooms are secured between schools that were part of ICT initiatives and those that were not.

74
224. Most computers across all schools run an English language version of Windows XP as operating system. More control school computers, however, still run Windows 98. There are also no differences in the nature of the applications schools have running on their computers, which in most cases are limited to the standard MS Office package, according to principals. All applications are in English. None of the schools runs Linux (or another open-source operating system), Open Office, or any other open-source desktop application.58
225. Except for one SEDP soum school and the three aimag center schools that feature Internet via dial-up, none of the soum schools has Internet access. In those schools that have, Internet is usually not just for computers accessible to the principal, but also for those used by teachers and students. Internet connection fees are paid directly from the school budget in all of these cases. Some of the principals of the other soum schools state that their teachers travel to the telecommunications office in the aimag center to access the Internet. None of the schools that does have connectivity resells its access, e.g., to the community, to generate revenue.
226. Apart from PCs and printers, schools are equipped with a few other technology items, including laptops, digital cameras, LCD projectors, fax, scanners, photocopiers, and overhead projectors. Some additional items mentioned under “other” are TV and video CD players. Aimag center schools usually feature a broader variety of equipment and in larger numbers than their soum counterparts. The best-equipped school is the IIREM aimag center school, which is also the largest in the province. There are no significant differences in equipment between schools that participated in e-resources initiatives and those that did not except for three items, that of at least one laptop, one LCD projector, and one digital camera having been provided either under IIREM or under this study to IIREM and SEDP schools. The IIREM aimag center school, which functioned as a mentor school for soum schools, received three laptops under IIREM. Despite not having been part of such a project, 50% of control schools do actually have a laptop and one of them also has an LCD projector. At the same time, the other two soum control schools are rather poorly equipped: while one has a copy machine, an overhead projector, and a TV, the other one only has a TV, according to their principals. Exhibit 30, below, illustrates the technologies available by group. In addition, Section VIII.D.2, Reported Access to ICT, below, provides an account of teachers’, training managers’, principals’, and students’ reported access to some of this technology.
58 For a discussion on open source applications, refer to Appendix 7 of the RETA Final Report, the Policy and
Strategy Report.

75
Exhibit 30. Principals’ Technology Inventory at Their Schools
100% 100% 100%
50%
75%
25%
100%
75%
25%
100% 100% 100%
33%
67%
33%
67% 67% 67%
75%
0%
25% 25% 25%
0%
75%
100%
75%
0%
20%
40%
60%
80%
100%
120%
Laptop Digital Camera LCD Projector Fax Scanner Video Camera Copy Machine OverheadProjector
Other
IIREM SEDP Control 227. Summary - ICT Inventory. Electricity is the key challenge among all of the schools that are not located in the aimag center. Soum schools have electricity only on an hourly basis, mostly from diesel generators, but also use wind and solar power. Electricity in most soum schools is available only outside school hours, in the evening.
228. Excluding the generally larger and better equipped aimag center schools, principals in soum control schools report on average a larger number of functioning computers than IIREM or SEDP principals. At the same time, computers in those schools are more likely to still run under the Windows 98 operating system. None of the schools uses any open-source applications and the operating system and desktop applications in use are all in English and Latin script.59 In the majority of schools, most of the computers are situated in a computer lab, and there is also at least one printer. There are more control schools in the sample that have a more “traditional” computer-room setup, organizing computers in rows, facing the front. All IIREM schools have their computers organized along the wall, with the screens facing the room.
229. Except for one SEDP school, none of the soum schools has Internet access. In addition to the number of functioning computers, control schools are also better equipped when it comes to overhead projectors. Otherwise, however, it is clearly participation in e-resources initiatives that allows IIREM and SEDP schools to report laptops, LCD projectors, and digital cameras in their inventory. IIREM schools are in general better equipped than participating SEDP and control schools, and often feature fax, scanner, and copy machines.
59 As discussed earlier, Mongolian (Khalkha Mongolian) is the dominant national language of Mongolia; its dominant
script is Cyrillic orthography.
76
230. Discussion - ICT Inventory. The most surprising finding here is that there are more functioning computers in soum control schools than in IIREM or SEDP soum schools. At the same time, it was not surprising to see that control schools are less well equipped with ICT in general. Apart from not having received the standard project equipment of at least one laptop, one LCD projector, and a digital camera, control schools also feature less of the general equipment these schools have, such as photocopier, fax, or scanner.
231. For the majority of participating soum schools, Internet access is still not available. Under IIREM, teachers therefore wrote e-mails offline and saved them as text files or using an e-mail client such as Outlook to store their messages. The laptop was then given to the teacher traveling next time to the aimag center, and there connected to the Internet for sending/receiving messages.60 This way, even more remote schools managed to receive updated messages and feedback on average every 2 weeks.
232. The issue of the low ratio of available functioning computers in SEDP schools needs further investigation. Under SEDP, an average of five to six computers have been distributed to a number of schools in the country, including those selected for this study. It is rather dramatic to see that within just a few years, most of these computers seem not to be functioning anymore, given the responses from school principals. Discussions during site assessments indicate that only limited training (3 days total) had been provided to some of the computer studies teachers from schools in which computers were distributed. However, training was not given to a representative of all of the schools, nor did the training cover any more advanced issues of computer setup, troubleshooting, and maintenance. It is likely that this limited guidance and the lack of local capacity to optimize use and maintain functionality has considerably contributed to the current desolate state. In addition, there is little opportunity for soum schools to draw on external support for computer maintenance, as they are likely to be the only organization in the entire soum that may have computers, apart from a few private households. For any repair or servicing needs, soum schools need to draw on resources in the aimag center, which may be more than one day of travel away from the soum. The lack of local and regional capacity for equipment servicing and repair, coupled with rather extreme conditions in these locations (unreliable power from generators, high temperature amplitudes, and pervasiveness of sand and dirt), contribute to a highly unfavorable environment for the sustainability of ICT use in soum schools. Future initiatives should explore appropriate solutions to this issue to ensure optimization of the investments taken. IIREM has already taken one step in this direction by equipping regional mentor schools with more laptops, of which one or two are then functioning as replacements while the damaged device is being sent to Ulaanbaatar for repair (see Chapter IV, SEDP and IIREM Projects Overview, above).
2. Reported Access to ICT
233. Teachers’ Access. Responses from teachers to the question of where they access computers are illustrated in Exhibit 31 below, with the answer receiving most responses marked by each group (more than one response was possible; IIREM n=18, SEDP n=19, control n=20).
60 This had become a common habit under IIREM. With no Internet available at their villages, but a great interest in
sharing and receiving information and e-resources from their peers, teachers creatively organized sending school laptops to the aimag center with whomever was traveling there. This happened regularly. This way, the person simply dropped the computer off at the mentor school and/or connected it in the aimag center to download and upload e-mails that may have arrived since last time. IIREM had specifically configured laptops to use a POP 3 e-mail server that allowed for e-mails to be written without actual Internet access. E-mails from village teachers therefore accumulated over the days and weeks until the next person was able to access the Internet.

77
Exhibit 31. Teachers’ Responses to the Question “Where do you use a computer for your work?”
IIREM SEDP Control Q 127 – Answers counts counts counts
I don’t use computers 0 0 8I use the computer in the teachers’ room 5 4 0I have a computer at home 3 4 4I use a computer from the school administration 5 1 6I use the computers in the computer lab 4 11 3Our school has a laptop; sometimes I use that one 15 11 0Other - I use a computer of another person 0 1 0Other - I use a computer at the information center 0 0 1
234. Notably, a clear majority of IIREM teachers mentioned that their school has a laptop, which is what they are mostly using. In addition, IIREM school teachers stated that they also use the computers in the teachers’ room and the school computer lab. SEDP teachers’ responses are equally distributed between using the school laptop and using computers at the school computer lab. A few IIREM and SEDP teachers report having a computer at home. The majority of control group teachers state that they don’t use computers. Those that do, mostly use a computer from their school administration. A more detailed look into the data shows that most of these teachers are from the same school. None of the control school teachers indicates that they use a computer in the teacher room. Three control school teachers mention using the computers in the computer lab; again, these three are from the same school, the aimag center school. Four control school teachers state that they have a computer at home. Most teachers who state that they have a computer at home are at one of the three schools in the aimag center.
235. Training Managers’ Access. Training managers in turn vary in the way they access computers. IIREM training managers are mostly making use of the project-provided laptop, whereas SEDP training managers use those, but also the computers in the computer lab and other computers that the school administration has available. Two of the three responding training managers from control schools state that they share the computers with somebody else in the school administration.
236. Principals’ Access. At least half of SEDP and control school principals have a computer in their office. Among IIREM principals, access is 75% (there is one IIREM principal who does not know how to use a computer).
237. Students’ Access. As can be seen in Exhibit 32, below, a clear majority of IIREM students use computers at the computer lab of the school, much more than their SEDP and control school peers (more than one response was possible; IIREM n=45; SEDP n= 40; control n=42). Nearly the same proportion of students from control schools never use or have access to a computer at all. Of responding SEDP school students, 23% of students from different schools have a computer at home, compared to only a few IIREM and control school students. Most strikingly, 62% of control school students, compared to 20% of SEDP and 11% of IIREM students, have never
“The electricity is bad in the rural [area] so our classmates all collect money [for diesel] to sit at our school’s computers.“ —SEDP student at soum school

78
used a computer. This was confirmed by responses from principals: 50% of principals from control schools stated that their students either don’t use the computer they have at the school, or that there are no computers at their schools. As noted earlier, responses from principals in regard to the ICT inventory, however, show that all schools have some functioning computer. The inventory also indicates that the control schools in the soums have more functioning computers, on average, than IIREM or SEDP control schools (see Section VIII.D.1 above, ICT Environment).
Exhibit 32. Students’ Responses to Where They Access Computers
11% 13%9%
60%
7%
20% 23%
8%
45%
5%
62%
7% 7%
19%
5%
0%
10%
20%
30%
40%
50%
60%
70%
I have never useda computer
I have a computerat home
I use a computerat my friend's
place
I use thecomputers in the
computer lab
Other place
Q47
IIREM SEDP Control
238. Summary. IIREM teachers mainly report using the school laptop, whereas SEDP teachers also use the computers in the computer lab, much more than their IIREM counterparts. Most responding control school teachers indicated that they don’t make use of computers at all. Those that do tend to use a computer from the school administration for access. Some teachers also have a computer at home. Training managers in IIREM schools mostly use the school laptop, whereas training managers in SEDP schools also use the computer lab and computers available to the school administration. Training managers in control schools share a computer with other school administrators. Most principals from all three groups have a computer in their office.
239. A clear majority of students from control schools had never used a computer, whereas the majority of IIREM and SEDP students clearly make use of computers, and do so mostly in the computer lab. It is apparent that more students in schools that participated in e-resources initiatives report access to computers than students in schools that did not.
240. Discussion. Findings related to this question are rather interesting. It is not surprising to see that the majority of control group teachers state that they do not use computers. Those that do, however, mostly use a computer from the school administration; a few of them also use those in the school computer lab. This seems to indicate that in the absence of specific infrastructure provided under either IIREM or this study, teachers at these schools do find ways
79
to access information technology. However, given the overall number of responses, this is comparatively less so than for their peers from IIREM and SEDP schools. Another interesting observation is that there is a strong focus of IIREM teachers on the laptop(s) provided by the project. Only four teachers from two different schools mentioned also making use of the computer labs available. Focus group discussions with IIREM teachers at the outset of the study did highlight some reluctance of IIREM teachers to leverage the computer labs after having received the laptop. Teachers preferred to wait until it was their turn to receive the laptop. Electricity shortages, which made the labs only available during specific hours (when they are also usually being used to deliver computer studies classes; see Section VIII.D.1, ICT Environment), as well as nonfunctioning computers in those labs, are two of the reasons mentioned (also during focus group discussions). In several schools visited during the study site assessment, however, the computer studies teachers mentioned that since IIREM started, the computer lab is being used more often and also by teachers teaching other curriculum areas. With this background, it is very interesting and encouraging to see that SEDP teachers are significantly more willing and engaged in using the school computer labs, equal to use of the laptop. One SEDP teacher also mentioned using a computer at a friend’s place. Finally, an interesting fact to note is the issue of personal ownership of computers. As stated above, most teachers who have a computer at home live in the provincial capital. This may be influenced by a number of reasons; first of all, the overall technology infrastructure in the aimag center is by far better than in many of the villages. This includes access to the central power grid or other reliable power source, as well as Internet connectivity, which allows more reliable, regular, and varied use of such hardware. In addition, access to equipment maintenance and servicing is easier in aimag centers than in remote villages.
241. The most interesting and striking result of this dimension, however, is that of the students. Data show that more students at schools that participated in e-resources initiatives have access to computers than students at control schools. This is despite the fact that control schools in soums, as explained earlier, feature on average more functioning computers than IIREM or SEDP schools. The difference is significant. Some of the difference between IIREM and control school students may stem from the fact that IIREM featured, in selected schools, the so called “dorm project” (for more information, see Chapter IV, SEDP and IIREM Projects Overview, above). In this component, one laptop was provided to a group of students that live in the school dorm for their use. Students also received some training and were then solely responsible for this equipment. However, among the IIREM schools in the sample, this concerned just two of the schools (Jinst and Bumbugur). This may have built capacity among students who may not yet participate in informatics class—and also demand. The answer categories for this question, however, did specifically differ between access to computers in a variety of locations, not only access to computers in general, and therefore should have excluded the additional point of access that the dorm laptop may provide for students in these two IIREM schools. At the same time, the difference between SEDP and control schools was also significant. To verify those assumptions, data from the two schools were excluded and the analysis repeated. The patterns still stayed the same: the majority of responding IIREM students reports access to computers in the school computer lab (54%), with some students also mentioning access to a computer at home (17%), or at a friend’s place (8%). Only 13% of responding IIREM students in this control analysis state that they never used a computer. There is reason to believe, therefore, that despite similar equipment levels in terms of computers in computer labs and classrooms, increased capacity of teachers and schools in areas of ICT and increased use of ICT in classroom teaching simultaneously leads to increased access for students. Targeted research to confirm this relationship would be important to provide further insights.

80
3. Purpose of Computer Use and Source of Capacity
242. Teachers’ Purpose. Both IIREM and control school teachers rank “class/student administration” as their main purpose for using a computer. SEDP school teachers chose “lesson planning” as their first purpose. Both purposes were most often selected from among a list of items, such as information research, sending e-mail, and collaborating with other schools. Some considerable differences can be seen for some items. Specifically, more than half of the respondents from IIREM schools state that they use computers for information research, compared to less than a third of the SEDP teachers and a just about a seventh of control school teachers. A number of SEDP teachers mentioned that one of the purposes is to better learn how to use it in the first place. In addition, some control school teachers specifically say that they don’t know how to use a computer. See Exhibit 33, below, for their answers (more than one response was possible; IIREM n=18, SEDP n=19, control n=20).
Exhibit 33. Teachers’ Responses on What They Use Computers For
Q 128 – Answers IIREM counts
SEDP counts
Control counts
Class/student administration 16 14 14Preparing my lessons 13 16 10Information research 10 6 3Send e-mails 2 5 2Collaborate with other schools 3 3 1Other – gain computer skills 0 3 0Other – don't know how to use a computer 0 0 4
243. Principals from the participating schools confirm a variety of purposes for which their teachers are using the computer, such as administration, classroom teaching, and document/material development. None of them, however, mentions information research. Most participating teachers, as outlined in Section VIII.B, Overview of the Respondents, above, have received some ICT-related training, if only in basic skills either pre-service or during in-service professional development. Of the IIREM principals interviewed, 100% specify that their teachers gained their skills to use a computer from a project. SEDP principals quote a variety of sources, such as a project, university, and other teachers. Control school principals unanimously state that their teachers are self-taught.
244. Training Managers’ Purpose. Training managers also differ slightly in the main purpose for which they are using a computer. IIREM and control school training managers tend to use it mostly for school administration; SEDP training managers for sending data to the education department. In general, responses indicate that IIREM and SEDP school training managers are making use of computers for a larger variety of tasks than their control school counterparts. Nearly all training managers, across all groups, have gotten some ICT-related training during pre- or in-service professional development, in addition to being trained by a project (for nearly all IIREM and SEDP training managers) or acquiring some skills from other teachers (mostly control school training managers).
245. Principals’ Purpose. Principals interviewed mostly use a computer for school administration. There is no difference in this among the groups. There are two IIREM and one control school principal who are using the computer also to send data to the education

81
department. One IIREM principal stated that he does not know how to use a computer, and is relying on the secretary and his children to help him where needed. The other principals in the study acquired their skills to use a computer from a variety of sources, in addition to the ICT-related pre- or in-service training they may have received. IIREM principals were either self-taught or profited from project training. SEDP principals either learned to use a computer at university or on their own. Control school principals mostly taught themselves. One of them mentioned learning to use a computer from a teacher at the school.
246. Students’ Purpose. Of those students who use a computer at all, the majority state that they use a computer to study during the informatics class. There are some students who use computers to learn new software and applications, and a few use them for entertainment. There are also some students, from all three groups, who do not use a computer at all. A few students also mention that they use a computer to prepare documents and presentations. One student uses a computer to search for information and another one to chat. According to their principals, the majority of students use computers for the informatics class. Exhibit 34, below, illustrates in detail the responses of students who stated that they use a computer (more than one response was possible; IIREM n=42; SEDP n=40; control n=30). The majority of students also state that they are self-taught when it comes to computer skills (52% of responding IIREM students, 71% of responding SEDP students, and 69% of responding control school students). If not self-taught, they learned how to use a computer in the informatics subject or from a family member or friend.
Exhibit 34. Students’ Responses Concerning the Purpose for Which They Use a Computer
52%
19%
10%
19%
75%
18%
8%0%
80%
7% 10%3%
0%
10%
20%
30%
40%
50%
60%
70%
80%
90%
To study forinformatics subject
To learn new softwareand applications
To upload pictures,movies and music and
other entertainment
Other purpose
Q48
IIREM SEDP Control
247. Summary. In general, there are no significant differences in the purposes for which teachers are using computers; mainly, computer use is for student and class administration or lesson planning. IIREM teachers are more likely to make use of computers for information research than their peers. Training managers mostly use computers for school administration. Notably, training managers from IIREM and SEDP schools make use of computers for a larger
82
variety of purposes than their control school counterparts. There are no major differences between groups in terms of how principals are using computers: mostly for school administration. Students across all groups who report using a computer, mainly tend to do so for their informatics subject.
248. Discussion. The most notable result in this dimension is that teachers of IIREM and SEDP schools are more likely to use a computer for information research than are their control school counterparts. This may be explained by a variety of reasons. First of all, access to the Internet was promoted under IIREM and actually sponsored for some of the participating schools. This allowed IIREM teachers to become aware of and more versed in using computers and the Internet. The Internet offers myriad new application possibilities, including information research, e-mailing, etc. It has to be said, however, that even though the Internet was an IIREM component, in most participating schools in Bayankhongor this option was in reality very limited. Many rural schools there don’t even have their own dedicated phone line, but utilize the telephone line to the soum telecommunication office. If they have one, often it is only capable of handling local calls (i.e., to the telecommunications office), which means that in order to make or receive calls from another place, the school needs to call the soum telecommunication office first and ask to be connected. This did not allow teachers to really exploit the Internet for this purpose. The situation for the aimag center schools, however, was very different. These teachers functioned as mentor teachers to their soum school peers, with the task to specifically conduct Internet research for digital resources and assets to be used in classroom teaching. Materials were then sent by e-mail or shared via flash drives61 with the village schools, when these were online, or when a member of the community had traveled to the aimag center schools. IIREM teachers’ familiarity with the use of the computer for information research may stem from some of these practices and is one possible explanation for this difference in use of computers among the groups. Secondly, IIREM teachers have been exposed for a longer time to the e-resources provided under the project. Some of these resources are not only education software, but also electronic encyclopedias and asset libraries, which teachers are researching for elements that they can reuse in their presentations and during their classroom teaching. This may have stimulated and ingrained information research as a key purpose for computer use.
4. Policies and Strategies at the School
249. There are clear differences to be seen among IIREM, SEDP, and control schools on the question of school policy on teacher ICT competencies. Of IIREM teachers, 100%, and all but one SEDP teacher, report having a policy on teacher ICT competencies at their schools. These results were confirmed by training managers. This is compared to 95% of control school teachers who state that they don’t have such a policy in their school. Only one teacher from a control school believed that his school had such a tool.
250. In addition to existing guidelines, participating principals were asked whether there are any incentives for their teachers to be innovative and to use ICT in the classroom. All of the principals stated that their schools provide incentives, in one form or another. However, detailed analysis shows that only some of those offered by IIREM and SEDP schools are actually personal incentives for teachers. In general, and most notably among the control schools, schools provide “incentives” in form of diesel/electricity during classes in which teachers want to use ICT. Another such form of incentive is that teachers are allowed to use computers. Control schools do not offer any other, more personalized incentives. SEDP principals report more
61 Under IIREM, teachers learned how to burn CDs and share materials in this way. Several IIREM schools,
however, went on and bought flash drives for the school, which facilitated the process of sharing materials.
83
personalized schemes, including competitions to promote innovation or reimbursement of teachers for some of the extra hours spent on developing teaching and learning materials with ICT. IIREM schools have the most structured approach to providing personal incentives for teachers to encourage ICT use in classrooms and such innovations. At one school, teachers are selected for special professional development programs; at another, skill tests among the teachers are conducted and the winners receives a 15% salary increase, or an outstanding teacher in this regard gets nominated for a government scholarship program in Beijing.
251. Related to Section VIII.C.2, above, Teaching Practice and Evaluation/Assessment, and focusing on strategies for teacher evaluation and criteria on ICT integration, participating teachers and training managers were asked if the evaluation of teachers had criteria related to the use of ICT in the classroom. Just under half of the participating teachers did say that such criteria existed at their school. When specifying the criteria in detail, however, responses indicated links to policies on teacher ICT competencies, rather than to a specific criterion to evaluate their performance. Teachers mentioned that the criteria included basic skills, use of computers for administrative documents, or use of computers to submit documentation. However, training managers also responded that for some teachers, ICT use and application in the classroom is part of their contract.62
252. Summary. There is a significant difference between schools that participated in e-resources initiatives compared to those that did not in the existence of policies guiding teacher ICT competence. Nearly all of the IIREM and SEDP schools feature such a tool. There are also different approaches to providing incentives for teachers to utilize ICT in their teaching. Control schools tend to provide access to electricity and computers, whereas SEDP and IIREM schools offer more personalized and targeted schemes, such as salary increases and scholarship nominations. Furthermore, a large number of participating teachers think there are teacher performance evaluation criteria related to the use of ICT in the classroom in their schools. However, they did not mention a specific criterion, but rather general guidelines that exist at their schools. Training managers interviewed pointed out that some teachers have achievements regarding ICT integration in their performance contracts63 with the school.
253. Discussion. Nearly 100% of all IIREM and SEDP teachers report having a policy for ICT competencies for teachers at their schools. There is reason to believe that this is a direct outcome of a specific intervention under this study. During the August training, as described in more detail in Chapter V, Study Activities, above, school leaders and ECD representatives from study schools conducted detailed discussions on standards of ICT competencies for teachers and administrators. Discussions led to a draft statement developed by the eight schools on “standards of ICT competencies for teachers.” Responses in this area indicate that participating schools have turned these discussions and statements into practice and operation at their schools. At IIREM and SEDP schools, these are combined with different incentive schemes for teachers, with IIREM schools offering the most elaborate and personal of incentive schemes. There are a variety of reasons for this. One of them may be teachers’, training managers’, and
62 At the beginning of each school year, each teacher signs a contract with the school. The contract covers elements
such as teacher outputs in terms of her/his students’ achievement and number of hours teaching, and includes an understanding about not being absent, about the professional development to be undertaken, and issues of incentives and school responsibilities. These may include financial incentives for student wins in Olympiads (see Section III.B for more information), for example. Contracts also specify salary supplements and the like.
63 At the beginning of the school year, a contract is drawn up between every teacher and her/his school, specifying aims and targets (for students, for the teacher’s professional development, and sometimes also for “innovative” elements or professional achievements in other form) for the year and the incentives or “bonus” to be received upon their achievement.
84
school principals’ participation and exposure to discussion on this issue during IIREM and this study. During both initiatives, a critical mass of teachers in each school was engaged, often up to nine or 10 per school. This may, in many cases, be nearly half of the teaching staff of the participating soum schools. Teachers’ exposure to related discussions and training and their experiences in using and applying ICT may have therefore contributed to developing a critical mass of teachers to voice demand for recognition. This explanation receives further weight from a review of principals’ responses to the question of who is making decisions about ICT-related procurement (for more details see Section VIII.D.9, School ICT Financing, Servicing, and Procurement, below). It is clear from the results that principals at IIREM and SEDP schools have a more democratic and participatory system in their schools, compared to control schools. In control schools, principals make 100% of the procurement decisions. In some IIREM and SEDP schools, this is not only initiated by but also decided by the teachers’ board or school steering committee.
254. An additional consideration under policies and strategies is related to the fact that national policies seem to allow a certain level of freedom for schools to allocate savings from budget lines to areas where further funds are needed. This is illustrated by the fact that there is no specific budget line in school budgets for ICT equipment, or its maintenance and servicing. As Section VIII.C.9, School ICT Financing, Servicing, and Procurement, indicates, schools are indeed able to make explicit budget allocations from existing budget lines that allows them to plan for such expenditures. This can be considered a positive aspect of the policy environment. An additional positive aspect of the policy environment is the fact that according to recent reforms, schools are able to locally manage 25% of the curriculum hours, as indicated in Chapter III, Education System Context, above. International studies confirm that certain aspects of the education system—such as the curriculum structure, the school day organization, student assessment regulations, etc.—can be major obstacles to effective ICT integration. The opportunity to manage a fourth of the curriculum hours locally offers opportunities for ICT integration, such as for inter-curriculum teaching, project-based learning, or special ICT student initiatives that should be explored in more detail.
5. Resources and Guidance on ICT
255. The teacher questionnaire also explored where teachers find resources and guidelines on integrating ICT into classroom teaching, and what role the ECD plays in this regard. Most IIREM and SEDP teachers affirm that they do indeed receive guidance and regular support from their ECD on integration of ICT into classroom teaching. This is not the case for control school teachers, 90% of whom state that they do not receive such feedback from the government.
256. Teachers mention a variety of sources from which they receive resources, most notably and with great majority, the IIREM project and this study. However, teachers also draw on other teachers and the Internet for their resources and guidance. A large number of control school teachers did not know where to get such feedback and material. A few of them have been taking part in trainings and seminars on ICT in education and mentioned these as their sources.
257. IIREM training managers responded that their teachers can find resources and guidelines on integrating ICT with teaching methodology from both the ECD and their training managers (themselves). Two of the IIREM training managers also mentioned the role of projects in this regard. SEDP training managers mostly see themselves, but also teachers of other schools in this role. Finally, training managers in control schools are of divided opinion, one mentioning ECD, one herself, and one other teachers as a possible source.
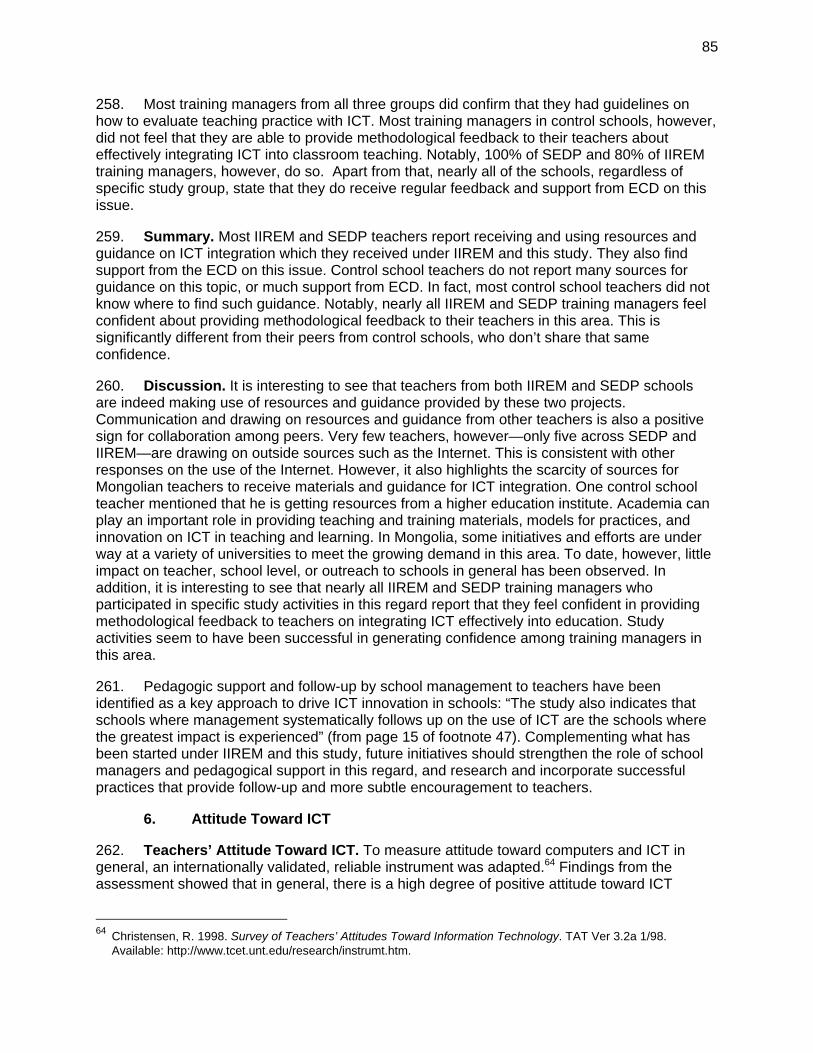
85
258. Most training managers from all three groups did confirm that they had guidelines on how to evaluate teaching practice with ICT. Most training managers in control schools, however, did not feel that they are able to provide methodological feedback to their teachers about effectively integrating ICT into classroom teaching. Notably, 100% of SEDP and 80% of IIREM training managers, however, do so. Apart from that, nearly all of the schools, regardless of specific study group, state that they do receive regular feedback and support from ECD on this issue.
259. Summary. Most IIREM and SEDP teachers report receiving and using resources and guidance on ICT integration which they received under IIREM and this study. They also find support from the ECD on this issue. Control school teachers do not report many sources for guidance on this topic, or much support from ECD. In fact, most control school teachers did not know where to find such guidance. Notably, nearly all IIREM and SEDP training managers feel confident about providing methodological feedback to their teachers in this area. This is significantly different from their peers from control schools, who don’t share that same confidence.
260. Discussion. It is interesting to see that teachers from both IIREM and SEDP schools are indeed making use of resources and guidance provided by these two projects. Communication and drawing on resources and guidance from other teachers is also a positive sign for collaboration among peers. Very few teachers, however—only five across SEDP and IIREM—are drawing on outside sources such as the Internet. This is consistent with other responses on the use of the Internet. However, it also highlights the scarcity of sources for Mongolian teachers to receive materials and guidance for ICT integration. One control school teacher mentioned that he is getting resources from a higher education institute. Academia can play an important role in providing teaching and training materials, models for practices, and innovation on ICT in teaching and learning. In Mongolia, some initiatives and efforts are under way at a variety of universities to meet the growing demand in this area. To date, however, little impact on teacher, school level, or outreach to schools in general has been observed. In addition, it is interesting to see that nearly all IIREM and SEDP training managers who participated in specific study activities in this regard report that they feel confident in providing methodological feedback to teachers on integrating ICT effectively into education. Study activities seem to have been successful in generating confidence among training managers in this area.
261. Pedagogic support and follow-up by school management to teachers have been identified as a key approach to drive ICT innovation in schools: “The study also indicates that schools where management systematically follows up on the use of ICT are the schools where the greatest impact is experienced” (from page 15 of footnote 47). Complementing what has been started under IIREM and this study, future initiatives should strengthen the role of school managers and pedagogical support in this regard, and research and incorporate successful practices that provide follow-up and more subtle encouragement to teachers.
6. Attitude Toward ICT
262. Teachers’ Attitude Toward ICT. To measure attitude toward computers and ICT in general, an internationally validated, reliable instrument was adapted.64 Findings from the assessment showed that in general, there is a high degree of positive attitude toward ICT
64 Christensen, R. 1998. Survey of Teachers’ Attitudes Toward Information Technology. TAT Ver 3.2a 1/98.
Available: http://www.tcet.unt.edu/research/instrumt.htm.

86
among participating teachers; however, there were not significant differences among the groups. A slightly lower mean score is to be found among the SEDP teachers, compared to the other two groups. Illustrating the general pattern of replies, responses to “I enjoy doing things on a computer” showed that more than 68% of all teachers strongly agree and nearly 32% of teachers agree with this statement; not one teacher disagrees. “I think it is critical for teachers to learn how to use new technology in the classroom” is similarly supported: 59% of responding teachers agree, an additional 41% even strongly so, and none of the responding teachers disagrees. In addition, as Exhibit 35 below illustrates, confidence levels of teachers in using technology in their teaching are high (IIREM n=17, SEDP n=19, control n=20). Responses reflect high levels of confidence among all teachers, including those from control schools, with more than 82% of responding IIREM teachers, 100% of responding SEDP, and 90% of responding control school teachers feeling confident about using technology in their teaching.
Exhibit 35. Teachers’ Responses to the Statement “I feel confident using technology in my teaching”
0%6%
12%
47%
35%
0% 0% 0%
79%
21%
0%
10%
0%
50%
40%
0%
10%
20%
30%
40%
50%
60%
70%
80%
90%
Stronglydisagree (1)
Disagree (2) Undecided (3) Agree (4) Strongly agree(5)
Q151
IIREM SEDP Control
263. Specifically concerning the use of e-resources, there is a strong attitude among all teachers that complementing textbooks with e-resources can promote student learning. All IIREM teachers, nearly 95% of SEDP teachers, and 90% of control school teachers either agree or even strongly agree with this statement. More control school teachers strongly agree than IIREM or SEDP teachers.
264. Some selected statements provide a more differentiated view. Exhibit 36 below illustrates responses to the statement, “I believe ICT offers new opportunities for professional development” (IIREM n=18, SEDP n=19, control n=20). As can be seen, responses are more varied, with a fifth of control school teachers either being undecided or disagreeing with this statement, and more than 72% of IIREM teachers, 47% of SEDP, and 40% of control school teachers strongly agreeing.

87
Exhibit 36. Teachers’ Responses to the Statement “I believe ICT offers new opportunities for professional development”
0% 0% 0%
28%
72%
0% 0% 0%
53%47%
0%
15%
5%
40% 40%
0%
10%
20%
30%
40%
50%
60%
70%
80%
Stronglydisagree (1)
Disagree (2) Undecided (3) Agree (4) Strongly agree(5)
Q138
IIREM SEDP Control
265. Exhibit 37, below, shows responses to “I think there are health risks to exposing students to and myself to computers” being more differentiated (IIREM n=18, SEDP n=18, control n=20). There, 50% of IIREM and SEDP teachers disagree or even strongly disagree with this statement, compared to 40% of control school teachers. However, 22% of IIREM, 17% of SEDP, and 50% of control school teachers agree or strongly agree with the statement.
Exhibit 37. Teachers’ Responses to “I think there are health risks to exposing students and myself to computers”
6%
44%
28%
22%
0%
6%
44%
33%
17%
0%
25%
15%10%
45%
5%
0%5%
10%15%
20%25%30%
35%40%
45%50%
Stronglydisagree (1)
Disagree (2) Undecided (3) Agree (4) Strongly agree(5)
Q142
IIREM SEDP Control

88
266. Concerning the cost of ICT in relation to its application to education, responses are also much more differentiated, reflecting teachers’ personal opinions. As Exhibit 38 below illustrates, responding IIREM teachers’ answers are nearly equally distributed, with about a third disagreeing with the statement, a third being undecided, and a third agreeing (IIREM n=18, SEDP n=18, control n=20). Half of the responding SEDP teachers agree, but nearly 40% of them either disagree or strongly disagree with ICT being too costly to be a valid tool in education. Finally, control school teachers are optimistic about the cost of ICT for education, with 60% of the responding teachers from control schools disagreeing, and only about a third of them affirming the statement.
Exhibit 38. Teachers’ Responses to the Statement “I think ICT is too costly to be a valid tool in education”
11%
22%
33%28%
6%6%
33%
11%
50%
0%
10%
50%
10%
20%
10%
0%
10%
20%
30%
40%
50%
60%
Strongly disagree(1)
Disagree (2) Undecided (3) Agree (4) Strongly agree (5)
Q144
IIREM SEDP Control
267. A large portion of the responding IIREM teachers (44%) are undecided as to whether changing the curriculum to integrate technology is taking too much time. At the same time, nearly 45% of IIREM teachers, however, do disagree—compared to 42% of the responding SEDP teachers. Control teachers yet again are a bit more optimistic, and 55% of those responding disagree that changing the curriculum to integrate technology requires too much training. A large number of responding SEPD teachers, over 42%, do think, however, that changing the curriculum to integrate technology is taking too much training.
268. Finally, participating teachers do not seem to be hindered by issues with technology and computer performance or equipment failure. More than 86% of all participating teachers, a clear majority, do not think that computers break down too much to be of very much use.
269. Training Managers’ Attitude Toward ICT. The same attitude scale was also applied to participating training managers. Here, results indicate that while IIREM and SEDP training managers have a level of positive attitude toward ICT comparable to their teachers, training managers in control schools have a significantly more positive attitude to ICT compared not only to their peers from IIREM and SEDP schools, but also to their own teachers. Training managers

89
in control schools are more likely to think they are confident in using technology in their own teaching than are teachers from IIREM and SEDP schools. They are also significantly more convinced that ICT offers new opportunities for professional development.
270. Like statements of the teachers, responses of training managers to the question whether they think there are health risks to exposing students and themselves to computers vary: 50% of IIREM and 25% of SEDP training managers are undecided about the statement; 33% of control school training managers agree. Some 67% disagree, together with 75% of SEDP and 50% of IIREM training managers. Training managers’ responses regarding ICT being too costly to be a valid tool in education are vary. Of IIREM and SEDP training managers, 25% think that ICT is indeed too costly to be a valid tool in education. But the majority, 75%, disagrees. Training managers from control schools are mostly undecided; a third of them, however, strongly disagree.
271. Principals’ Attitude Toward ICT. The same attitude scale that was administered to teachers and training managers was also given to principals. Results indicate that there are no significant differences in the overall attitude toward ICT between principals whose teachers and schools had been part of e-resources initiatives and those whose had not. This is consistent with results from teachers and training managers. Furthermore, among all participants to whom this scale was administered, principals of control schools had the most positive attitude toward ICT—more than any IIREM, SEDP, or other control school teacher, training manager, or group of principals.
272. In order to gain a more detailed view of their attitude to ICT, principals had also been asked to provide more details about the role they see for ICT in their schools and its potential to improve education quality. Unanimously, principals agreed that ICT is important to have at schools for use as a teaching tool, although for different reasons. Among them were:
• Because computers facilitate their work and jobs
• Because we live in the IT era, so everybody should use them
• Because society is developing fast and no teacher or student will communicate with each other without IT
• Because students are to be provided with quality education and teachers need to be able to show and deliver content
• Because IT is critical and an everyday need in the country and in the world
• Because computers can be used for training, but at the same time are an important tool for teaching students
• Because computers have become an everyday demand and a necessary tool to receive information
273. Clarifying educational goals, principals were asked to state what sort of skills, apart from subject matter knowledge, they hope to equip their students with, and which of these they believe ICT can positively impact. Some of their responses are outlined below. There were too few principals in the study to explore any significant difference between groups, and principals
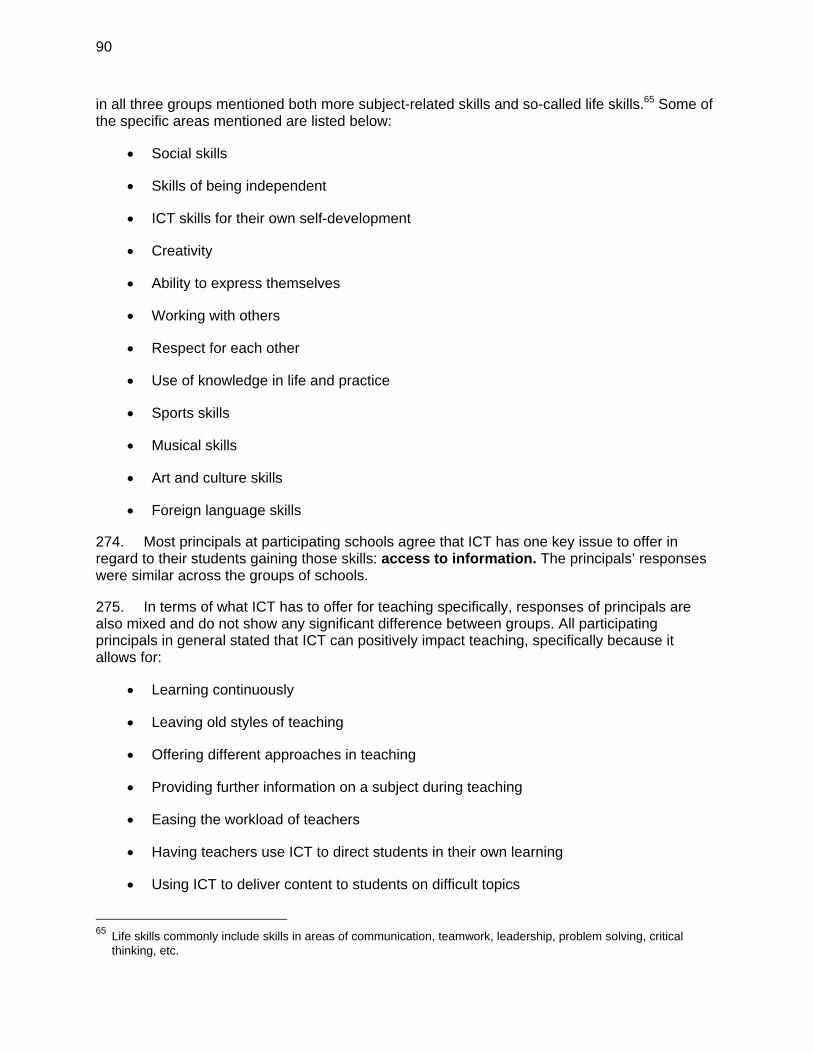
90
in all three groups mentioned both more subject-related skills and so-called life skills.65 Some of the specific areas mentioned are listed below:
• Social skills
• Skills of being independent
• ICT skills for their own self-development
• Creativity
• Ability to express themselves
• Working with others
• Respect for each other
• Use of knowledge in life and practice
• Sports skills
• Musical skills
• Art and culture skills
• Foreign language skills
274. Most principals at participating schools agree that ICT has one key issue to offer in regard to their students gaining those skills: access to information. The principals’ responses were similar across the groups of schools.
275. In terms of what ICT has to offer for teaching specifically, responses of principals are also mixed and do not show any significant difference between groups. All participating principals in general stated that ICT can positively impact teaching, specifically because it allows for:
• Learning continuously
• Leaving old styles of teaching
• Offering different approaches in teaching
• Providing further information on a subject during teaching
• Easing the workload of teachers
• Having teachers use ICT to direct students in their own learning
• Using ICT to deliver content to students on difficult topics
65 Life skills commonly include skills in areas of communication, teamwork, leadership, problem solving, critical
thinking, etc.

91
276. Students’ Attitude Toward ICT. Students were given an adapted and shorter scale capturing their attitudes to ICT compared to that given to teachers, training managers, and principals. In general, there is a slightly more positive attitude toward ICT to be identified among students of teachers who participated in e-resources initiatives, compared to students of teachers who did not. Differences, however, are not significant. There are differences to be noted, however, concerning specific statements. Exhibit 39, below, illustrates students’ responses to the statement “I enjoy doing things on a computer” (IIREM n=42, SEDP n=42, control n=39). In general, IIREM students are more likely to respond positively to this statement than their SEDP and control school counterparts. On this statement, differences are significant between those students whose teachers participated in e-resources initiatives and those whose did not.
Exhibit 39. Students’ Responses to “I enjoy doing things on a computer”
2% 5% 5%
88%
12%
0%
12%
76%
13%8%
18%
62%
0%
10%
20%
30%
40%
50%
60%
70%
80%
90%
100%
No Maybe no Maybe yes Yes
Q50
IIREM SEDP Control
277. Students across the three groups are also of a similar opinion when it comes to the role ICT can play in their future. The majority of them think that if they learn how to use a computer, they will get a good job. Exhibit 40, below, provides an overview of the students’ responses (IIREM n=42, SEDP n=42, control n=41).

92
Exhibit 40. Students’ Responses to “I will be able to get a good job if I learn how to use a computer”
5%7%
43%45%
0% 0%
52%48%
12%
2%
29%
56%
0%
10%
20%
30%
40%
50%
60%
No Maybe no Maybe yes Yes
Q52
IIREM SEDP Control
278. Summary. Although there are some differences to be seen on selected statements capturing teachers’ attitudes toward ICT, summative results did not yield any significant differences in this dimension. In fact, the group with the lowest mean score on this dimension is that of the SEDP teachers. Overall, however, our data did not indicate a significant difference in attitudes toward ICT among teachers who participated in e-resources initiatives compared to teachers who did not.
279. Applying the same scale to training managers and principals, however, yields more differentiated results. Due to the very small sample size of these groups of respondents, these have to be considered with care, however. Training managers in IIREM and SEDP schools share the same results on this assessment; however, training managers from control schools show a significantly more positive attitude toward ICT than their IIREM and SEDP counterparts. Principals from control schools are the most positive in their attitude toward ICT compared to their IIREM or SEDP counterparts or any other group in the study.
280. On an adapted scale, a slightly more positive attitude to ICT was recorded for students whose teachers participated in e-resources initiatives, compared to those who did not. While differences are not significant, students in IIREM and SEDP schools tend to have a more positive attitude toward ICT than their control school peers.
281. Discussion. Overall, the actual results confirm trends already observed in interviews and focus groups. Findings do not indicate any significant differences in attitude toward ICT among teachers who participated in e-resources initiatives and those who didn’t. The high scores across all groups are quite notable from an international perspective, however, when analyzing teachers’ confidence in using technology in their teaching. Data from other studies in Europe show that a large portion of European teachers do not feel that confident applying ICT in

93
their teaching, despite huge investments in both infrastructure and training by their respective governments: “As regards pedagogical ICT skills, less than half of teachers (40%) consider themselves competent enough to use ICT in a didactically acceptable manner.”66 Study contexts, however, were certainly different and results may therefore not be comparable. Furthermore, teachers in the European study may have higher or different standards and/or a different definition of what “didactically acceptable” means. At the same time, it does illustrate an interesting aspect already observed during site visits and focus groups—that is, teachers, especially in rural schools, tend to be very interested and willing to innovate. Professional development opportunities are accessed to the extent possible, participation in projects is enthusiastic, and the willingness to change is considerable, even if it requires substantial investment of personal time. It may, however, be prudent to be realistic about participating teachers’ capacity to self-assess and reflect about their capacities in regard to technology integration, especially when focusing on “didactical appropriateness.” One of the reasons may be, as indicated earlier, that teachers in the study may have different standards or mental models on high-quality teaching and “good” ICT integration, compared to what current knowledge in education may suggest. Earlier discussions on what defines a good teacher underscore this point.
282. While there is a lot of optimism, whether substantiated or not, data indicate at the same time that participants are not indiscriminatingly in favor of ICT. Especially concerning the issue of ICT and health risks, responses clearly indicate that there is a big need for education in this area and providing appropriate information to teachers and administrators. In addition, responses to the application of ICT to professional development seem to indicate limited awareness and experience, especially among control school teachers, to leverage technology in education for this purpose. Given the absence of a specific initiative or project that would highlight this aspect, this clearly indicates that this potential does not yet seem to be fully exploited in the country. Some initial steps have been taken under IIREM, where lessons were videotaped, then reviewed and commented upon, with comments shared with IIREM schools during trainings. However, elaboration of this aspect has been rather limited within the scope of the project, something to be possibly explored in more detail for future initiatives. This area was not part of this study in Mongolia, but the focus of study activities and research in Nepal. Research findings can be studied in the Nepal Country Report.67
283. The higher level of optimism among participants, especially training managers and principals from control schools, is also important to note. It may be that their limited experience with effective integration of ICT so far has not yet given them exposure to the myriad issues and factors that this raises and the organizational adjustments it requires. Clearly, IIREM and SEDP school managers, while still being positive, are more moderate in their attitude toward ICT because they are able to base their feedback on a more informed foundation than control school training managers and principals can. It would be important, therefore, in advance of future initiatives, to allow for an open, facilitated exchange among school managers whose schools already participated in e-resources initiatives and those whose schools did not. Expectations would need to be managed in order to avoid disillusionment and disappointment. Again, international and local experience indicates that school managers play a key role in promoting innovation at their schools. This needs to be taken seriously into account for scaling up ICT in
66 Kessel, van N. et al. 2005. ICT Education Monitor: Eight Years of ICT in Schools. Ministry of Education, Culture
and Science, The Netherlands. In European Schoolnet. 2006. The ICT Impact Report. A Review of Studies of ICT Impact on Schools in Europe. Brussels. 44.
67 See Appendix 10 of the RETA Final Report, the Nepal Country Report.

94
education initiatives in the country, as is currently planned under the Third Education Development Project.68
7. Teachers’ Levels of Technology Adoption
284. There are significant differences to be noted from the self-reported levels of technology adoption69 by teachers. As seen in Exhibit 41 below (IIREM n=18, SEDP n=19, control n=19), the majority of responding IIREM and SEDP teachers self-report their technology adoption as Level 5 — Adaptation to other contexts. However, nearly 39% of responding IIREM teachers even rate themselves at the highest level of technology adoption, Level 6 — Creative application to new contexts. This is compared to 21% of responding SEDP and nearly 16% of responding control group teachers rating themselves at this high level. More than 42% of responding teachers from control schools rate themselves lower than Level 4, compared to 5% of SEDP and none of the responding IIREM teachers. More than a fourth of the responding control school teachers explicitly state that they have not yet reached beyond the first stage — Awareness, in their level of technology adoption.
Exhibit 41. Teachers’ Self-Reported Level of Technology Adoption
0% 0% 0%
11%
50%
39%
0% 0%5%
21%
53%
21%26%
5%11%
21% 21%16%
0%
10%
20%
30%
40%
50%
60%
Level 1 -Awareness
Level 2 -Learning the
process
Level 3 -Understandingand applicationof the process
Level 4 -Familiarity and
confidence
Level 5 -Adaptation toother contexts
Level 6 -Creative
application tonew contexts
Q159
IIREM SEDP Control
68 The Third Education Development Project, an ADB-funded loan to the Government of Mongolia, will feature “(…)
30 schools that will be technologically upgraded through the provision of (i) information and communication equipment and software for developing and producing teaching and learning materials, (ii) teaching equipment for multipurpose rooms, and (iii) textbooks and reference materials for library facilities.” From ADB. 2006. Loan Agreement Between Mongolia and the Asian Development Bank. LAS: MON 34187. Manila.
69 The self-assessment scale and corresponding rubrics were taken from Christensen, Rhonda. 1997. Stages of Technology Adoption. Available: http://www.tcet.unt.edu/research/survey/stages.htm.

95
285. Discussion. The findings on this item clearly confirm and highlight the differences in ICT exposure, capacity, and access of teachers across all three groups. Notably, IIREM teachers, who have enjoyed capacity building and access to technology for the longest time (compared to the other two groups), rate their technology adoption level much higher than others. SEDP teachers, in turn, who had received professional development and some equipment to provide access only through study activities, rate themselves lower than their IIREM counterparts. Both of these groups, however, are clearly more advanced than teachers from the control schools. Nonetheless, there are a number of teachers in control schools that possess and report a high degree of confidence and level of adoption; most likely these are ICT in education champions in their schools.
286. Great strides have been made in Mongolia during the past few years, especially triggered and driven by projects such as IIREM, and many Mongolian teachers have achieved a level of ICT familiarity and adoption that may even be comparable to that of many teachers in more developed countries. At the same time, many teachers in the study are still in rather early stages of technology adoption.70 That is, classroom observations, focus groups, and interviews with teachers and training managers indicate that ICT is mainly being used to support rather traditional teacher methods and practices. In addition, as results under Section VIII.C.2, Teaching Practice and Evaluation/Assessment show, there is no indication that teaching methods and practices in general have changed through participation in e-resources initiatives. Similar experiences have occurred internationally, as findings of other assessments indicate.71
287. To date, teachers in IIREM and SEDP schools are mainly using ICT to display presentations that they prepared in advance of the class. According to IIREM teachers, this allows them to save time by not having to actually do the blackboard write-up during class. Teachers also advanced to integrating graphics and visuals with presentations that provide visual illustrations for their students, complementing students’ textbooks. Again, similar experiences have taken place internationally, as illustrated in the text box above. Furthermore, teachers have started to innovate in their teaching practice, by designing exercises and models using ICT that would allow their students to also engage with the technology. This way, ICT is 70 Adapted from Apple Classroom of Tomorrow (ACOT) research (ACOT. 1995. Changing the Conversation About
Teaching, Learning and Technology. Apple Computer. Cupertino. 16.), the IIREM Final Report (see page 18 of footnote 37) outlined a five-step model of ICT innovation: (1) Entry – Teachers learn the basics of using the new technology; (2) Adoption – Use of new technology to support traditional instruction, e.g., replace OHP and blackboard with PowerPoint; (3) Adaptation – Teachers integrate new technology into traditional classroom practice, and focus on increased student productivity and engagement by using word processors, spreadsheets, and graphic tools; (4) Appropriation – Focus on cooperation, project-based and interdisciplinary work, and incorporating technology as needed and as one of many tools; (5) Invention – Teachers discover new uses for technology tools, for example, developing spreadsheet macros for teaching algebra or designing projects that combine multiple technologies.
71 See pages 41–49 of footnote 47 and J. Underwood et al. 2006. Evaluation of the ICT Test Bed Project. Annual Report 2006. 7. Available: http://www.evaluation.icttestbed.org.uk/files/ict_test_bed_evaluation_2005.pdf.
“Being able to prepare my write-up on a PowerPoint presentation before class allows me to save up to 10 minutes per lesson, in which I can now conduct more practical exercises with my students.” —IIREM teacher, Bumbugur
“The use of presentation technologies (data projectors and ancillary equipment such as interactive whiteboards and visualisers) led to rapid development of teachers’ ICT skills, and a more interactive style of teaching. The value which arises from preparation of slides and lesson images fits closely with what teachers like to do and encourages them to plan their lessons in greater detail. In doing this, their computer skills were implicitly increased and ICT became an embedded natural part of their classroom.” —ICT Test Bed Study, UK, 2006

96
predominantly used to support existing teaching methods, but students are still more or less passive consumers of knowledge.72 Again, this is not surprising, given that the focus of the training input under IIREM was on providing teachers with computer skills rather than with methodological guidance and hands-on training. Only 2 days of the initial training organized under this study were allocated to familiarize SEDP teachers with the laptops and other equipment and provide a short introduction to some of the most common desktop applications. 288. The study also provided self-study software, which had also been distributed under IIREM, for some of those desktop applications to SEDP teachers. After that, the initial training and all other follow-on trainings focused on issues of didactic and pedagogic integration, ranging from helping teachers critically evaluate the content and objectives of integrating electronic teaching and learning materials, such as slides or snippets of education software, into their classroom teaching. Follow-up training also provided an introduction to using ICT in project-based learning. However, as data analysis confirmed, this ICT-related professional development program has not yet affected teachers’ general teaching methodologies. There were no differences in general on this dimension between those teachers that participated in training under this study and those that did not. Research on the relationship between ICT-related professional development, teachers’ instructional use of technology and teachers’ general teaching practices is ongoing. A recent study concluded the following, which further informs this discussion:
The relationship between technology and constructivist practices is a complex one. In some situations, technology can actually promote more constructivist-compatible instruction. In other cases, it simply supports the existing instruction. Our research suggests that the interaction may depend at least partly on the type of professional development received.73
289. The activities of this study were built on the paradigm that if professional development programs on ICT integration focus on pedagogical deliberations and are coupled with practice hands-on training in the design of student-centered learning experiences, teachers in turn, are more likely to adopt such practices in their own classrooms. Professional development programs to date, however, would need to be complemented by ongoing training that would
72 There is an interesting linkage between how principals define a good teacher and this observation. A number of
principals in the study indicated that a good teacher “provides 100% of knowledge to the students,” or “can deliver the required education.” Such definitions indicate a very teacher-centric model of education, where students are primarily seen as the receivers of information and knowledge that is “provided” or “delivered” to them by their teachers. See Section VIII.C.2, Teaching Practice and Evaluation/Assessment.
73 Matzen, N.J., and Julie A. Edmunds. 2007. Technology as a Catalyst for Change: The Role of Professional Development. Journal of Research on Technology in Education. 39 (4). 417-430. 428.
“Preparing presentations for my classes takes me a lot of time, and I now spend more effort on preparing my lessons than before. With the presentations, my work becomes much more visible, so I want it to be good. I usually share my presentation with other teachers, something I did not do before with my lesson plans or other materials. But with IIREM, we are all still learning and it really helps to get feedback from my colleagues on how to improve my presentations or methodology. At the beginning, we were all really excited about the animation effect and prepared teaching aids that had a lot of sounds, colors, and moving elements. After trying to teach with these aids, however, we learned quickly that they distracted students. Now we feel students are more motivated, because they like being able not only to write a text on the chalkboard or look at pictures in their textbooks, but also that I can show them a new picture or graphic and play sounds of animals, which they enjoy very much.” —IIREM teacher, Jinst

97
highlight such practices. Future initiatives in this regard, therefore may focus on designing a locally appropriate, integrated professional development program that builds on those investments already done and further exposes teachers to instructional practices that are more student-centered.
290. Also, as findings from this study indicate, participating Mongolian teachers seem to follow a certain path in their technology adoption, which was started under IIREM. The path begins with awareness and familiarity with the technology and moves to integrating technology into classroom teaching to enhance existing teaching practices, which is what participating teachers have been doing in developing and using presentations in their teaching. This already indicates a considerable learning curve and advancement in the integration of technology to enhance student learning. The text box above, telling the story of one teacher, illustrates some of this learning process and her impact analysis. To fully identify the next steps on this path, however, more detailed research, especially among IIREM teachers, including extensive classroom observations, should be conducted as soon as possible and at regular intervals. Mapping this process will help to identify targeted interventions that can further this process and will help design professional development programs that can build on those experiences to accelerate technology adoption for other teachers in the country.
291. There is an another consideration, however, related to this aspect that may factor into results: that of the ICT equipment available. As it is, the IIREM and SEDP schools participating in this study received a very specific, rather low-tech equipment package that provides both opportunities and challenges. All schools already had some form of a computer lab to teach the compulsory computer studies classes. IIREM and SEDP schools, through their participation in the e-resources/ICT initiatives, also received one laptop and one LCD projector (in addition to a digital camera) per school. This equipment package provided teachers with the opportunity to more easily integrate ICT into classroom teaching by simply carrying the laptop and project to their classes. They did not have to book the computer lab74 and move the whole class into it, then get the students settled and deal with myriad issues until every team of students was set up. In addition, because the number of computers available in these schools is low (see Section VIII.D.1, ICT Environment), teachers would need to group students often at a 5:1 ratio around one single computer. By the time they managed to achieve this, a large part of their classroom time was gone. The mobile model of a laptop and LCD projector has clearly offered entirely new possibilities for teachers to utilize ICT in everyday classroom teaching. Teachers have quickly realized how they can use this configuration to enhance, facilitate, and innovate in their existing teaching methods, and have capitalized on this. In sharing lesson write-ups, providing additional illustrations and visuals, and integrating some interactive activities, teachers have already learned important technical and methodological lessons for themselves (again, see text box above). At the same time, with a lack of practical experience in translating theoretical models of student-centered learning into practice, participating teachers have not yet been able to fully exploit the potential of even the available ICT. The lack of some of the most powerful ICT tools, such as broadband Internet, school networks, or several computer stations per classroom, does certainly restrict somewhat the way and extent to which ICT can revolutionize teaching and learning. However, there are existing international experiences and sources to draw on that provide ideas and models for effective integration of such lower-tech configurations into
74 Interviews yielded a clear school-level barrier to effective ICT integration across subjects. Even if there is
electricity, the existing equipment and computers, mostly in computer labs, are usually reserved for teaching the computer studies classes and therefore not available to other teachers or subject-matter classrooms. More discussion appears in Section VIII.D.1, ICT Environment.

98
teaching and learning.75 Such inspiration and models, locally verified and adapted, are currently lacking in Mongolia.
292. International studies76 suggest that some of the more effective and revolutionary ICT application models may not necessarily take place in traditionally structured classroom settings. It seems as if very structured education systems that leave little leeway for innovation, featuring rigid student assessment structures and possibly lacking dedicated room for approaches such as student self-study units, cross-cutting curricula, project-based learning, problem-based learning, or case-based learning, pose additional limits on innovative ICT integration.
8. School System Support of ICT
293. In addition to the guidance and resources they may receive from the ECD, as discussed in Section VIII.D.5, Resources and Guidance on ICT, principals from participating schools were asked whether they receive any nonfinancial support from the soum, aimag, or national government on a variety of issues related to ICT. Most principals reported receiving support from these levels of the system, although the nature of the support varies. Among IIREM principals, they state that they receive mainly in-kind support in the form of training in computer skills for their teachers and themselves. SEDP principals seem to experience a wider variety of support, mostly in pedagogical ICT integration and in making budget decisions on ICT. Control school principals did not mention a lot of support being given to them in general, but when they did, it was mostly in form of basic computer skills training for their staff or themselves.
294. In addition, principals unanimously agree that they do have a chance to express their views on ICT or challenges their school is facing that pertain to ICT. For most principals this is not on a national level, but on a regional and village level. Most teachers specifically mention the principals’ meeting that is being organized regularly by the ECD and the teachers’ conference. In terms of the topics of such consultations, some principals specifically state the following: access to ICT; demand for ICT; role of ICT in changing teachers’ attitudes and teaching methodology; requests to participate in ICT projects; and general challenges.
295. Summary. Principals from participating schools tend to receive nonfinancial support regarding ICT from the soum, aimag, or national government, mostly in the form of training for themselves or their staff. There are no significant differences among the groups of schools on this item. In addition, most participating principals stated that they have an opportunity to express their views on ICT (e.g. on access issues, integration issues) at least at the regional level—e.g., during general principals’ and teachers’ meetings.
296. Discussion. Involvement and linkages with the ECD have been addressed in a variety of dimensions already discussed in this report related to training, guidance, evaluation criteria, and other resources. It is clear that the role of the ECDs is critical for effective ICT integration, and that the support and stakeholder buy-in from the ECD in Bayankhongor has certainly contributed to the impressive achievements under IIREM, and the activities under this study. Because ICT integration is a challenge not only of a pedagogical nature, but also of
75 As an example, the International Society for Technology in Education has edited and published a variety of books,
providing ideas, lesson plans, and models of ICT integration for different subjects and grade levels. In addition, these books outline scenarios and models for a variety of equipment configurations, such as “having one computer in your classroom.” Specific books here are part of the National Education Technology Standards project’s curriculum series; more information can be found at http://www.iste.org.
76 European SchoolNet. 2006. The ICT Impact Report. A Review of Studies of ICT Impact on Schools in Europe. Brussels.

99
organizational change management, the ECDs play an important role in supporting and enabling schools to undertake the required changes. As indicated above, this may include adjustments in areas such as teacher performance evaluation, teaching practices, curriculum, financing, and procurement, as well as student assessment. During IIREM, the ECD in Bayankhongor had been fully engaged in trainings and activities, the same as in the implemen-tation of this study. This ongoing commitment was enhanced by internal capacity building and human resource investments. Specifically, there are incidences where the ECD has recruited (even very young) IIREM teachers and IIREM school principals to its staff in order to better address the needs and challenges of ICT integration in the 25 schools in the province. In addition, the ECD has been supportive of this study, by acknowledging the training provided as official in-service professional development credits for the participating teachers. Furthermore, the ECD was instrumental in the design of a draft set of teacher ICT competency standards as part of this study. Results from the study show near universal adoption of some form of such standards in all participating IIREM and SEDP schools (see Section VIII.D.4, Policies and Strategies at the School). This strong buy-in and support by the ECD should be further enhanced and capitalized on in a concerted manner with other inputs on national, school, teacher, and community levels. Possible areas are e-resource development and evaluation, models of pedagogic integration, teacher professional development and related standards, or even areas of equipment and procurement, so that they can provide better guidance and advice to their schools.
297. From the responses of principals on the specific dimension of system-level support, it is encouraging to see that principals are indeed able to express themselves and share experiences on ICT integration. Together with training managers, principals’ support and active participation in ICT integration is a must for any sustainable impact on education quality to be achieved. As confirmed by international studies, the full buy-in and active promotion of the school management, and the related will to institute organizational changes, are necessities (from page 50 of footnote 47). School-level barriers to effective ICT integration are manifold, including lack of electricity and access to the Internet, shortages in functioning and appropriate equipment to support integration, lack of appropriate e-resources that facilitate curriculum teaching, and lack of appropriate pedagogic models to guide pedagogical integration. School management may be able to address some of these, given enough will and support (by teachers and also parents) to do so. For this, however, school management would need information and tools to help not only make the necessary changes, but also communicate their purpose and objectives to the constituency. In addition—and first steps have been taken in this regard—appropriate policies and strategies, such as standards on ICT competencies, recommendations for professional development programs, incentives for innovative teachers, and general support for invention and exploration, are school management responsibilities that also directly affect teachers’ capacity and motivation. Findings from this study in the dimensions of teacher evaluation/assessment (Section VIII.C.2), teacher job satisfaction (Section VIII.C.6), and policies and strategies at the school (Section VIII.D.4) further inform this area.
298. Future initiatives, therefore, have to strengthen not only system-level actors such as the national ministry and regional ECDs, but also local school management in order to generate and promote an enabling environment in which innovation and change are nurtured and ICT integration can truly and sustainably impact education quality.
9. School ICT Financing, Servicing, and Procurement
299. School financing and ICT procurement are important issues related to cost in general and to total cost of ownership in regard to ICT specifically. The study researched among

100
participating principals the financial aspects of ICT integration in schools, issues of IT service and maintenance, means by which schools are making decisions on ICT procurement, and whether and what sort of fundraising activities are being conducted to offset expenditures, especially for electricity.
300. Most of the schools received their computers from donations from the community or a specific person (e.g., Member of Parliament) or via donor funding. Two schools (one each, SEDP and IIREM) also used their school budget for purchasing equipment. Most schools have had computers since 2003; some, however, since as early as 1987. Except for one incidence, schools reported that their computers were purchased or received new.
301. The aimag center schools, much larger (in terms of enrollment) than their soum counterparts, have on average an annual school budget of MNT507,984,433 per year ($427,957). The participating soum schools have an average school budget of MNT108,000,000 ($91,062). Soum schools in the study have between 300 and 700 students, compared to participating aimag center schools that boast some 2,500 to 3,400 students. In general, schools receive standard per capita budget allocations. For each child at the primary level, it is MNT75,323 ($64); for a child at the secondary level, it is MNT97,242 ($82); and at the high school level it is MNT94,634 ($80) per year.77
302. For most participating schools, there is some room at least for covering expenditures for hardware maintenance. Schools mainly draw on their “lesson and practice” or “procurement and services” budget lines for those funds. According to interviews with principals, there is some leeway for them to use savings from other budget lines for this purpose as well. Schools that don’t have a specific allocation tend to draw on such savings as needed, as anecdotal evidence indicates. Expect for two IIREM schools, all schools allocate funds for expenditures for servicing and maintaining their computers and equipment. Budget allocations for this line vary. The IIREM school in the aimag center allocates about MNT20 million ($16,878) per year, the SEDP aimag center school about MNT900,000 ($759), and the control school in the aimag center about MNT800,000 ($675) per year. The soum schools, on average, allocate the following: IIREM – MNT750,000 ($633); SEDP – MNT1,725,000 ($1,454); and control – MNT1,643,333 ($1,387). The IIREM aimag center school, therefore spends about 3.9% of its annual school budget on this issue. The SEDP aimag center school dedicates about 1.6%, and the control aimag center school just about 0.2%, of its annual school budget. The one IIREM soum school that makes such budget allocations earmarks about 0.7% of its annual school budget, compared to 1.3% in SEDP soum schools and 1.8% in control soum schools.
303. Schools also conduct specific fundraising initiatives to generate additional funding to be used on ICT. More control schools responded giving specific examples than IIREM or SEDP schools. However, they mostly use similar strategies. Among the most common are:
• Renting out the school sports hall
• Renting other school premises
• Offering specialized training in math and foreign languages
• Generating revenue from computer utilization and printing
77 Data directly derived from Bayankhongor ECD—as of September 2007.

101
304. One control school principal from a village school stated that all this, however, only generates an average of MNT45,000 per month ($38), which is hardly enough to buy one toner cartridge for their printer.
305. In 100% of the control schools, procurement decisions are made by the respective principals. This is only the case in 50% of IIREM schools, where teachers or the school steering committee makes those decisions. This is the same in two of our SEDP schools. One principal stated that if there is a specific budget line, then it is she who makes the decision. However, the governor of the soum is usually consulted to clarify availability of funds. Some schools wait specifically till the end of the year to see if there are savings available.
306. Summary. The data do not indicate a clear relationship between expenditures for equipment maintenance and servicing and group membership. Except for two IIREM schools, all participating schools make explicit budget allocations for this item. The IIREM aimag center school, being the largest, most affluent, and best equipped in the region, shows the largest expenditures on this item. In terms of percentage of the annual school budget, the control school in the aimag center spends the least, even less than any of the soum schools that make budget allocations. Among soum schools, SEDP schools spend most money on this item in absolute terms. At the same time, it is the control schools that allocate the highest percentage of their annual school budget. With information from only one IIREM soum school, however, results of data analysis are not fully conclusive.
307. In terms of decision making on procurement of new equipment, there are considerable differences between schools that took part in e-resources initiatives and schools that did not. In both IIREM and SEDP schools, the decision of ICT procurement is made jointly by school management and teachers and often on teachers’ initiative. In all control schools, procurement decisions rest with the school principal.
308. Discussion. The data suggest that most schools are planning ahead and make specific budget allocations for computer and equipment maintenance and servicing. In interviews with principals, finding the money for such services is certainly critical, and—especially for the smaller schools—often nearly impossible. At the same time it seems as if for many schools not only the budgetary constraints are a major challenge, but also access to qualified help to render the service. Soum schools most certainly do not have local human resources to help them in this regard. Aimag center schools may have more access to such support. The many computers not functioning in these schools would need further investigation in terms of the nature of the damage and therefore ways to prevent it.
10. Parent Engagement and ICT
309. Providing some background on general patterns of parents’ engagement with their children’s education, most students across all groups state that their parents come to school about once a month. There are few differences between study groups. Students also provide similar results when asked how often their parents observe some of their classes. Most students responded that their parents never come to observe a class; 21.9% of control school students, 19% of SEDP, and 32% of IIREM students, however, say that their parents do come at least a few times per year and observe one of their classes. Parents also have similar habits when reviewing their children’s’ homework. Most students say their parents do this at least three or four times per week. Parents of IIREM students review their students’ homework most often among the three groups. There are no significant differences to be found, however, in parent engagement concerning those specific questions between students of teachers who participated in e-resources initiatives and students of those who did not.

102
310. Principals were asked to what extent and how parents have been engaged with issues of ICT at their schools. According to 75% of the principals in IIREM schools, parents have neither requested, demanded, nor given any feedback on issues of ICT. However, the majority of principals of SEDP and control schools stated that they did (67% of SEDP and 75% of control school principals). In each group, one principal provided an answer as to what specifically parents’ feedback had been, and all of the principals state the same: Parents requested more computer time for their children and were demanding the school provide the informatics education dictated by curriculum standards. All of the control school principals are convinced that if parents were given the choice between the school buying either a musical instrument or a computer, parents would choose a computer. Among SEDP principals, only two out of three thought that the parents would choose the computer. Most notably, 75% of the IIREM principals think that their parents would prefer the school buying an instrument instead.
311. Discussion. It is interesting to see that priorities for IIREM parents, according to principal assessments, seem to revolve less around ICT than they do at SEDP and control schools. A possible explanation is that having seen their school participate in IIREM and this study over the past few years, parents feel that their children’s ICT needs are being fulfilled, and now are focusing on issues that, according to them, are not yet up to standard. Results from data analysis on student access (Section VIII.D.2, Reported Access to ICT), clearly indicate that the majority of IIREM students interviewed find access to ICT, most often in their school’s computer rooms. This is to a lesser extent true for SEDP students, but much less so for students in control schools, where more than 62% of responding control school student say that they never use a computer. Furthering discussion on this issues are also results on Research Question 2, presented in the section below.
E. Findings on Research Question 2 312. To answer Research Question 2, “Do e-resources address specific needs or challenges of rural/remote schools?,” targeted questions were integrated into the interviews with principals, training managers, and teachers. Questions were aimed at identifying what challenges to delivering high quality education schools face due to their geographic location in the country.
313. In interviews with study participants, some of the major challenges faced by schools were identified. Common among them are lack of electricity and general infrastructure; a lack of general information and news; a lack of sufficient books, training materials, and other resources to be used for teaching and learning; a lack of equipment; inadequate learning environments; and insufficient professional teachers and staff.
1. Findings from Questionnaires and Focus Groups
314. Lack of Electricity and Infrastructure. Most schools in the study are not connected to the centralized electricity system and are supplied with electricity from the soum through a diesel power generator. The electricity in soums is provided for an average of about 3 hours a day, mostly in the evening. Teachers, if they want to use computers or other electrical equipment, need to come to the school after hours, which is not promoting ICT use and self-study. Details on the electricity situation and on its impact on teacher access to technology were discussed in Section VIII.D.1, ICT Environment, above.
315. Apart from not being connected to the centralized electricity system, the soum schools are mostly located off the main road with just a dirt road leading up to the school and center. As noted earlier, the road between Ulaanbaatar and Bayankhongor aimag center, a distance of about 630 km, may take 10–12 hours to cover, due to major damage to the road. Most soums

103
are not reachable without a four-wheel-drive vehicle, and only in good weather. There are no roads, no signposts, and—especially in winter—few natural indicators for direction. Just a distance of 100 km, depending on the weather and ground conditions, may take 4–5 hours to cover. Exhibit 42, below, shows the “road” leading to Jinst; Exhibit 43 highlights problems that can stem from geographical isolation.
Exhibit 42. Road to Jinst
316. Lack of Information and Communication. The soum schools in the study are located at least 90 km from the aimag center. Newspapers and magazines reach the soum in small numbers, only one to two times a week through the regular postal service. Furthermore, due to the soums’ location and lack of electricity, there are few opportunities to watch TV for regular information and news. This is directly related to another critical challenge pointed out—lack of communication. Most soums have only one to two telecommuni-cations lines, which are used by all the people in soum center and herders nearby. In addition, because those lines run through air, they break easily under the extreme weather conditions in the countryside. It may take 5–10 days to repair. During that time, there is no communication between the soum and the outside world. Exhibit 44 is a picture of a soum telecommunications office.
Exhibit 43. Challenges of Isolation
“Isolation sustains poverty: services do not reach those who are remote; illiterates cannot read information of economic value, and find it difficult to obtain loans. Isolation goes with physical weakness: remote households may have a high level of migration of the able-bodied to towns or to other rural areas. Isolation also accentuates vulnerability—remote marginal areas are more liable to crop failures, and are less well provided with services to handle contingencies like famine or sickness; illiterates also find it harder to register or acquire land and are more easily cheated of it. And isolation means lack of contact with political leaders or with legal advice, and not knowing what the powerful are doing.”
Source: Chambers, Robert. 1983. Rural Development: Putting the Last First. London. Lagos. New York. Quoted in Oyuntuya Shagdarsuren. 2007. Tackling Isolation in Rural Mongolia: Use of Information and Communication Technologies in Agricultural Extension Services. The University of Reading. Geographical Paper No.181. February 2007. Reading.

104
Exhibit 44. Telecommunications Office in Buutsagaan
317. Lack of Teaching and Learning Materials. The schools complained about insufficient relevant books, textbooks, training materials, visual aids, and other resources necessary for education (for a detailed overview, see Section VIII.C.7, Teacher Use of Equipment and Materials). The teachers are required to prepare visual materials themselves and most need to pay for papers, pens, pencils, and other materials with their earnings or do without (details on this issue can be found in Section VIII.C.4, Teacher Lesson Planning and Material Production).
318. Large numbers of library books, science models, and such are not usable because they are damaged or outdated. In addition, schools have only a few computers, and in IIREM and SEDP schools only one laptop, one LCD projector, and one digital camera among 20–100 teachers. Teachers sign up and wait for days to be able to use the equipment. Computer rooms, for a variety of reasons (few working machines, electricity, hours of operation), are not really a valid alternative to use for subject matter teaching, lesson preparation, or professional development. Exhibit 45, below, provides a glimpse into the library of a soum school in Bayankhongor.
“Preparing my lessons using presentations allows me not only to share it with other teachers, but to re-use and manipulate it whenever I need to. I don’t need to start from scratch every time and I don’t have to worry about destroying a visual aid that may have cost me hours and many togrog to put together.” —Teacher, Baacagaan

105
Exhibit 45. Soum School Library
319. Inadequate Learning Environment. Schools do not have sufficient funds to repair tables and chairs, or to rehabilitate their school building, from their own annual school budget. Most of the budget of the school is spent on electricity, especially heating in the winter. Many schools are therefore in a rather desolate state. Exhibit 46, below, shows the hallway of one of the participating soum schools.
Exhibit 46. Soum School Hallway
320. The limited budget is also a challenge with regard to having sufficient professional teachers. Funds to cover expenses for petrol consumption are especially short. Prices for petrol have increased dramatically in recent years, and they are even higher the more remote the

106
location. Despite this very specific challenge of location, per-child allocations are exactly the same across the entire country, regardless of whether the school is in the capital city center or 5,000 km away.
321. Some teachers, principals, and training managers stated that schools lack important facilities, such as a sports hall, which especially in the grim Mongolian winters would provide an important venue for the school and community for physical education classes and other extra-curricular activities.
322. At the same time, many schools in the aimag center are overloaded and are providing education services to two or three times more students than they can host. “There are too many students studying in one classroom,” says one principal. With class size over the norm, there are few opportunities for extracurricular activities. Specifically, one principal mentioned that the school has an official capacity of 960 students with 100 students in the dorm; but currently the school has nearly 2,500 students on its roll and sometimes up to five to six times the number of students per class than they should have. With 40–45 students in one class, teachers have difficulties providing personalized and differentiated support to each child.
323. Insufficient Professional Staff and Teacher Capacity. The schools only recently started to have more young university graduates among their staff who are specialized in teaching their respective subjects. However, principals, especially in soum schools, mentioned a specific challenge in keeping specialized teachers at the schools. One principal saves a part of the school budget to support the tuition for one teacher who agrees to come back to serve the school upon graduation. At the same time, many of these young teachers don’t have much teaching experience, which raises some issues of education quality, according to principals. In addition, there is a general high migration trend from the soums to the aimag centers and from there to the capital city, which leads to an overall general shortage.
324. Several principals and training managers raised issues of insufficient or inappropriate pre-service teacher education, with teacher training students lacking any sort of practical methodological skills and experience upon graduation. Several of the study participants pointed out the need for new professional development standards in pre-service and in-service teacher training.
325. Principals and training managers in general feel that their staff members need more computer skills. This was especially apparent in control schools. There were several principals who also mentioned that their teachers lack skills to communicate well with students and parents, something that is currently not being addressed in pre- or in-service teacher training.
326. Lack of Community and Parent Engagement. Moreover, it was mentioned that the participation of parents in the education of children is declining. The soums are faced with high unemployment rates, and often a large percentage of the population lives below the poverty line. According to principals, the socio-economic conditions of the family contribute considerably to the attitude of the children. Many of the students live in rather unpleasant family conditions. Inappropriate study environments, stimulating neither interest nor exploration among students, further aggravate the situation. Principals mentioned issues with students’ motivation and interest in education, and said that schools, together with parents, have to find better ways to encourage student learning.
“Often, when the children come back after a weekend digging, they sleep in the class and don’t pay attention and complain about having to go to school, when they could be out there and earning a month’s salary of a teacher in one single day.” —Principal, Bumbugur
107
327. There are specific issues in the Bayankhongor aimag that foster this negative trend. Recently, in some of the soums of Bayankhongor, extensive deposits of gold were discovered, which affect living, working, and studying in the soum. Parents, teachers, children, and students work in mines over the weekend, during holidays, and vacation periods—and more and more also during school hours.78
2. Discussion of Findings
328. Lack of Electricity and Infrastructure/Lack of Information and Communication. Some of the communication and information access challenges contribute to the fact that it is very difficult for teachers and school managers from such soums to attend any in-service training programs, conferences, or other events. These challenges also limit the opportunity for regular professional exchange with peers. In most soum schools, there is only one teacher per subject. While this teacher may be able to draw on other teachers’ support for some areas, such as general methodological issues, possibilities of subject-specific didactical and pedagogic deliberations or peer-to-peer capacity building are extremely limited. This does not help to alleviate issues of teacher capacity, especially in areas of methodological skills. Internet access, repeatedly requested by teachers and school managers in the study, would alleviate some of these issues; however, it is not yet available in most of the soums. Practices established under IIREM, where teachers would develop e-mails offline, and then every 2–3 weeks connect the laptop to the Internet in the aimag center, have, as study findings show, made a difference. While not regularly or on a daily basis, the IIREM teacher e-mail network alleviated some of the isolation soum teachers are experiencing, and increased opportunities for professional exchange and peer-to-peer capacity building.
329. Lack of Teaching and Learning Materials. The lack of materials and resources for teaching was key among the challenges raised by school principals, training managers, and teachers. For teachers, additionally, the cost of the raw materials to develop teaching and learning aids is a barrier to engage in this more often than necessary, and seems to lead to a limited use of visual aids and teaching and learning materials other than teacher guides and textbooks in classrooms (see Section VIII.C.7, Teacher Use of Equipment and Materials, for more details). In this environment, the CD ROMs provided to teachers, including graphics, pictures, texts, and myriad other resources, have shown to be of significant value. Comple-mented by the ability to take pictures and video clips with the digital camera, participating teachers have capitalized on this and engaged in preparing their own electronic teaching and learning materials, and sharing them. This did not require any financial investment, other than time, but greatly enhanced their information sources and classroom teaching practice.
330. Inadequate Learning Environment. It is questionable if e-resources initiatives can have much impact on the overall learning environment, unless accompanied by structural changes. Under IIREM, one room in each school was rehabilitated and equipped with tables, chairs, bookshelves, and other items in order to provide an adequate environment. In some IIREM schools, these rooms now function as the teachers’ room, in others as a classroom, and yet in others as the computer lab. Given the equipment package, even small structural improvements such as these may be required to protect equipment and ensure its operation. The many broken computers in basically all of the participating schools are one indication that this had not been the case, especially under SEDP. Classrooms are not secured, electricity outlets are faulty, and there are challenges with generator performance—all of which lead to 78 At the time the study team was collecting data, it was sometimes difficult to encounter teachers still at the school.
Several had left prematurely to work in the gold mines. The same was happening with several of the students interviewed, who were on their way to join their parents in digging for gold.

108
equipment damage. In many schools, sand and dust are an additional problem, especially in soums located in the south of Bayankhongor, at the northern Gobi Desert. While initiatives as such don’t address some of the challenges schools are facing, appropriately designed e-resources initiatives need to include some basic rehabilitation, if only for the sake of equipment and project sustainability.
331. Insufficient Professional Staff and Teacher Capacity. As mentioned above, the opportunity for professional exchange with peers, facilitated through e-mail networking, and augmented through the possibility to share teaching and learning resources, has had an effect on teachers’ methodological skills and subject matter knowledge, according to interviews with teachers and training managers. In addition, appropriately designed e-resources initiatives, following the example the study has set, focus on teachers’ didactic and pedagogical capacity, rather than their computer skills. Study outcomes so far do not, however, indicate that any profound changes in teaching practice have taken place, as measured through the instruments applied. However, it is clear that investment in appropriate training in effective ICT integration will also strengthen those very skills. There is anecdotal evidence from training managers and teachers that supports this argument. Longitudinal studies, suggested for future research (see Chapter IX, Study Conclusions and Recommendations, below), may shed further light on this issue.
332. Lack of Community and Parent Engagement. As in other whole school reform approaches—and ICT integration certainly counts as a similar change—community and parent engagement are critical for success, and as current knowledge about education indicates, a key dimension in education quality. E-resources initiatives, therefore, if properly designed, should take this into account and explore ways to engage parents and communities in support of schools’ development objectives. Neither under IIREM nor under this study were extensive efforts made to include the community, beyond holding informational meetings at the outset of the IIREM project. As study results indicate (see Section VIII.D.10, Parent Engagement and ICT), parents of IIREM school students are much less concerned about ICT than their SEDP and control school counterparts. Focus group discussions with parents, however, indicate that across all three groups, parents are concerned about their children’s schools’ capacity to appropriately equip their students with informatics skills. According to those parents, such skills are critical in the “21st century” and in “modern society,” and they don’t want their children to lag behind.
333. Student Motivation. According to participating principals, student motivation and engagement are a challenge for schools, especially in the absence of appropriate and stimulating learning environments. The dire situation not only in the schools, but also in the dorms, seems to contribute to students’ disengagement in their own learning. Focus groups with students clearly showed that students are very excited about their teachers’ use of ICT in classrooms and about having the chance to access technology themselves. For many, computers and especially computer games open a new door into a world hitherto unknown. Teachers, in focus groups and discussion, were unanimous in their affirmation that using technology in the classroom increases student motivation.

109
IX. STUDY CONCLUSIONS AND RECOMMENDATIONS
334. This study set out to answer two research questions:
(1) Are there differences to be noted on indicators of teaching quality in schools that featured an e-resource initiative compared to schools that did not?
(2) Do e-resources address specific needs or challenges of rural/remote schools?
335. Conclusions to the research questions are provided below, along with an overview of the key findings of each research question. Findings on Research Question 1 are complemented by an overview of selected ICT-related dimensions under investigation. This chapter also provides recommendations for future research and selected recommendations for future ICT in education initiatives in Mongolia, as well as a synthesis of the applicability of the findings in other contexts and a synthesis of the new knowledge this study added to what previously had been investigated.
A. Conclusions Related to Research Question 1 336. To answer Research Question 1, focusing on the teacher as the unit of assessment, some general dimensions of teaching quality were explored:
• Teacher pedagogical support
• Teaching practice and evaluation/assessment
• Teacher efficacy
• Teacher lesson planning and material production
• Teacher collaboration
• Teacher job satisfaction and attendance
• Teacher access and use of equipment and materials
337. The study found that on some of the dimensions under investigation, there are indeed significant differences in indicators of teaching quality in schools that participated in e-resource initiatives compared to schools that did not. Such differences can be seen in areas of teacher material production, teacher collaboration, teacher job satisfaction, and teacher use of equipment and materials. In other dimensions, such as teacher pedagogical support, teaching practice, evaluation/assessment, efficacy, and lesson planning, there are no significant differences to be seen. Even within those dimensions, however, there are selected aspects where differences are noteworthy, such as teachers’ capacity to use a variety of assessment techniques, or collaboration with teachers on teaching and learning preparation, or training managers’ assessment of their teachers’ attendance. In all of these aspects, teachers in schools that participated in the e-resource initiatives under investigation show a more positive rating. The information below is an overview of some of the key findings in areas where significant differences were found.
• Classroom observations take place more often in schools that participated in e-resources initiatives than in schools that did not.

110
• Teachers in schools that participated in e-resources initiatives are more satisfied with the procedures for teacher performance evaluation than teachers in schools that did not.
• Teachers in schools that participated in e-resources initiatives use visual aids more often in their teaching than teachers in schools that did not.
• Teachers in schools that participated in e-resources initiatives spend considerably less money on materials to produce teaching and learning aids than their peers in schools that did not participate in such initiatives.
• Teachers in schools that participated in e-resources initiatives are significantly more capable of preparing electronic teaching and learning aids than those in schools that did not.
• Teachers in schools that participated in e-resources initiatives spend more time working with each other on education-related issues than those in schools that did not.
• Teachers in schools that participated in e-resources initiatives exchange teaching and learning materials more often with their peers than those in schools that did not.
• Teachers in schools that participated in e-resources initiatives are more likely to engage in collaboration and exchange with teachers in other schools than those in schools that did not.
• Teachers in schools that participated in e-resources initiatives are more satisfied with their jobs compared to teachers in schools that did not.
• Teachers in schools that participated in e-resources initiatives make use more often of a variety of equipment and materials in their teaching (library books, cassette recorders, science models, TV, computers, and educational software) than teachers in schools that did not.
• On the basis of training managers’ and student’s responses, teacher attendance is better in schools that participated in e-resources initiatives, compared to schools that did not.
338. Below is an overview of some of the key findings in areas where no significant differences were found.
• There are no significant differences in overall teaching practice between teachers in schools that participated in e-resources initiatives and those in schools that did not.
• There are no significant differences in practices of student evaluation and assessment between teachers in schools that participated in e-resources initiatives and those in schools that did not.
• There are no significant differences in areas of teacher efficacy (teachers’ ability to control/address certain situations and difficulties in their classrooms) between teachers from schools that participated in e-resources initiatives and those in schools that did not.

111
339. As a cross-cutting finding, spanning teaching quality and ICT-related dimensions, there were no significant differences on any of the dimensions under investigation between the two implementation groups—that is, IIREM and SEDP schools—in the study. In drawing conclusions regarding Research Question 1, therefore, study findings indicate that there are indeed differences to be noted on dimensions of teaching quality between schools that participated in e-resources initiatives and schools that did not. On some dimensions, teachers from schools that participated in e-resources initiatives show more positive results than their peers. This is the case specifically for teacher collaboration, teacher job satisfaction and teacher use of equipment and material. On other dimensions, no significant differences could be found. These dimensions include teaching practice, teacher efficacy, and teacher attendance. However, on none of the dimensions did teachers from control schools show significantly more positive results. Our research suggests, therefore, that the e-resources initiatives under investigation have had a positive effect on teaching quality, as assessed by this study.
B. Overview of ICT-Related Aspects 340. In addition, a number of ICT-specific dimensions were researched, not only for teachers, but also for students, training managers, principals, and the school as a whole. These dimensions were:
• ICT environment
• Access to ICT
• Purpose of computer use
• Policies and strategies at the school
• Resources and guidance on ICT
• Attitude toward ICT
• Teachers’ levels of technology adoption
• School system support
• School financing, servicing, and procurement
• Parent engagement and ICT
341. Across dimensions, data were mostly analyzed to provide contextual information more in the form of case studies, rather than comparisons among schools. The information gathered contributes to increased knowledge about critical aspects of ICT integration in rural schools in Mongolia and provides a situational insight into school stakeholders’ access to ICT, purpose of ICT use, and attitudes. It also provides a view on critical school-level and system-level aspects and linkages, including issues of ICT financing and procurement as well as education system support and parent engagement.
342. Key findings from participating schools in this area are the following:

112
• Lack of a reliable electrical current during school hours is a key barrier to teachers’ use of technology for their own professional development and for enhancing student learning in soum schools. Laptops provided critical alternatives in this regard.
• Aimag center schools are considerably better equipped than their soum school counterparts. All these schools have at least 18 computers, a laptop, a copy machine, and an overhead projector.
• SEDP soum schools have on average the most computers; however, control schools in soums have on average more functioning computers than their SEDP and IIREM counterparts.
• The majority of control school teachers don’t use a computer at all, IIREM teachers mostly use the school laptop, and SEDP teachers use both the school laptop and the computers in the computer lab. Most principals have a computer in their office.
• Generally, the majority of IIREM and SEDP students make use of computers in the computer lab, whereas the majority of control school student interviewed have never used a computer.
• Teachers mostly use a computer for student and class administration and lesson planning.
• Students’ computer use is mostly related to their informatics classes; some selected students also prepare homework or play games.
• All IIREM and SEDP schools have guiding policies on teacher ICT competencies, compared to none of the control schools.
• All schools provide some form of incentive or support for teachers to innovate and use ICT in their teaching practice. While control schools tend to provide access to electricity and computer, SEDP and IIREM schools offer more personalized and targeted schemes, such as salary increases and scholarship nominations.
• Nearly all IIREM and SEDP training managers feel confident about providing methodological feedback to their teachers in this area. This is significantly different from their peers from control schools, who don’t share that same confidence.
• There were no significant differences in attitude toward ICT among teachers from the three groups.
• Training managers and principals in control schools expressed a more positive attitude toward ICT than their peers in IIREM and SEDP schools.
• Students in IIREM and SEDP schools not only have more access, but also have a more positive attitude toward ICT than their peers in control schools.
• IIREM teachers rate their level of technology adoption higher than SEDP teachers. Most of the responding control school teachers judge that they have not yet reached beyond level one (of six) — Awareness.

113
• The education system at large, specifically the Education and Culture Department provides some support on ICT integration to schools. According to schools, this is mostly in form of professional development for school management and staff, and less on organizational or pedagogical ICT integration or budget decision-making.
343. Study findings in these dimensions indicate that there are a number of drivers and barriers to effective ICT integration into teaching and learning. These can be found at the teacher and school levels, but also at the system level. Exhibit 47 below outlines some of the drivers and barriers that were directly identified via study findings.
Exhibit 47. Drivers and Barriers to Effective ICT Integration into Teaching and Learning
Teacher Level Drivers Barriers Motivation to change and learn Aversion to change Advanced methodological skills Lack of encouragement for innovation Ability to translate theoretical instructional models into active student-centered teaching practices Lack of methodological skills Encouragement and support for innovation by school management Lack of basic computer skills
Basic computer skills
Lack of clarity and information on potential of ICT for personal productivity and to enhance teaching and learning
Positive attitude to ICT
Lack of appropriate professional development programs that take teachers' existing skills and experiences into account
Confidence to use technology in didactically appropriate ways Ongoing access to resources, guidance and models for appropriate instructional ICT integration Capacity to develop locally appropriate content Flexibility in the allocation of some curriculum hours and topics Ongoing pedagogical support from colleagues and school management Alignment of student assessment, instructional practice, and teacher evaluation Incentives for professional development and innovation Integrated, ongoing professional development Pedagogical leadership and follow-up on ICT integration by school management (e.g., via classroom observations and in-school professional development)
School Level Drivers Barriers Electricity during school hours Lack of electricity Access to equipment appropriate for educational objectives Absence and poor quality of ICT infrastructure

114
Exhibit 47 (continued). Drivers and Barriers to Effective ICT Integration into Teaching and Learning
School Level Functioning equipment Limited access to ICT equipment Availability of locally appropriate content, suitable and easy to integrate with curriculum and instructional practice
ICT infrastructure not aligned with educational objectives (e.g., only computer labs, and no computers in classrooms or mobile units)
Policies on teacher ICT competencies and strategies/planning for professional development and their follow-up Lack of Internet connection Incentive structures for teacher innovation and engagement that align with policies and teacher evaluation practices Lack of change management capacity School management with experience in whole school reform
Lack of integration of ICT with school development strategies
School management with ability to carry out strategic planning and financial management
Lack of appropriate solutions for equipment maintenance and servicing
Participatory planning and decision making regarding ICT High teacher-student ratios
Explicit use of ICT to achieve school development goals (organizational and financial integration)
Lack of information and communication to parents and the community about role of ICT in achieving educational objectives
Opportunities for regular collaboration among teachers
No ICT champions—or only one or two—or resource persons at school to promote ICT integration and innovation
Opportunities for exchange with other schools A critical mass of champion teachers who promote ICT integration and lead exploration of innovative practices
System Level Drivers Barriers Flexible elements in formal education system (e.g. in regard to some portion of the curriculum hours) Rigid curriculum structures Alignment of ICT in education policies with national education development strategies (on all levels) Rigid student assessment structures Ownership and awareness by regional/national government agencies (e.g., ECD) Rigid teacher evaluation approaches Consultations and forums for teachers and school managers on regional level Rigid school budget structures Certain flexibilities in regard to utilization of school budgets and funds
Uniform, per-capita funding structures for schools, without adjustments for rural locations
System level support, starting at the school level, via regional government and to national level
Lack of clarity on role of ICT to achieve educational objectives
Well-documented pilot experiences that provide the anchor for future initiatives Information-based decision making regarding role of ICT in education

115
C. Conclusions Related to Research Question 2 344. Concerning Research Question 2, “Do e-resources address specific needs or challenges of rural/remote schools?,” participating schools raised a number of challenges, many of which directly related to their remote location. Challenges raised were mainly:
• Lack of electricity and appropriate infrastructure
• Lack of information and communication
• Lack of teaching and learning materials
• Inadequate learning environment
• Insufficient numbers of professionally trained staff and limits on teachers’ capacity
• Lack of community and parent engagement
345. Study findings show that e-resources can positively affect a number of these challenges, most notably the lack of information, lack of teaching and learning materials, and insufficient teacher skills and knowledge. The value of e-resources, just in the form of providing schools with electronic teaching and learning aids and educational software, however, can be dramatically increased, when provision of such materials is accompanied by (i) opportunities for familiarization with the resources, (ii) training on use of a computer to make them work, (iii) access to appropriate equipment for their use, and (iv) models of e-resource integration with instructional practice. As was clearly the case with the control schools in the study, without such accompanying elements, the resources are not being used as tools for teaching and learning in the classroom, nor as tools for self-study and professional development. Embedded in systemic and holistic initiatives, however, such as those under investigation in this study, e-resources have the potential to address a variety of challenges that remote rural schools in Mongolia face. These include aspects of teacher skills and knowledge, the learning environment, and student motivation.
346. Findings and conclusions to both research questions considered together, coupled with the lack of any significant differences between the IIREM and SEDP groups in the study on any of the indicators investigated, indicate that the design and implementation of the activities under this study have been effective in bringing about positive change on teaching quality. Building on lessons learned under IIREM, and the momentum this project had created, the combination of equipment package, professional development, and education system support has shown to be successful. The equipment package provided, modeled on IIREM, was moderate: one laptop, one LCD projector, and one digital camera per school. The professional development program was integrated and phased, and while building basic computer skills, focused on the pedagogic integration of ICT into classroom teaching. The professional development approach featured direct training of a number of champion teachers at the school level, who then acted as multipliers (or school-based training units) for their peers. Professional development was both organized as intensive off-site activities and blended with regional and school-based interventions. Including the training managers, the pedagogical leaders at the school level, and representatives of the ECD in all activities also was shown to be critical. Capacity building for these actors focused on the organizational integration of ICT into school management and pedagogical leadership and support, and thereby complemented investments at the teacher level.

116
D. Recommendations for Future Research 347. Given the small sample size and the fact that some of the issues under investigation were explored for the first time in such a framework, future research should focus on the following:
• Conducting longitudinal research that would shed light on the impact of the ICT initiatives under investigation on student achievement.
• Complementing indicative findings on teaching quality of this study with data from standardized regional- and state-level teacher assessments and school-level performance evaluations.
• Conducting in-depth classroom observations to identify and document advanced models of ICT integration. Findings should then be integrated into the design of locally appropriate professional development programs.
• Complementing the dimensions in this study with further aspects hitherto not considered, such as:
− Specific personnel dynamics in schools that may influence teachers’ attitudes and practices
− Informal encouragement mechanisms and support practices of school management to encourage innovation
− Role of actors such as the community and local government to foster innovation at schools
− Aspects of ECD capacity to support school’s reform process
• Investigating in more detail a possible correlation between ICT maturity of a school and its teachers with increased access to ICT by students, without any activities, such as training, having directly targeted this group.
E. Recommendations for Future ICT in Education Initiatives 348. The study raised a number of recommendations for future activities, either directly derived from responses study participants, or deduced from study findings and outcomes. A few are highlighted below.
• Any new efforts should build on the momentum that pilot initiatives such as IIREM have generated, in framing ICT integration as a discussion about educational development objectives with specific pedagogic goals rather than as a discussion about technology.
• Basic computer skills are critical to familiarize teachers with the technology to the extent that they are comfortable with it, a precondition for ICT use in classroom teaching and other purposes. However, integrating computer skills training from the outset with explicit models for ICT use in teaching and learning seems to be more appropriate than isolating computer skills training from teachers’ daily needs and practices. Professional development under future initiatives, as well as in formal pre-

117
service and in-service training programs, needs to focus more deeply on the relationships among pedagogy, curriculum, and technology.
• For integration of ICT and instructional practices, appropriate models and samples to learn from are necessary. Thus, it is recommended to conduct classroom observations and teaching simulations and to document teaching practice with ICT. This can help teachers translate innovative ideas into (instructional) practice and speed up effective technology adoption.
• Future initiatives need to acknowledge and strengthen the role of training managers as pedagogical leaders at their schools. Training managers need to have the capacity to function as role models for their teachers and as trainers on ICT integration, but also have the capacity to link elements of student assessment, instructional practice, and teacher evaluation.
• Future initiatives also need to acknowledge and strengthen the role of the ECDs as support and reference units within the education system. Similar to training managers, ECD staff, especially methodologists, should receive more support and professional development so they can assist training managers and teachers in linking pedagogy, curriculum, and technology.
• Existing policies for teacher pre- and in-service training should be reviewed to better meet the growing needs and demands for this type of instruction.
• Student assessment and teacher evaluation approaches need to be reviewed to capture issues of ICT integration. Broader definitions of student achievement, beyond grade and results on standardized student assessments, are needed to fully capture the impact ICT may have on areas such as life skills, student creativity, and higher-order skills.
• Future initiatives may build on the positive experiences with the mentor school model made under IIREM. Such an approach can alleviate some of the challenges rural schools face, such as having no access to the Internet and lacking information and teaching and learning materials overall. Mentor schools in which some of those environmental factors and school-level barriers (such as lack of electricity and Internet) are not as apparent should also be better positioned to explore innovative and new instructional practices, integrate ICT, and provide their peers in the more remote schools with ideas, examples, and lessons learned. This way, collaborative capacity building can take place.
• Future initiatives should learn from and promote equipment packages such as the one provided under IIREM (a package consisting of one laptop, one LCD projector, and one digital camera) that have proven to affect teaching quality.
• It is recommended to provide schools with regular networking opportunities around ICT in education issues, so that teachers in remote schools have opportunities to share knowledge and skills with other schools—another means to further teacher capacity. At the same time, such exchange among school management is equally critical to share ideas and strategies for organizational integration.

118
• More appropriate solutions for hardware maintenance and servicing have to be found, especially in soum schools. An increased focus on TVET in upcoming education reform approaches, such as under the Third Education Development Project; and the proposed activities under the Millennium Challenge Corporation,79 may provide an opportunity for public-public partnership.
• A specific recommendation is to strengthen investments already made and to maximize existing capacity in IIREM schools and the SEDP schools that participated in this study. It would be critical to provide these schools with one or two more laptop computers each to increase access to appropriate technologies for teachers, so that use of ICT in teaching and learning can take place more frequently. This would allow these schools to continue being frontrunners in innovating teaching practice with ICT.80
• It is recommended to establish a national-level ICT in education portal, where teachers can upload their own e-materials for exchanging with others and download necessary e-resources and tools for their own use.
F. Synthesis 349. As a synthesis, findings, accompanying discussions, and recommendations from this investigation in Mongolia, and the specific e-resources initiatives under investigation (especially IIREM), may be very relevant to other countries not only in the region, but in similar geographic, economic, demographic, and social circumstances. The extreme geographic profile of Mongolia, featuring a small population distributed across a large landmass, with large distances between rural schools, requires special considerations in the design and implementation of ICT initiatives. Under IIREM, the alignment of the equipment package with specific education development objectives, project aims, and the content and focus of the professional development program has been critical to the success of this project.81 The experiences in terms of the equipment package—tailored for low-tech, low-electricity environments—are certainly worth consideration. Furthermore, the phased professional development approach featuring a combined mentor school and mentor teacher model, coupled with direct school-level support, may be appropriate for similar contexts where schools and teachers are often isolated from regular and ongoing professional collaboration and exchange. The focus of the professional development program, highlighting skills in the production of teaching and learning materials, may be critical for other countries where language and script barriers make the majority of internationally available education resources unusable for rural teachers. Furthermore, the experience of IIREM to couple provision of e-resources with capacity building 79 Millennium Challenge Corporation (MCC). 2007. Mongolia and Millennium Challenge Corporation. Building a
Dynamic Partnership for Poverty Reduction Through Economic Growth. Washington DC. 2: “The Government of Mongolia wants to develop a vocational education system that serves the demands of a modern, private-sector led economy. By building on the work of other donors such as the Asian Development Bank, the MCC Vocational Education Project will help Mongolia build up the institutional framework needed to support a demand-driven vocational education system. Through greater labor productivity and strengthening of training systems, the Compact is designed to increase employment and income among unemployed and marginally-employed Mongolians. The goal is to secure private-sector participation, establish skills standards and a competency-based qualification training system, among other things. Additionally, the Compact will develop new curricula for career training and 30 new career preparation tracks, as well as new build capacity for career guidance.”
80 As mentioned earlier, data indicate that the frequency of use of computer in the classroom is restricted mostly by the availability of the laptops, with one per school being shared by at least some 9–10 teachers, rather than teacher motivation. As international studies indicate, “...pupils and teachers who use ICT the most are also the ones who experience the greatest impact (for example, see page 9 of footnote 47).
81 For a more detailed discussion on this issues and illustrating a situation where such alignment was lacking, consult Appendix 9 of the RETA Final Report, the Samoa Country Report.
119
and entrepreneurship among local software companies, is very interesting in markets where localization and local capacity building are a necessity due to their isolation, either geographically or socially (e.g., due to language issues).
350. Numerous case studies, project reports, and research initiatives have been prepared addressing various initiatives and programs around ICT in education. This report drew on some of these worldwide examples, including studies and research done in the United States and in Europe, to inform discussions on specific aspects of this study (for a more detailed overview of these studies and publications, refer to Appendix 2, Literature Review on ICT in Education in Mongolia). Over the past few years, a number of investigations have been carried out, both in the region and in Mongolia itself. Such investigations have taken place at the national level and at the school level. They mostly have focused on the general situation and constraints to the effective use of ICT in education, on issues surrounding the informatics curriculum, or on the current status of the ICT infrastructure in schools. In 2003, a regional UNESO research effort found that “There is a need for a thorough policy approach that addresses issues such as the choice of operating systems, the development of software and training materials, staff training and the way that ICT is applied in education” (from page 115 of footnote 13). As this study shows, 4 years later, Mongolia has made great strides in terms of formulating policy and aligning initiatives and activities with an overarching vision for ICT in education. At the same time, practical models—especially in terms of appropriate professional development programs for subject-matter teachers who effectively link pedagogy with curriculum and technology, as well as instruction on how ICT is applied in instruction—are still lacking.
351. In regard to hardware and software, another study conducted in 2003 in 38 Mongolian schools across the country found that there are on average seven computers per rural school in the country and about 12 computers per school in the capital city.82 Compared to findings from this study, the ICT infrastructure situation of rural schools has not improved very much. While there may be more computers available (there were on average 11 computers in the participating soum schools), a large number of them are not functioning (only about eight computers on average were functioning in participating soum schools), and therefore have no educational value. At the same time, a survey83 commissioned under SEDP in 2005 found a strong drive by rural educators to make use of ICT, as findings from this study also confirmed, and showed that most school principals in participating schools not only use a computer, but also have in general a very positive attitude toward ICT (for more detail consult Section VIII.D, ICT-Related Dimensions). Monitoring and evaluation reports from the IIREM project provided insights into project impact, drawing on interviews and surveys from both IIREM and control schools. Some key findings include an increase in areas of teacher computer skills, teacher confidence, teacher collaboration, teacher use of computers in the classroom, and teacher job satisfaction (see pages 13–14 of footnote 37). The IIREM monitoring and evaluation approach had been very project focused and qualitative in nature. One task under this study, therefore, was to see whether some of these indicative findings would hold in a more systematic and rigorous assessment carried out a year after the IIREM project had concluded. As the findings of this report show, they do.
352. As can be seen from the elaborations above, while there had been efforts and studies in the region and in the country to identify the lessons learned on ICT in education, no systematic approach to cataloging drivers of effective ICT integration in classroom teaching had been done
82 Batjargal, A. et al. 2003. General Education and Information Technology Survey Report. Ulaanbaatar. 3. 83 Bolormaa, D. 2005. ICT Education Content Development – School Management Progress Reports #2–#4.
Consultant Report. Second Education Development Program. ADB MON-1908. Ulaanbaatar.
120
to date. Furthermore, the study is unique in that it coupled indicators of teaching quality with ICT-related indicators in addition to contextual aspects. This was to highlight the myriad factors that play a role in the effectiveness of ICT in education initiatives. In this sense, the study provided a very comprehensive contextual perspective to ICT integration and its relation to education quality than formerly available, specifically for Mongolia. In addition, this study did not only rely on responses from one group of stakeholders, but triangulated results and perceived outcomes from teachers with responses from students, pedagogical leaders, and school principals. Focus groups, also including parents, provided further contextual details. Finally, with an objective not only to analyze the current situation, but also to highlight approaches to ICT integration and lessons learned that impact teaching and learning, this study also provided insights into pedagogic deliberations, a perspective hitherto limited in previous publications.

121
X. REFERENCES
Asian Development Bank (ADB). 2002. Report and Recommendation of the President to the Board of Directors on a Proposed Loan to Mongolia for the Second Education Development Project. ADB RRP: MON 31231. Manila.
ADB. 2004. Grant Assistance to Mongolia for Information and Communication Technology (ICT) for Innovating Rural Education. ADB JFICT: MON 36245. Manila.
ADB. 2006. Loan Agreement Between Mongolia and the Asian Development Bank. LAS:MON 34187. Manila.
ADB. 2006. Country Strategy and Program Update. Mongolia. Manila. Available: http://www.adb.org/Documents/CSPs/MON/2006/csp-mon-update-2006.pdf
ADB. 2007. Key Indicators 2007. Manila.
Ariunaa, Lkhagvasuren et al. 2006. Information and Communications Technology Development in Mongolia – 2006. White paper. Unpublished draft.
Batjargal, A. et al. 2003. General Education and Information Technology Survey Report. Ulaanbaatar.
Bolormaa, D. 2005. ICT Education Content Development – School Management Progress Reports #2–#4. Consultant Report. Second Education Development Program. ADB MON-1908. Ulaanbaatar.
Chambers, Robert. 1983. Rural Development: Putting the Last First. London. Lagos. New York. Quoted in Oyuntuya Shagdarsuren. 2007. Tackling Isolation in Rural Mongolia: Use of Information and Communication Technologies in Agricultural Extension Services. The University of Reading. Geographical Paper No.181. February 2007. Reading.
Choijoovanchig, Lhaichin, Sambuu Uyanga and Mendee Dashnyam. 2007. The Informatics Olympiad in Mongolia. In Olympiads in Informatics. 2007. Vol. 1, 31–36. Institute of Mathematics and Informatics. Vilnius.
Christensen, Rhonda. 1998. Survey of Teachers’ Attitudes Toward Information Technology. TAT Ver 3.2a 1/98. Available: http://www.tcet.unt.edu/research/instrumt.htm
Christensen, Rhonda. 1997. Stages of Technology Adoption. Available: http://www.tcet.unt.edu/ research/survey/stages.htm
Edmunds, Julie A. and Nita J. Matzen. 2007. Technology as a Catalyst for Change: The Role of Professional Development. Journal of Research on Technology in Education. Vol. 39, Issue 4. 417–430.
European Union. 2007. Mongolia-European Community. Strategy Paper 2007-2013. Available: http://www.europa.eu/external_relations/mongolia/spmipa/sp_mongolia_en_23-02-2007.pdf
Enkhjargal, Sukhbaatar. 2003. Policy Research: ICT in Education, Culture and Science Sector of Mongolia. International Development Research Center (IDRC). Ulaanbaatar.
122
Enkhtuvshin, Ulziisaikhan. 2007. Deepening Education Reform, Improving Teachers’ Leadership. Speech: Minister of Education, Culture and Science. Ulaanbaatar. Available: http://www.mecs.pmis.gov.mn/images/anhdugaar%20zuvulguun/Minister%20s%20Speech05.02.pdf
European SchoolNet. 2006. The ICT Impact Report. A Review of Studies of ICT Impact on Schools in Europe. Brussels.
ICT for Innovating Rural Education in Mongolia (IIREM). 2006. ICT for Innovating Rural Education of Mongolia. Final Report and Policy Recommendations. ADB TA JFICT 9044. Ulaanbaatar.
Information for Development Program (infoDev). 2005. Monitoring and Evaluation of ICT in Education Projects: A Handbook for Developing Countries. Washington.
Kessel, van Nico et al. 2005. ICT Education Monitor: Eight Years of ICT in Schools. Ministry of Education, Culture and Science, The Netherlands. In European Schoolnet. 2006. The ICT Impact Report: A Review of Studies of ICT Impact on Schools in Europe. Brussels.
Ministry of Education, Culture and Science (MECS). 2002. Education Law. Amended 2006. Available: http://www.mongoleducation.mn/modules.php?ss=4&id=3
Mira, N. 2005. ICT Education Content Development – Secondary School Subjects. Second Education Development Program. Consultant Report. ADB MON-1908.
Ministry of Education, Culture and Science (MECS). 2006. Statistical Report of Education, Culture and Science Sector for 2005 and 2005–2006 Academic Year. Ulaanbaatar.
MECS. 2006. Master Plan to Develop Education of Mongolia in 2006-2015. Ulaanbaatar. Mongolia.
MECS. 2006. Second Government of Mongolia – External Partners Technical Meeting. October 9-10, 2006. Ulaanbaatar. Mongolia. Statement. Available: http://site-resources.worldbank.org/MONGOLIAEXTN/Resources/E_Education_Draft_Action_plan_Englsih_by_GoM.pdf
MECS. 2007. Order No. 183 of 2007. June 5, 2007. Ulaanbaatar.
National Statistical Office (NSO). 2007. Statistics Year Book. Ulaanbaatar.
Pouezevara, Sarah and Binita Parajuli. 2007. Old Technology or New? A Study of Video Recording as an Innovative Method for Primary School Teacher Training in Rural Nepal. Nepal Country Report. RTI International. ADB TA6278-REG. Research Triangle Park.
Ramboll Management. 2006. E-Learning Nordic 2006 – Impact of ICT on Education. Copenhagen.
Strigel, Carmen, Ioana ChanMow, and Ruby Va’a. 2007. Provoking Change: Technology in Education Case Studies from Samoa. Samoa Country Report. RTI International. ADB TA6278-REG. Research Triangle Park.
United Nations Educational, Cultural and Scientific Organization (UNESCO). 2003. Meta-Survey on the Use of Technologies in Education. Bangkok.

123
UNESCO. 2004. Integrating ICTs into Education: Lessons Learned. Bangkok.
Underwood, Jean et al. 2006. Evaluation of the ICT Test Bed Project. Annual Report 2006. Available: http://www.evaluation.icttestbed.org.uk/ files/ict_test_bed_evaluation_2005.pdf
United Nations Development Programme (UNDP). 2006. Human Development Report 2006. Available: http://hdr.undp.org/hdr2006/ statistics
Uyanga, Sambuu. 2005. The Usage of ICT for Secondary Education in Mongolia. In International Journal of Education and Development Using ICT. 2005. Vol. 1, No. 4.
Watson, Julian. 2007. From Policy to Pupil: How Governments Encourage ICT in Education. Regional ICT Policy and Strategy Report. RTI International. ADB TA6278-REG. Research Triangle Park.

124
XI. AUTHORS
353. Carmen Strigel was the RTI International Study Director, and the study E-Resources Specialist for Samoa and Mongolia. Ms. Strigel is Team Leader for Information and Communication Technology in Education and Training in RTI’s International Development Group. Her work strengthens efforts in areas such as education, governance, policy making, stakeholder collaboration, and capacity building by leveraging the potential of ICT. In the area of ICT in education and training, Ms. Strigel researches diverse fields of knowledge, such as content development, instructional design, methodology/pedagogy, cognition, organizational development, learning objects, and open source software, as well as issues of student achievement and poverty reduction. Ms. Strigel also leads several assessment and program evaluation efforts in the education sector. Formerly, she worked for the European Schoolnet in Brussels, where she implemented innovative ICT in education projects, involving students and teachers in more than 1,000 schools and 35 countries, addressing issues of ICT policy, capacity building, and content development.
354. Ms. Strigel is an Associate to the Rotary Center in International Studies in Peace and Conflict Resolution at Duke University and the University of North Carolina (UNC) at Chapel Hill, USA, and a member of the United Nations ICT Task Force. She holds a master’s in education from UNC, and a master’s certificate in Conflict Resolution from Duke University. She earned a bachelor’s degree in mediapedagogics and mediapsychology, with a focus on e-learning and e-teaching, from Weingarten University, Germany, and Växjö University, Sweden. She also holds a bachelor’s degree in education (secondary school teaching certificate) from Weingarten University, Germany.
355. Lkhagvasuren Ariunaa was the Evaluation Specialist for this study. Ms. Ariunaa is currently working as Chief Executive Officer for Intec Company, one of the leading information technology consulting companies in Mongolia. She has extensive experience working in the ICT sector for over 20 years and being involved in the development of ICT-related projects funded by UNDP, ADB, the World Bank, the United States Agency for International Development, the Government of India, and others. Ms. Ariunaa was Team Leader for the ADB-funded IIREM project. She has been author and coauthor of numerous articles and materials, published not only in Mongolia but also internationally, in the United States, Japan, and Thailand. She coauthored the Mongolia chapter of the UNESCO-funded Meta-Survey on Effective Use of ICT in Education of Mongolia; the report Mobilizing Poor and Marginalized Communities for E-Government Initiatives in Mongolia, funded by the United Nations Center for Regional Development; the Mongolia chapter for the Digital Review of Asia and Pacific for the IDRC, Canada; and the White Paper of ICT Development of Mongolia – 2006 for the Information and Communication Technology Authority, Government of Mongolia.
356. Ms. Ariunaa is a senior lecturer at the School of Mathematics and Computer Science of the National University of Mongolia. She has a joint MBA from Case Western Reserve University, USA, and the International Management Center, Hungary. She was one of the first scholars nominated by the Government of Mongolia to participate in capacity-building programs of the Australian government, and was awarded an Australian Agency for International Development scholarship to complete her master’s degree in business systems at Monash University, Australia.
357. Sukhbaatar Enkhjargal was the Curriculum and Materials Specialist for this study. He is currently the Executive Director of the Mongolian Information Development Association
125
Scheme, a local NGO with headquarters in Ulaanbaatar. Mr. Enkhjargal has extensive experience in ICT and education. He has been key consultant not only to this study, but also to the ADB-funded IIREM project and other ICT in education projects. Mr. Enkhjargal was involved in a series of studies funded by UNESCO, APDIP, IDRC, the World Information and Technology Services Alliance, the World Bank, ADB, and others, including the ICT Workforce Demand Study, the Meta-Survey on Effective Use of ICT in Education, and Promoting ICT for Human Development Realizing MDGs.
358. Mr. Enkhjargal has completed a master of arts in educational administration at Curtin University of Technology, Australia, and holds a postgraduate diploma in management from the Netherlands International Institute for Management, and a bachelor of science in information systems from Irkutsk Polytechnical Institute, Russia.

Appendix 1 126
APPENDIX 1: MONGOLIA’S PROGRESS TOWARD ACHIEVING THE MILLENNIUM DEVELOPMENT GOALS1
1 ADB. 2006. Country Strategy and Program Update. Mongolia. Manila. Available: http://www.adb.org/Documents/
CSPs/MON/2006/csp-mon-update-2006.pdf.

Appendix 127
Mongolia’s Progress Toward Achieving the Millennium Development Goals, continued
HIES = Household Income Expenditure Survey; LSMS = Living Standard Measurement Survey (LSMS).

Appendix 2 128
APPENDIX 2: LITERATURE REVIEW ON ICT IN EDUCATION IN MONGOLIA
359. Myriad case studies, project reports, and research initiatives have been conducted on various ICT in education initiatives and programs. The main text of this report drew on some of these worldwide examples, including studies and research done in the United States and in Europe, to inform discussions on specific aspects of this study in light of knowledge derived from other parts of the world. Over the past several years, a number of investigations have taken place both in the region and in Mongolia itself. These are relevant in positioning this study and highlighting its value in terms of its contributions to existing knowledge for the benefit of future activities in Mongolia and other countries that may share certain geographic, demographic, economic, or social characteristics that affect the feasibility, design, and impact of the use of ICT to further educational development objectives.
360. In 2003, the United Nations Educational, Scientific and Cultural Organization (UNESCO) in Bangkok conducted the “Meta-Survey on the Use of Technologies in Education in Asia and the Pacific 2003-2004.” This meta-survey is a snapshot of ICT in education in nearly 45 countries of the Asia and Pacific region. For each country, the report gives an overview of existing national polices, strategies, and programs; the current level of ICT use; and major initiatives taking place on using ICT for education. Each country chapter also includes an overview of the constraints and an analysis of the situation. For Mongolia, the report found a number of constraints to ICT use in Mongolia as of 2003 in areas of policy framework, infrastructure, human development and capacity-building, and content and learning materials. These include:1
• Policy. “There is a need for a thorough policy approach that addresses issues such as the choice of operating systems, the development of software and training materials, staff training and the way that ICT is applied in education.”
• Infrastructure. Connectivity constraints (mostly an issue of bandwidth), which are currently restricted to more urban areas, are coupled with hardware constraints, especially at the school level, and with affordability. According to the report, the “budget of secondary schools is limited for maintenance, troubleshooting, telecommunications and Internet connections, which affects maximum utilisation of hardware and software.”
• Human Development and Capacity Building. “There is a need for total revision of staffing in schools and development of pre- and inservice ICT training for all teachers and administration of schools because of low computer penetration, lack of professionally trained Informatics teachers in rural schools and households and lack of training materials and curriculum.”
• Content and Learning Materials. “The curriculum for prospective Informatics and non-Informatics teachers should be revised and include compulsory ICT training for all. The lack of off-line training, teaching materials and curriculum (CD-ROMs, DVDs, manuals, guides, etc.) has affected the computer knowledge and skills of secondary school graduates, and they are therefore penalised upon entering post-secondary institutions.”
1 Cited from UNESCO. 2003. Meta-Survey on the Use of Technologies in Education. Bangkok. 115.

Appendix 2 129
361. As can be seen from this study, 4 years later, the country has made great strides in some of these areas, especially in areas of policy formulation. The IIREM project and SEDP under investigation in this study also did much to address issues of infrastructure, human development and capacity building, and content and learning materials.
362. In 2003, an investigation was carried out of ICT in general education in Mongolia. In terms of existing infrastructure at schools, this research found that the “state-owned 518 rural schools own 2041 computers and there are 7 computers per school in average. There are 1059 computers in 95 state-owned general education schools operating in the capital city, which are 12 computers per school in an average.”2 At the same time, the report stated that “The majority of 102 general education schools connected to e-mailing system do not use it on regular basis since there is no budget to cover telecommunications fees.” The report concluded with a number of recommendations, including (from pages 38–43 of footnote 2):
• Generally, the number of the informatics’ teachers at secondary schools of Mongolia is not sufficient and the teaching experience is limited, which results in the poor quality of the teaching of informatics subject and the efficiency of teaching does not correspond to the requirements. Therefore, there is a need to increase number of enrolments for professional teachers on informatics subject and to improve supply of computer equipment.
• It’s required to advance the use of information and communications technology by introducing distance education tools, increasing the content of information exchange between teachers through connecting educational institutions to Internet and increasing use of electronic mailing system.
• Continue the efficient work of supplying secondary schools with computers and increase the number of computers with consideration of at least 1 computer for 25 students of grades VIII-X. Moreover, it’s required to supply schools with printers and copy machines and upgrade existing computers. It’s necessary to improve the use of existing computers.
• It’s required to implement activities to improve basic computer knowledge and self-learning capacities through organization of delivery of books, manuals, CDs, web pages and other training applications to the schools.
• The issue of establishing unified information environment for general education schools to use information technology applications in all levels of education and all activities of education institutions is not currently established fully, therefore, it’s important to develop a policy in this direction.
363. Under SEDP, a number of these recommendations were addressed, including computer and printer provision to schools, revision of the informatics curriculum, and small-scale in-service informatics teacher professional development. This change was also relevant to this study, as four of the SEDP schools were incorporated into the sample.
364. Furthermore, under SEDP, a survey was conducted in 2005 on ICT skills and provision of secondary school managers, followed by recommendations for policy changes and the development of training materials for using ICT in school management and administration. The
2 Batjargal, A. et al. 2003. General Education and Information Technology Survey Report. Ulaanbaatar. 3.
130 Appendix 2
survey included respondents from 27 secondary schools, as well as 16 education managers, from both Ulaanbaatar and the regions. Survey findings showed that “the great majority of school and education managers understand the ICT as an instrument to be used for school and education management and other administrative work. 83 percent of involved person assessed ICT as ‘very useful’ and 17 percent as ‘might be useful.’”3 Furthermore, 84% of the survey participants in 2004 had a computer in their office, and the majority had received some sort of training on basic computer skills (from pages 10–14 of footnote 3). The survey found a strong drive by rural educators to make use of ICT, which was confirmed by this study and shows that most school principals in participating schools not only use a computer, but also have in general a very positive attitude toward ICT (for more detail, consult Section VIII.D, ICT-Related Dimensions).
365. In addition, during 2004–2005, research under SEDP was conducted that investigated the possibility of incorporating ICT with teaching and learning at the secondary school level, on the basis of international experiences in this field. A list of international website addresses specifically focused on English instruction was identified. The report stressed the importance of embedding ICT into the subject-matter curriculum. It stated specifically, “In order to integrate ICT into the English education, English language teachers should be aware of using technology and it is needed to integrate the use of ICT embedded into the English language teaching curriculum.” The report continued, “As for other secondary school subjects, it is important that technology is also used as a teaching and learning tool. Therefore, the first step will be for teachers and students to acquire technology skills…. They have to look for the ways of integrating ICT into the specific subject curriculum.”4 As discussions on findings from this study highlight, the relationships among pedagogy, curriculum, and technology are critical, especially in teacher training. Because of the general lack of models and experience in this regard in the country, this issue will require further attention under any future initiatives (for more detail, consult Section VIII.D.7, Teachers’ Levels of Technology Adoption). An overview of the general inputs, including research conducted under SEDP, appears in Chapter IV, SEDP and IIREM Projects Overview.
366. A 2005 published paper on the usage of ICT for secondary education in Mongolia5 draws on some of these earlier bodies of knowledge, but also provides a comprehensive list of existing projects and initiatives in the sector. Elaborations here informed the study’s background research on existing ICT in education initiatives, presented in detail in Section III.D of this report. The paper also outlines a strengths, weaknesses, opportunities, and threats (SWOT) analysis on ICT in education in the country. The following are some of the weaknesses identified in 2005 (from pages 115–116 of footnote 5):
• Underdeveloped infrastructure in remote areas;
• Physiological barrier of teachers and managers;
• Weak English language;
3 Bolormaa, D. 2005. ICT Education Content Development – School Management Progress Reports #2–#4.
Consultant Report. Second Education Development Program ADB MON-1908. Ulaanbaatar. 6. 4 Mira, N. 2005. ICT Education Content Development: Secondary School Subjects. Second Education Development
Program. Consultant Report. ADB MON-1908. Ulaanbaatar. 8. 5 Uyanga, S. 2005. The Usage of ICT for Secondary Education in Mongolia. In International Journal of Education
and Development Using ICT. 2005. Vol. 1, No. 4.
Appendix 2 131
• No theoretical or methodological research on teaching ICT in primary school and integrating into other subjects;
• No universal standard for computer software and hardware specifications;
• No mechanism to repair and maintain school computer;
• No penalties for using pirated copies of software.
367. As can be seen from findings of this study, presented in Chapter VIII, Mongolia is still facing the challenges of underdeveloped infrastructure in the remote areas. There still is a lack of functioning computers and appropriate (pedagogical) equipment, especially in rural schools. This is aggravated by a lack of appropriate computer servicing and maintenance models, as identified in 2005. The issues of physiological barriers mentioned in the 2005 investigation may still be prevalent but could not be confirmed on the basis of the findings from this study.
368. Finally, the IIREM Monitoring and Evaluation reports provide findings in regard to project outcomes and impact. In 2004, a baseline report was published. Selected findings from this report are interesting in regard to the findings of this study:6
• 70% of teachers participated in the research were competent users of a computer (from page 14 of footnote 6)
• Teachers were using computers mainly for preparing lesson plans, contents, exam papers, and tests (from page 14 of footnote 6)
• 62.6% of teachers said that computers are inaccessible because of insufficient number of computers and lack of electricity supply. Only 14.4% of them have unlimited access to computers (from page 15 of footnote 6)
• 34.7% of teachers believe that a “computer is a complicated thing to learn.” 34.7% of them could not use a computer because they had never been taught (from page 15 of footnote 6)
• 80% of teachers responded negatively to the question “Do you use a computer in a classroom?” (from page 18 of footnote 6)
369. Data from the IIREM baseline survey compared to findings from this study clearly indicate the change that has happened over the past few years, especially in regard to the use of computers in classroom and teachers’ attitudes to ICT. As findings from this study show, only about 43% of the teachers interviewed never use a computer in the classroom or don’t know how to use a computer. The data also show that none of the participating teachers believe that they may never learn how to use a computer. At the same time, the obstacles to using computers as a tool in subject matter teaching are still the same, including lack of sufficient number of computers and electricity supply. In light of the majority of participants in this study having participated in an e-resources initiative, it would be important, however, to conduct a similar situation analysis with a larger, random sample of teachers in the country.
6 IIREM. 2004. ICT for Innovating Rural Education in Mongolia Project. Report of Baseline Survey. ADB TA JFICT
9044 MON. Ulaanbaatar.